
Analysis of Mercury Content in Various Types of Tea (Camellia sinensis) and Yerba Mate (Ilex paraguariensis)


Abstract
:1. Introduction
2. Material and Methods
3. Results
4. Discussion
5. Conclusions
Author Contributions
Funding
Institutional Review Board Statement
Informed Consent Statement
Data Availability Statement
Acknowledgments
Conflicts of Interest
References
- Hoque, M.E.; Chowdhury, K.J.; Dutta, S.; Chowdhury, P.; Kumer, R.T.; Sanjoy, D.; Jarin, A. Status and productivity of tea estates of the Chattogram tea-valley, Bangladesh. Int. J. Biosci. 2021, 18, 251–260. [Google Scholar] [CrossRef]
- Hung-Yu, C.; Zih-Jie, S.; Chung-Hao, L.; Yu-Tsung, C.; Chih-Jen, C.; Lu, F.; Yi-Ching, Y.; Jin-Shang, W. Cumulative tea consumption is inversely associated with colorectal adenomas in adults: A cross-sectional study in a Taiwanese population. Cancer Epidemiol. 2021, 73, 101945. [Google Scholar]
- Heshmati, A.; Mehri, F.; Karami-Momtaz, J.; Mousavi Khaneghah, A. The concentration and health risk of potentially toxic elements in black and green tea—both bagged and loose-leaf. Qual. Assur. Saf. Crops Foods 2020, 12, 140–150. [Google Scholar] [CrossRef]
- Hać-Szymańczuk, E.; Fiziar, M.; Cegiełka, A.; Piwowarek, K.; Misiura, S. Porównanie jakości mikrobiologicznej herbat czarnych, zielonych i czerwonych, dostępnych na rynku warszawskim. Zeszyty Probl. Postęp Nauk Rol. 2017, 591, 33–42. [Google Scholar] [CrossRef]
- Li, X.; Zhu, X. Tea: Types, production, and trade. Encycl. Food Health 2016, 279–282. [Google Scholar] [CrossRef]
- Wierzejska, R. Wpływ picia herbaty na zdrowie-aktualny stan wiedzy. Przegl. Epidem. 2014, 68, 595–599. [Google Scholar]
- Kozirok, W.; Sitkiewicz, M. Postawy i zachowania konsumentów wobec herbat i herbatek. Handel Wewn. 2015, 2, 222–233. [Google Scholar]
- Rasheed, Z. Molecular evidences of health benefits of drinking black tea. Int. J. Health Sci. 2019, 13, 1–3. [Google Scholar]
- Pan, H.; Gao, Y.; Tu, Y. Mechanisms of body weight reduction by black tea polyphenols. Molecules 2016, 21, 1659. [Google Scholar] [CrossRef] [Green Version]
- Ping, D.Q. Tea in health and disease. Nutrients 2019, 11, 929. [Google Scholar] [CrossRef] [Green Version]
- Yadav, K.C.; Parajuli, A.; Khatri, B.B.; Shiwakot, L.D. Phytochemicals and quality of green and black teas from different clones of tea plant. J. Food Qual. 2020, 2020, 8874271. [Google Scholar] [CrossRef]
- Bhutia Pemba, H.; Sharangi, A.B.; Lepcha, R.; Tamang, D. Bioactive compounds and antioxidant properties of tea: Status, global research and potentialities. J. Tea Sci. Res. 2015, 5, 1–13. [Google Scholar]
- Smith, J.T. Green tea polyphenols in drug discovery—A success or failure? Expert Opin. Drug Discov. 2011, 6, 589–595. [Google Scholar] [CrossRef] [PubMed] [Green Version]
- Kałwa, K.; Wyrostek, J. Ocena zawartości związków biologicznie aktywnych w herbacie zielonej i czarnej. Inż. Przet. Spoż. 2018, 2, 15–21. [Google Scholar]
- Musial, C.; Kuban-Jankowska, A.; Gorska-Ponikowska, M. Beneficial properties of green tea catechins. Int. J. Mol. Sci. 2020, 21, 1744. [Google Scholar] [CrossRef] [Green Version]
- Prasanth, M.I.; Sivamaruthi, B.S.; Chaiyasut, C.; Tencomnao, T. A review of the role of green tea (Camellia sinensis) in antiphotoaging, stress resistance, neuroprotection, and autophagy. Nutrients 2019, 11, 474. [Google Scholar] [CrossRef] [Green Version]
- Revgaert, W.C. Green tea catechins: Their use in treating and preventing infectious. diseases. Biomed. Res. Int. 2018, 8, 9105261. [Google Scholar] [CrossRef]
- Li, M.; Duan, Y.; Wang, Y.; Chen, L.; Abdelrahim, M.E.A.; Jun, Y. Green tea intake effect on lipoprotein, liver enzymes, body mass index, and liver cancer: A meta-analysis. J. Food Nutr. Res. 2021, 9, 321–328. [Google Scholar] [CrossRef]
- Li, X.; Smid, S.D.; Lin, J.; Gong, Z.; Chen, S.; You, F.; Zhang, Y.; Hao, Z.; Lin, H.; Yu, X.; et al. Neuroprotective and anti-amyloid β effect and main chemical profiles of white tea: Comparison against green, oolong and black tea. Molecules 2019, 24, 1926. [Google Scholar] [CrossRef] [Green Version]
- Mitra, D.K.; Shah, P.M.; Shah, H.H.; Rodrigues, S.V.; Mehta, J. The antiplaque efficacy of white tea extract mouthrinse. J. Indian Soc. Periodontol. 2016, 20, 514–517. [Google Scholar] [CrossRef]
- Hilal, Y.; Engelhardt, U. Characterisation of white tea-comparison to green and black tea. J. Verbr. Lebensm. 2007, 2, 414–421. [Google Scholar] [CrossRef]
- Dias, T.R.; Tomás, G.; Teixeira, N.F.; Alves, M.G.; Oliveira, P.F.; Silva, B.M. White tea (Camellia Sinensis (L.)): Antioxidant properties and beneficial health effects. Int. J. Food Sci. Nutr. Diet IJFS 2013, 2, 19–26. [Google Scholar] [CrossRef]
- Huang, F.; Zheng, X.; Ma, X.; Jiang, R.; Zhou, W.; Zhou, S.; Zhang, Y.; Lei, S.; Wang, S.; Kuang, J.; et al. Theabrownin from Pu-erh tea attenuates hypercholesterolemia via modulation of gut microbiota and bile acid metabolism. Nat. Commun. 2019, 10, 4971. [Google Scholar] [CrossRef] [PubMed] [Green Version]
- Yang, J.; Zhou, W.; Gu, Y.; Dai, J.; Li, X.; Tai, P.; Li, Y.; Ma, X.; Zhang, Y. Protective effect of Pu-erh tea extracts against ethanol-induced gastric mucosal damage in rats. Biomed. Rep. 2018, 8, 335–342. [Google Scholar] [CrossRef] [PubMed]
- Huang, F.; Wang, S.; Zhao, A.; Zheng, X.; Zhang, Y.; Lei, S.; Ge, K.; Qu, C.; Zhao, Q.; Yan, C.; et al. Pu-erh tea regulates fatty acid metabolism in mice under high-fat diet. Front. Pharmacol. 2019, 10, 63. [Google Scholar] [CrossRef] [PubMed] [Green Version]
- Yang, C.Y.; Yen, Y.Y.; Hung, K.C.; Hsu, S.W.; Lan, S.J.; Lin, H.C. Inhibitory effects of Pu-erh tea on alpha glucosidase and alpha amylase: A systemic review. Nutr. Diabetes 2019, 9, 23. [Google Scholar] [CrossRef] [PubMed] [Green Version]
- Gambero, A.; Ribeiro, M.L. The positive effects of Yerba Maté (Ilex paraguariensis) in obesity. Nutrients 2015, 7, 730–750. [Google Scholar] [CrossRef] [PubMed] [Green Version]
- Lutomski, P.; Goździewska, M.; Florek-Łuszczki, M. Health properties of Yerba Mate. Ann. Agric. Environ. Med. 2020, 27, 310–313. [Google Scholar] [CrossRef]
- Kim, S.Y.; Oh, M.R.; Kim, M.G.; Chae, H.J.; Chae, S.W. Anti-obesity effects of Yerba Mate (Ilex Paraguariensis): A randomized, double-blind, placebo-controlled clinical trial. BMC Complement. Altern. Med. 2015, 15, 338. [Google Scholar] [CrossRef] [Green Version]
- Alkhatib, A.; Atcheson, R. Yerba Maté (Ilex paraguariensis) metabolic, satiety, and mood state effects at rest and during prolonged exercise. Nutrients 2017, 9, 882. [Google Scholar] [CrossRef] [Green Version]
- Sanliera, N.; Gokcenb, B.B.; Altuğ, M. Tea consumption and disease correlations. Trends Food Sci. Technol. 2018, 78, 95–106. [Google Scholar] [CrossRef]
- Dmowski, P.; Kosiorek, A. Właściwości przeciwutleniające czarnych herbat wysokogatunkowych dostępnych na rynku e-commerce. Zesz. Nauk. Akadem. Mor. W Gdyni. 2017, 99, 9–19. [Google Scholar]
- Rozkrut, D. Rocznik Statystyczny Rolnictwa. Główny Urząd Stat. Warszawa 2019, 300, 324. [Google Scholar]
- Schulzki, G.; Nüßlein, B.; Sievers, H. Transition rates of selected metals determined in various types of teas (Camellia sinensis L. Kuntze) and herbal/fruit infusions. Food Chem. 2017, 215, 22–30. [Google Scholar] [CrossRef]
- Gupta, A.; Srivastava, R.; Mohapatra, M. Mercury, a silent killer to human health and environment: A review of India. Int. J. Ecol. Environ. Sci. 2020, 2, 160–169. [Google Scholar]
- Basu, N.; Horvat, M.; Evers, D.C.; Zastenskaya, I.; Weihe, P.; Tempowski, J. A state of the science review of mercury biomarkers in human populations worldwide between 2000 and 2018. Environ. Health Perspect. 2018, 126, 106001. [Google Scholar] [CrossRef] [PubMed] [Green Version]
- Jaishankar, M.; Tseten, T.; Anbalagan, N.; Mathew, B.; Beeregowda, K. Toxicity, mechanism and health effects of some heavy metals. Interdiscip. Toxicol. 2014, 7, 60–72. [Google Scholar] [CrossRef] [Green Version]
- Abbott, L.C.; Nigussie, F. Mercury toxicity and neurogenesis in the mammalian brain. Int. J. Mol. Sci. 2021, 22, 7520. [Google Scholar] [CrossRef]
- Andreoli, V.; Sprovieri, F. Genetic aspects of susceptibility to mercury toxicity. Int. J. Environ. Res. Public Health 2017, 14, 93. [Google Scholar] [CrossRef] [Green Version]
- Janle, E.M.; Freiser, H.; Manganais, C.; Chen, T.Y.; Craig, B.A.; Santerre, C.R. Green tea increases the concentration of total mercury in the blood of rats following an oral fish tissue bolus. BioMed Res. Int. 2015, 2015, 320936. [Google Scholar] [CrossRef] [Green Version]
- Commission Regulation (EU) 2018/73 of 16 January 2018 Amending Annexes II and III to Regulation (EC) No 396/2005 of the European Parliament and of the Council as Regards Maximum Residue Levels for Mercury Compounds in or on Certain Products. Available online: https://eur-lex.europa.eu/legal-content/EN/TXT/?uri=CELEX:32018R0073 (accessed on 5 January 2022).
- Available online: https://www.spectro-lab.pl/produkt/analizator-rteci-ama-254/ (accessed on 10 January 2022).
- TIBCO Software Inc. Statistica (Data Analysis Software System), Version 13; 2017. Available online: https://www.statsoft.pl/statistica-i-tibco-software/ (accessed on 10 March 2022).
- Pozebon, D.; Dressler, V.L.; Marcelo, M.C.A.; Charão de Oliveira, T.; Ferrão, M.F. Toxic and nutrient elements in yerba mate (Ilex paraguariensis). Food Addit. Contam. Part B Surveill. 2015, 8, 215–220. [Google Scholar] [CrossRef] [PubMed]
- Proch, J.; Orłowska, A.; Niedzielski, P. Elemental and speciation analyses of different brands of Yerba Mate (Ilex paraguariensis). Foods 2021, 10, 2925. [Google Scholar] [CrossRef] [PubMed]
- Motta, A.C.V.; Barbosa, J.Z.; Magri, E.; Pedreira, G.Q.; Santin, D.; Prior, S.A.; Consalter, R.; Young, S.D.; Broadley, M.R.; Benedetti, E.L. Elemental composition of yerba mate (Ilex paraguariensis A.St.-Hil.) under low input systems of southern Brazil. Sci. Total Environ. 2020, 736, 139637. [Google Scholar] [CrossRef] [PubMed]
- Li, W.; Cheng, H.; Mu, Y.; Xu, A.; Ma, B.; Wang, F.; Xu, P. Occurrence, accumulation, and risk assessment of trace metals in tea (Camellia sinensis): A national reconnaissance. Sci. Total Environ. 2021, 792, 148354. [Google Scholar] [CrossRef] [PubMed]
- Zhang, J.; Ruidong, Y.; Li, Y.C.; Peng, Y.; Wen, X.; Ni, X. Distribution, accumulation, and potential risks of heavy metals in soil and tea leaves from geologically different plantations. Ecotoxicol. Environ. Saf. 2020, 1, 110475. [Google Scholar] [CrossRef] [PubMed]
- Fred-Ahmadu, O.H.; Adedapo, A.E.; Oloyede, M.O.; Benson, N.U. Chemical speciation and characterization of trace metals in dry Camellia sinensis and herbal tea marketed in Nigeria. J. Health Pollut. 2018, 8, 180912. [Google Scholar] [CrossRef] [PubMed] [Green Version]
- EFSA Panel on Contaminants in the Food Chain (CONTAM). Scientific Opinion on the risk for public health related to the presence of mercury and methylmercury in food. EFSA J. 2012, 10, 2985. [Google Scholar]
- Gajewska, R.; Nabrzyski, M.; Ganowiak, Z.; Cybulski, M.; Kułakowska, D. Zawartość wybranych składników mineralnych w herbatach zielonych i czarnych. Rocz. Państwowego Zakładu Hig. 2000, 3, 251–258. [Google Scholar]
- Melucci, L.; Locatelli, D.; Clinio, M. Trace level voltammetric determination of heavy metals and total mercury in tea matrices (Camellia sinensis). Food Chem. Toxicol. 2013, 62, 901–907. [Google Scholar] [CrossRef]
- Karimi, G.; Hasanzadeh, M.K.; Nili, A.; Khashayarmanesh, Z.; Samiei, Z.; Nazari, F.; Teimuri, M. Concentrations and health risk of heavy metals in tea samples marketed in Iran. Pharmacology 2008, 3, 164–174. [Google Scholar]
- Hashempour-Baltork, F.; Hosseini, H.; Houshiarrad, A.; Esmaeili, M. Contamination of foods with arsenic and mercury in Iran: A comprehensive review. Environ. Sci. Poll. Res. 2019, 26, 25399–25413. [Google Scholar] [CrossRef] [PubMed]
- Falahi, E.; Hedaiati, R. Heavy metal content of black teas consumed in Iran. Food Addit. Contam. Part B Surveill. 2013, 6, 123–126. [Google Scholar] [CrossRef] [PubMed]
- Kowalski, R.; Kowalska, G.; Baj, T. The risk assessment of mercury poisonin after consuming teas and cereal products. Curr. Issues Pharm. Med. Sci. 2012, 25, 176–178. [Google Scholar] [CrossRef]
- Li, F.; Lu, Q.; Li, M.; Yang, X.; Xiong, C.; Yang, B. Comparison and risk assessment for trace heavy metals in raw Pu-erh tea with different storage years. Biol. Trace Elem. Res. 2020, 195, 696–706. [Google Scholar] [CrossRef]
- Olivari, I.; Paz, S.; Gutiérrez, Á.; González-Weller, D.; Hardisson, A.; Sagratini, G.; Rubio, C. Macroelement, trace element, and toxic metal levels in leaves and infusions of yerba mate (Ilex paraguariensis). Environ. Sci. Pollut. Res. 2020, 27, 21. [Google Scholar] [CrossRef]
- Bragança, V.L.C.; Melnikov, P.; Zanoni, L.Z. Trace elements in different brands of Yerba Mate Tea. Biol. Trace Elem. Res. 2011, 144, 1197–1204. [Google Scholar] [CrossRef]
- Janda, K.; Jakubczyk, K.; Łukomska, A.; Baranowska-Bosiacka, I.; Rębacz-Maron, E.; Dec, K.; Kochman, J.; Gutowska, I. Effect of the Yerba mate (Ilex paraguariensis) brewing method on the content of selected elements and antioxidant potential of infusions. Pol. J. Chem. Technol. 2020, 22, 54–60. [Google Scholar] [CrossRef] [Green Version]
- Wojciechowska-Mazurek, M.; Starska, K.; Mania, M.; Rebeniak, M.; Karłowski, K. Pierwiastki szkodliwe dla zdrowia w herbacie-ocena zagrożenia dla zdrowia. Bromat. Chem. Toksykol. 2010, 43, 233–239. [Google Scholar]
- Malinowska, E.; Gulewicz, J.; Kosmider, M.; Szefer, P. Zawartość pierwiastków chemicznych w herbatach czerwonych oraz ocena procesu ługowania z liści do naparu. Bromat. Chem. Toksykol. 2003, 36, 395–399. [Google Scholar]
- Wang, Q.; Wang, D.; Li, Z.; Wang, Y.; Yang, Y.; Liu, M.; Li, D.; Sun, G.; Zeng, B. Concentrations, leachability, and health risks of mercury in green tea from major production areas in China. Ecotoxicol. Environ. Saf. 2022, 232, 113279. [Google Scholar] [CrossRef]


| Tea | N | AM ± SD | Median | Quartile | p | ||
|---|---|---|---|---|---|---|---|
| Q1 | Q3 | ||||||
| All | 86 | 2.86 ± 2.07 | 2.47 | 1.21 | 3.88 | ||
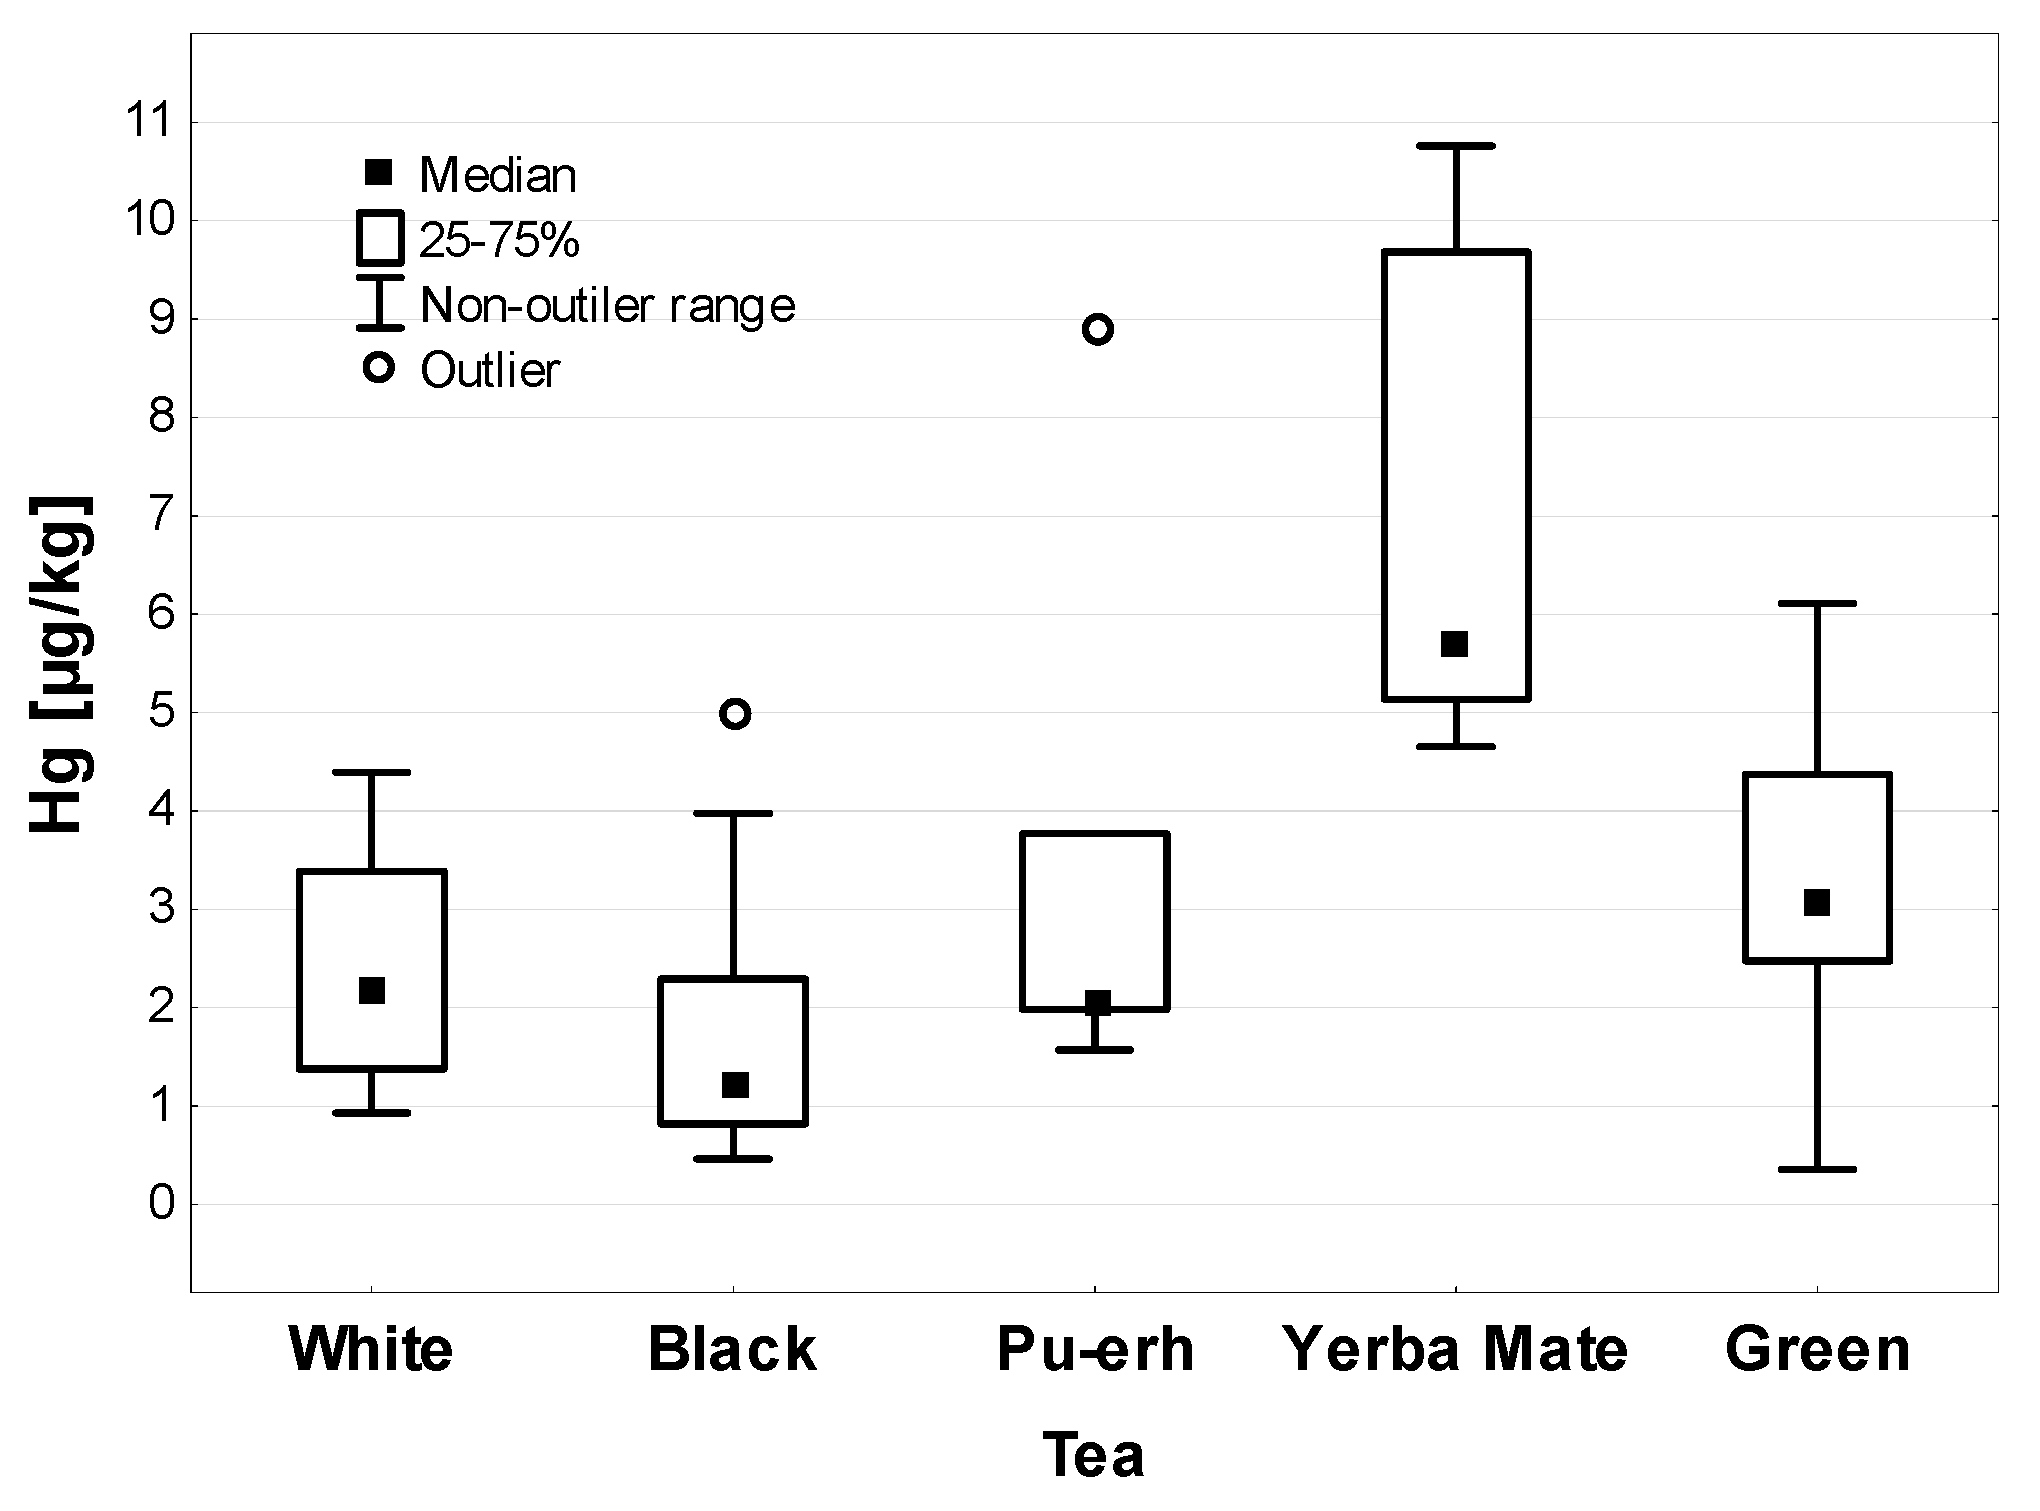
| Kind | Black | 29 | 1.63 ± 1.16 | 1.21 | 0.82 | 2.29 | <0.001 |
| White | 14 | 2.40 ± 1.18 | 2.21 | 1.38 | 3.39 | ||
| Pu-erh | 7 | 3.22 ± 2.60 | 2.06 | 1.99 | 3.77 | ||
| Green | 29 | 3.26 ± 1.54 | 3.06 | 2.47 | 4.37 | ||
| Yerba mate | 7 | 6.87 ± 2.41 | 5.67 | 5.14 | 9.68 | ||
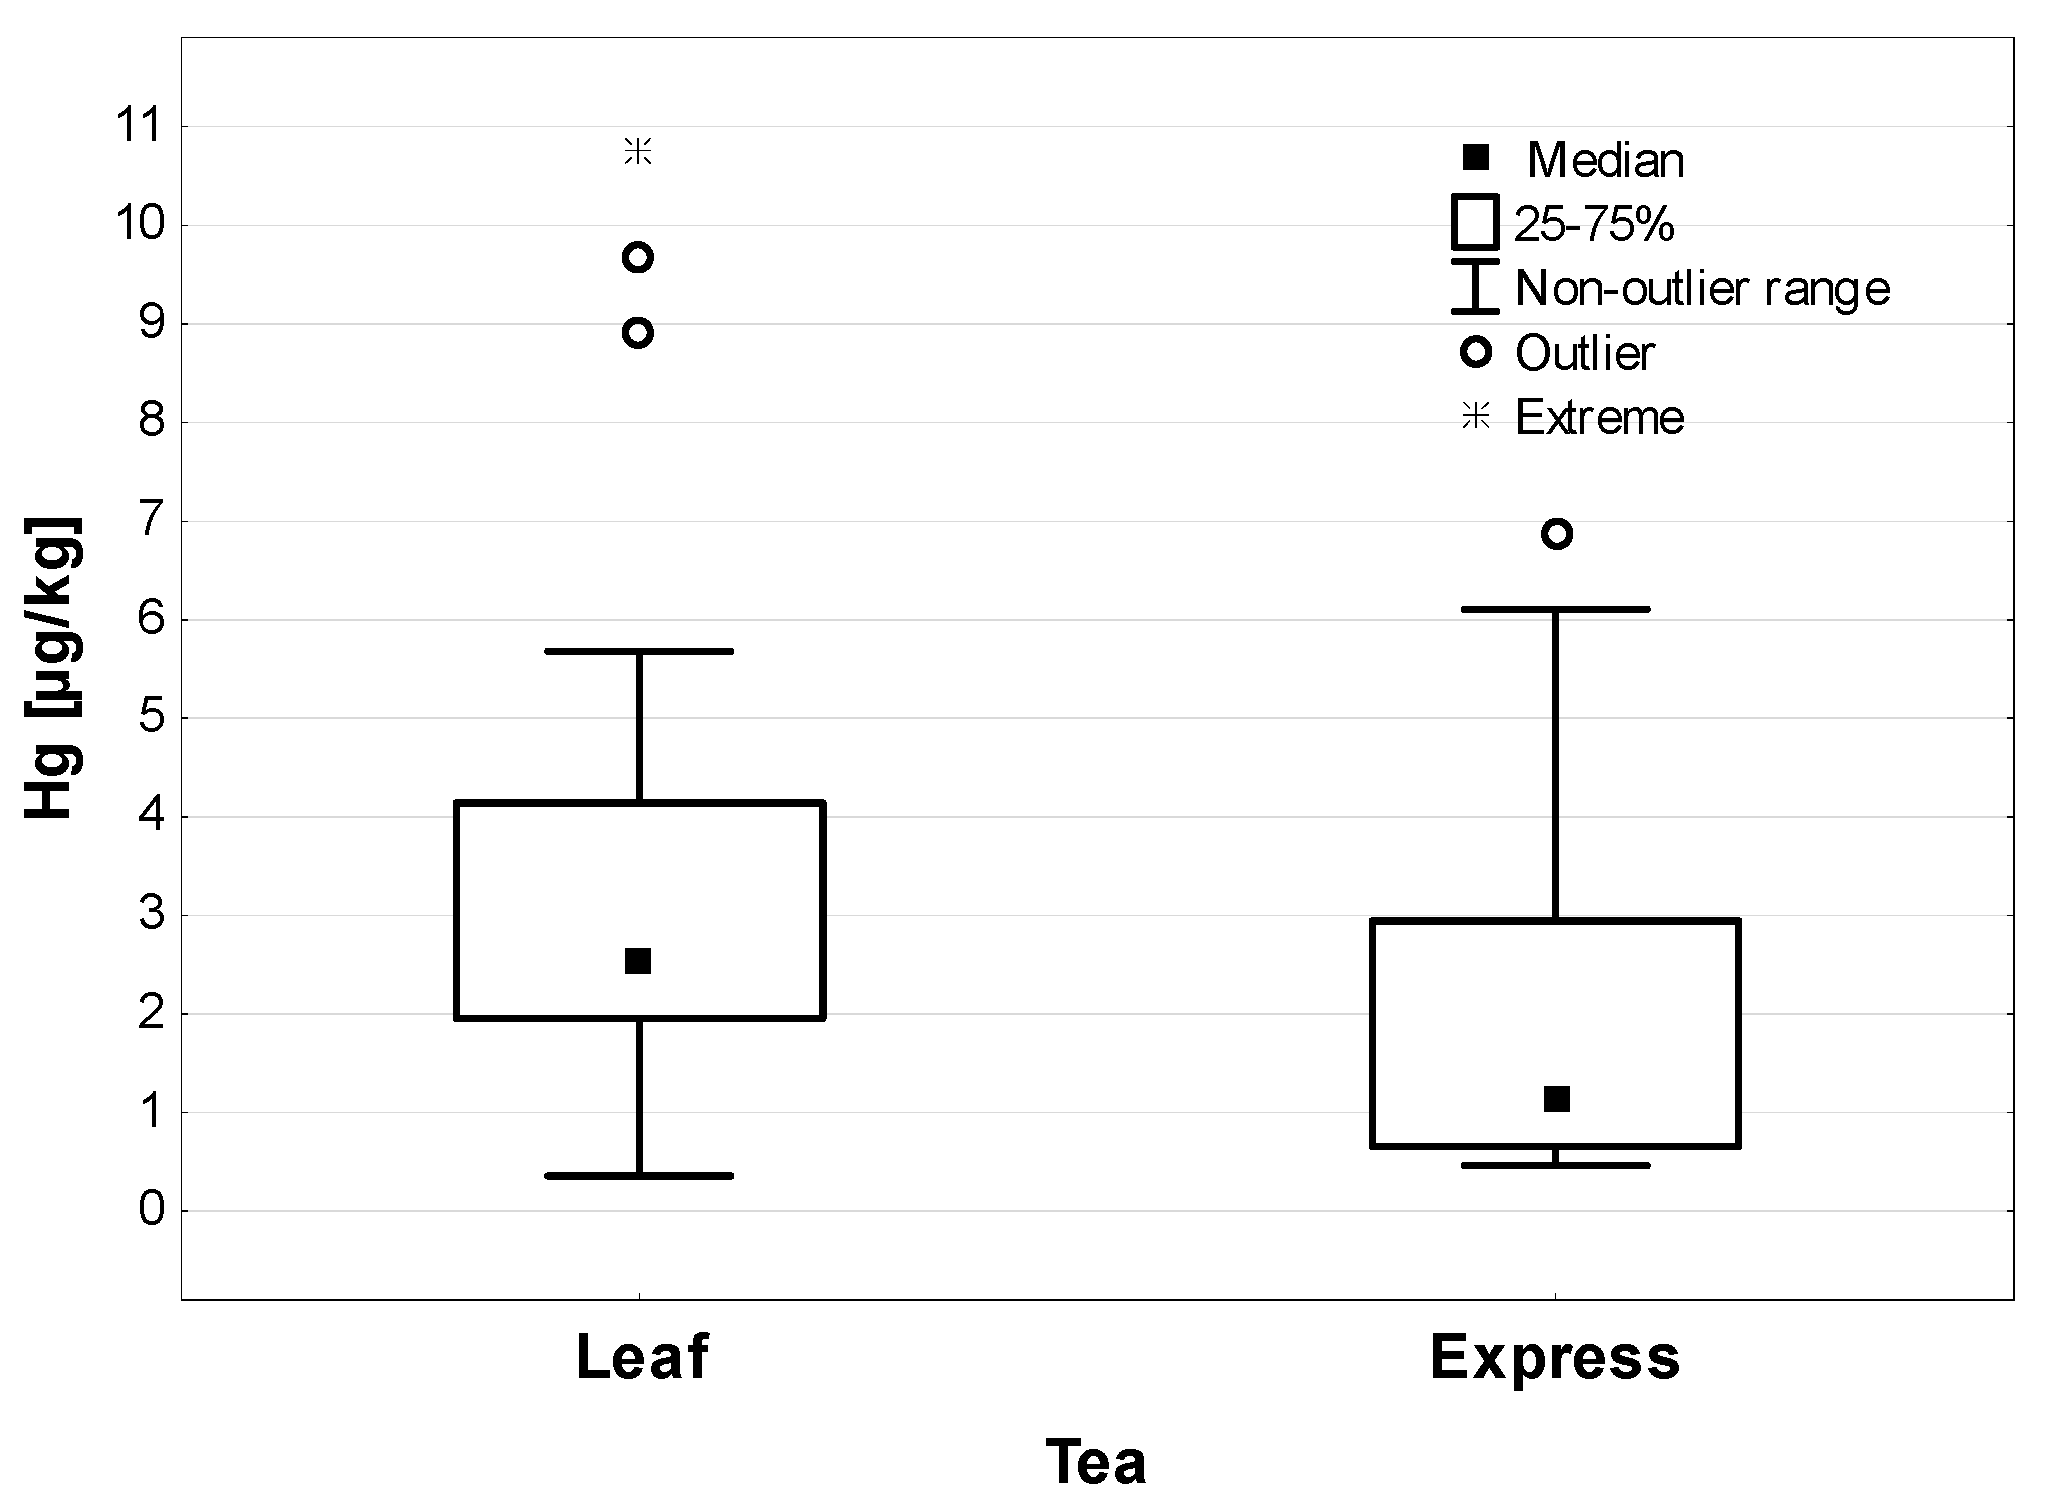
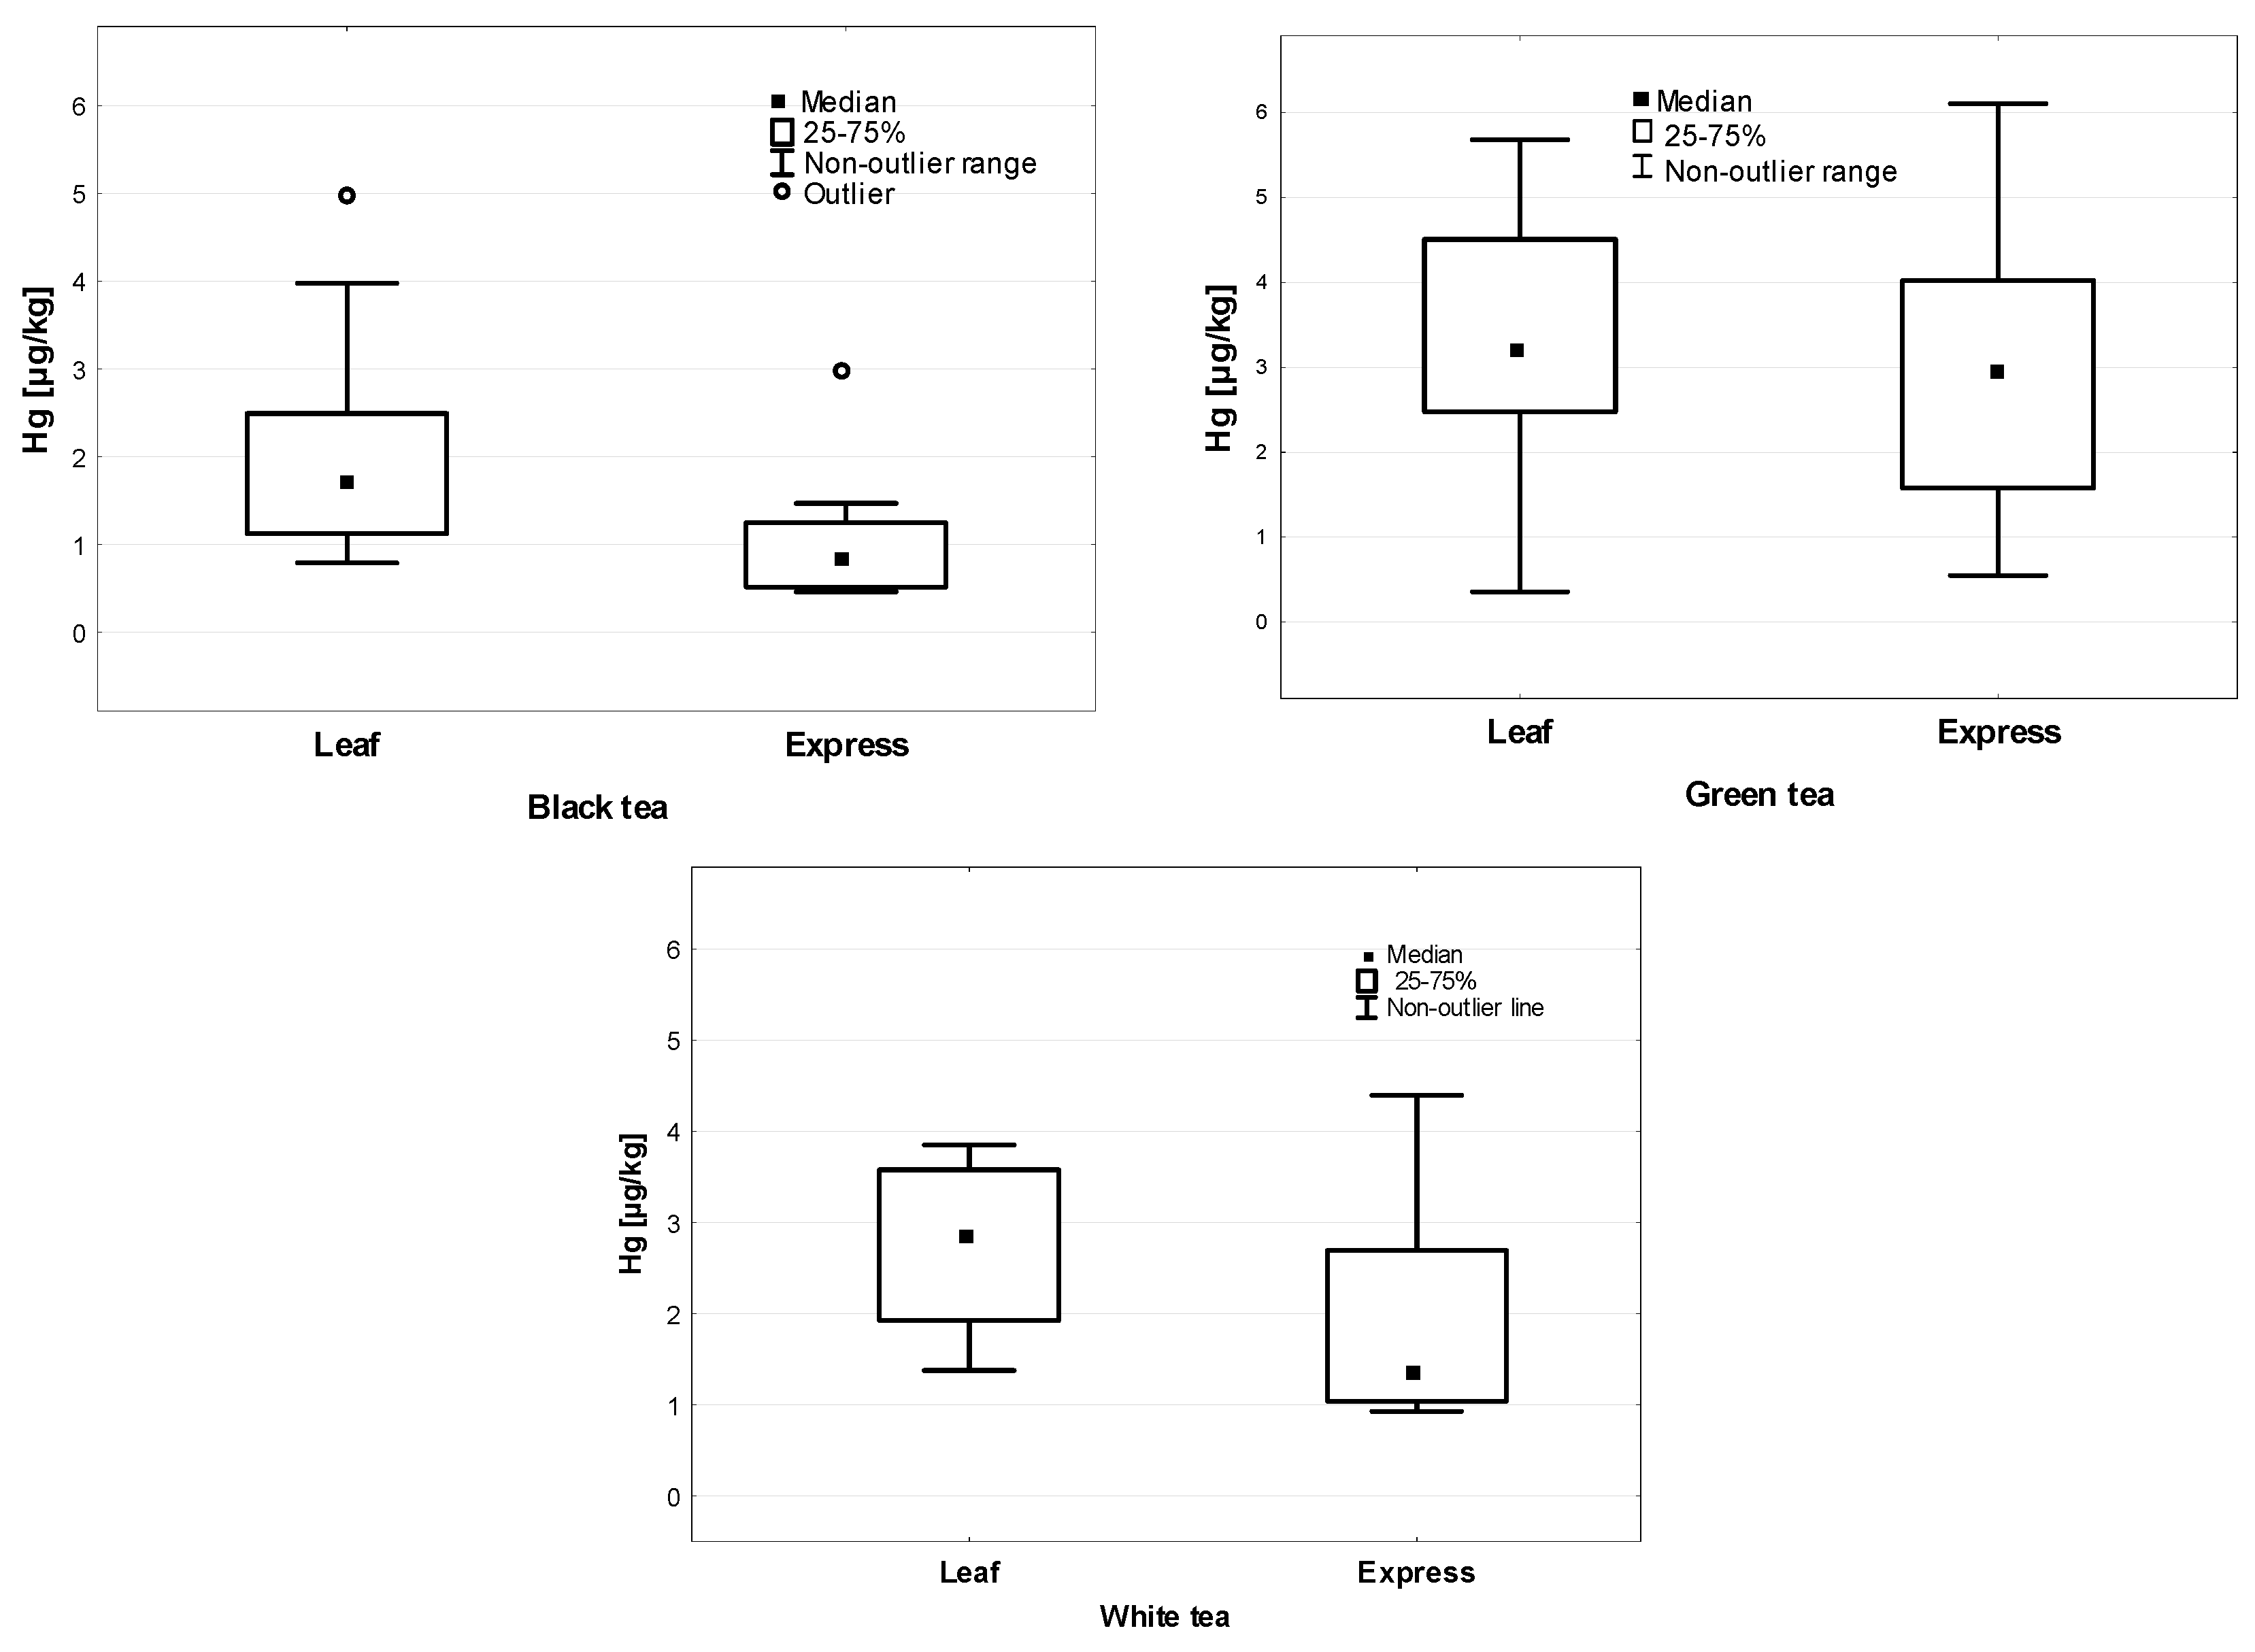
| Form | Leaf | 60 | 3.21 ± 2.09 | 2.54 | 1.95 | 4.14 | <0.01 |
| Express | 26 | 2.05 ± 1.80 | 1.16 | 0.66 | 2.94 | ||
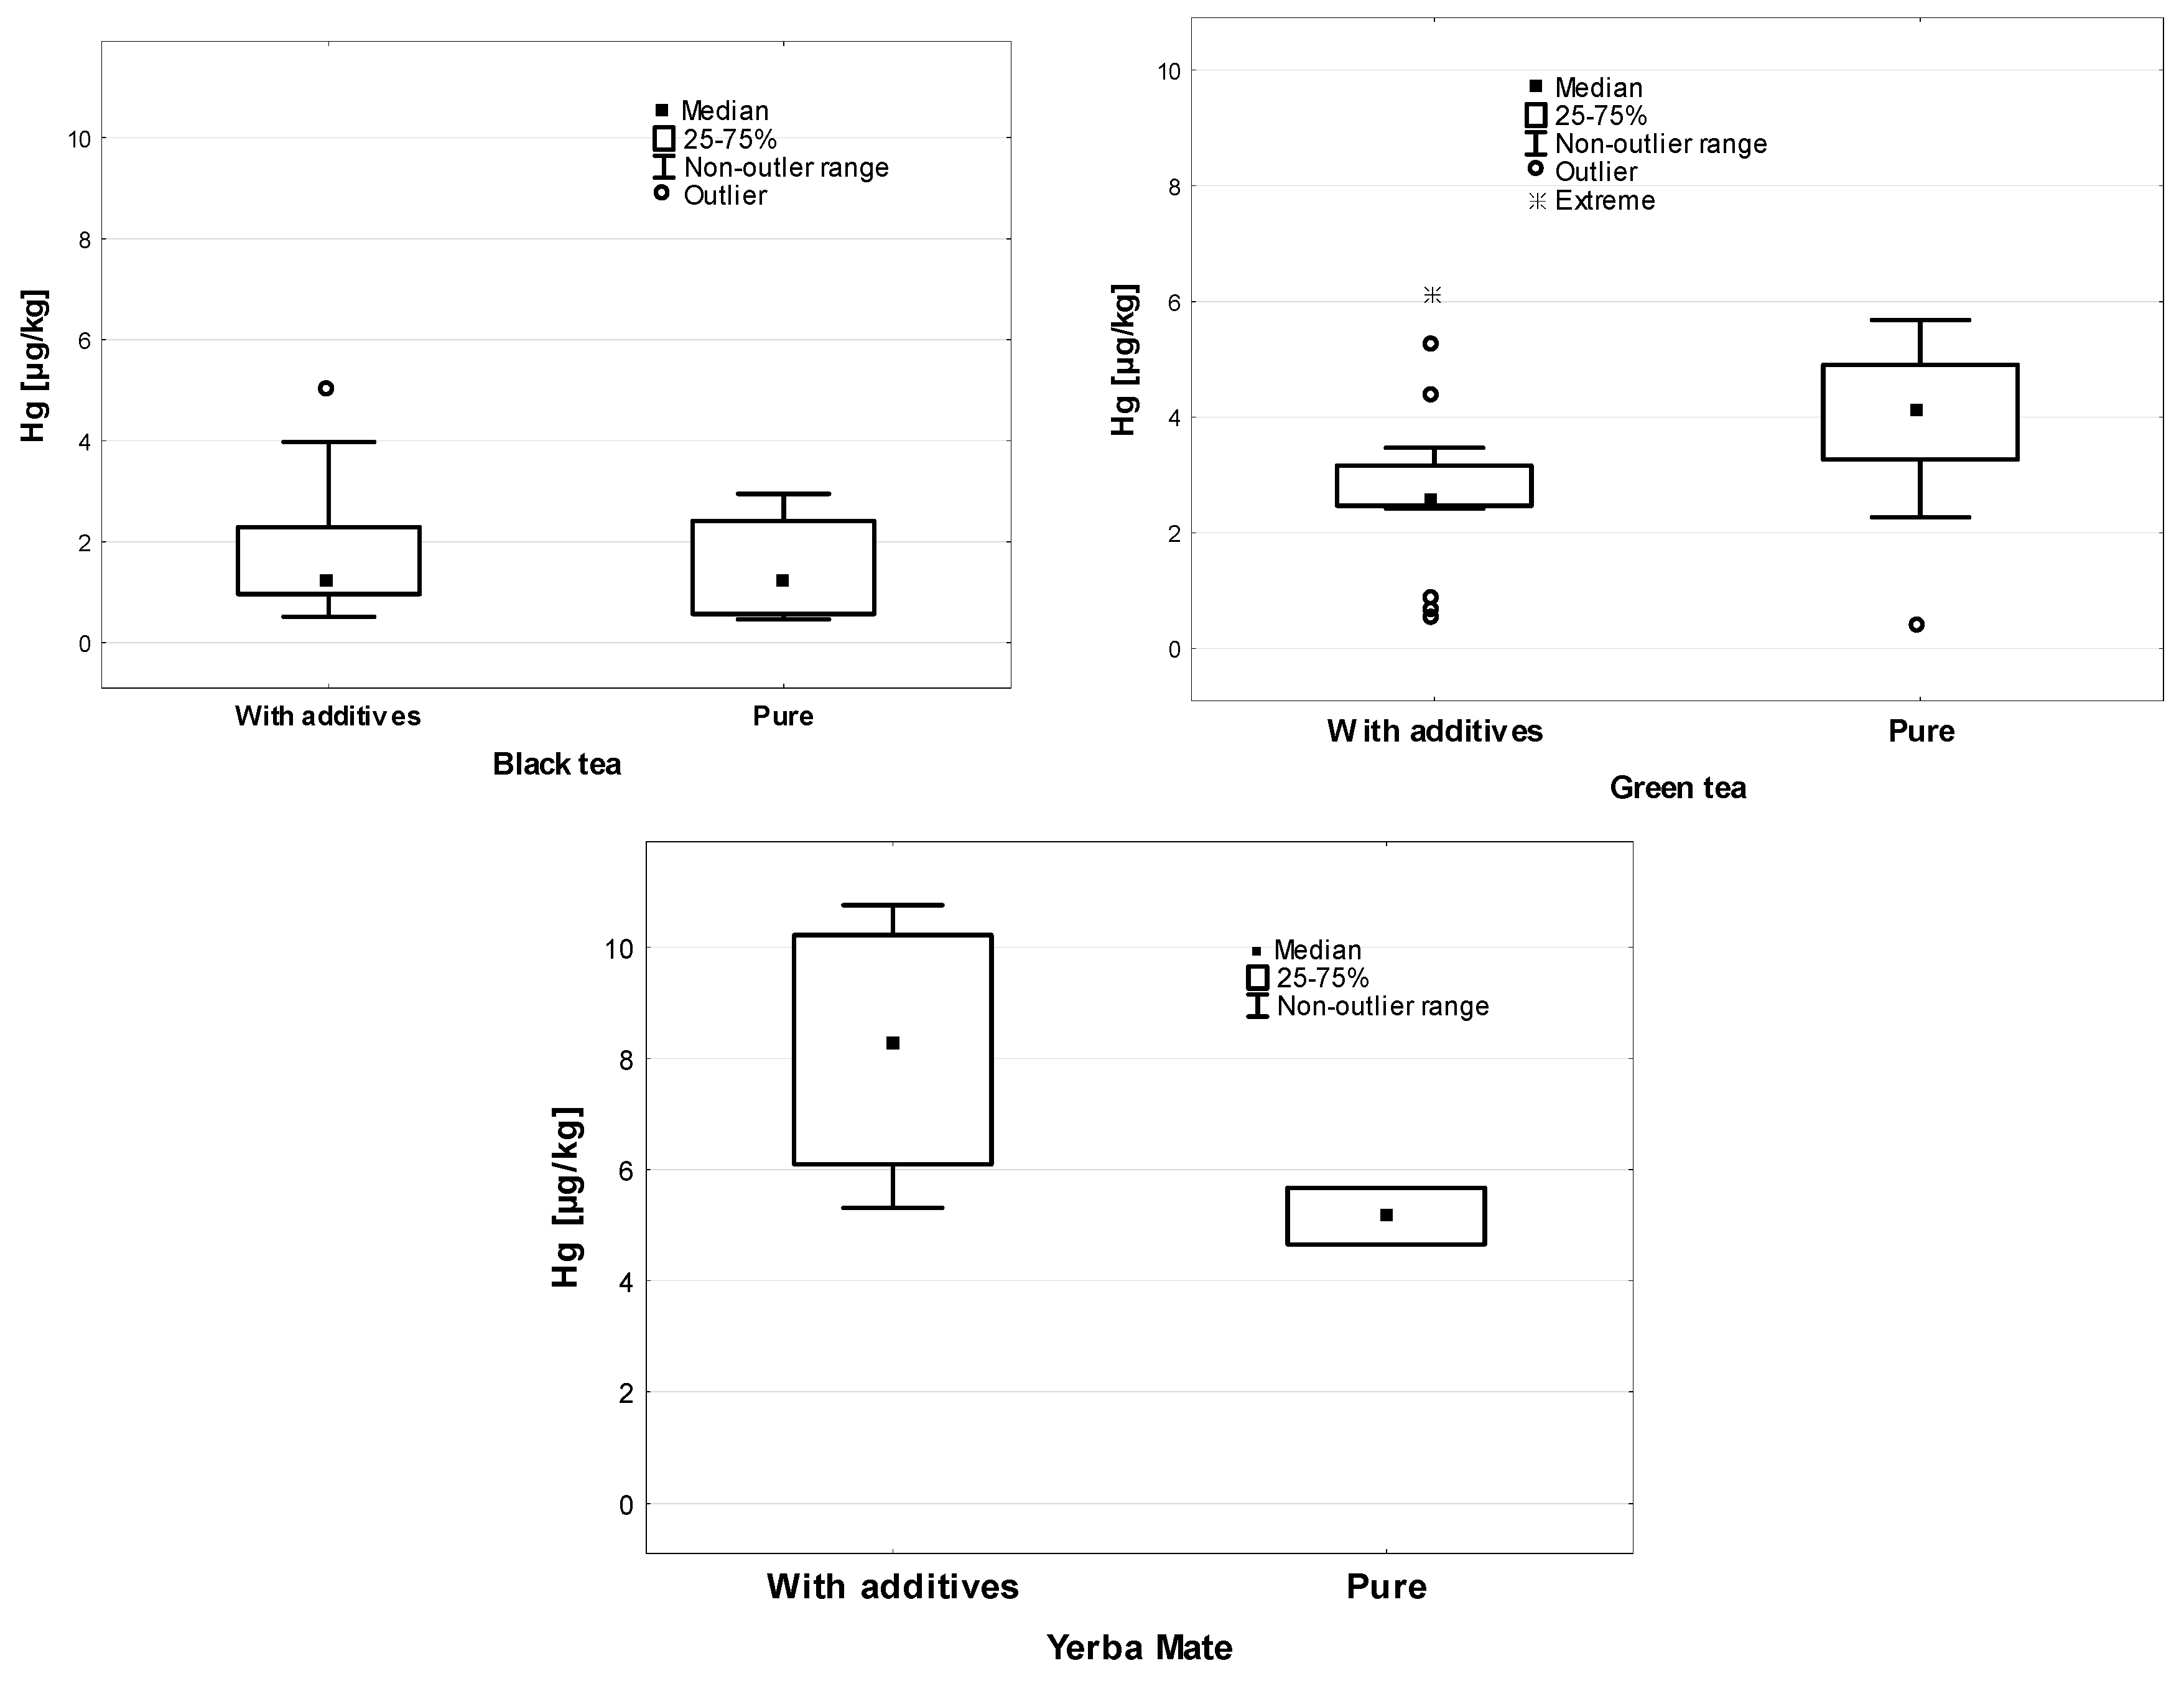
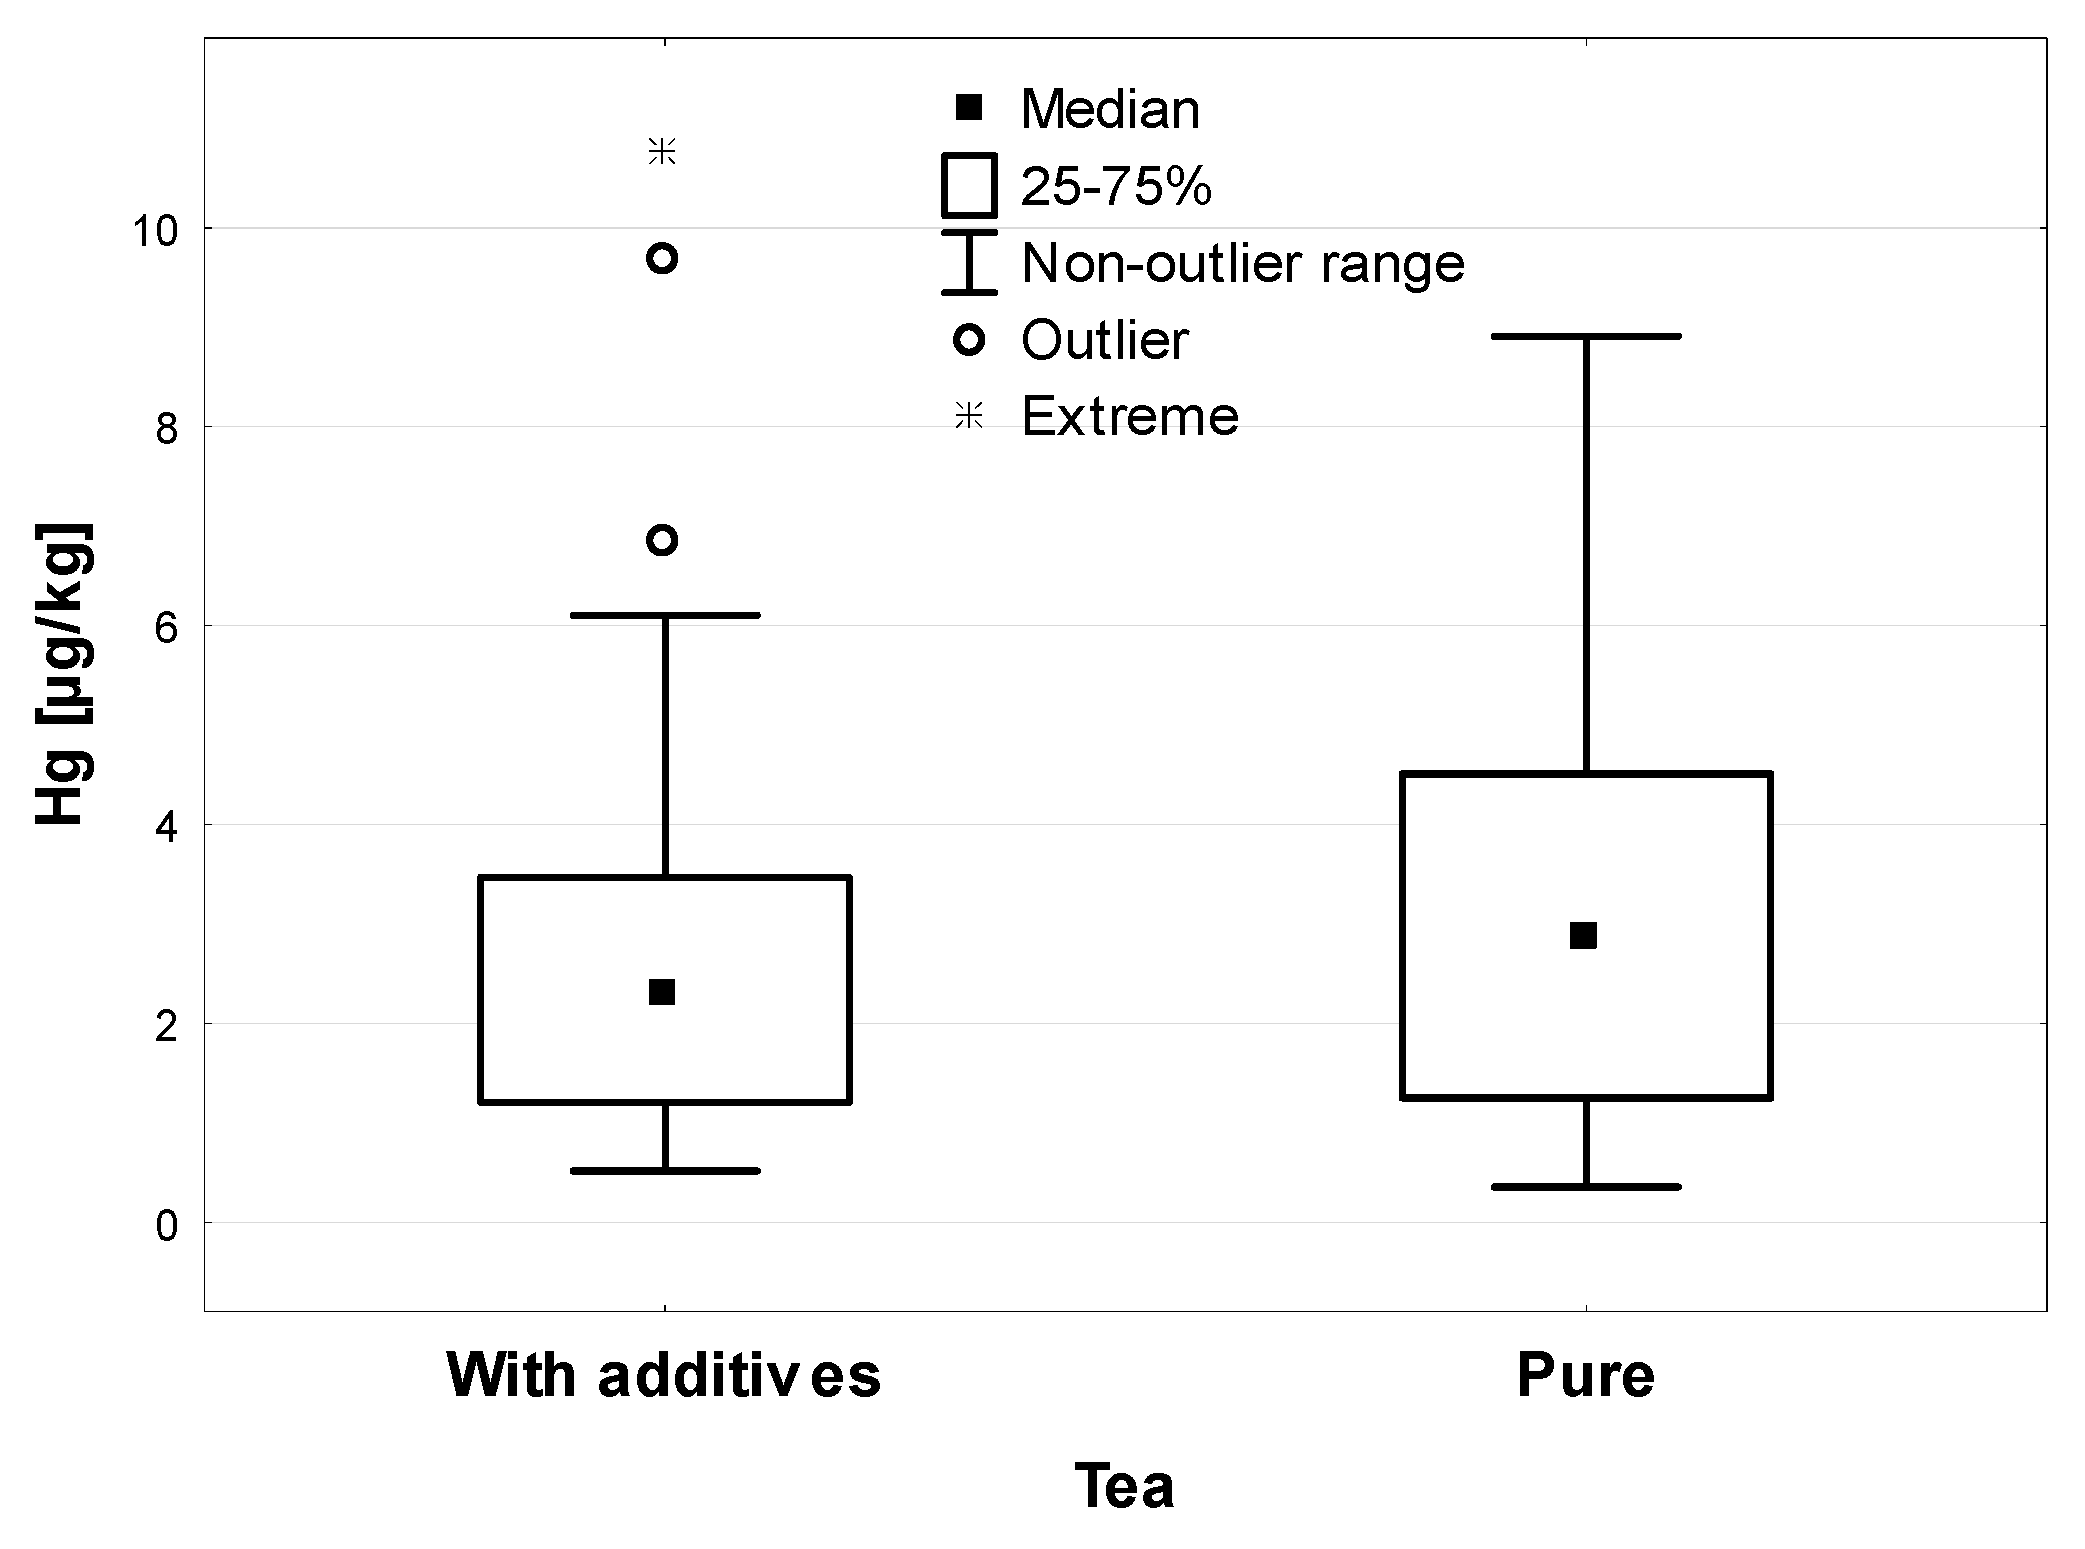
| Composition | With additives | 53 | 2.75 ± 2.11 | 2.31 | 1.21 | 3.47 | 0.429 |
| Pure | 33 | 3.04 ± 2.02 | 2.86 | 1.25 | 4.51 | ||
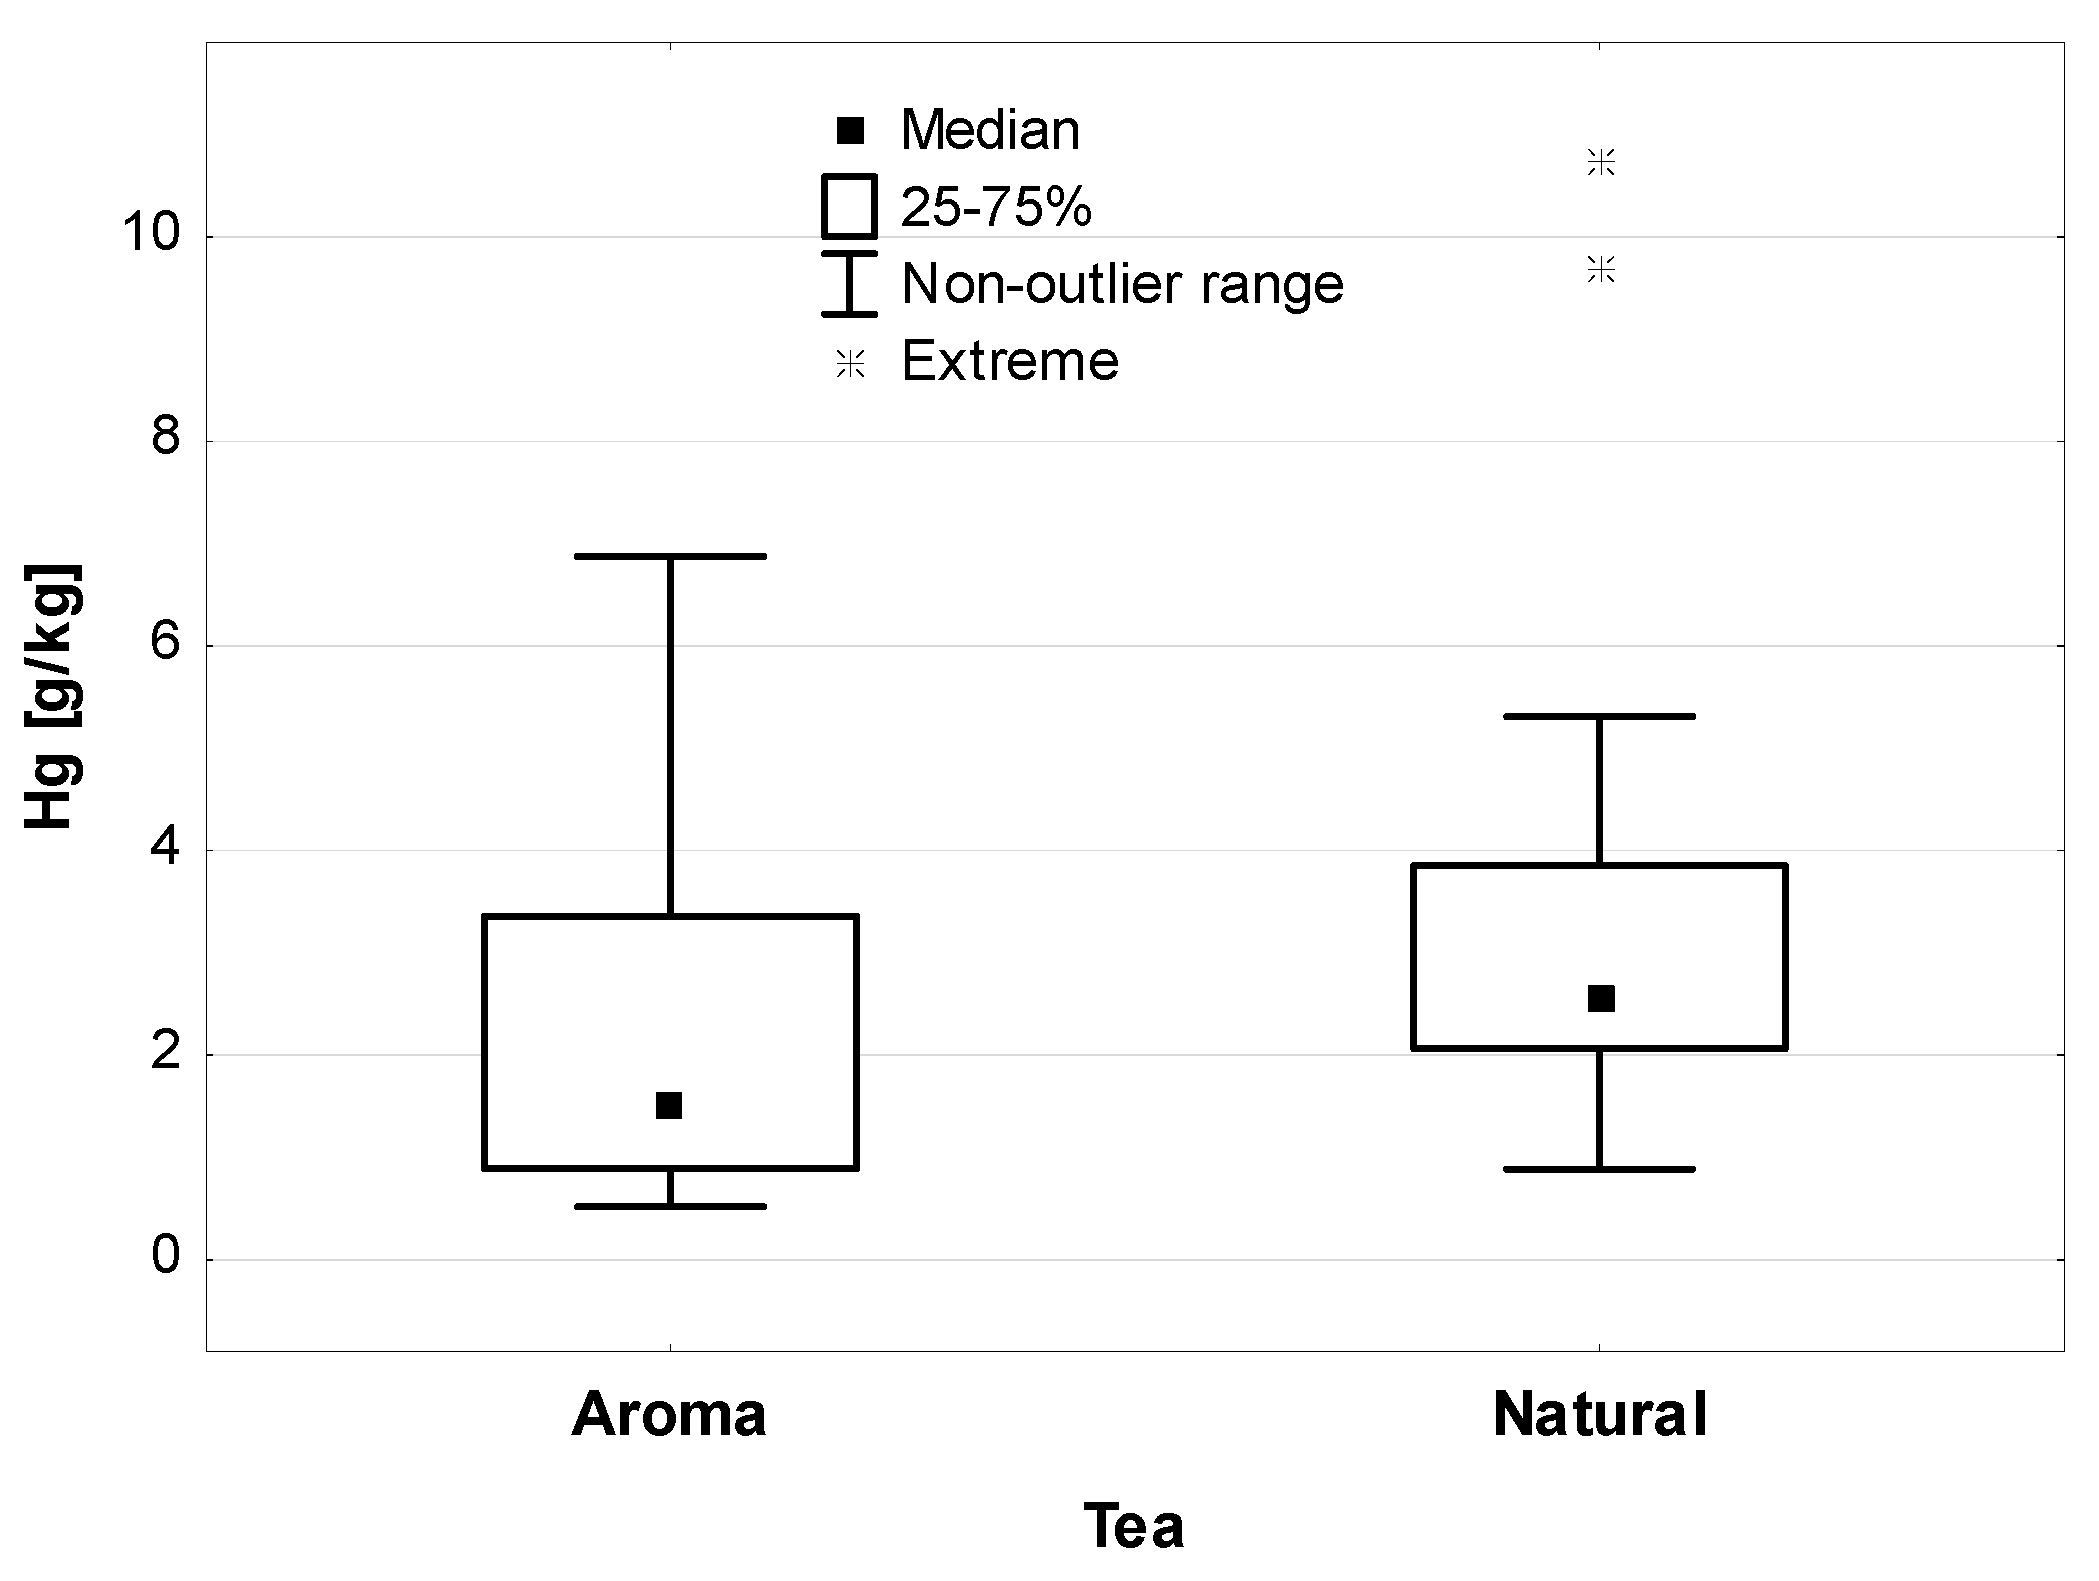
| Additives | Synthetic aromat | 19 | 2.32 ± 1.98 | 1.52 | 0.89 | 3.36 | <0.001 |
| Natural | 34 | 3.23 ± 2.22 | 2.52 | 2.06 | 3.85 | ||
Publisher’s Note: MDPI stays neutral with regard to jurisdictional claims in published maps and institutional affiliations. |
© 2022 by the authors. Licensee MDPI, Basel, Switzerland. This article is an open access article distributed under the terms and conditions of the Creative Commons Attribution (CC BY) license (https://creativecommons.org/licenses/by/4.0/).
Share and Cite
Brodziak-Dopierała, B.; Fischer, A. Analysis of Mercury Content in Various Types of Tea (Camellia sinensis) and Yerba Mate (Ilex paraguariensis). Int. J. Environ. Res. Public Health 2022, 19, 5491. https://doi.org/10.3390/ijerph19095491
Brodziak-Dopierała B, Fischer A. Analysis of Mercury Content in Various Types of Tea (Camellia sinensis) and Yerba Mate (Ilex paraguariensis). International Journal of Environmental Research and Public Health. 2022; 19(9):5491. https://doi.org/10.3390/ijerph19095491
Chicago/Turabian StyleBrodziak-Dopierała, Barbara, and Agnieszka Fischer. 2022. "Analysis of Mercury Content in Various Types of Tea (Camellia sinensis) and Yerba Mate (Ilex paraguariensis)" International Journal of Environmental Research and Public Health 19, no. 9: 5491. https://doi.org/10.3390/ijerph19095491
APA StyleBrodziak-Dopierała, B., & Fischer, A. (2022). Analysis of Mercury Content in Various Types of Tea (Camellia sinensis) and Yerba Mate (Ilex paraguariensis). International Journal of Environmental Research and Public Health, 19(9), 5491. https://doi.org/10.3390/ijerph19095491