
Accessibility of Park Green Space in Wuhan, China: Implications for Spatial Equity in the Post-COVID-19 Era


Abstract
:1. Introduction
2. Data and Methods
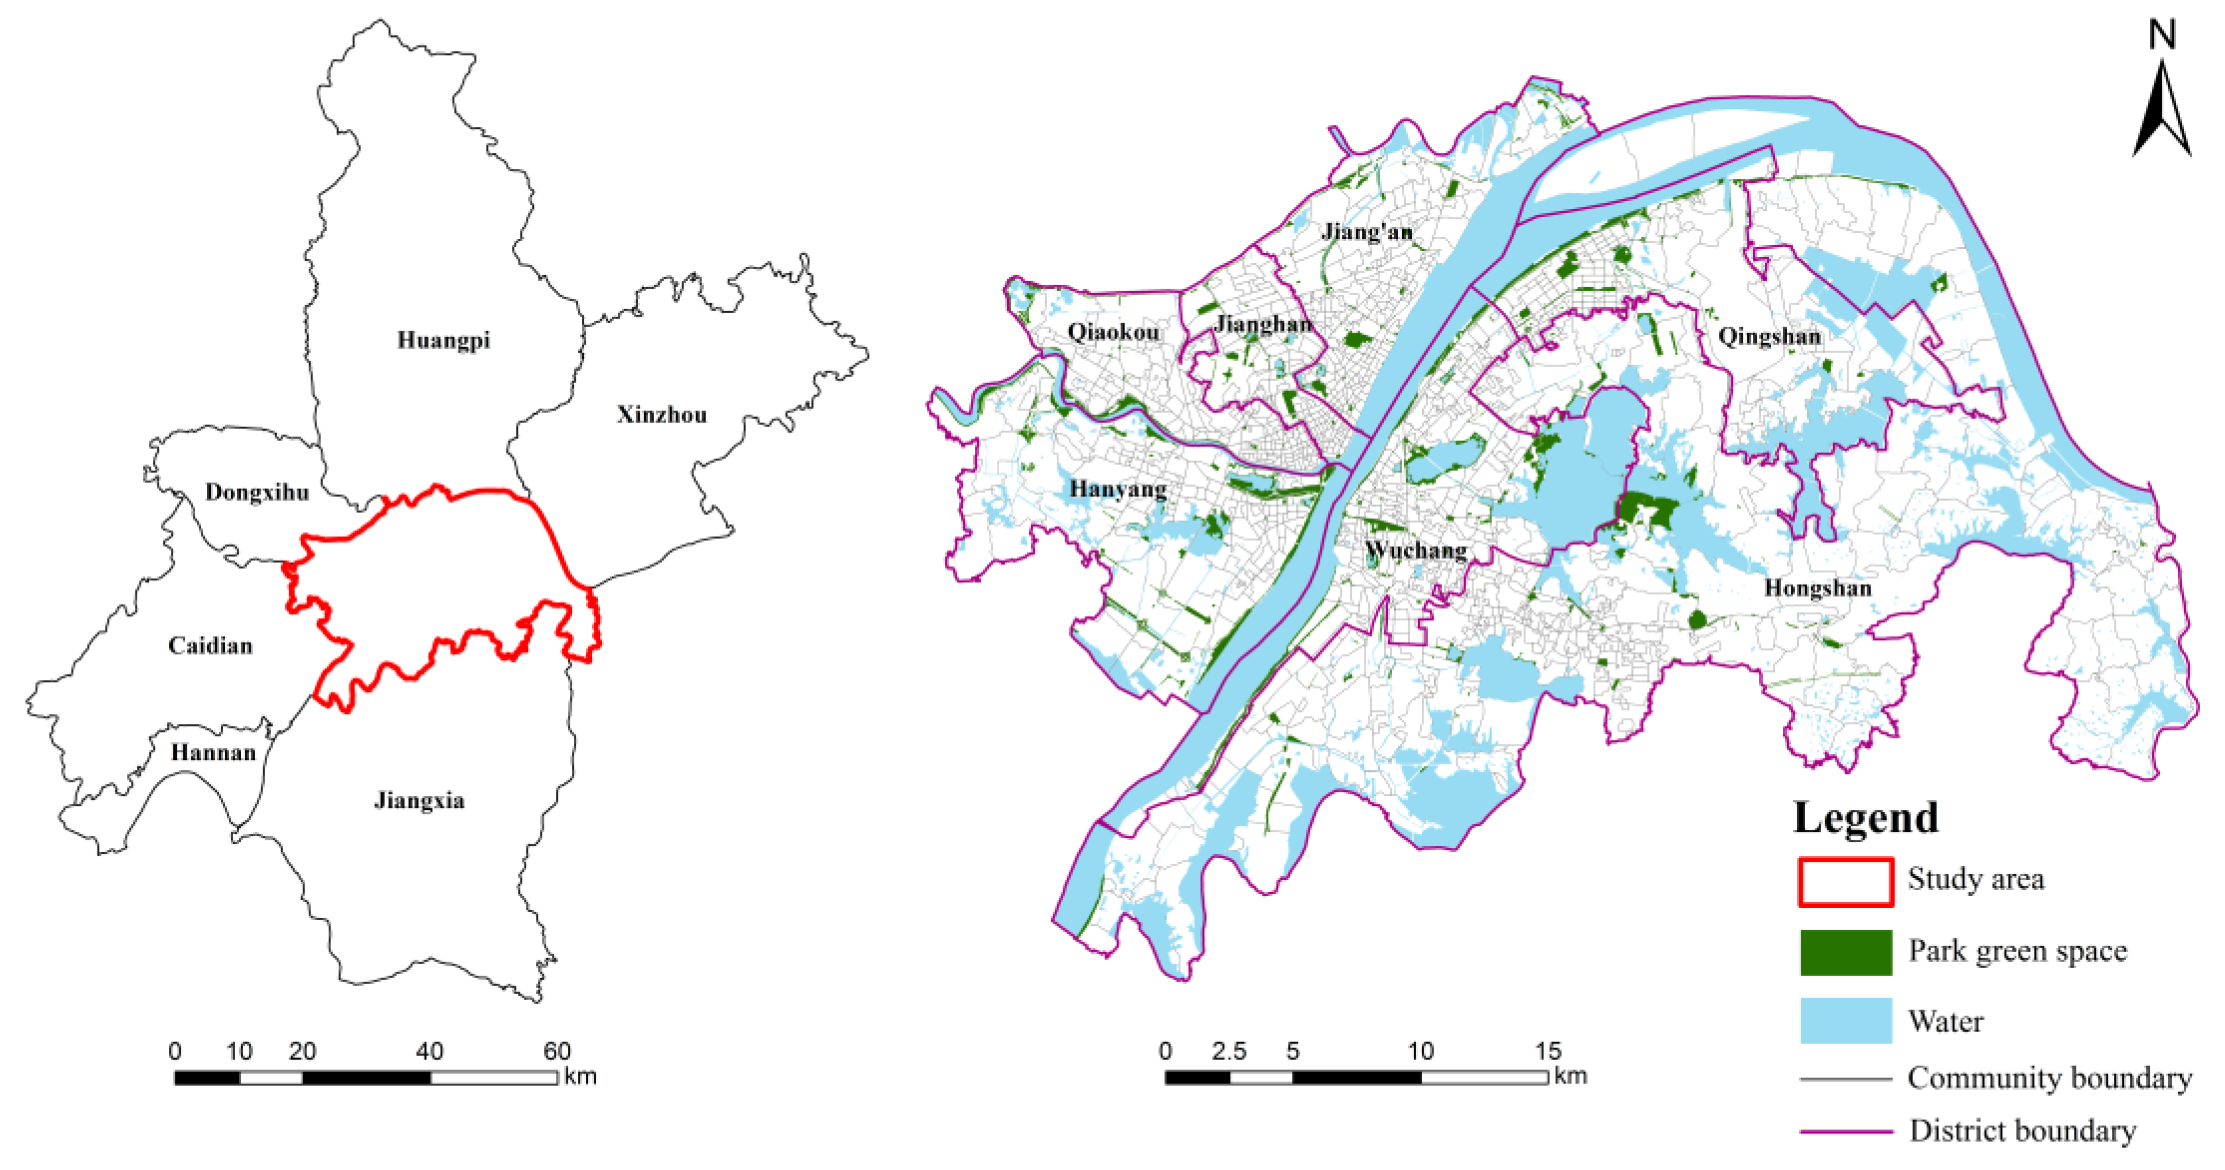
2.1. Study Area
2.2. Data Sources
2.3. Accessibility of Park Green Space
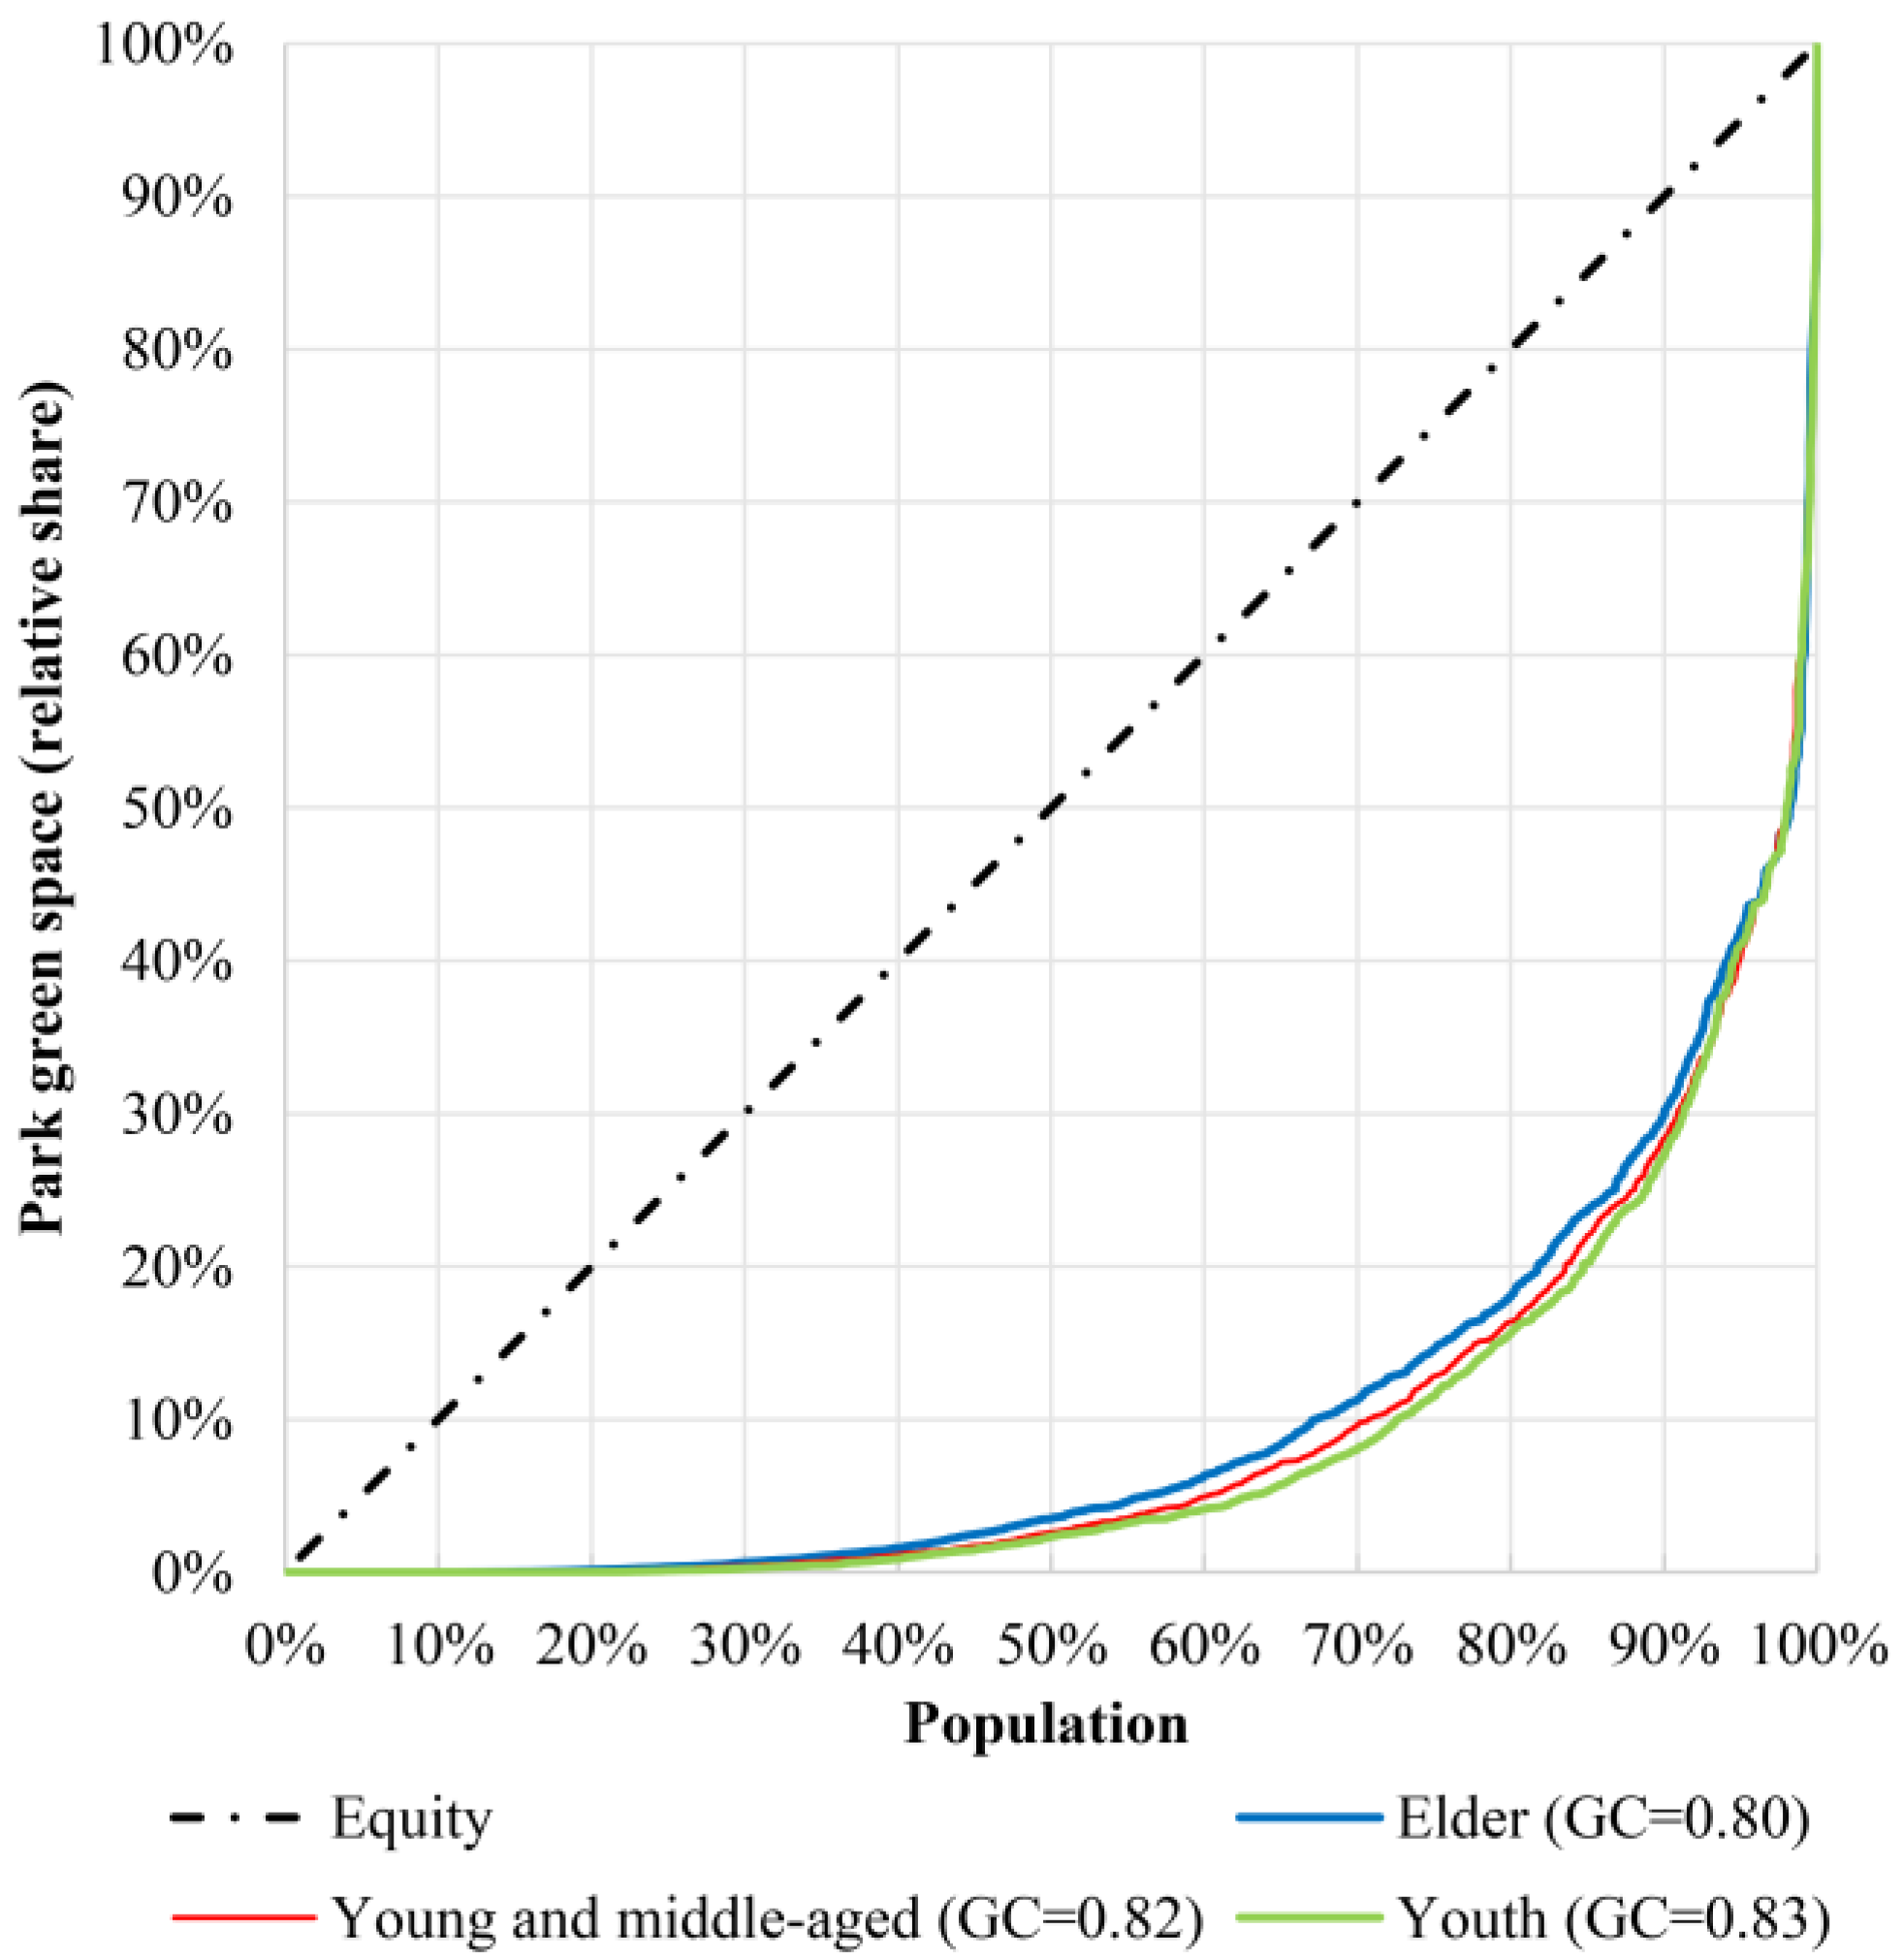
2.4. Lorenz Curve and Gini Coefficient (GC)
3. Results
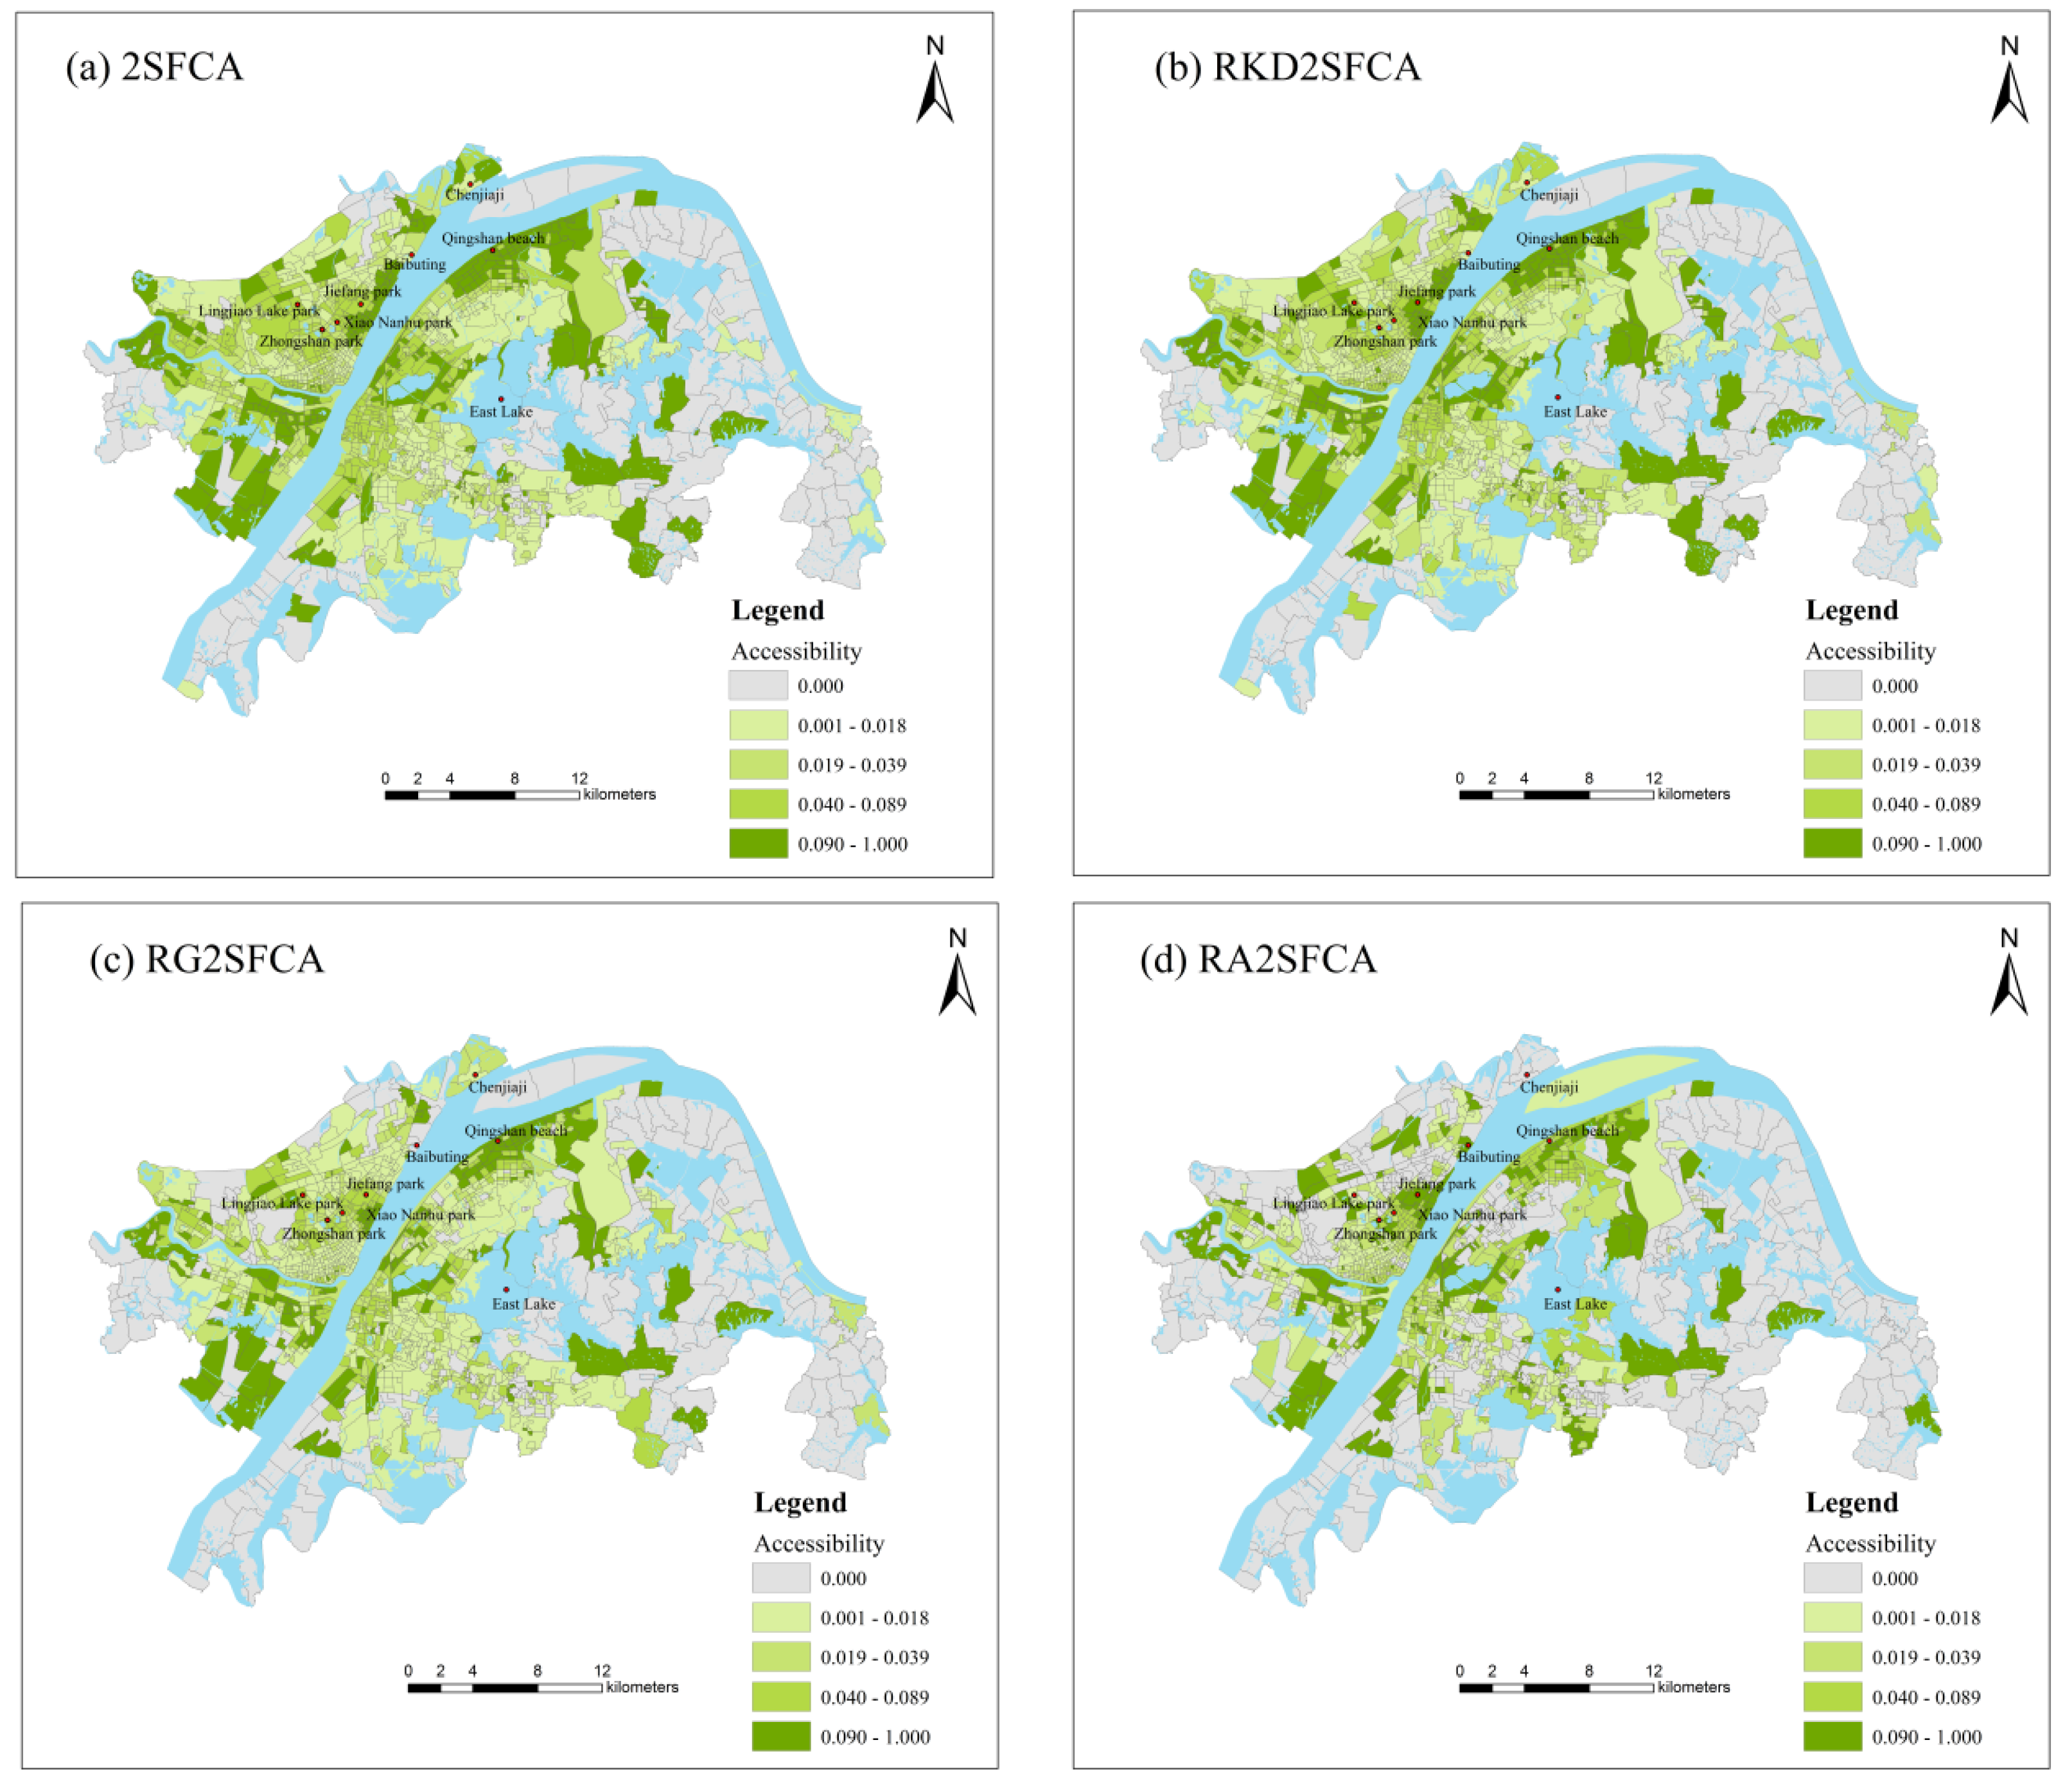
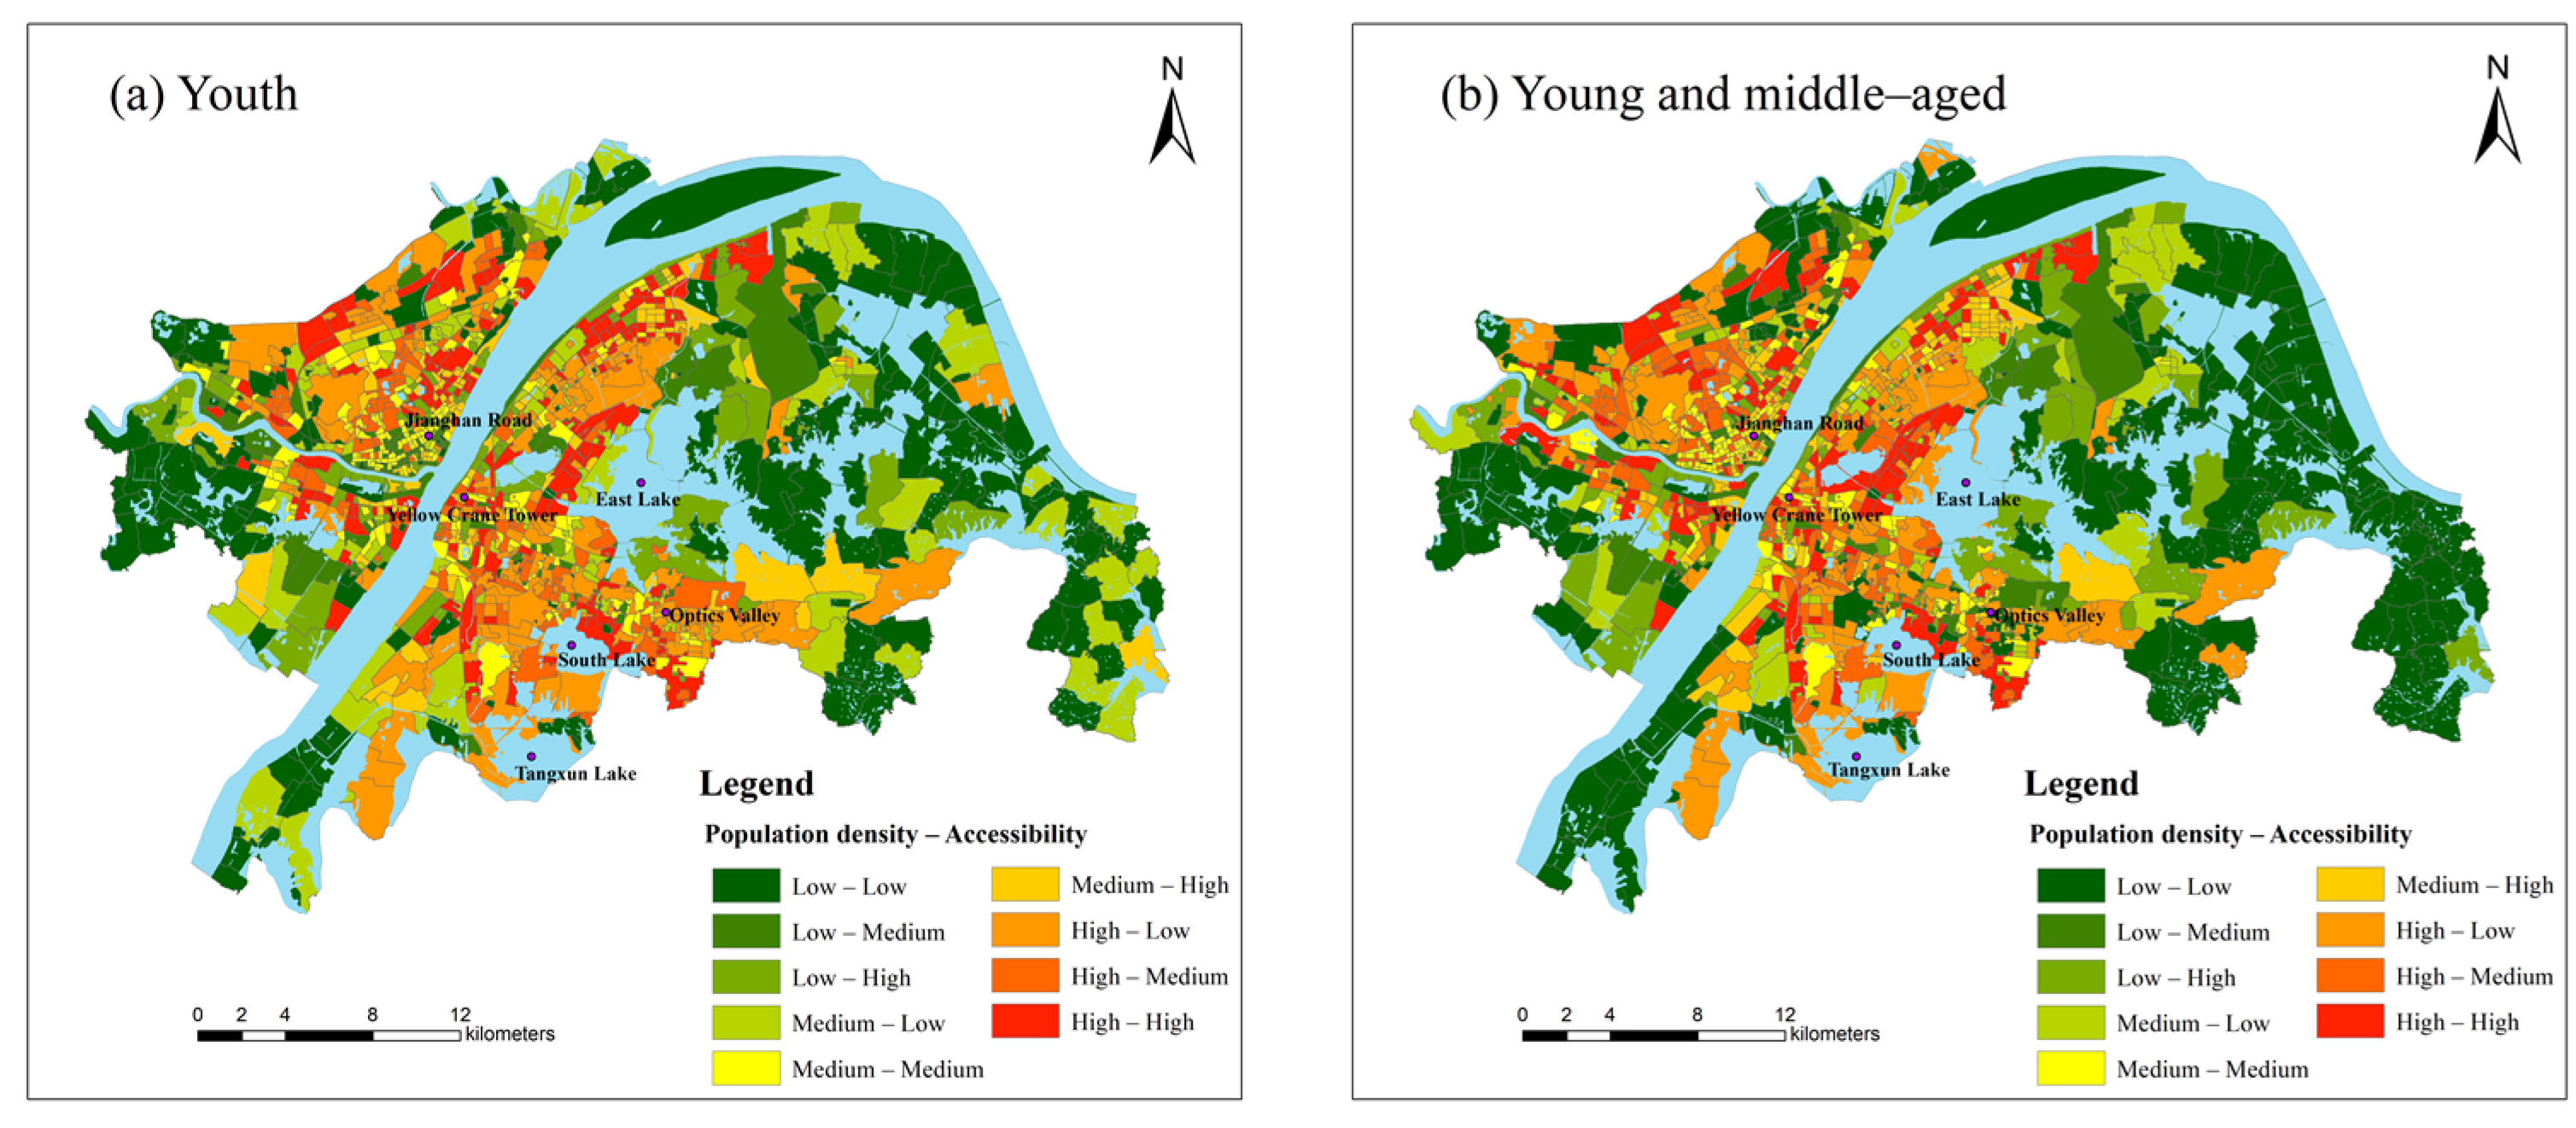
3.1. The Pattern of Park Green Space Accessibility
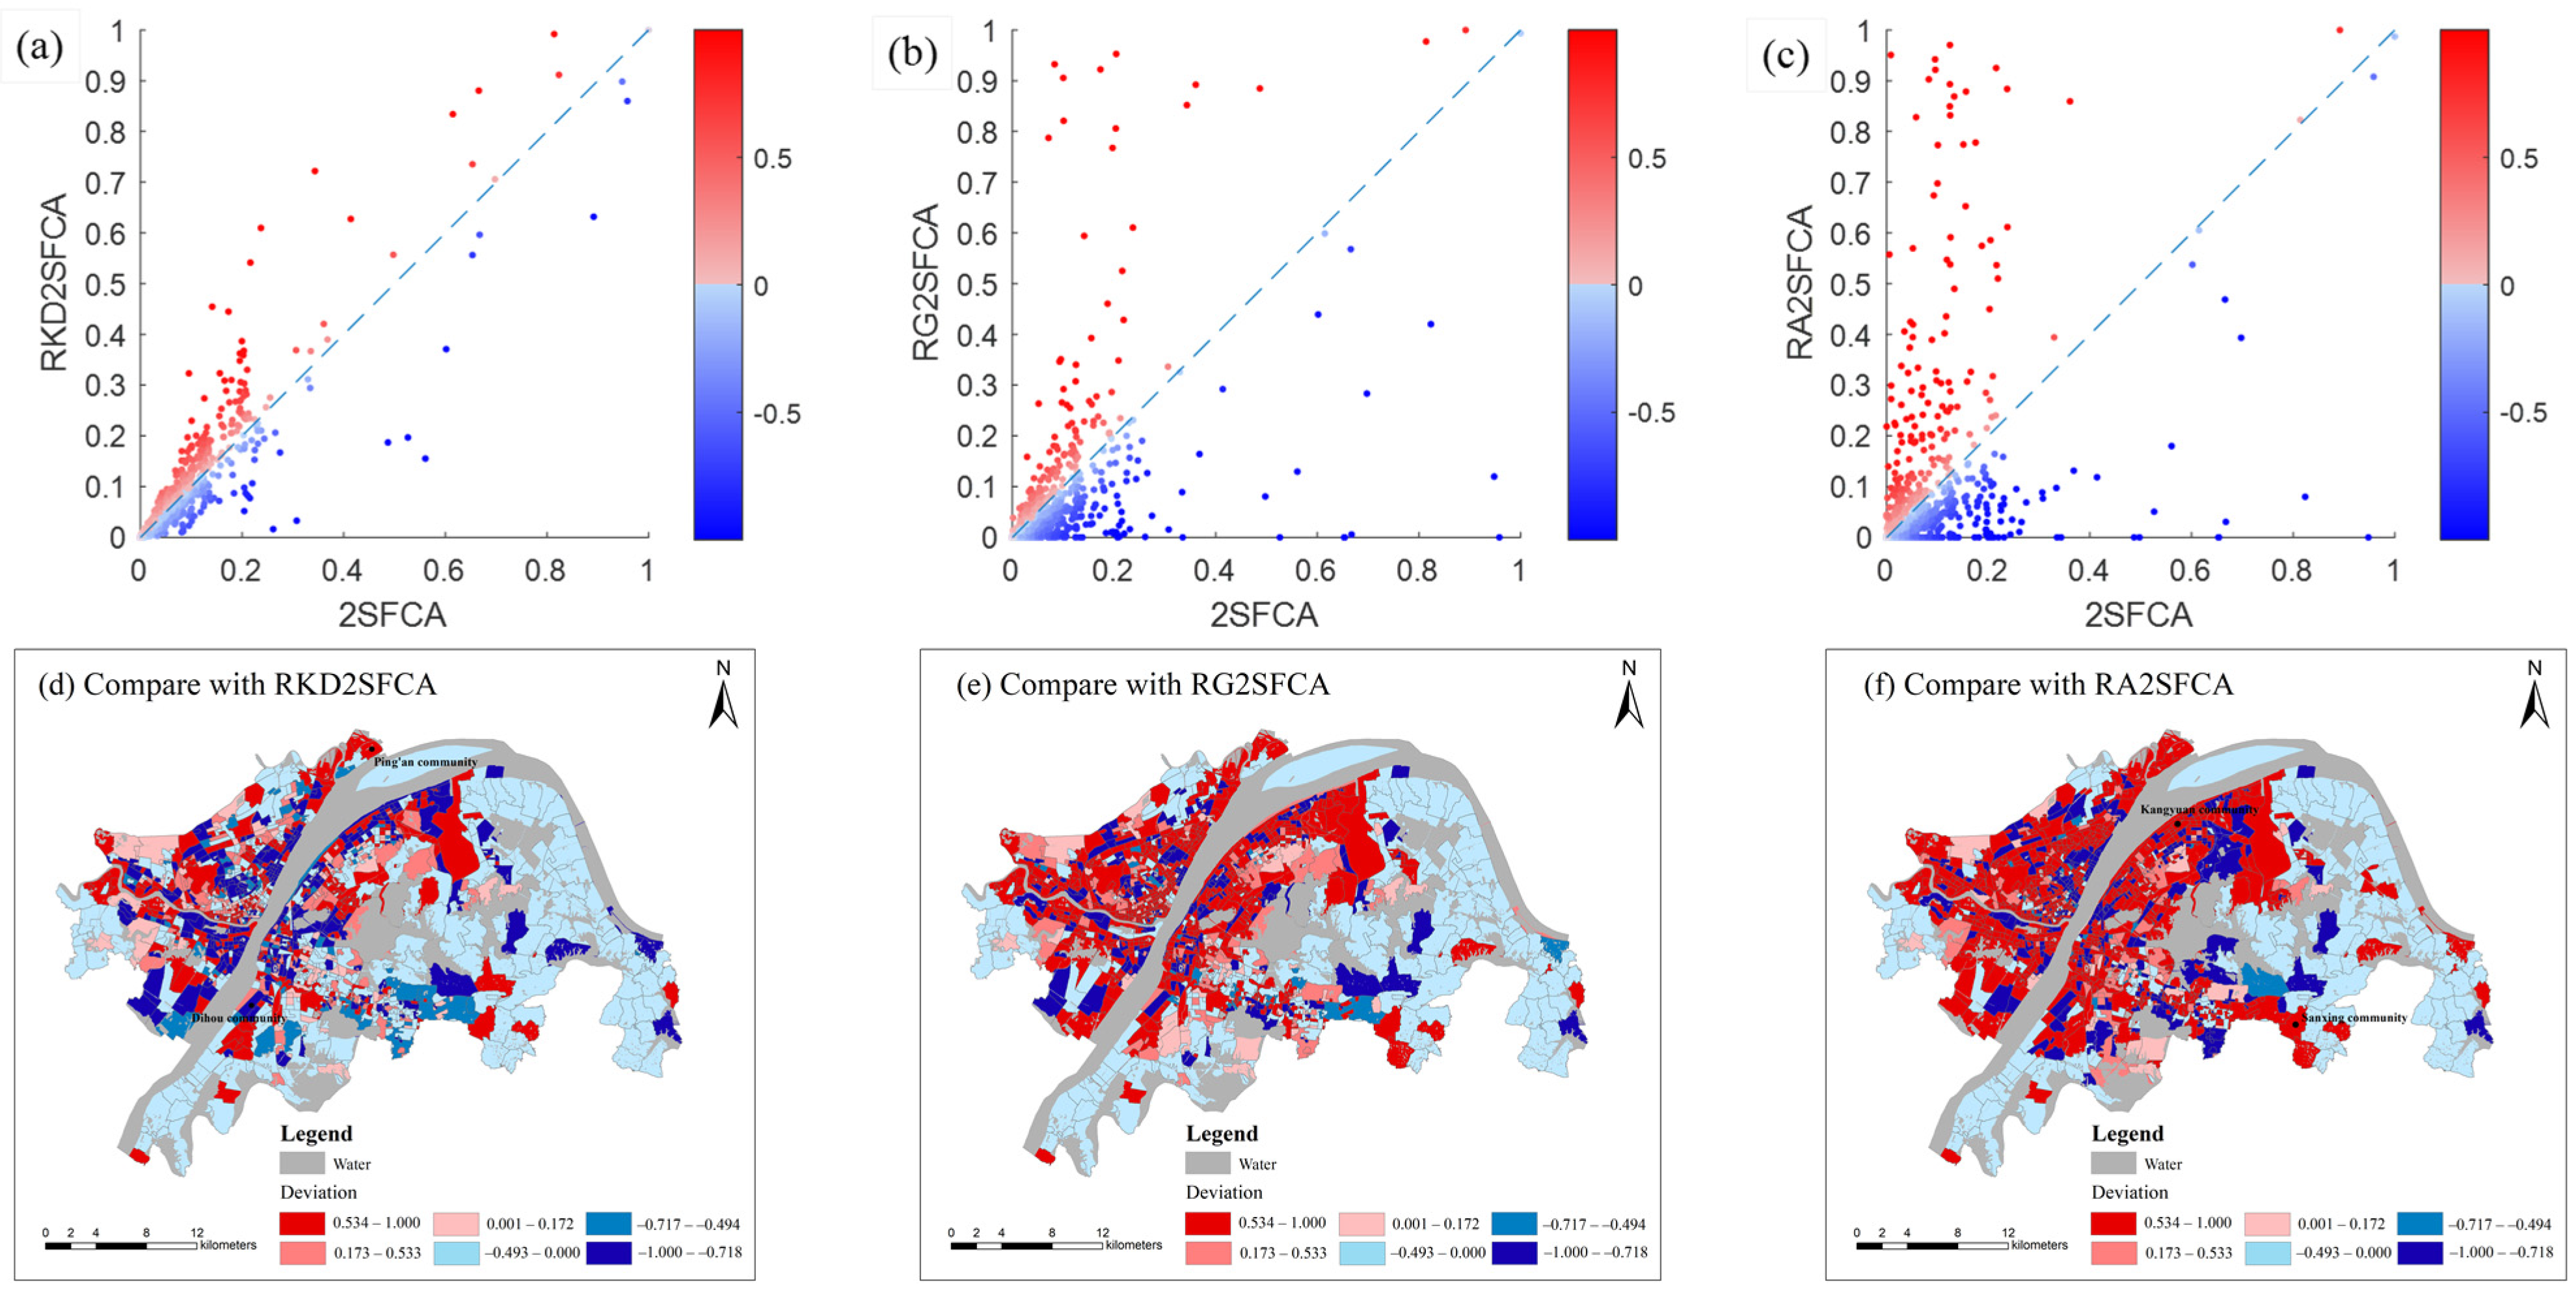
3.2. Comparison of Different Methods
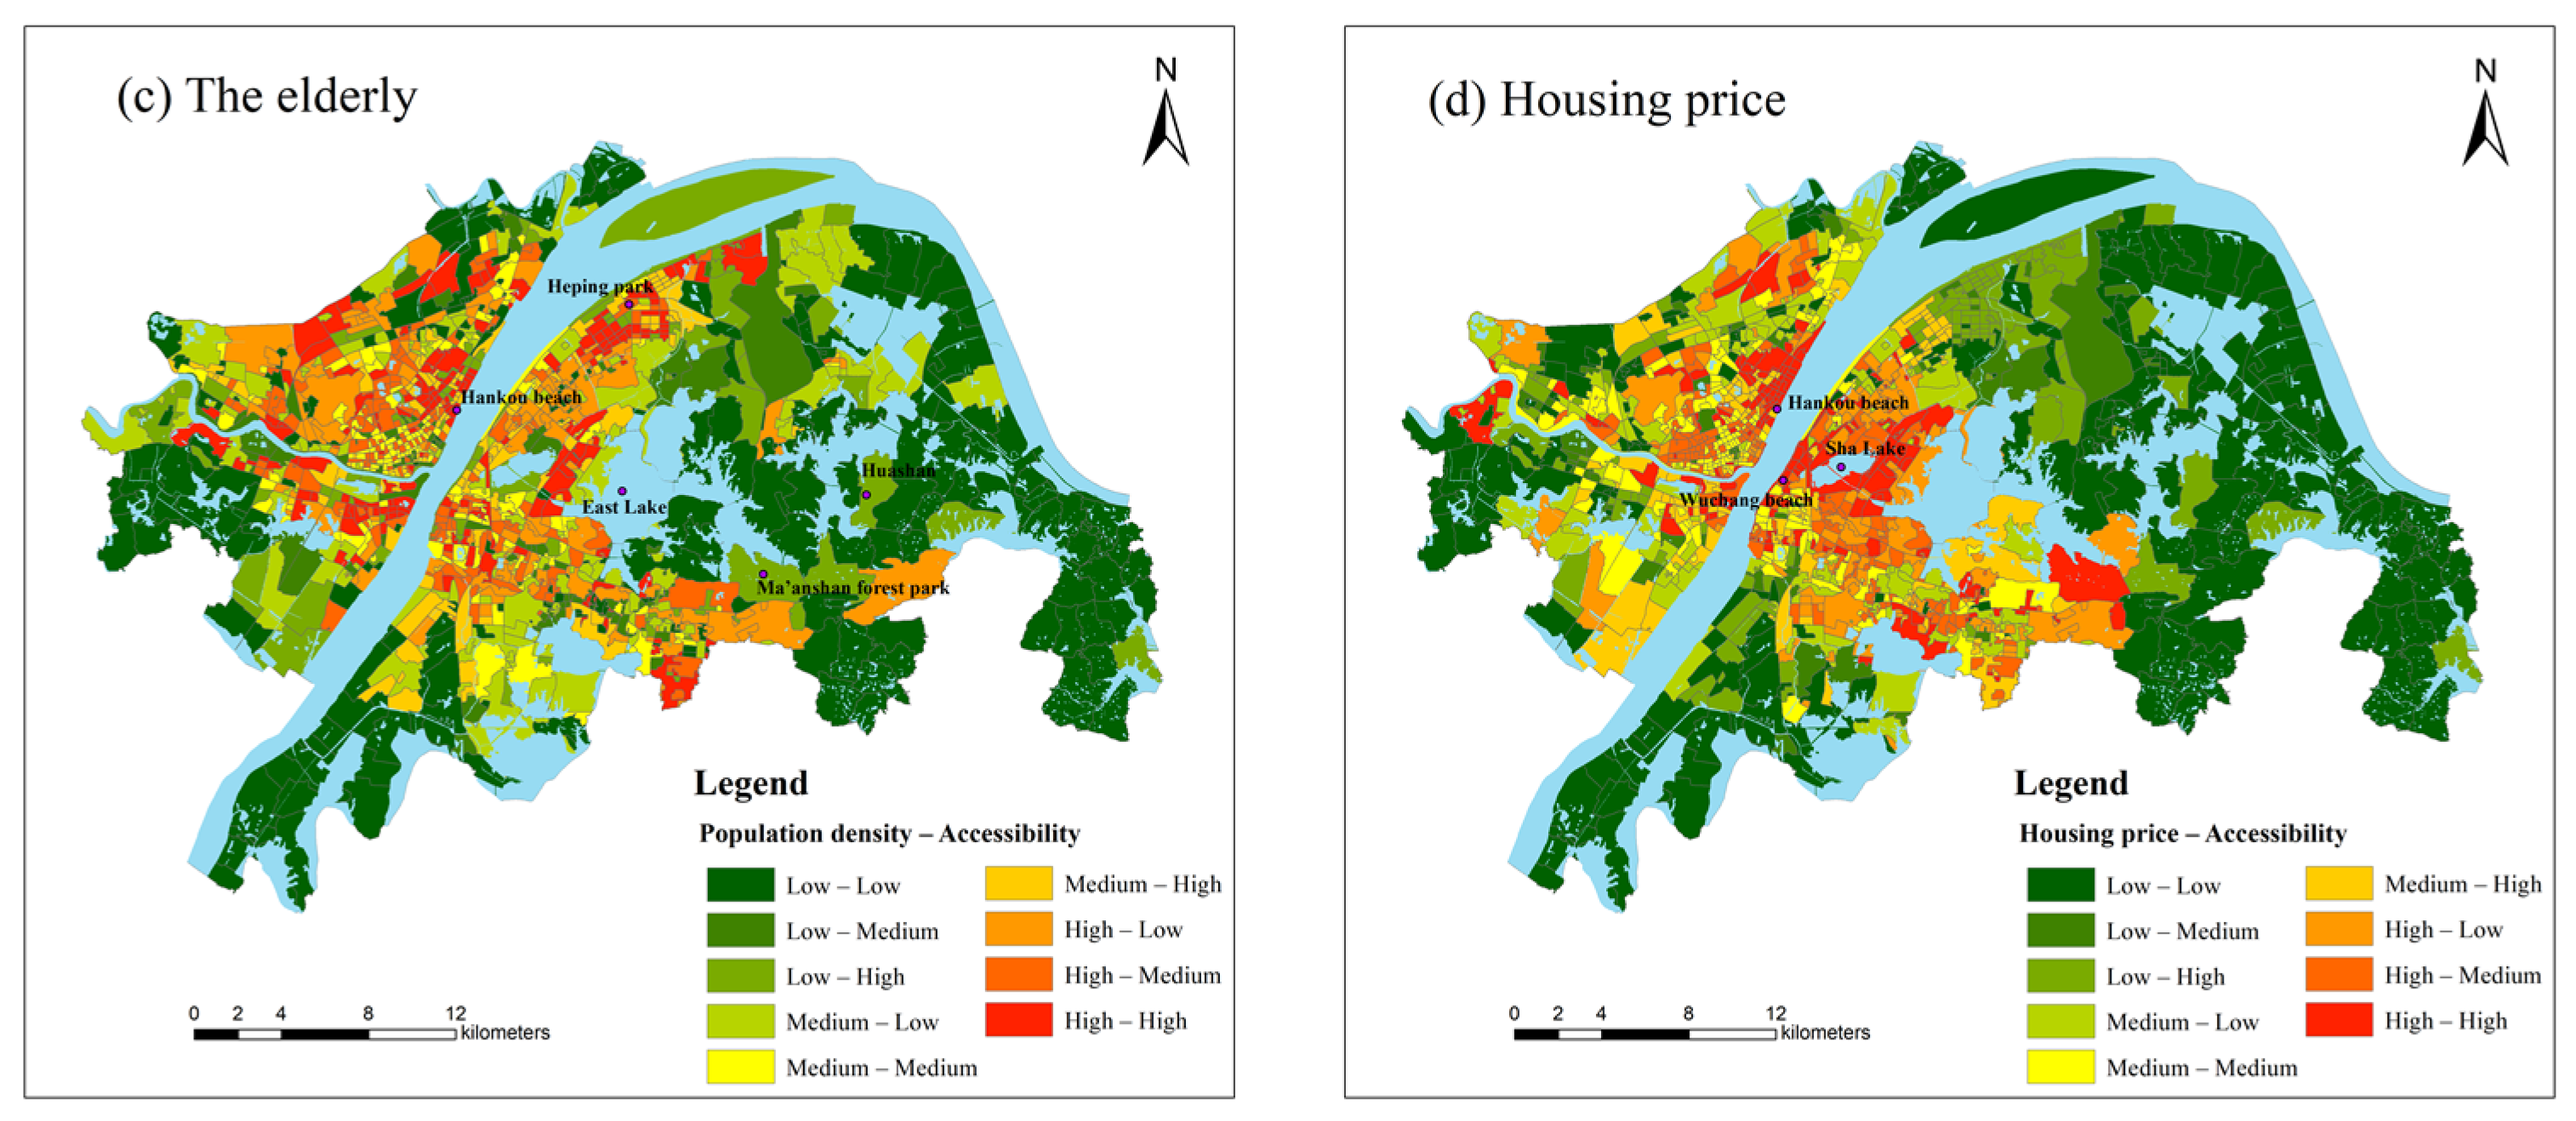
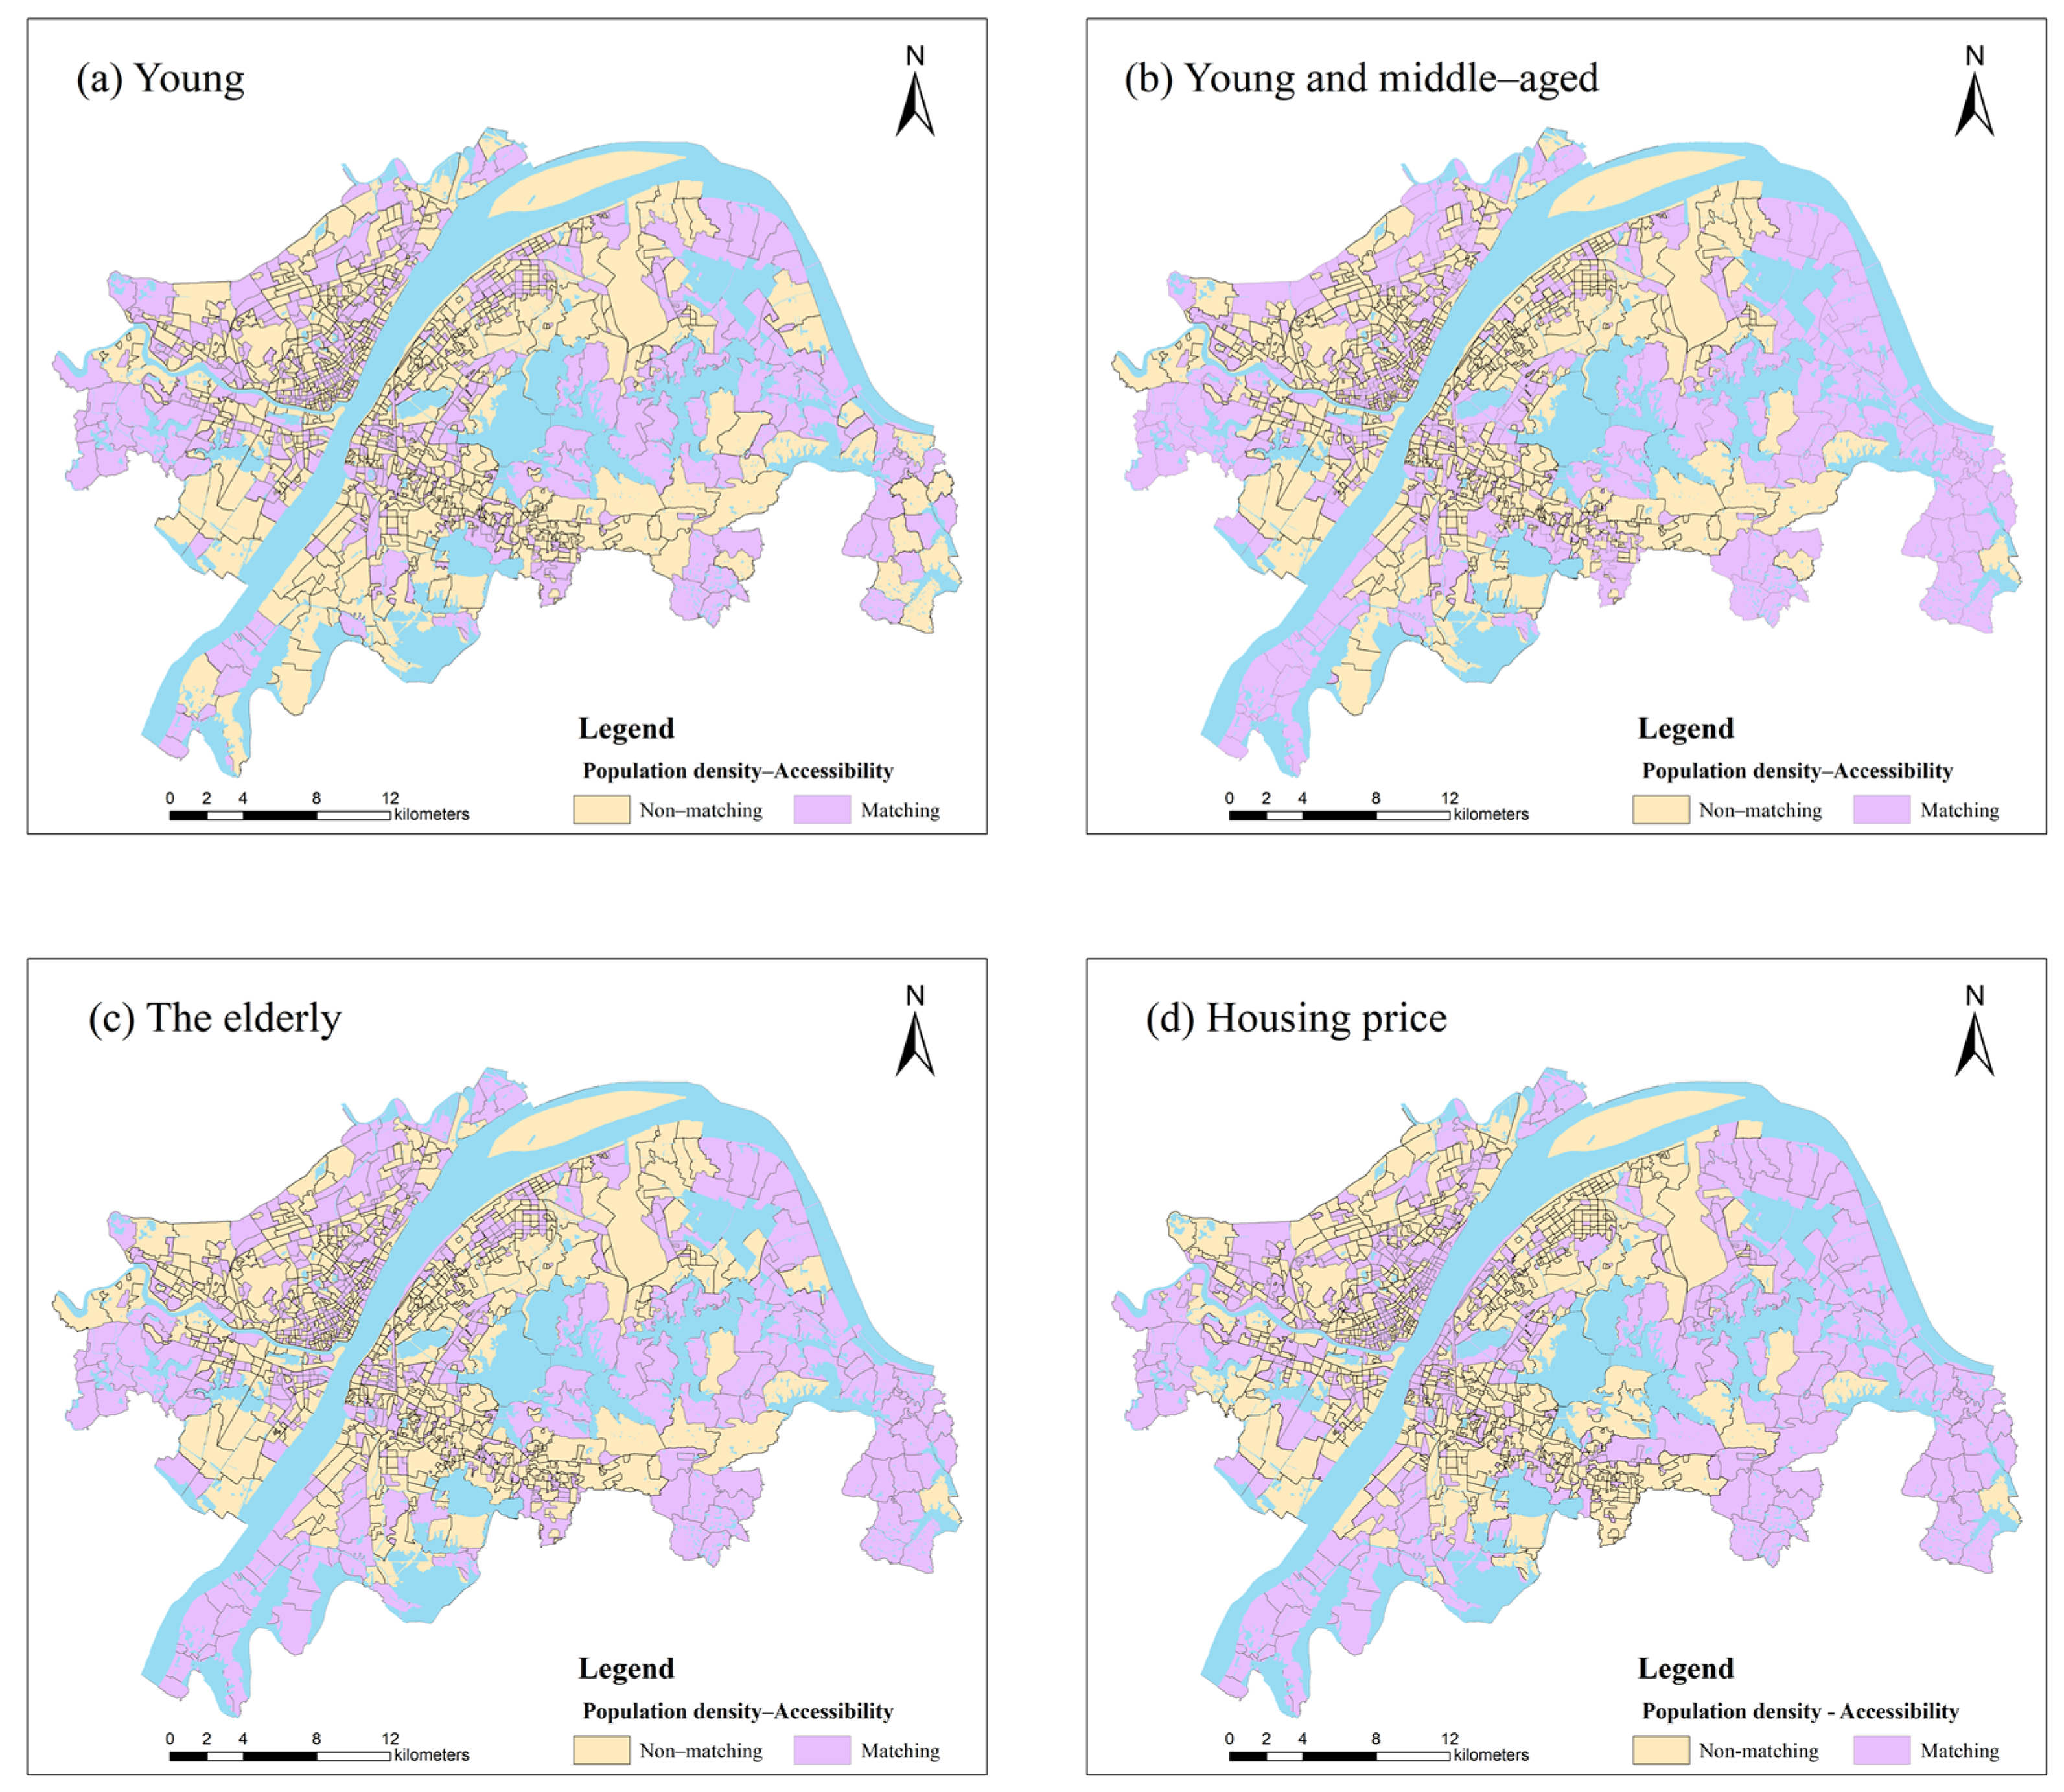
3.3. Spatial Equity of Park Green Space Distribution
4. Discussion
4.1. Park Green Space, Spatial Equity and Urban Planning
4.2. Limitations and Future Research
5. Conclusions
Author Contributions
Funding
Institutional Review Board Statement
Informed Consent Statement
Data Availability Statement
Conflicts of Interest
References
- United Nations. World Urbanization Prospects: The 2014 Revision, Highlights (ST/ESA/SER.A/352); United Nations: New York, NY, USA, 2014; ISBN 9789211515176. [Google Scholar]
- Alirol, E.; Getaz, L.; Stoll, B.; Chappuis, F.; Loutan, L. Urbanisation and Infectious Diseases in a Globalised World. Lancet Infect. Dis. 2011, 11, 131–141. [Google Scholar] [CrossRef]
- Liu, Y.; Wang, R.; Lu, Y.; Li, Z.; Chen, H.; Cao, M.; Zhang, Y.; Song, Y. Natural Outdoor Environment, Neighbourhood Social Cohesion and Mental Health: Using Multilevel Structural Equation Modelling, Streetscape and Remote-Sensing Metrics. Urban For. Urban Green. 2020, 48, 126576. [Google Scholar] [CrossRef]
- Brooks, S.K.; Webster, R.K.; Smith, L.E.; Woodland, L.; Wessely, S.; Greenberg, N.; Rubin, G.J. The Psychological Impact of Quarantine and How to Reduce It: Rapid Review of the Evidence. Lancet 2020, 395, 912–920. [Google Scholar] [CrossRef] [Green Version]
- Liu, K.; Chen, Y.; Lin, R.; Han, K. Clinical Features of COVID-19 in Elderly Patients: A Comparison with Young and Middle-Aged Patients. J. Infect. 2020, 80, 14–18. [Google Scholar] [CrossRef] [PubMed] [Green Version]
- Daoust, J.F. Elderly People and Responses to COVID-19 in 27 Countries. PLoS ONE 2020, 15, 0235590. [Google Scholar] [CrossRef] [PubMed]
- You, Y.; Pan, S. Urban Vegetation Slows down the Spread of Coronavirus Disease (COVID-19) in the United States. Geophys. Res. Lett. 2020, 47, e2020GL089286. [Google Scholar] [CrossRef]
- Jefferies, T.; Cheng, J.; Coucill, L. Lockdown Urbanism: COVID-19 Lifestyles and Liveable Futures Opportunities in Wuhan and Manchester. Cities Health 2020, 1–4. [Google Scholar] [CrossRef]
- Venter, Z.S.; Barton, D.N.; Gundersen, V.; Figari, H.; Nowell, M. Urban Nature in a Time of Crisis: Recreational Use of Green Space Increases during the COVID-19 Outbreak in Oslo, Norway. Environ. Res. Lett. 2020, 15, 104075. [Google Scholar] [CrossRef]
- Byrne, J.; Wolch, J. Nature, Race, and Parks: Past Research and Future Directions for Geographic Research. Prog. Hum. Geogr. 2009, 33, 743–765. [Google Scholar] [CrossRef] [Green Version]
- Sen, S.; Guchhait, S.K. Urban Green Space in India: Perception of Cultural Ecosystem Services and Psychology of Situatedness and Connectedness. Ecol. Indic. 2021, 123, 107338. [Google Scholar] [CrossRef]
- Sugiyama, T.; Leslie, E.; Giles-Corti, B.; Owen, N. Associations of Neighbourhood Greenness with Physical and Mental Health: Do Walking, Social Coherence and Local Social Interaction Explain the Relationships? J. Epidemiol. Community Health 2008, 62, 9. [Google Scholar] [CrossRef] [PubMed] [Green Version]
- Douglas, O.; Lennon, M.; Scott, M. Green Space Benefits for Health and Well-Being: A Life-Course Approach for Urban Planning, Design and Management. Cities 2017, 66, 53–62. [Google Scholar] [CrossRef] [Green Version]
- Fan, P.; Xu, L.; Yue, W.; Chen, J. Accessibility of Public Urban Green Space in an Urban Periphery: The Case of Shanghai. Landsc. Urban Plan. 2017, 165, 177–192. [Google Scholar] [CrossRef]
- Liu, Y.; He, Z.; Zhou, X. Space-Time Variation and Spatial Differentiation of COVID-19 Confirmed Cases in Hubei Province Based on Extended GWR. ISPRS Int. J. Geo-Inf. 2020, 9, 536. [Google Scholar] [CrossRef]
- Gao, J.; Zheng, P.; Jia, Y.; Chen, H.; Mao, Y.; Chen, S.; Wang, Y.; Fu, H.; Dai, J. Mental Health Problems and Social Media Exposure during COVID-19 Outbreak. PLoS ONE 2020, 15, 0231924. [Google Scholar] [CrossRef]
- United Nations. Transforming Our World: The 2030 Agenda for Sustainable Development; United Nations: New York, NY, USA, 2018. [Google Scholar]
- Hansen, W.G. How Accessibility Shapes Land Use. J. Am. Plan. Assoc. 1959, 25, 73–76. [Google Scholar] [CrossRef]
- Pirie, G.H. Measuring Accessibility: A Review and Proposal. Environ. Plan. A Econ. Sp. 1979, 11, 299–312. [Google Scholar] [CrossRef]
- Geurs, K.; Halden, D. Accessibility: Theory and Practice in the Netherlands and UK. In Handbook on Transport and Development; Edward Elgar Publishing: Trotterham, UK, 2015; ISBN 9780857937261. [Google Scholar]
- Kurowska, K.; Adamska-Kmieć, D.; Kowalczyk, C.; Leń, P. Communication Value of Urban Space in the Urban Planning Process on the Example of a Polish City. Cities 2021, 116, 103282. [Google Scholar] [CrossRef]
- Talen, E.; Anselin, L. Assessing Spatial Equity: An Evaluation of Measures of Accessibility to Public Playgrounds. Environ. Plan. A 1998, 30, 595–613. [Google Scholar] [CrossRef] [Green Version]
- Mahmud, A.; Aljunid, S.M. Availability and Accessibility of Subsidized Mammogram Screening Program in Peninsular Malaysia: A Preliminary Study Using Travel Impedance Approach. PLoS ONE 2018, 13, 0191764. [Google Scholar] [CrossRef] [Green Version]
- Le Texier, M.; Schiel, K.; Caruso, G. The Provision of Urban Green Space and Its Accessibility: Spatial Data Effects in Brussels. PLoS ONE 2018, 13, 0204684. [Google Scholar] [CrossRef] [PubMed]
- Yin, C.; He, Q.; Liu, Y.; Chen, W.; Gao, Y. Inequality of Public Health and Its Role in Spatial Accessibility to Medical Facilities in China. Appl. Geogr. 2018, 92, 50–62. [Google Scholar] [CrossRef]
- Bao, K.Y.; Tong, D.; Plane, D.A.; Buechler, S. Urban Food Accessibility and Diversity: Exploring the Role of Small Non-Chain Grocers. Appl. Geogr. 2020, 125, 102275. [Google Scholar] [CrossRef]
- Boisjoly, G.; Serra, B.; Oliveira, G.; El-Geneidy, A. Inequity in Transit: Evaluating Public Transport Distribution through Accessibility Measurements in São Paulo, Rio de Janeiro, Curitiba and Recife, Brazil. J. Transp. Geogr. 2020, 82, 102551. [Google Scholar] [CrossRef]
- Radke, J.; Mu, L. Spatial Decompositions, Modeling and Mapping Service Regions to Predict Access to Social Programs. Geogr. Inf. Sci. 2000, 6, 105–112. [Google Scholar] [CrossRef]
- Luo, W.; Whippo, T. Variable Catchment Sizes for the Two-Step Floating Catchment Area (2SFCA) Method. Health Place 2012, 18, 789–795. [Google Scholar] [CrossRef] [PubMed]
- McGrail, M.R.; Humphreys, J.S. Measuring Spatial Accessibility to Primary Health Care Services: Utilising Dynamic Catchment Sizes. Appl. Geogr. 2014, 54, 182–188. [Google Scholar] [CrossRef]
- Luo, W.; Qi, Y. An Enhanced Two-Step Floating Catchment Area (E2SFCA) Method for Measuring Spatial Accessibility to Primary Care Physicians. Health Place 2009, 15, 1100–1107. [Google Scholar] [CrossRef]
- Dai, D. Racial/Ethnic and Socioeconomic Disparities in Urban Green Space Accessibility: Where to Intervene? Landsc. Urban Plan. 2011, 102, 234–244. [Google Scholar] [CrossRef]
- Delamater, P.L. Spatial Accessibility in Suboptimally Configured Health Care Systems: A Modified Two-Step Floating Catchment Area (M2SFCA) Metric. Health Place 2013, 24, 30–43. [Google Scholar] [CrossRef]
- Webber, M.M. Planning in an Environment of Change Part II: Permissive Planning. Town Plan. Rev. 1969, 39, 277. [Google Scholar] [CrossRef]
- Miller, H.J. Measuring Space-Time Accessibility Benefits within Transportation Networks: Basic Theory and Computational Procedures. Geogr. Anal. 1999, 31, 187–212. [Google Scholar] [CrossRef]
- Järv, O.; Tenkanen, H.; Salonen, M.; Ahas, R.; Toivonen, T. Dynamic Cities: Location-Based Accessibility Modelling as a Function of Time. Appl. Geogr. 2018, 95, 101–110. [Google Scholar] [CrossRef]
- de la Barrera, F.; Rubio, P.; Banzhaf, E. The Value of Vegetation Cover for Ecosystem Services in the Suburban Context. Urban For. Urban Green. 2016, 16, 110–122. [Google Scholar] [CrossRef]
- Wolff, M.; Scheuer, S.; Haase, D. Looking beyond Boundaries: Revisiting the Rural-Urban Interface of Green Space Accessibility in Europe. Ecol. Indic. 2020, 113, 106245. [Google Scholar] [CrossRef]
- Xu, C.; Haase, D.; Pribadi, D.O.; Pauleit, S. Spatial Variation of Green Space Equity and Its Relation with Urban Dynamics: A Case Study in the Region of Munich. Ecol. Indic. 2018, 93, 512–523. [Google Scholar] [CrossRef]
- Li, X.; Huang, Y.; Ma, X. Evaluation of the Accessible Urban Public Green Space at the Community-Scale with the Consideration of Temporal Accessibility and Quality. Ecol. Indic. 2021, 131, 108231. [Google Scholar] [CrossRef]
- Kronenberg, J.; Haase, A.; Łaszkiewicz, E.; Antal, A.; Baravikova, A.; Biernacka, M.; Dushkova, D.; Filčak, R.; Haase, D.; Ignatieva, M.; et al. Environmental Justice in the Context of Urban Green Space Availability, Accessibility, and Attractiveness in Postsocialist Cities. Cities 2020, 106, 102862. [Google Scholar] [CrossRef]
- Pereira, R.H.M.; Karner, A. Transportation Equity. In International Encyclopedia of Transportation; Elsevier: Amsterdam, The Netherlands, 2021; pp. 271–277. [Google Scholar] [CrossRef]
- Luo, W.; Wang, F. Measures of Spatial Accessibility to Health Care in a GIS Environment: Synthesis and a Case Study in the Chicago Region. Environ. Plan. B Plan. Des. 2003, 30, 865–884. [Google Scholar] [CrossRef] [Green Version]
- Polzin, P.; Borges, J.; Coelho, A. An Extended Kernel Density Two-Step Floating Catchment Area Method to Analyze Access to Health Care. Environ. Plann. B Plann. Des. 2014, 41, 717–735. [Google Scholar] [CrossRef]
- Dai, D. Black Residential Segregation, Disparities in Spatial Access to Health Care Facilities, and Late-Stage Breast Cancer Diagnosis in Metropolitan Detroit. Health Place 2010, 16, 1038–1052. [Google Scholar] [CrossRef] [PubMed]
- Kanuganti, S.; Sarkar, A.K.; Singh, A.P. Evaluation of Access to Health Care in Rural Areas Using Enhanced Two-Step Floating Catchment Area (E2SFCA) Method. J. Transp. Geogr. 2016, 56, 45–52. [Google Scholar] [CrossRef]
- Soh, Y.; Hae, Y.; Mehmood, A.; Hadi Ashraf, R.; Kim, I. Performance Evaluation of Various Functions for Kernel Density Estimation. Open J. Appl. Sci. 2013, 03, 58–64. [Google Scholar] [CrossRef] [Green Version]
- He, H.; Pan, J.; Lu, N.; Chen, B.; Jiao, R. Short-Term Load Probabilistic Forecasting Based on Quantile Regression Convolutional Neural Network and Epanechnikov Kernel Density Estimation. Energy Rep. 2020, 6, 1550–1556. [Google Scholar] [CrossRef]
- Reggiani, A.; Bucci, P.; Russo, G. Accessibility and Impedance Forms: Empirical Applications to the German Commuting Network. Int. Reg. Sci. Rev. 2011, 34, 230–252. [Google Scholar] [CrossRef] [Green Version]
- Siegel, M.; Koller, D.; Vogt, V.; Sundmacher, L. Developing a Composite Index of Spatial Accessibility across Different Health Care Sectors: A German Example. Health Policy 2016, 120, 205–212. [Google Scholar] [CrossRef] [PubMed]
- Zhou, X.; Yu, Z.; Yuan, L.; Wang, L.; Wu, C. Measuring Accessibility of Healthcare Facilities for Populations with Multiple Transportation Modes Considering Residential Transportation Mode Choice. Int. J. Geo-Inf. 2020, 9, 394. [Google Scholar] [CrossRef]
- Gastwirth, J.L. The Estimation of the Lorenz Curve and Gini Index. Rev. Econ. Stat. 1972, 54, 306. [Google Scholar] [CrossRef]
- Branko Milanovic A Simple Way to Calculate the Gini Coefficient, and Some Implications. Econ. Lett. 1997, 56, 45–49. [CrossRef]
- Ode, Å.; Fry, G. A Model for Quantifying and Predicting Urban Pressure on Woodland. Landsc. Urban Plan. 2006, 77, 17–27. [Google Scholar] [CrossRef]
- Dzhambov, A.; Hartig, T.; Markevych, I.; Tilov, B.; Dimitrova, D. Urban Residential Greenspace and Mental Health in Youth: Different Approaches to Testing Multiple Pathways Yield Different Conclusions. Environ. Res. 2018, 160, 47–59. [Google Scholar] [CrossRef] [PubMed]
- Boelhouwer, P. The Role of Government and Financial Institutions during a Housing Market Crisis: A Case Study of the Netherlands. Int. J. Hous. Policy 2017, 17, 591–602. [Google Scholar] [CrossRef] [Green Version]
- Trojanek, R.; Gluszak, M.; Tanas, J. The Effect of Urban Green Spaces on House Prices in Warsaw. Int. J. Strateg. Prop. Manag. 2018, 22, 358–371. [Google Scholar] [CrossRef]
- Xu, C.; Haase, D.; Pauleit, S. The Impact of Different Urban Dynamics on Green Space Availability: A Multiple Scenario Modeling Approach for the Region of Munich, Germany. Ecol. Indic. 2018, 93, 1–12. [Google Scholar] [CrossRef]
- D’alessandro, D.; Gola, M.; Appolloni, L.; Dettori, M.; Fara, G.M.; Rebecchi, A.; Settimo, G.; Capolongo, S. COVID-19 and Living Space Challenge. Well-Being and Public Health Recommendations for a Healthy, Safe, and Sustainable Housing. Acta Biomed. 2020, 91, 61–75. [Google Scholar] [CrossRef]
- Wu, L.; Kim, S.K. Exploring the Equality of Accessing Urban Green Spaces: A Comparative Study of 341 Chinese Cities. Ecol. Indic. 2021, 121, 107080. [Google Scholar] [CrossRef]
- Rigolon, A. A Complex Landscape of Inequity in Access to Urban Parks: A Literature Review. Landsc. Urban Plan. 2016, 153, 160–169. [Google Scholar] [CrossRef]
- Park, Y.; Guldmann, J.M. Understanding Disparities in Community Green Accessibility under Alternative Green Measures: A Metropolitan-Wide Analysis of Columbus, Ohio, and Atlanta, Georgia. Landsc. Urban Plan. 2020, 200, 103806. [Google Scholar] [CrossRef]
- Assari, S. Unequal Gain of Equal Resources across Racial Groups. Int. J. Health Policy Manag. 2018, 7, 1–9. [Google Scholar] [CrossRef] [Green Version]
- Durrant, D. Infrastructure, Equity and Urban Planning: A Just Process for the Allocation of Benefits and Burdens; Springer: Cham, Switzerland, 2017. [Google Scholar]
- Pitarch-Garrido, M.D. Social Sustainability in Metropolitan Areas: Accessibility and Equity in the Case of the Metropolitan Area of Valencia (Spain). Sustainability 2018, 10, 371. [Google Scholar] [CrossRef] [Green Version]
- Ugolini, F.; Massetti, L.; Calaza-martínez, P.; Cari, P.; Dobbs, C.; Ostoi, S.K.; Marin, A.M.; Pearlmutter, D.; Simoneti, M.; Verli, A.; et al. Effects of the COVID-19 Pandemic on the Use and Perceptions of Urban Green Space: An International Exploratory Study. Urban For. Urban Green. 2020, 56, 126888. [Google Scholar] [CrossRef] [PubMed]
- Wangchuk, D.; Turner, M. Aligning Top-down and Bottom-up in Development Planning: The Case of Bhutan. Public Adm. Dev. 2019, 39, 59–68. [Google Scholar] [CrossRef]
- Viitanen, J.; Kingston, R. Smart Cities and Green Growth: Outsourcing Democratic and Environmental Resilience to the Global Technology Sector. Environ. Plan. A 2014, 46, 803–819. [Google Scholar] [CrossRef] [Green Version]
- Artmann, M.; Kohler, M.; Meinel, G.; Gan, J.; Ioja, I.C. How Smart Growth and Green Infrastructure Can Mutually Support Each Other—A Conceptual Framework for Compact and Green Cities. Ecol. Indic. 2019, 96, 10–22. [Google Scholar] [CrossRef]
- Wang, K.; Liu, J. The Spatiotemporal Trend of City Parks in Mainland China between 1981 and 2014: Implications for the Promotion of Leisure Time Physical Activity and Planning. Int. J. Environ. Res. Public Health 2017, 14, 1150. [Google Scholar] [CrossRef] [Green Version]
- Lin, W.; Chen, Q.; Jiang, M.; Zhang, X.; Liu, Z.; Tao, J.; Wu, L.; Xu, S.; Kang, Y.; Zeng, Q. The Effect of Green Space Behaviour and per Capita Area in Small Urban Green Spaces on Psychophysiological Responses. Landsc. Urban Plan. 2019, 192, 103637. [Google Scholar] [CrossRef]
- Chen, M.; Gong, Y.; Lu, D.; Ye, C. Build a People-Oriented Urbanization: China’s New-Type Urbanization Dream and Anhui Model. Land Use Policy 2019, 80, 1–9. [Google Scholar] [CrossRef]
- Hamstead, Z.A.; Fisher, D.; Ilieva, R.T.; Wood, S.A.; McPhearson, T.; Kremer, P. Geolocated Social Media as a Rapid Indicator of Park Visitation and Equitable Park Access. Comput. Environ. Urban Syst. 2018, 72, 38–50. [Google Scholar] [CrossRef]
- Li, A.N.G.; Yang, Q. Urban Park and Aging People in China: A New Challenge from Old People’s “Parents Blind Date”. WIT Trans. Built Environ. 2018, 179, 123–132. [Google Scholar]
- Yang, Q.; Li, A.; Wang, L. Urban Park’s Impact on Older Migrant Parents’ Well-Being in China: A Case Study of Shanghai. Int. J. Sustain. Dev. Plan. 2019, 14, 319–332. [Google Scholar] [CrossRef]
- Babalis, D. A New Typology of Pocket Parks: Inspiring Small Spaces for Changing Cities. Proc. Inst. Civ. Eng. Urban Des. Plan. 2020, 173, 108–117. [Google Scholar] [CrossRef]
- Sun, Y.; Shao, Y. Measuring Visitor Satisfaction toward Peri-Urban Green and Open Spaces Based on Social Media Data. Urban For. Urban Green. 2020, 53, 126709. [Google Scholar] [CrossRef]
- Wu, W.; Dong, G.; SUN, Y.; Yun, Y. Contextualized Effects of Park Access and Usage on Residential Satisfaction: A Spatial Approach. Land Use Policy 2020, 94, 104532. [Google Scholar] [CrossRef]
- Yu, P.; Fennell, S.; Chen, Y.; Liu, H.; Xu, L.; Pan, J.; Bai, S.; Gu, S. Positive Impacts of Farmland Fragmentation on Agricultural Production Efficiency in Qilu Lake Watershed: Implications for Appropriate Scale Management. Land Use Policy 2022, 117, 106108. [Google Scholar] [CrossRef]


| Methods | 2SFCA | RKD2SFCA | RG2SFCA | RA2SFCA | |||||
|---|---|---|---|---|---|---|---|---|---|
| Districts | Value | Rank | Value | Rank | Value | Rank | Value | Rank | |
| Qingshan | 0.093 | 1 | 0.099 | 2 | 0.089 | 2 | 0.097 | 2 | |
| Hanyang | 0.088 | 2 | 0.102 | 1 | 0.090 | 1 | 0.098 | 1 | |
| Jiang’an | 0.062 | 3 | 0.067 | 3 | 0.042 | 4 | 0.078 | 3 | |
| Wuchang | 0.058 | 4 | 0.059 | 4 | 0.049 | 3 | 0.059 | 4 | |
| Hongshan | 0.051 | 5 | 0.050 | 5 | 0.039 | 5 | 0.042 | 5 | |
| Qiaokou | 0.039 | 6 | 0.038 | 6 | 0.028 | 6 | 0.039 | 6 | |
| Jianghan | 0.030 | 7 | 0.032 | 7 | 0.023 | 7 | 0.031 | 7 | |
| High Pdi-High Ai | High Pdi-Low Ai | Low Pdi-Low Ai | Low Pdi-High Ai | ||
|---|---|---|---|---|---|
| Youth | Number of communities | 143 | 142 | 186 | 100 |
| Proportion of communities | 12.08% | 12.00% | 15.71% | 8.45% | |
| Population proportion | 21.35% | 29.61% | 3.45% | 1.92% | |
| Young and middle-aged | Number of communities | 133 | 136 | 211 | 100 |
| Proportion of communities | 11.23% | 11.49% | 17.82% | 8.45% | |
| Population proportion | 19.36% | 25.93% | 4.82% | 2.32% | |
| Elderly | Number of communities | 162 | 104 | 220 | 91 |
| Proportion of communities | 13.68% | 8.78% | 18.58% | 7.69% | |
| Population proportion | 24.38% | 17.19% | 4.84% | 1.80% |
| Association | High Hpi-High Ai | High Hpi-Low Ai | Low Hpi-Low Ai | Low Hpi-High Ai |
|---|---|---|---|---|
| Number of communities | 143 | 103 | 224 | 115 |
| Proportion of communities | 12.08% | 8.70% | 18.92% | 9.71% |
| Population proportion | 13.24% | 12.65% | 12.83% | 8.82% |
Publisher’s Note: MDPI stays neutral with regard to jurisdictional claims in published maps and institutional affiliations. |
© 2022 by the authors. Licensee MDPI, Basel, Switzerland. This article is an open access article distributed under the terms and conditions of the Creative Commons Attribution (CC BY) license (https://creativecommons.org/licenses/by/4.0/).
Share and Cite
Zhang, S.; Yu, P.; Chen, Y.; Jing, Y.; Zeng, F. Accessibility of Park Green Space in Wuhan, China: Implications for Spatial Equity in the Post-COVID-19 Era. Int. J. Environ. Res. Public Health 2022, 19, 5440. https://doi.org/10.3390/ijerph19095440
Zhang S, Yu P, Chen Y, Jing Y, Zeng F. Accessibility of Park Green Space in Wuhan, China: Implications for Spatial Equity in the Post-COVID-19 Era. International Journal of Environmental Research and Public Health. 2022; 19(9):5440. https://doi.org/10.3390/ijerph19095440
Chicago/Turabian StyleZhang, Shujin, Peiheng Yu, Yiyun Chen, Ying Jing, and Fanxin Zeng. 2022. "Accessibility of Park Green Space in Wuhan, China: Implications for Spatial Equity in the Post-COVID-19 Era" International Journal of Environmental Research and Public Health 19, no. 9: 5440. https://doi.org/10.3390/ijerph19095440
APA StyleZhang, S., Yu, P., Chen, Y., Jing, Y., & Zeng, F. (2022). Accessibility of Park Green Space in Wuhan, China: Implications for Spatial Equity in the Post-COVID-19 Era. International Journal of Environmental Research and Public Health, 19(9), 5440. https://doi.org/10.3390/ijerph19095440