
Mercury and Arsenic Discharge from Circumneutral Waters Associated with the Former Mining Area of Abbadia San Salvatore (Tuscany, Central Italy)

 ,
,  , ,
, ,  , ,
, , 
Abstract
:
1. Introduction
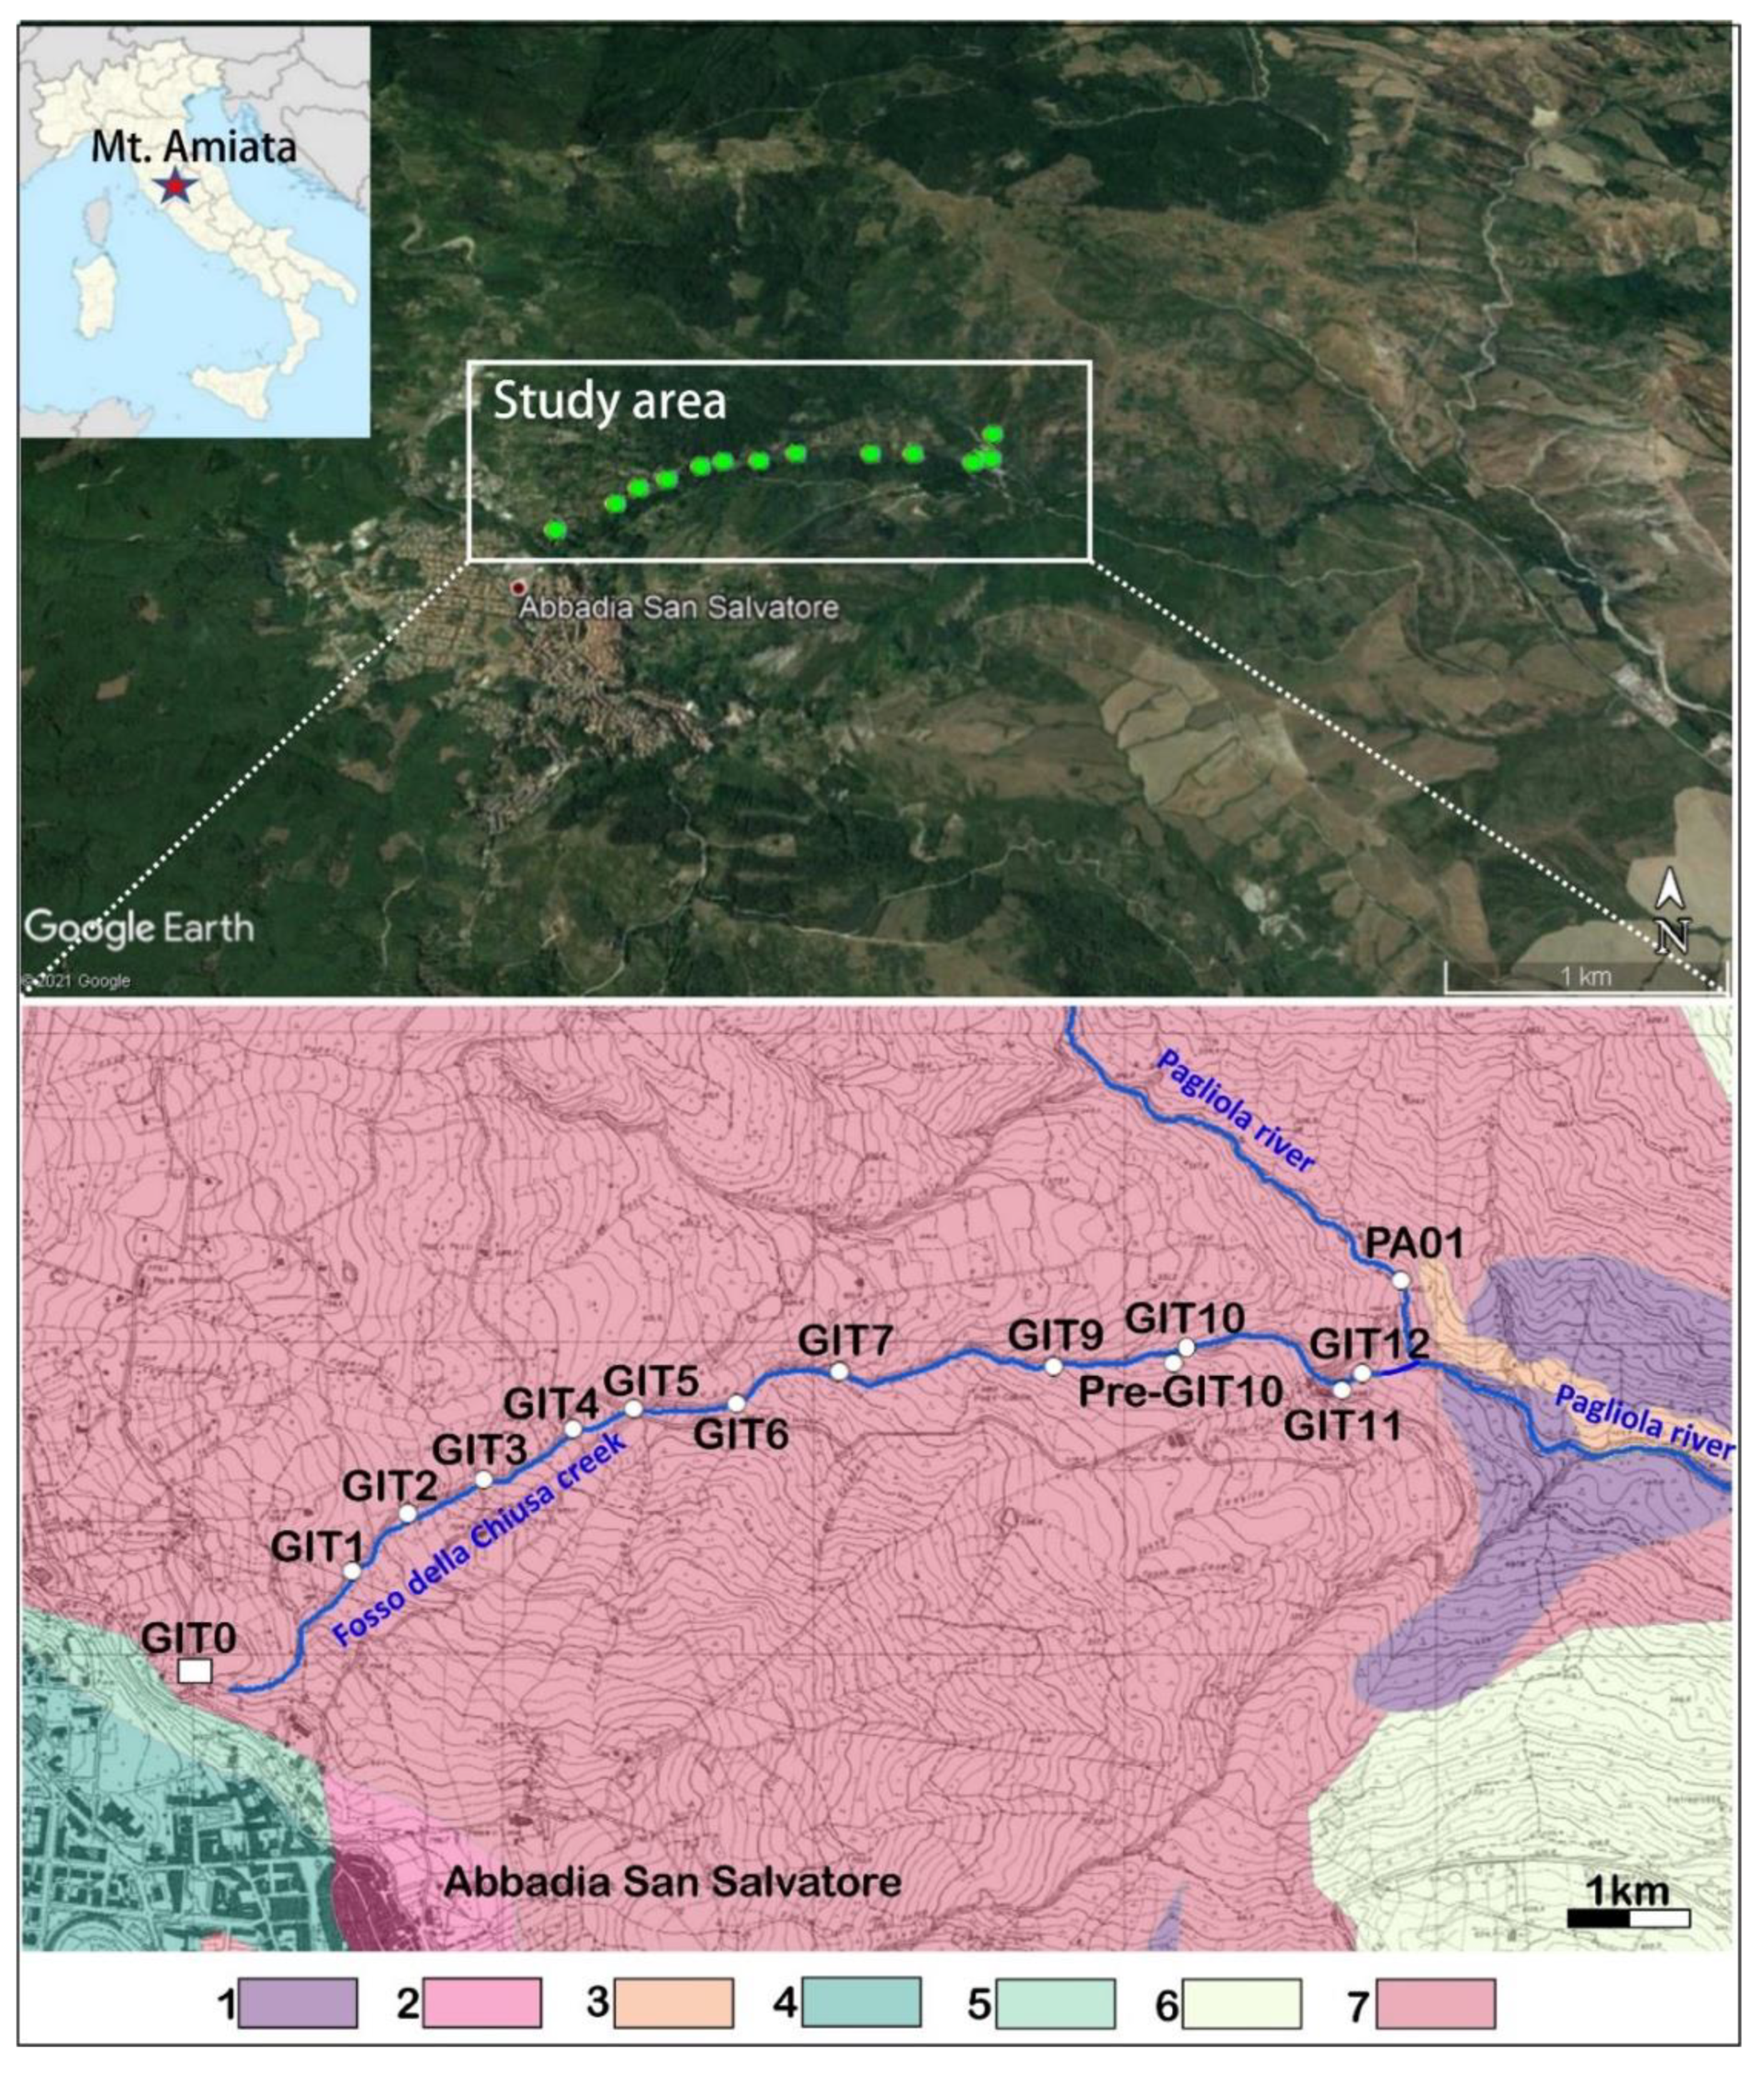
2. Geo-Morphological and Hydrological Settings of Fosso della Chiusa Creek
3. Materials and Methods
3.1. Sampling Procedures
3.2. Analytical Methods
4. Results
4.1. Water Chemical and Isotopic Composition
4.2. StS and TSS
5. Discussion
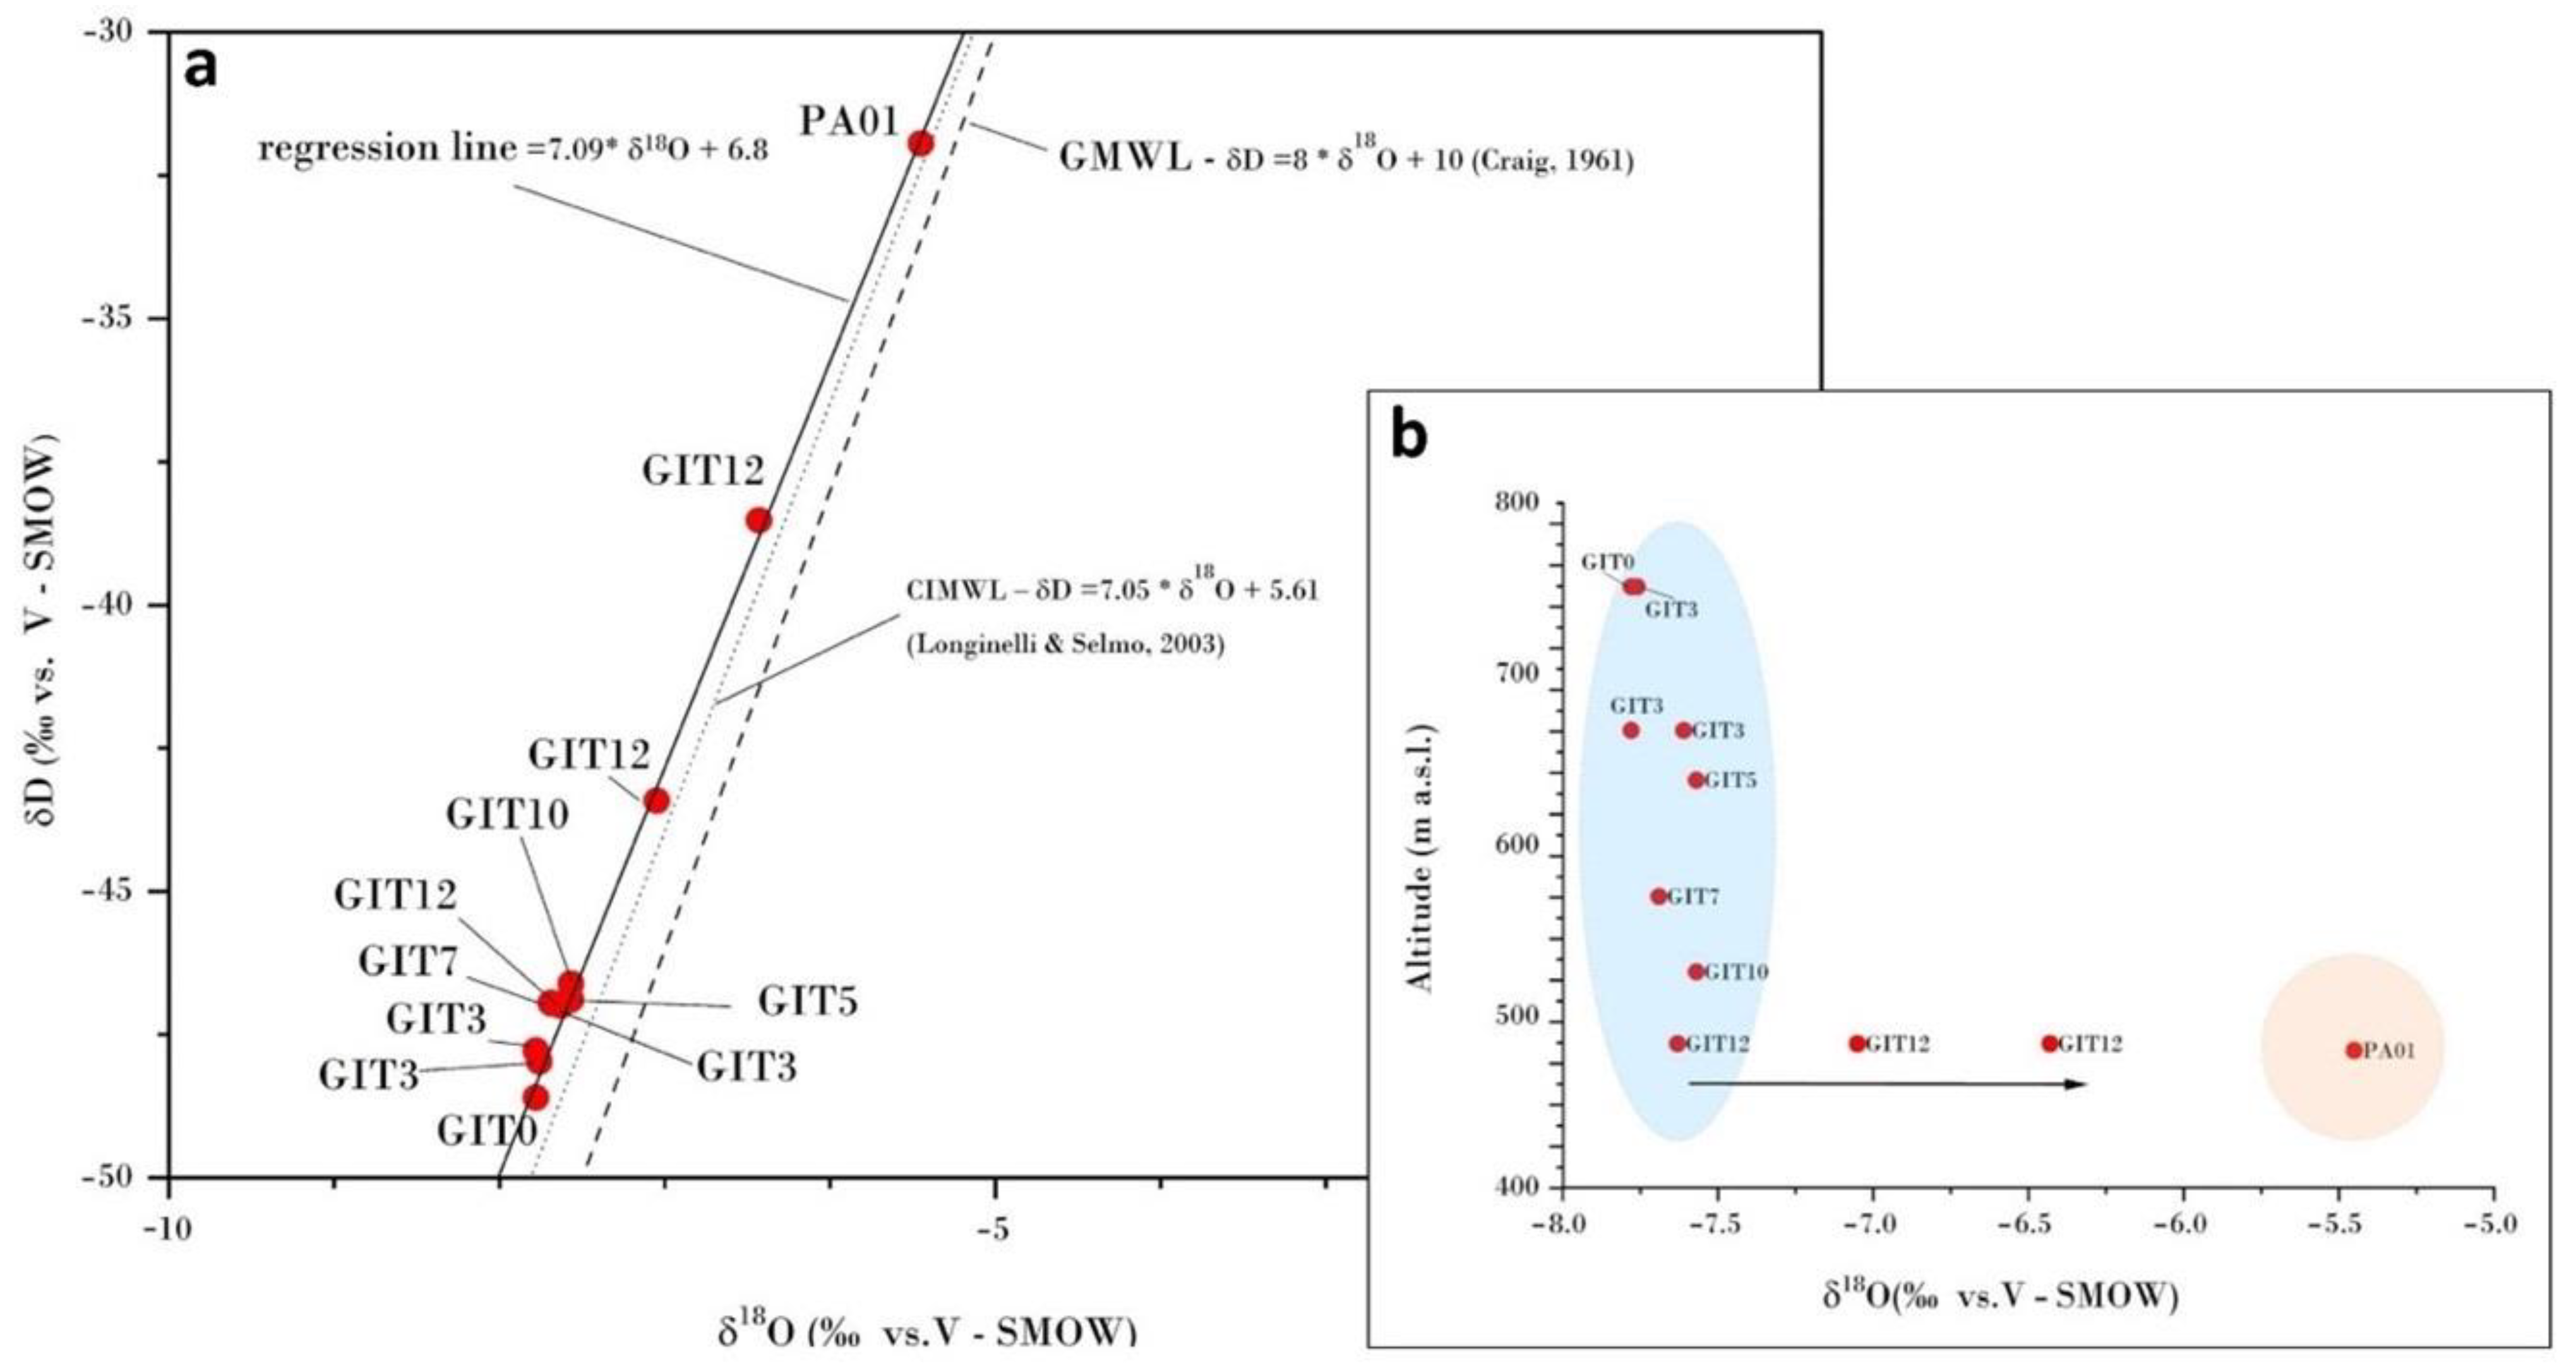
5.1. Water Characterization and Isotopic Fingerprint Using δ18O, δD and δ34S
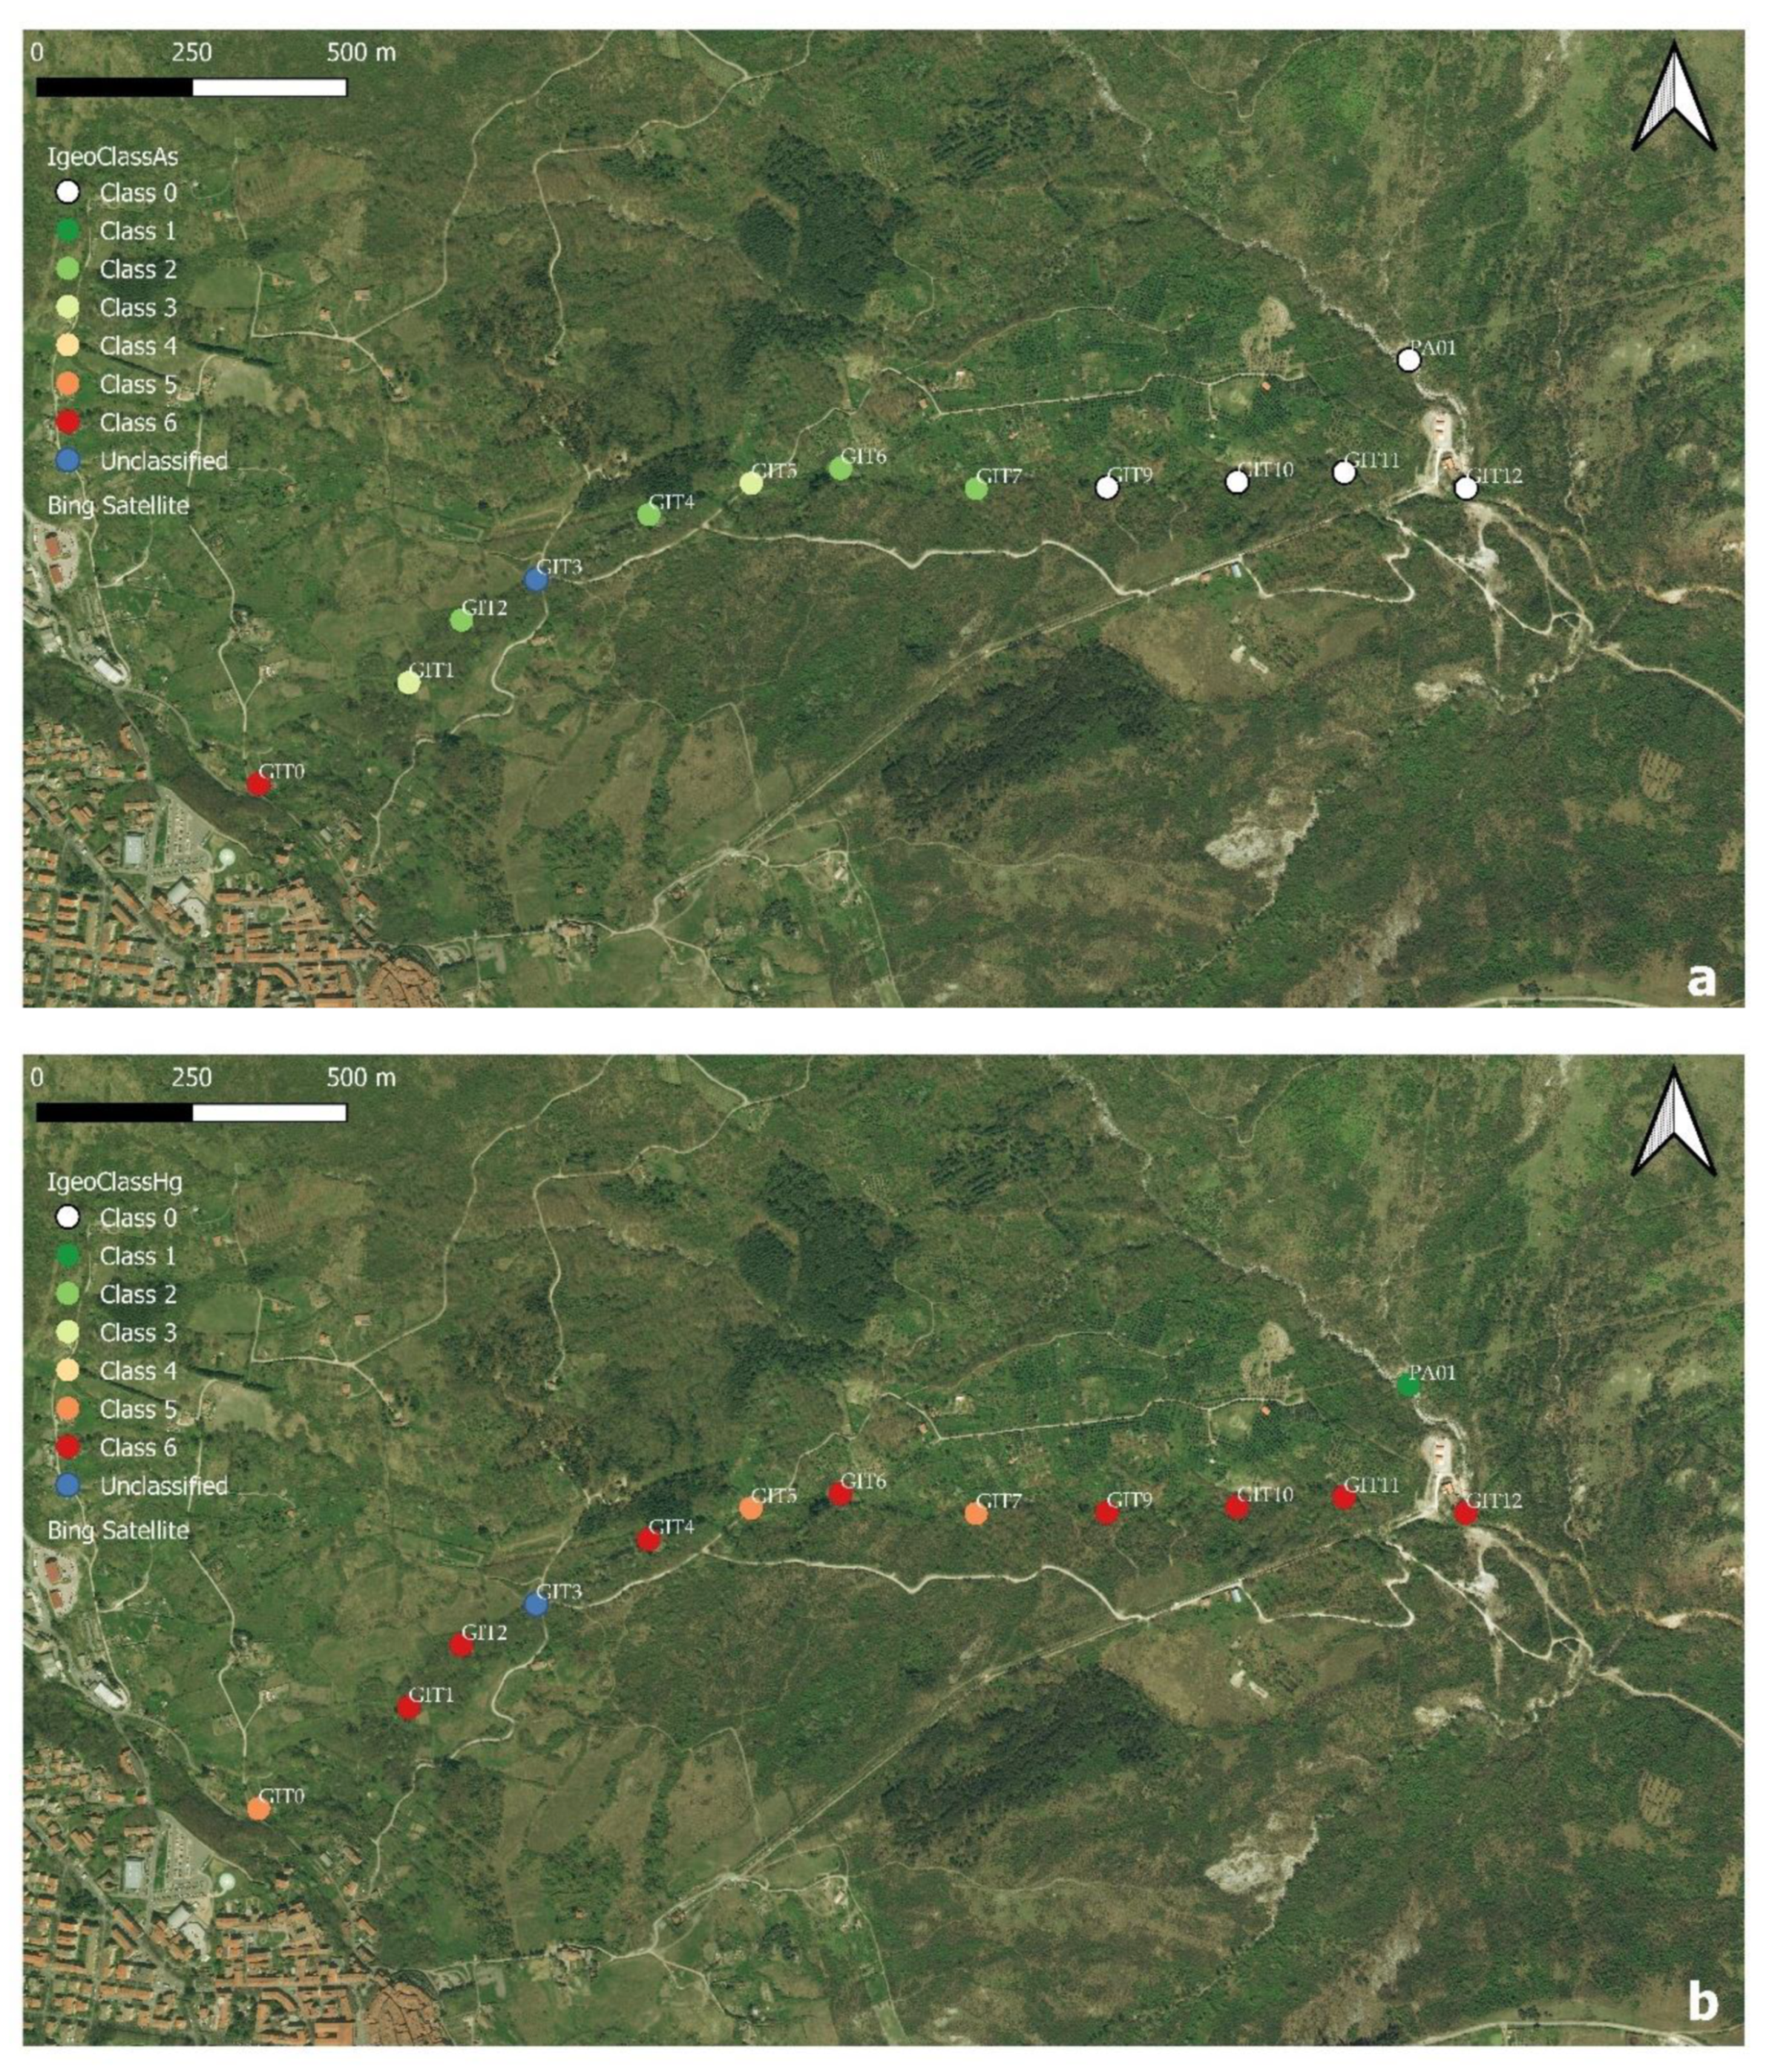
5.2. Geoaccumulation Index (Igeo)
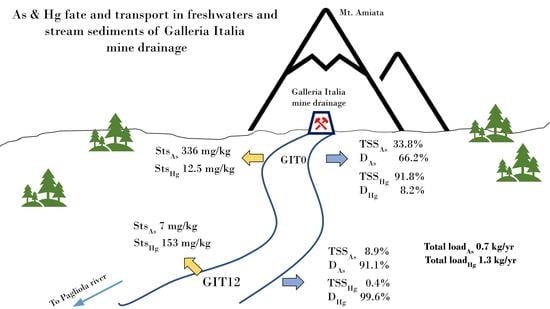
5.3. Partition Coefficients (log-Kd) and Yearly Estimate Mass Load of As and Hg
5.4. Yearly Estimate Mass Load of As and Hg
6. Conclusions
Author Contributions
Funding
Institutional Review Board Statement
Informed Consent Statement
Data Availability Statement
Acknowledgments
Conflicts of Interest
References
- Morteani, G.; Ruggieri, G.; Möller, P.; Preinfalk, C. Geothermal mineralized scales in the pipe system of the geothermal Pian-castagnaio power plant (Monte Amiata geothermal area): A key to understand the stibnite, cinnabarite and gold mineralization of Tuscany (central Italy). Miner. Dep. 2010, 46, 197–210. [Google Scholar] [CrossRef]
- Higueras, P.; Oyarzun, R.; Lillo, J.; Morata, D. Intraplate mafic magmatism, degasification, and deposition of mercury: The giant Almadén mercury deposit (Spain) revisited. Ore Geol. Rev. 2013, 51, 93–102. [Google Scholar] [CrossRef] [Green Version]
- Strappa, O. Storia delle miniere di mercurio del M. Amiata. Ind. Min. 1977, 28, 252–259. [Google Scholar]
- Dini, A. Miniere e minerali del Distretto mercurifero del Monte Amiata. In Il Vulcano di Monte Amiata; Principe, C., Lavorini, G., Vezzoli, L., Eds.; Edizioni Scientifiche e Artistiche: Naples, Italy, 2017; pp. 343–369. [Google Scholar]
- Laznicka, P. Giant Metallic Deposits: Future Sources of Industrial Metals; Springer Science & Business Media: Berlin/Heidelberg, Germany, 2006; pp. 251–298. [Google Scholar]
- Lotti, B. I giacimenti cinabriferi ed antimonferi della Toscana e la loro relazione con le rocce eruttive quaternarie. Rass. Miner. 1901, 7, 117–119. [Google Scholar]
- Lotti, B. I Depositi dei Minerali Metalliferi: Guida allo Studio e alla Ricerca dei Giacimenti Metalliferi con Speciali Esemplificazioni di Giacimenti Italiani; Unione Tipografico-Editrice: Torino, Italy, 1903. [Google Scholar]
- Tanelli, G.; Lattanzi, P. Pyritic ores of southern Tuscany, Italy. Geol. Soc. S. Afr. Spec. Publ. 1983, 7, 315–323. [Google Scholar]
- Rimondi, V.; Chiarantini, L.; Lattanzi, P.; Benvenuti, M.; Beutel, M.; Venturi, S.; Colica, A.; Costagliola, P.; Gabbani, G.; Gray, J.E.; et al. Metallogeny, exploitation and environmental impact of the Mt. Amiata mercury ore district (Southern Tuscany, Italy). Ital. J. Geosci. 2015, 134, 323–336. [Google Scholar] [CrossRef]
- De Castro, C. Le Miniere di Mercurio del Monte Amiata; Cecchini, L., Ed.; R. Ufficio Geologico: Rome, Italy, 1914. (In Italian) [Google Scholar]
- Elter, P. Geologia della regione di Castell’Azzara a sud del Monte Amiata (Grosseto). Boll. Soc. Geol. It. 1955, 74, 317–337. [Google Scholar]
- Zucchetti, S. Giacimenti minerari: I giacimenti mercuriferi secondari della Toscana e l’età della locale metallogenesi. Rend. Accad. Naz. Lincei 1964, 36, 658–668. [Google Scholar]
- Sammarco, O. Abandoning mines: Hydrodynamic evolution controlled in order to avoid surface damage. Mine Water Environ. 1990, 9, 277–289. [Google Scholar] [CrossRef]
- Vaselli, O.; Nisi, B.; Rappuoli, D.; Bianchi, F.; Cabassi, J.; Venturi, S.; Tassi, F.; Raco, B. Geochemical characterization of the ground waters from the former Hg-mining area of Abbadia San Salvatore (Mt. Amiata, central Italy): Criticalities and perspectives for the reclamation process. Ital. J. Geosci. 2015, 134, 304–322. [Google Scholar] [CrossRef]
- Vaselli, O.; Rappuoli, D.; Nisi, B.; Bianchi, F.; Tassi, F.; Cabassi, J.; Giannini, L.; Magi, F.; Capecchiacci, F.; Maddii, V. Geochimica delle acque di Galleria Italia (Abbadia San Salvatore, Siena). In Il Vulcano di Monte Amiata; Principe, C., Lavorini, G., Vezzoli, L., Eds.; Edizioni Scientifiche e Artistiche: Naples, Italy, 2017; pp. 283–302. [Google Scholar]
- Belmer, N.; Tippler, C.; Davies, P.J.; Wright, I. Impact of a coal mine waste discharge on water quality and aquatic ecosystems in the Blue Mountains World Heritage Area. In Proceedings of the 7th Australian Stream Management Conference, Townsville, Australia, 27–30 July 2014. [Google Scholar]
- Navarro, A. Hydrogeochemistry of circum-neutral mine waters in the Anglès old mining area, North Eastern Spain. In Ad-vances in Hydrogeochemistry Research; Eslamian, S.S., Eslamian, F., Eds.; Nova Science Publishers: New York, NY, USA, 2020; pp. 1–21. [Google Scholar]
- Vaselli, O.; Lazzaroni, M.; Nisi, B.; Cabassi, J.; Tassi, F.; Rappuoli, D.; Meloni, F. Discontinuous Geochemical Monitoring of the Galleria Italia Circumneutral Waters (Former Hg-Mining Area of Abbadia San Salvatore, Tuscany, Central Italy) Feeding the Fosso Della Chiusa Creek. Environments 2021, 8, 15. [Google Scholar] [CrossRef]
- Muller, G. Schwermetalle in den sediments des Rheins-Veranderungen seitt 1971. Umschan 1979, 79, 778–783. [Google Scholar]
- Marroni, M.; Moratti, G.; Costantini, A.; Sandro, C.; Pandolfi, L.; Bonini, M.; Cornamusini, G.; Laurenzi, M.A. Geology of the Monte Amiata region, Southern Tuscany, Central Italy. Ital. J. Geosci. 2015, 134, 171–199. [Google Scholar] [CrossRef]
- Rimondi, V.; Costagliola, P.; Lattanzi, P.; Morelli, G.; Cara, G.; Cencetti, C.; Fagotti, C.; Fredduzzi, A.; Marchetti, G.; Sconocchia, A.; et al. A 200 km-long mercury contamination of the Paglia and Tiber floodplain: Monitoring results and implications for environmental management. Environ. Pollut. 2019, 255, 113191. [Google Scholar] [CrossRef] [PubMed]
- Lazzaroni, M.; Ceccatelli, M.; Rossato, L.; Nisi, B.; Venturi, S.; Fanti, R.; Tassi, F.; Vaselli, O. Boron pollution in the shallow groundwater system from Isola di Castelluccio (central-eastern, Tuscany): Evidences from a geochemical survey and new remediation perspectives from a recently-installed hydraulic barrier and hydrogeological modelling. Ital. J. Geosci. 2021, 140, 121–140. [Google Scholar] [CrossRef]
- Appelo, C.A.J.; Postma, D. Geochemistry, Groundwater and Pollution; CRC Press: Boca Raton, FL, USA, 2004; p. 683. [Google Scholar]
- Craig, H. Isotopic Variations in Meteoric Waters. Science 1961, 133, 1702–1703. [Google Scholar] [CrossRef]
- Longinelli, A.; Selmo, E. Isotopic composition of precipitation in Italy: A first overall map. J. Hydr. 2003, 270, 75–88. [Google Scholar]
- Spangenberg, J.E.; Lavrič, J.V.; Meisser, N.; Serneels, V. Sulfur isotope analysis of cinnabar from Roman wall paintings by elemental analysis/isotope ratio mass spectrometry—Tracking the origin of archaeological red pigments and their authenticity. Rapid Commun. Mass Spectrom. 2010, 24, 2812–2816. [Google Scholar] [CrossRef] [Green Version]
- Tsantini, E.; Minami, T.; Ontiveros, M.C.; Takahashi, K.; Melgarejo, J.C. Sulfur Isotope Analysis to Examine the Provenance of Cinnabar Used in Wall Paintings in the Roman domus Avinyó (Barcelona). Minerals 2021, 11, 6. [Google Scholar] [CrossRef]
- Müller, G. Schadstoffe in sedimenten-sedimente als schadstoffe. Mitt Osterr. Geol. Ges. 1986, 79, 107–126. [Google Scholar]
- Benvegnù, E.; Brondi, A.; Colica, A.; Conti, P.; Guasparri, G.; Polizzano, C.; Sabatini, G.; Tassoni, E. Studies of Migration Factors in Clay in Real Situation (Study of Fractures in Clays the Neogenic Basin of Siena); Commission of European Communities Report; EUR: Luxembourg, 1993; pp. 1–53. [Google Scholar]
- Baroni, F.; Protano, G.; Riccobono, F. Mercury Content of the Rocks of Tuscany. Atti Accad. Fisiocratici Siena 1994, 15, 59–67. [Google Scholar]
- Dall’Aglio, M.; Da Roit, R.; Orlandi, C.; Tonani, F. Prospezione Geochimica Del Mercurio. Ind. Min. 1966, 17, 391–398. [Google Scholar]
- Pattelli, G.; Rimondi, V.; Benvenuti, M.; Chiarantini, L.; Colica, A.; Costagliola, P.; Di Benedetto, F.; Lattanzi, P.; Paolieri, M.; Rinaldi, M. Effects of the November 2012 Flood Event on the Mobilization of Hg from the Mount Amiata Mining District to the Sediments of the Paglia River Basin. Minerals 2014, 4, 241–256. [Google Scholar] [CrossRef]
- Rimondi, V.; Bardelli, F.; Benvenuti, M.; Costagliola, P.; Gray, J.E.; Lattanzi, P. Mercury speciation in the Mt. Amiata mining district (Italy): Interplay between urban activities and mercury contamination. Chem. Geol. 2014, 380, 110–118. [Google Scholar] [CrossRef]
- Malm, O.; Pfeiffer, W.C.; Souza, C.M.M.; Reuter, R. Mercury pollution due to gold mining in the Madeira River basin. Braz. Ambio 1990, 19, 11–15. [Google Scholar]
- Wilken, R.D.; Hintelmann, H.; Edighaus, R. Biologische Quecksilberumsetzung in der Elbe Wasser. Vom Wass. Wein. 1990, 74, 383–392. [Google Scholar]
- Gosar, A.; Simon Pirc, B.; Milan Bidovec, A. Mercury in the Idrijca River sediments as a reflection of mining and smelting ac-tivities of the Idrija mercury mine. J. Geochem. Expl. 1997, 58, 125–131. [Google Scholar] [CrossRef]
- Dangić, A.; Dangić, J. Arsenic in the soil environment of central Balkan Peninsula, southeastern Europe: Occurrence, geochemistry, and impacts. Trace Met. Other Contam. Environ. 2007, 9, 207–236. [Google Scholar] [CrossRef]
- Oregon Health Authority. Health Consultation: Former Bonanza Mine Site. EPA FACILITY ID: ORN001001174; 2017; p. 60. Available online: https://www.atsdr.cdc.gov/HAC/pha/FormerBonanzaMineSite/Former_Bonanza_Mine_HC_508.pdf (accessed on 20 September 2021).
- Ernst, R.D. Post-Removal Assessment Report Bonanza Mine Site Sutherlin, Oregon; 15052-01/Task 4; Oregon Department of Environmental Quality (ODEQ): Douglas County, OR, USA; Hart Crowser Inc.: Burlington, MA, USA, 2005; p. 100. [Google Scholar]
- Hissler, C.; Probst, J.-L. Chlor-alkali industrial contamination and riverine transport of mercury: Distribution and partitioning of mercury between water, suspended matter, and bottom sediment of the Thur River, France. Appl. Geochem. 2006, 21, 1837–1854. [Google Scholar] [CrossRef] [Green Version]
- Lovley, D.R.; Phillips, E.J.P. Availability of Ferric Iron for Microbial Reduction in Bottom Sediments of the Freshwater Tidal Potomac River. Appl. Environ. Microbiol. 1986, 52, 751–757. [Google Scholar] [CrossRef] [Green Version]
- Kanel, S.R.; Manning, B.; Charlet, L.; Choi, H. Removal of Arsenic(III) from Groundwater by Nanoscale Zero-Valent Iron. Environ. Sci. Technol. 2005, 39, 1291–1298. [Google Scholar] [CrossRef] [PubMed]
- Chowdhury, S.R.; Yanful, E.K.; Pratt, A.R. Arsenic removal from aqueous solutions by mixed magnetite–maghemite nanoparticles. Env. E. Sc. 2011, 64, 411–423. [Google Scholar] [CrossRef]
- Barron, A.; Sun, J.; Passaretti, S.; Sbarbati, C.; Barbieri, M.; Colombani, N.; Jamieson, J.; Bostick, B.C.; Zheng, Y.; Mastrocicco, M.; et al. In situ arsenic immobilisation for coastal aquifers using stimulated iron cycling: Lab-based viability assessment. Appl. Geochem. 2022, 136, 105155. [Google Scholar] [CrossRef] [PubMed]
- Širca, A.; Rajar, R.; Harris, R.C.; Horvat, M. Mercury transport and fate in the Gulf of Trieste (Northern Adriatic)—A two-dimensional modelling approach. Environ. Model. Softw. 1999, 14, 645–655. [Google Scholar] [CrossRef]
- Thomas, M.A.; Conaway, C.H.; Steding, D.J.; Marvin-DiPasquale, M.; Abu-Saba, K.E.; Flegal, A.R. Mercury contamination from historic mining in water and sediment, Guadalupe River and San Francisco Bay, California. Geochem. Expl. Env. A. 2002, 2, 211–217. [Google Scholar] [CrossRef]
- Gray, J.E.; Hines, M.E.; Krabbenhoft, D.P.; Thoms, B. Methylation of Hg downstream from the Bonanza Hg mine, Oregon. Appl. Geochem. 2012, 27, 106–114. [Google Scholar] [CrossRef]
- Ganguli, P.M.; Mason, R.P.; Abu-Saba, K.E.; Anderson, R.S.; Flegal, A.R. Mercury Speciation in Drainage from the New Idria Mercury Mine, California. Environ. Sci. Technol. 2000, 34, 4773–4779. [Google Scholar] [CrossRef]
- David, N.; McKee, L.J.; Black, F.J.; Flegal, A.R.; Conaway, C.H.; Schoellhamer, D.H.; Ganju, N.K. Mercury concentrations and loads in a large river system tributary to San Francisco Bay, California, USA. Environ. Toxicol. Chem. 2009, 28, 2091–2100. [Google Scholar] [CrossRef] [Green Version]


| Sample ID | Sampling Date | Distance from Galleria Italia | T | pH | Eh | HCO3− | F− | Cl− | NO3− | SO₄²⁻ | Ca2+ | Mg2+ | Na+ | K+ | NH4+ | Scat | San | Err. | TDS |
|---|---|---|---|---|---|---|---|---|---|---|---|---|---|---|---|---|---|---|---|
| Km | (°C) | mV | (mg/L) | (mg/L) | (mg/L) | (mg/L) | (mg/L) | (mg/L) | (mg/L) | (mg/L) | (mg/L) | (mg/L) | (meq/L) | (meq/L) | % | (mg/L) | |||
| GIT0 | 4 June 2020 | 0.0 | 14.3 | 6.01 | 55.0 | 103 | 0.18 | 29 | 0.5 | 511 | 195 | 22 | 11 | 9.6 | 3.38 | 12.48 | 13.16 | −2.64 | 885 |
| GIT0 | 12 June 2020 | 0.0 | 15.0 | 7.63 | 32.0 | 104 | 0.03 | 21 | 0.4 | 446 | 198 | 24 | 12 | 9.7 | 2.64 | 12.77 | 11.59 | 4.84 | 818 |
| GIT0 | 23 June 2020 | 0.0 | 14.7 | 5.17 | 83.0 | 108 | 0.07 | 22 | 1.7 | 547 | 205 | 23 | 12 | 10.5 | 2.31 | 13.01 | 13.81 | −2.97 | 931 |
| GIT1 | 4 June 2020 | 0.3 | 14.7 | 7.44 | 126.0 | 70 | 0.01 | 23 | 1.5 | 582 | 227 | 30 | 16 | 14.7 | 0.32 | 14.89 | 13.93 | 3.32 | 964 |
| GIT2 | 4 June 2020 | 0.4 | 14.8 | 7.94 | 195.0 | 70 | 0.07 | 28 | 2.7 | 449 | 184 | 25 | 12 | 10.9 | 0.32 | 12.03 | 11.32 | 3.03 | 781 |
| GIT3 | 4 June 2020 | 0.6 | 15.0 | 7.63 | 182.0 | 70 | 0.06 | 32 | 4.1 | 531 | 186 | 24 | 14 | 10.4 | 0.22 | 12.14 | 13.17 | −4.05 | 871 |
| GIT3 | 12 June 2020 | 0.6 | 14.0 | 7.03 | 204.0 | 93 | <0.01 | 29 | 1.5 | 395 | 173 | 24 | 13 | 15.4 | 0.09 | 11.56 | 10.60 | 4.32 | 744 |
| GIT3 | 23 June 2020 | 0.6 | 16.0 | 7.59 | 122.0 | 92 | 0.02 | 27 | 3.8 | 441 | 179 | 23 | 12 | 9.5 | 0.02 | 11.57 | 11.52 | 0.18 | 788 |
| GIT4 | 4 June 2020 | 0.7 | 15.0 | 6.86 | 114.0 | 73 | <0.01 | 22 | 1.7 | 454 | 187 | 24 | 15 | 10.3 | 0.14 | 12.21 | 11.32 | 3.77 | 788 |
| GIT5 | 4 June 2020 | 0.8 | 15.0 | 7.79 | 280.0 | 73 | 0.04 | 22 | 1.8 | 521 | 183 | 23 | 14 | 10.1 | 0.02 | 11.88 | 12.72 | −3.43 | 849 |
| GIT5 | 12 June 2020 | 0.8 | 14.0 | 7.76 | 57.0 | 106 | 0.04 | 27 | 1.3 | 415 | 168 | 22 | 13 | 12.1 | 0.09 | 11.09 | 11.17 | −0.33 | 765 |
| GIT5 | 23 June 2020 | 0.8 | 15.2 | 7.82 | 118.0 | 99 | 0.02 | 24 | 1.2 | 497 | 179 | 24 | 13 | 11.4 | 0.08 | 11.78 | 12.66 | −3.59 | 849 |
| GIT6 | 4 June 2020 | 1.0 | 15.0 | 7.75 | 189.0 | 72 | 0.07 | 24 | 2.6 | 469 | 180 | 24 | 15 | 11.4 | 0.01 | 11.94 | 11.67 | 1.14 | 799 |
| GIT7 | 4 June 2020 | 1.3 | 15.0 | 6.86 | 236.0 | 71 | 0.04 | 22 | 2.3 | 406 | 170 | 23 | 12 | 7.6 | 0.01 | 11.08 | 10.26 | 3.87 | 713 |
| GIT9 | 23 June 2020 | 1.5 | 16.8 | 7.60 | 141.0 | 111 | <0.01 | 23 | 1.6 | 450 | 194 | 25 | 15 | 8.3 | 0.02 | 12.56 | 11.89 | 2.77 | 829 |
| GIT10 | 23 June 2020 | 1.7 | 16.0 | 7.57 | 143.0 | 124 | 0.02 | 26 | 2.4 | 444 | 203 | 25 | 13 | 9.6 | 0.06 | 13.01 | 12.05 | 3.82 | 848 |
| GIT11 | 4 June 2020 | 1.9 | 15.0 | 7.75 | 122.0 | 103 | 0.01 | 21 | 2.4 | 264 | 132 | 14 | 14 | 7.2 | 0.01 | 8.56 | 7.81 | 4.60 | 557 |
| GIT12 | 4 June 2020 | 2.0 | 15.0 | 8.26 | 102.0 | 99 | <0.01 | 70 | 2.9 | 326 | 144 | 18 | 14 | 10.3 | 0.03 | 9.51 | 10.44 | −4.68 | 684 |
| GIT12 | 12 June 2020 | 2.0 | 14.0 | 7.12 | 223.0 | 161 | 0.06 | 30 | 1.6 | 349 | 154 | 23 | 19 | 14.7 | 0.08 | 10.75 | 10.77 | −0.07 | 752 |
| GIT12 | 23 June 2020 | 2.0 | 17.4 | 7.60 | 122.0 | 132 | 0.01 | 23 | 1.0 | 435 | 173 | 23 | 12 | 10.4 | 0.10 | 11.35 | 11.90 | −2.37 | 811 |
| PA01 | 4 June 2020 | 2.2 | 15.0 | 7.89 | 180.0 | 179 | 0.02 | 29 | 1.7 | 75 | 78 | 10 | 17 | 2.4 | 0.05 | 5.57 | 5.37 | 1.86 | 394 |
| Liquid Phase | Suspended Solids | Sediments | |||||||||||
|---|---|---|---|---|---|---|---|---|---|---|---|---|---|
| Sample ID | Date | δ18O | δ2H | δ34S-SO4 | As | Sb | Hg | As | Sb | Hg | As | Sb | Hg |
| ‰ vs. SMOW | ‰ vs. SMOW | ‰ vs. CDT | µg/L | µg/L | µg/L | mg/kg | mg/kg | mg/kg | mg/kg | mg/kg | mg/kg | ||
| GIT0 | 4 June 2020 | −7.8 | −48.6 | −4.5 | 12.0 | <0.1 | 0.4 | 77 | < 1 | 0.27 | 336 | <1 | 12.5 |
| GIT0 | 12 June 2020 | −7.8 | −48.0 | −4.0 | 10.9 | <0.1 | 0.5 | ||||||
| GIT0 | 23 June 2020 | −7.8 | −47.8 | 10.9 | <0.1 | 0.1 | |||||||
| GIT1 | 4 June 2020 | 2.0 | <0.1 | 1.6 | 43 | <1 | 39.3 | ||||||
| GIT2 | 4 June 2020 | 1.2 | <0.1 | 1.4 | 36 | <1 | 68.0 | ||||||
| GIT3 | 4 June 2020 | −7.6 | −46.9 | −4.4 | 1.0 | <0.1 | 1.8 | 62 | <1 | 1.8 | |||
| GIT3 | 12 June 2020 | 1.0 | <0.1 | 1.9 | |||||||||
| GIT3 | 23 June 2020 | 1.0 | <0.1 | 1.6 | |||||||||
| GIT4 | 4 June 2020 | 1.0 | <0.1 | 2.2 | 21 | <1 | 105.0 | ||||||
| GIT5 | 4 June 2020 | −7.6 | −46.9 | −4.3 | 0.9 | <0.1 | 2.1 | 54 | <1 | 15.3 | 68 | <1 | 7.5 |
| GIT5 | 12 June 2020 | 0.8 | <0.1 | 1.6 | |||||||||
| GIT5 | 23 June 2020 | −7.6 | −47.0 | 0.9 | <0.1 | 1.3 | |||||||
| GIT6 | 4 June 2020 | 1.0 | <0.1 | 2.8 | 29 | <1 | 100.0 | ||||||
| GIT7 | 4 June 2020 | −7.7 | −47.0 | 1.2 | <0.1 | 2.2 | 41 | <1 | 8.1 | ||||
| GIT9 | 23 June 2020 | −7.6 | −46.6 | −4.6 | 0.7 | 0.1 | <0.1 | 41 | <1 | 17.5 | 8 | <1 | 75.0 |
| GIT10 | 23 June 2020 | 0.7 | 0.1 | 1.4 | 11 | <1 | 80.0 | ||||||
| GIT11 | 5 June 2020 | 0.6 | 0.2 | 1.8 | 9 | 1 | 53.9 | ||||||
| GIT12 | 5 June 2020 | −6.4 | −38.5 | −4.2 | 0.6 | 0.2 | 1.3 | 52 | <1 | 4.71 | 7 | <1 | 153.0 |
| GIT12 | 12 June 2020 | −7.1 | −43.4 | 0.7 | 0.2 | <0.1 | |||||||
| GIT12 | 23 June 2020 | −7.6 | −46.9 | −4.5 | 0.6 | 0.1 | <0.1 | ||||||
| PA01 | 5 June 2020 | −5.5 | −31.9 | −10.5 | 0.3 | 0.4 | 0.3 | 2 | 1 | 0.8 | |||
| Pre-GIT10 spring | 23 June 2020 | 137 | <1 | 7.0 | |||||||||
| Sample | Class | As | Class | Hg |
|---|---|---|---|---|
| GIT0 | 6 | extremely contaminated | 5 | heavily to extremely contaminated |
| GIT1 | 3 | moderately to heavily contaminated | 6 | extremely contaminated |
| GIT2 | 2 | moderately contaminated | 6 | extremely contaminated |
| GIT3 | - | - | - | - |
| GIT4 | 2 | moderately contaminated | 6 | extremely contaminated |
| GIT5 | 3 | moderately to heavily contaminated | 5 | heavily to extremely contaminated |
| GIT6 | 2 | moderately contaminated | 6 | extremely contaminated |
| GIT7 | 2 | moderately contaminated | 5 | heavily to extremely contaminated |
| GIT9 | 0 | uncontaminated | 6 | extremely contaminated |
| GIT10 | 0 | uncontaminated | 6 | extremely contaminated |
| GIT11 | 0 | uncontaminated | 6 | extremely contaminated |
| GIT12 | 0 | uncontaminated | 6 | extremely contaminated |
| PA01 | 0 | uncontaminated | 1 | uncontaminated to mod. contaminated |
| Sample ID | Q | log Kd | Mass Load (kg/year) | ||||||
|---|---|---|---|---|---|---|---|---|---|
| L/s | As | Hg | DAs | TSSAs | As Total | DHg | TSSHg | Hg Total | |
| GIT0 | 40 | 3.81 | 2.83 | 13.32 | 6.80 | 20.12 | 0.44 | 0.04 | 0.48 |
| GIT3 | - | 4.79 | 3.00 | - | - | - | - | - | - |
| GIT5 | - | 4.77 | 3.86 | - | - | - | - | - | - |
| GIT9 | - | 4.77 | - | - | - | - | - | - | - |
| GIT12 | 40 | 4.94 | 3.56 | 0.67 | 0.07 | 0.73 | 1.33 | 0.01 | 1.34 |
| PA01 | 213 | - | - | - | - | - | - | - | - |
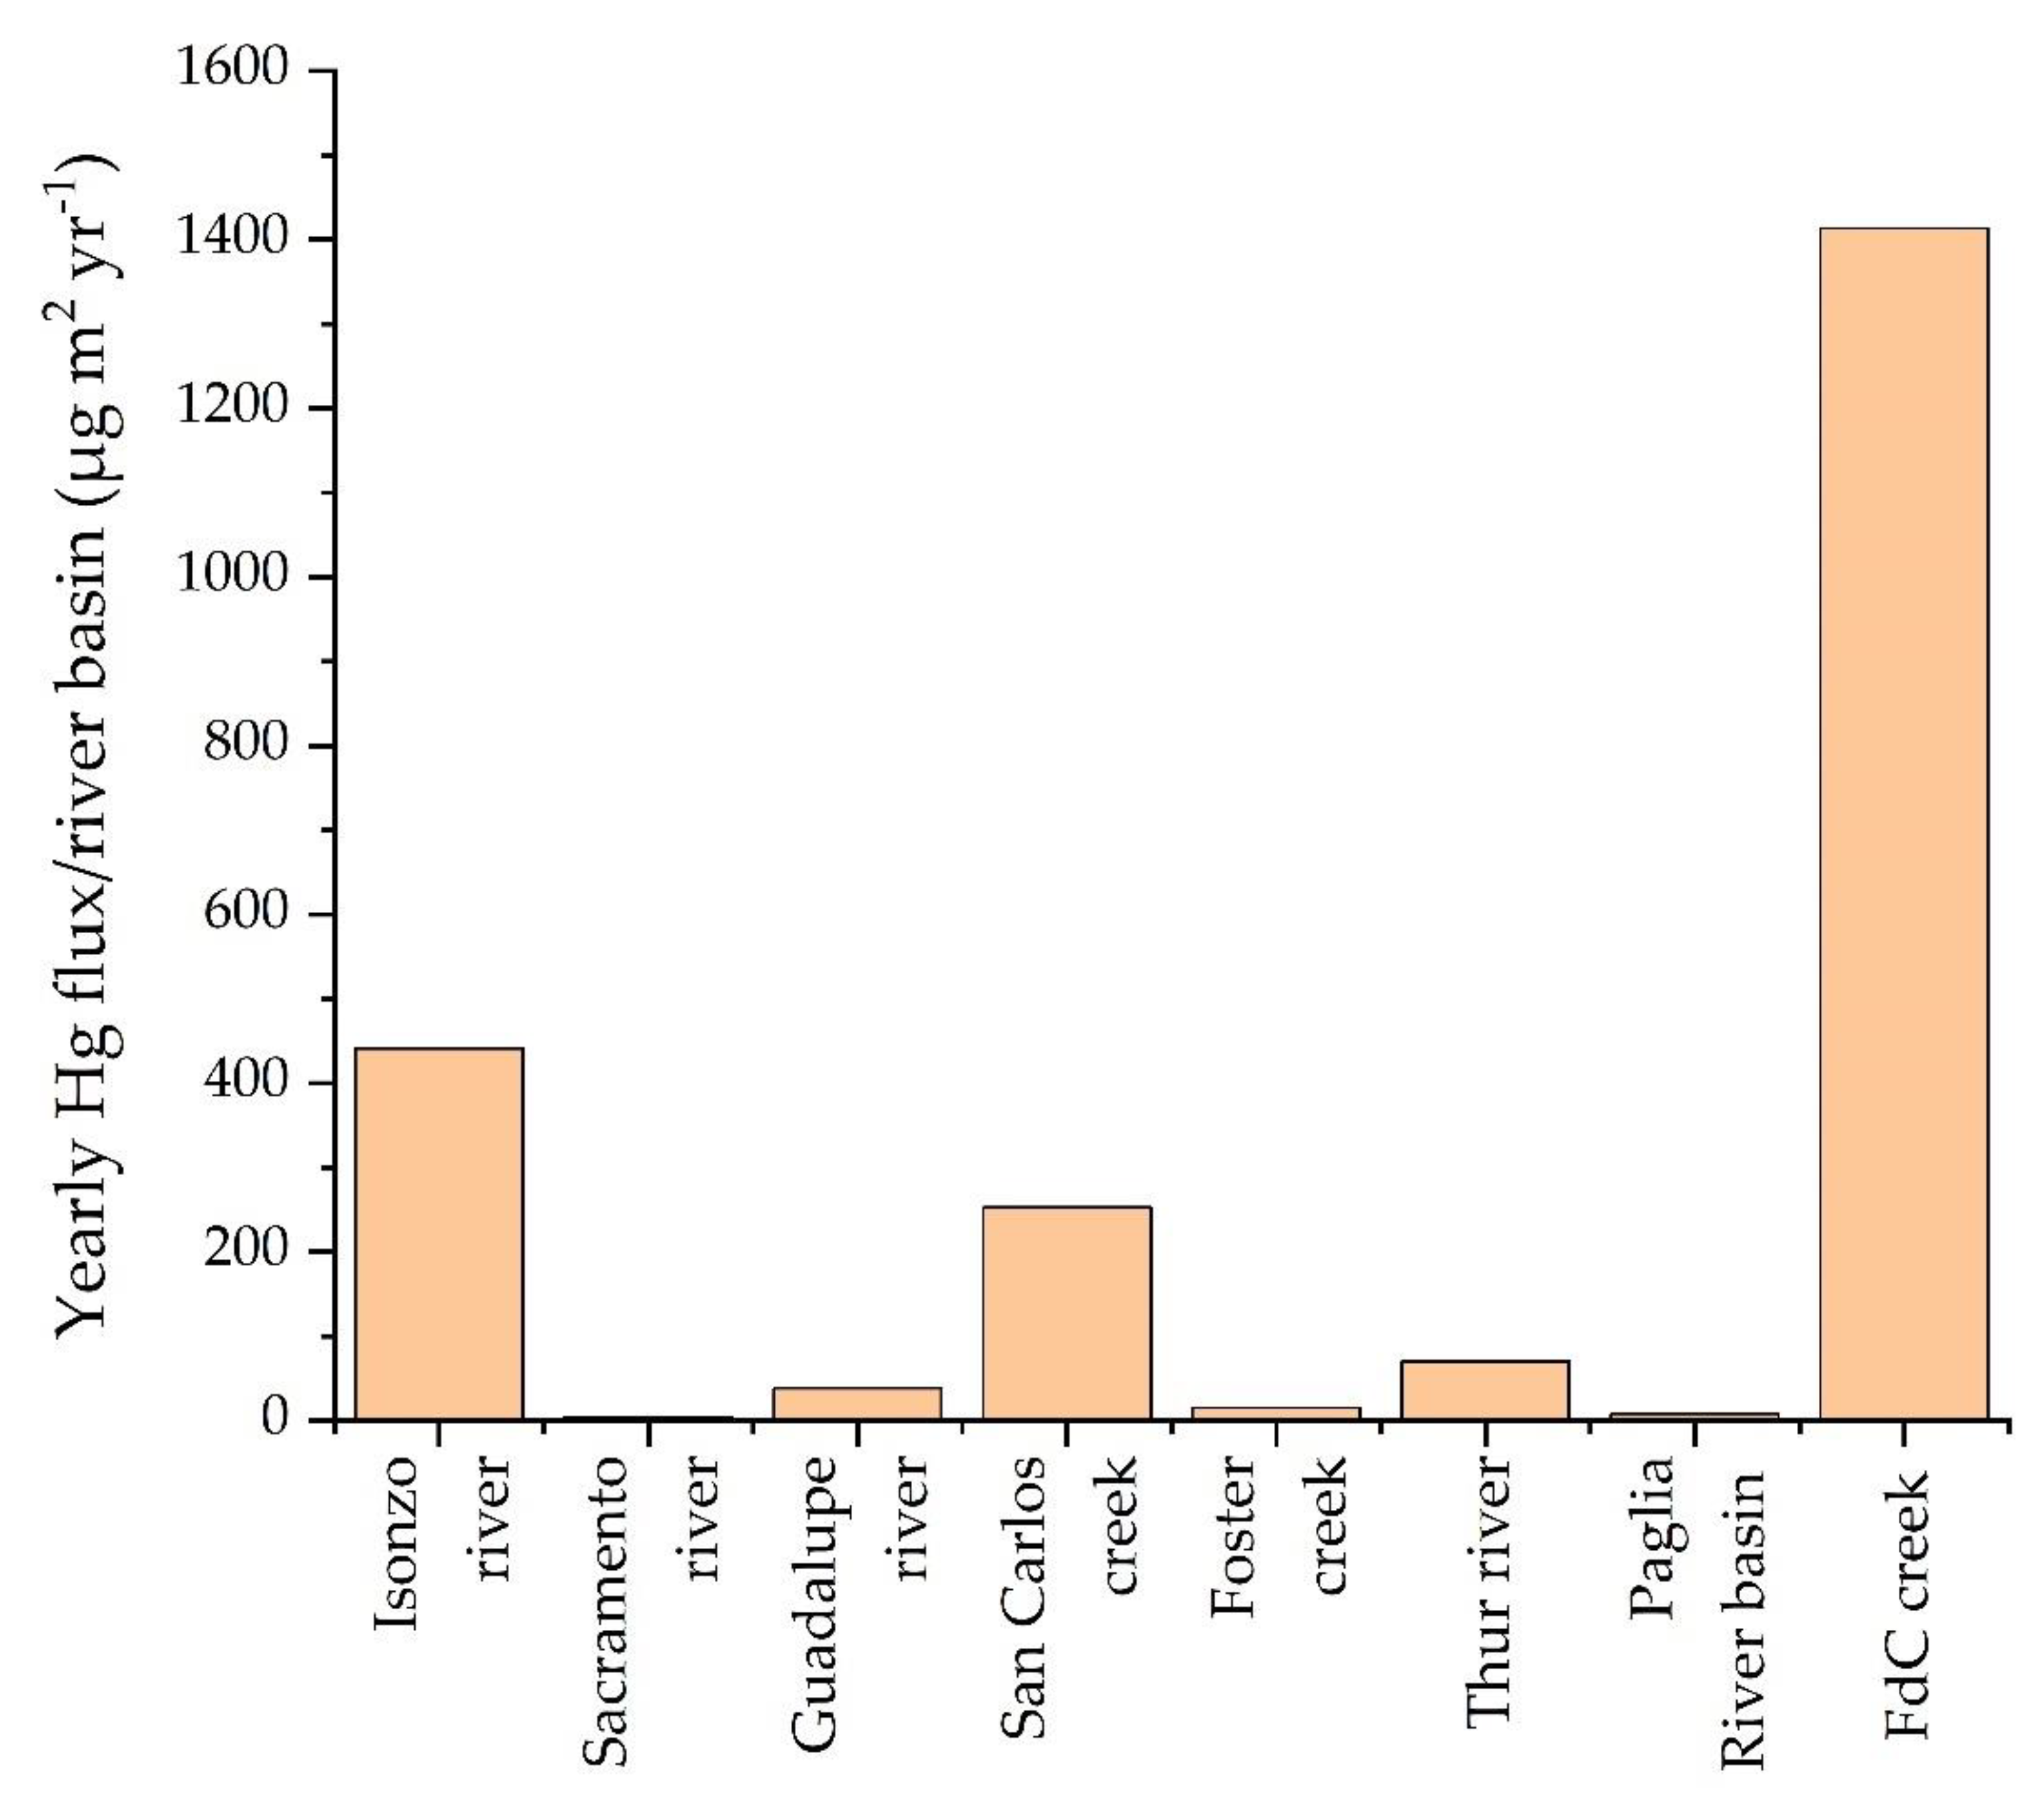
| River Name | Location | Reference | Hg Mass Load | River Basin Area | Yearly Hg Flux/River Basin |
|---|---|---|---|---|---|
| kg/year−1 | km2 | μg m2 year−1 | |||
| Isonzo River | Idrija (Slovenia) | [41] | 1500 | 3400 | 441 |
| Sacramento River | California (USA) | [49] | 61–470 | 71432 | 3.7 |
| Guadalupe River | New Almadèn, California (USA) | [46] | 4–30 | 440 | 38.6 |
| San Carlos Creek | New Idrija, California (USA) | [48] | 1.5 | 5.94 ** | 253 |
| Foster Creek | Bonanza mine, Oregon | [47] | 0.75 | 50.4 ** | 14.9 |
| Thur River | France, Swiss | [40] | 34–86 m2 year−1 * | 270 | 70 |
| Paglia River Basin (PRB) | Tuscany and Lazio, Italy | [33] | 11 | 1330 | 8.3 |
| Fosso della Chiusa Creek | Tuscany, Italy | this work | 1.33 | 0.92 | 1413 |
Publisher’s Note: MDPI stays neutral with regard to jurisdictional claims in published maps and institutional affiliations. |
© 2022 by the authors. Licensee MDPI, Basel, Switzerland. This article is an open access article distributed under the terms and conditions of the Creative Commons Attribution (CC BY) license (https://creativecommons.org/licenses/by/4.0/).
Share and Cite
Lazzaroni, M.; Vetuschi Zuccolini, M.; Nisi, B.; Cabassi, J.; Caliro, S.; Rappuoli, D.; Vaselli, O. Mercury and Arsenic Discharge from Circumneutral Waters Associated with the Former Mining Area of Abbadia San Salvatore (Tuscany, Central Italy). Int. J. Environ. Res. Public Health 2022, 19, 5131. https://doi.org/10.3390/ijerph19095131
Lazzaroni M, Vetuschi Zuccolini M, Nisi B, Cabassi J, Caliro S, Rappuoli D, Vaselli O. Mercury and Arsenic Discharge from Circumneutral Waters Associated with the Former Mining Area of Abbadia San Salvatore (Tuscany, Central Italy). International Journal of Environmental Research and Public Health. 2022; 19(9):5131. https://doi.org/10.3390/ijerph19095131
Chicago/Turabian StyleLazzaroni, Marta, Marino Vetuschi Zuccolini, Barbara Nisi, Jacopo Cabassi, Stefano Caliro, Daniele Rappuoli, and Orlando Vaselli. 2022. "Mercury and Arsenic Discharge from Circumneutral Waters Associated with the Former Mining Area of Abbadia San Salvatore (Tuscany, Central Italy)" International Journal of Environmental Research and Public Health 19, no. 9: 5131. https://doi.org/10.3390/ijerph19095131
APA StyleLazzaroni, M., Vetuschi Zuccolini, M., Nisi, B., Cabassi, J., Caliro, S., Rappuoli, D., & Vaselli, O. (2022). Mercury and Arsenic Discharge from Circumneutral Waters Associated with the Former Mining Area of Abbadia San Salvatore (Tuscany, Central Italy). International Journal of Environmental Research and Public Health, 19(9), 5131. https://doi.org/10.3390/ijerph19095131