
Anthropometric Equations to Determine Maximum Height in Adults ≥ 60 Years: A Systematic Review

 , ,
, ,  ,
,
Abstract
1. Introduction
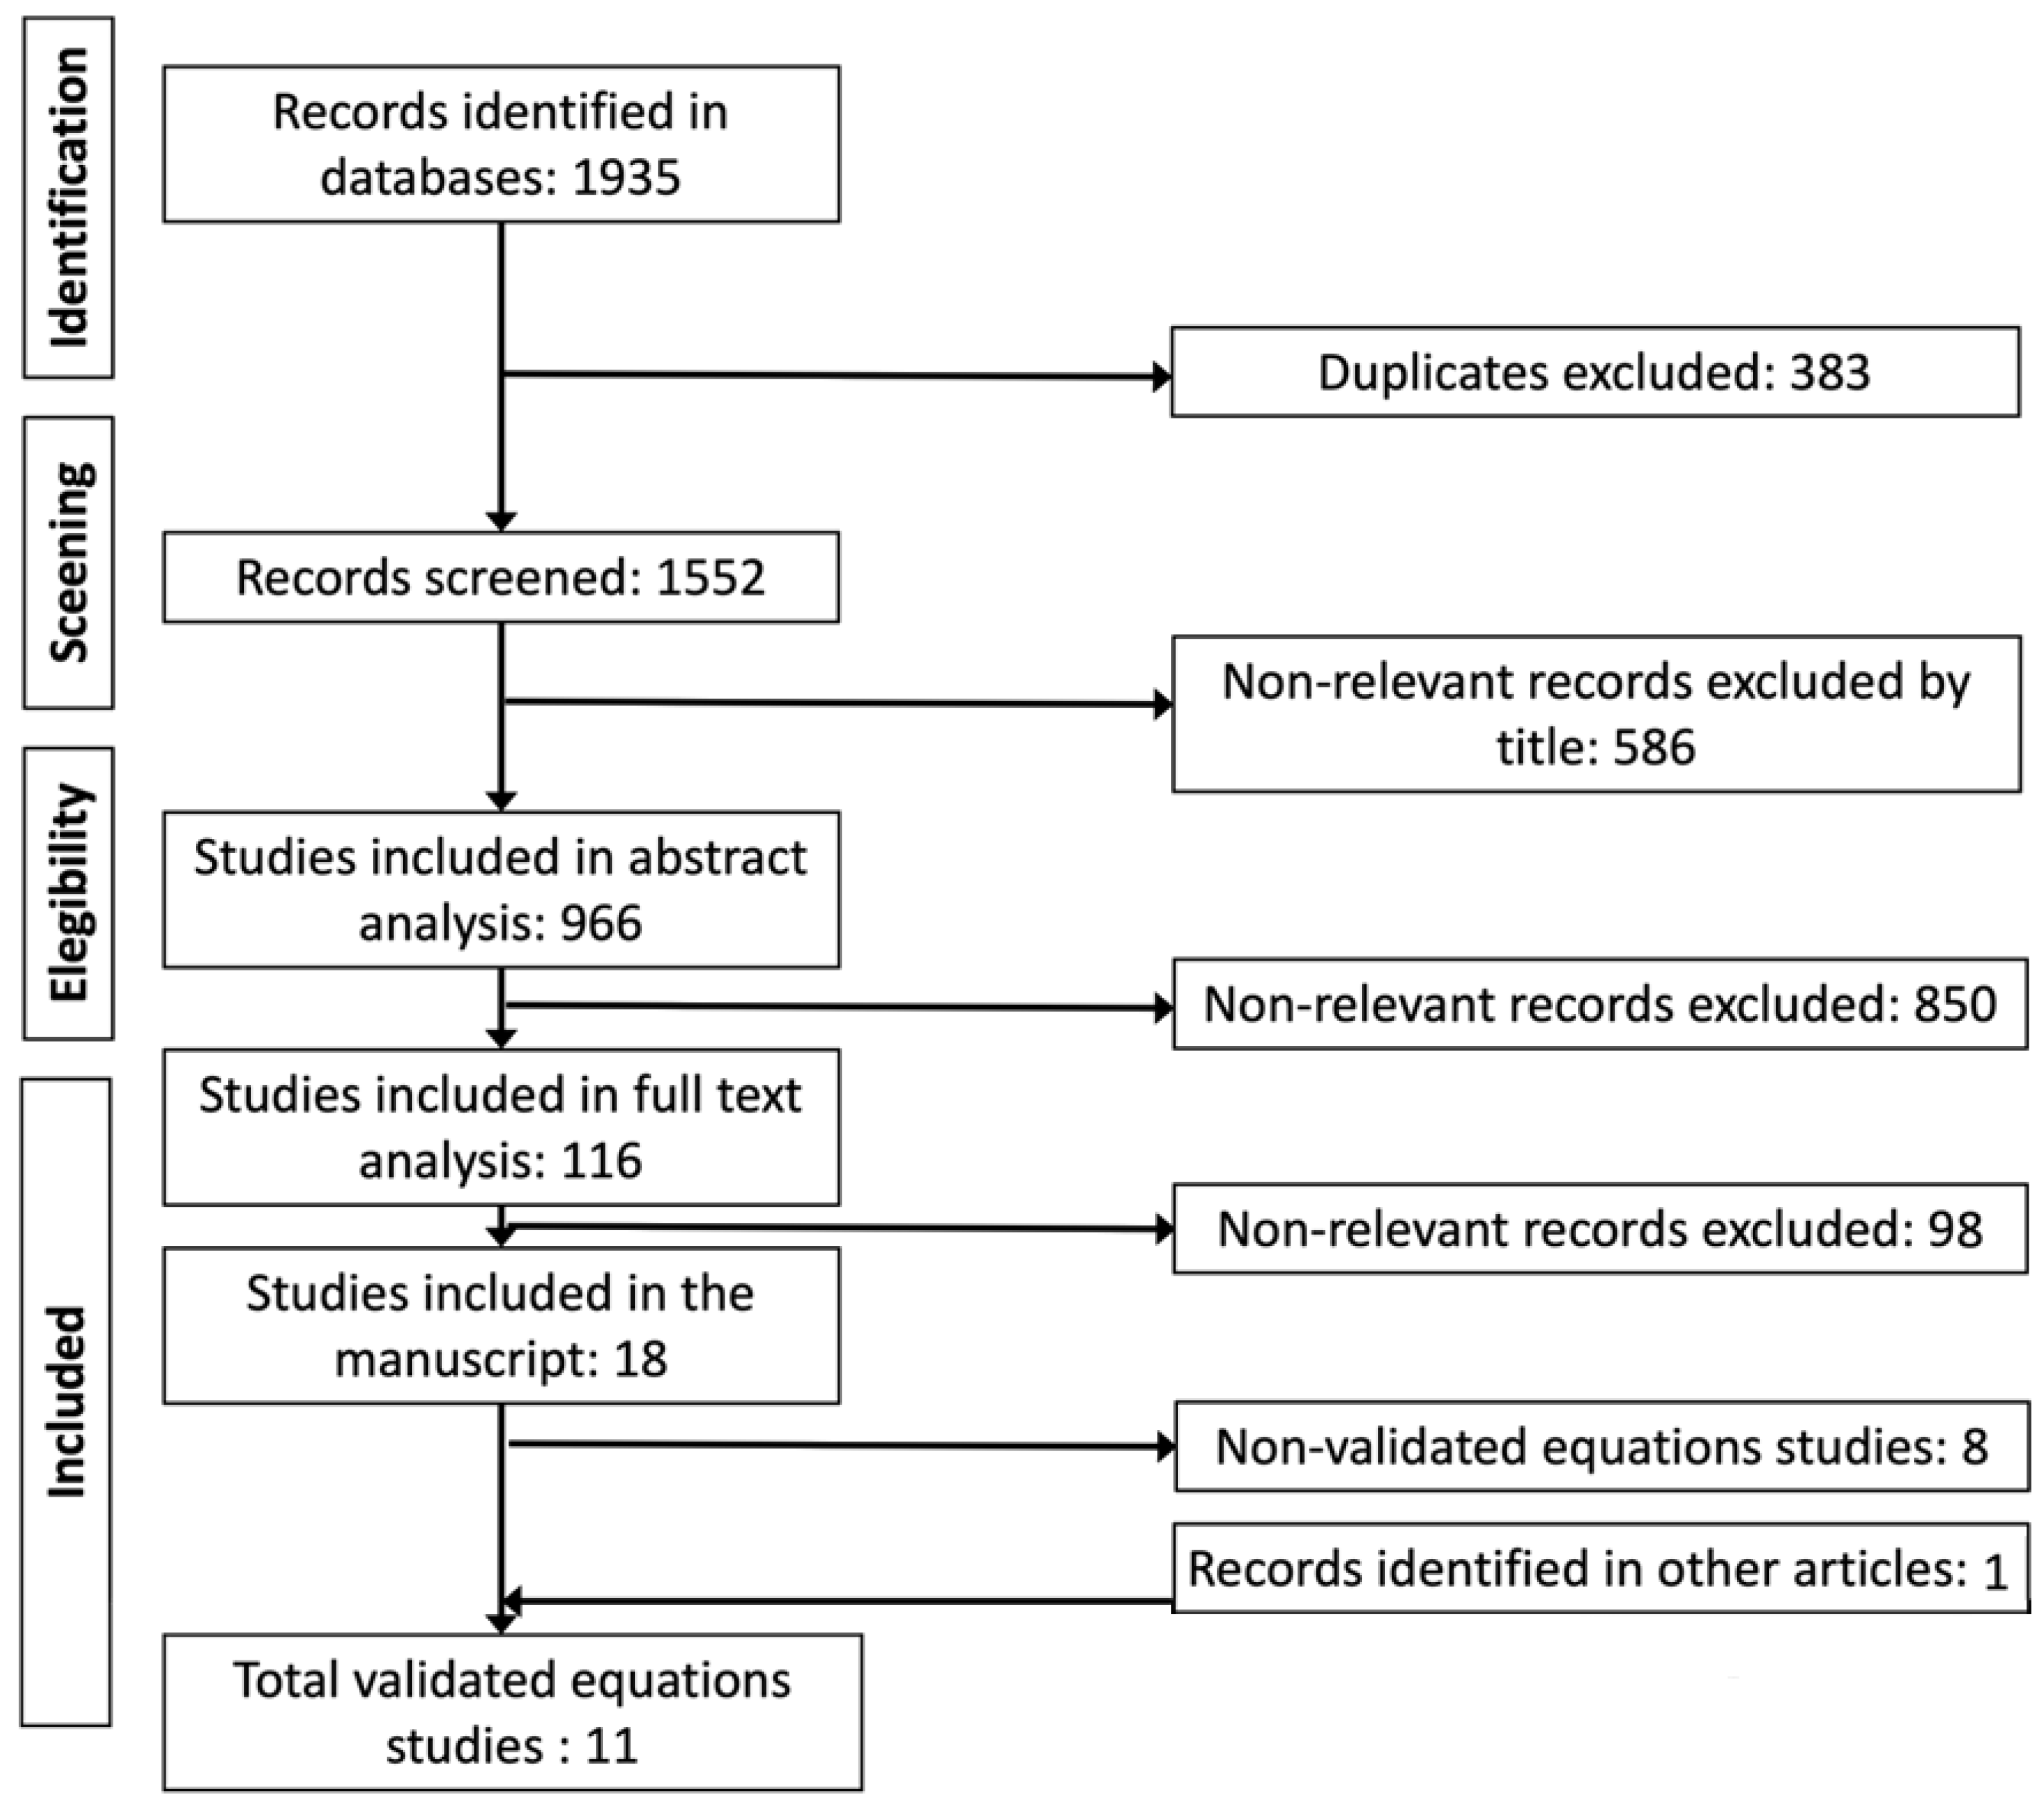
2. Materials and Methods
2.1. Information Sources
2.2. Eligibility Criteria
- Publication date: without date—2021,
- Original articles that designed and validated equations for the determination of maximum height by anthropometric methods,
- Age of participants ≥ 60 years,
- Manuscripts where the methodology and results can be interpreted in the English, Portuguese, or Spanish languages,
- Manuscripts with presented evidence of validation of the proposed regression models.
2.3. Selection Process
2.4. Data Collection and Synthesis
3. Results
3.1. Studies and Equations Found

| Id Article | Article | Study |
|---|---|---|
| 1 * | Bermúdez et al., 1999. [30] | National Survey MAHES (Massachusetts Hispanic Elders Study 1993–1997). Random cross-validation (~50%). People with postural problems were excluded and outliers were removed. |
| 2 * | Chumlea et al., 1985. [22] | The USA, outpatient volunteers without postural problems (people with excessive spinal curvature were excluded). Equations were widely used and validated by various authors. |
| 3 * | Chumlea and Guo, 1992. [26] | National Health Examination Survey USA (1960–1970). Cross and secular validation for 30 years. Non-institutionalized people. |
| 4 * | Chumlea et al., 1998. [27] | Third National Health and Nutrition Examination Survey (NHANES III 1988–1994). Cross and secular validation. |
| 5 * | Hwang et al., 2009. [31] | National survey on people without bone or joint problems. Cross-validation 80–20% and external. Extreme data were excluded. |
| 6 * | Jésus et al., 2020. [23] | EPIDEMCA (Epidemiology of Dementia in Central Africa). People with joint and postural problems were included. Cross and convergent validation vs. Chumlea 1992. |
| 7 * | Jiménez-Fontana and Chaves-Correa, 2014. [32] | CRELES national survey. Cross-validation at 50%. People with spinal deformities were excluded. |
| 8 * | Karadag et al., 2012. [33] | Convenience study designed in adults (19–50 y) and validated in adults older than 59 y. |
| 9 * | Lera et al., 2009. [34] | SABE survey. Cross-validation at 50% and by Lima et al., 2018 in Brazilians. |
| 10 | Malnutrition Advisory Group (MAG, 2011). [35] | British nutritional screening of adults: a multidisciplinary responsibility. |
| 11 * | Mendoza-Núñez et al., 2002. [36] | Sample for convenience. Cross validation 50%. |
| 12 | Narančić et al., 2013. [37] | Zagreb, Croatia. Institutionalized people Survey. |
| 13 | Nguyen et al., 2021. [29] | Sample for convenience. |
| 14 * | Palloni and Guend, 2005. [24] | SABE survey in Latin America with random sampling. 50% random cross-validation. |
| 15 | Pertiwi et al., 2018. [38] | Sample for convenience. |
| 16 | Ritz et al., 2007. [39] | Multicenter study. |
| 17 | Weinbrenner et al., 2006. [40] | Sample for convenience. |
| 18 | Zhang et al., 1998. [41] | Aleatory survey. |
| Id Article | Regression Model. Lengths (cm), Age (y) | Sample (n) | Country or Ethnic Group | Sex | Age (y) | Height ± SD (cm) | R2 | SEE | PE |
|---|---|---|---|---|---|---|---|---|---|
| 1 * | 70.28 + 1.81 KH | 128 | Hispanic American | men | 60–92 | 165.1 ± 6.2 | 0.72 | 2.8 | |
| 1 * | 68.68 + 1.90 KH—0.123 age | 166 | Hispanic American | women | 60–92 | 152.7 ± 6.0 | 0.73 | 2.3 | |
| 1 * | 53.42 + 2.13 KH | 81 | Puerto Rican | men | 60–92 | 164.1 ± 6.2 | 0.77 | 3.1 | |
| 1 * | 66.80 + 1.94 KH—0.123 age | 87 | Puerto Rican | women | 60–92 | 151.8 ± 5.9 | 0.7 | 2.9 | |
| 2 * | 60.65 + 2.04 KH | 106 | Non-Hispanic white American | men | 65–104 | 169.1 ± 6.9 | 0.67 | 3.8 | |
| 2 * | 64.19 + 2.03 KH—0.04 age | 130 | Non-Hispanic white American | women | 65–104 | 156.7 ± 5.6 | 0.65 | 3.5 | |
| 3 * | 75.00 + 1.91 KH—0.17 age | 451 | White | women | 60–80 | 156.8 ± 6.8 | 0.59 | 4.4 | 3.48 |
| 3 * | 58.72 + 1.96 KH | 60 | Black | women | 60–80 | 156.8 ± 7.1 | 0.70 | 4.06 | |
| 3 * | 59.01 + 2.08 KH | 438 | White | men | 60–80 | 170 ± 7.0 | 0.68 | 3.91 | 3.32 |
| 3 * | 95.79 + 1.37 KH | 50 | Black | men | 60–80 | 167.7 ± 6.2 | 0.51 | 4.18 | |
| 4 * | 78.31 + 1.94 KH—0.14 age | 1369 | Non-Hispanic white | men | ≥60 | 173.5 ± 6.7 | 0.69 | 3.74 | 3.62 |
| 4 * | 79.69 + 1.85 KH—0.14 age | 474 | Non-Hispanic black | men | ≥60 | 172.7 ± 6.9 | 0.70 | 3.81 | 3.68 |
| 4 * | 82.77 + 1.83 KH—0.16 age | 497 | Mexican-American | men | ≥60 | 166.9 ± 6.3 | 0.66 | 3.69 | 3.64 |
| 4 * | 82.21 + 1.85 KH—0.21 age | 1472 | Non-Hispanic white | women | ≥60 | 159 ± 6.6 | 0.64 | 3.98 | 3.8 |
| 4 * | 89.58 + 1.61 KH—0.17 age | 481 | Non-Hispanic black | women | ≥60 | 160.2 ± 6.2 | 0.63 | 3.83 | 3.81 |
| 4 * | 84.25 + 1.82 KH—0.26 age | 457 | Mexican-American | women | ≥60 | 153.2 ± 6.3 | 0.65 | 3.78 | 3.45 |
| 5 * | 70.87 + 1.96 KH—0.14 age | 596 | Korean | women | 20–69 | 152.9 ± 5.2 | 0.69 | 2.88 | |
| 5 * | 74.63 + 1.95 KH—0.09 age | 2020 | Korean | men | 20–69 | 169.3 ± 6.4 | 0.73 | 3.32 | |
| 6 * | 72.75 + 1.86 KH—0.13 age + 3.41 sex (0: women; 1: men) | 887 | African | women (61.5%) and men | ≥ 65 | women = 152.9 ± 5.2 men = 169.2 ± 6.4 | 0.67 | 0.75 | |
| 7 * | 58.28 + 2.20 KH—0.10 age | 936 | Costa Rican | men | ≥60 | 163.1 ± 6.6 | 0.75 | 3.28 | 3.32 |
| 7 * | 62.0 + 2.10 KH—0.163 age | 1101 | Costa Rican | women | ≥60 | 149.1 ± 6.6 | 0.7 | 3.37 | 3.52 |
| 8 * | 52.46 + 2.24 KH | 219 | Turkish | men | 60–97 | 168.2 ± 6.1 | 0.78 | ||
| 8 * | 51.44 + 2.21 KH | 219 | Turkish | women | 60–97 | 156.3± 5.3 | 0.88 | ||
| 9 * | 69.87 + 1.85 KH—0.11 age | 944 | Brazil | women | 60–99 | 152.4 ± 5.2 | 0.58 | 3.58 | 3.8 ε |
| 9 * | 67.2 + 1.96 KH—0.08 age | 713 | Brazil | men | 60–99 | 165 ± 6.4 | 0.69 | 3.66 | 4.25 ε |
| 9 * | 75.17 + 1.78 KH—0.1 age | 615 | Chile | women | 60–99 | 165 ± 6.4 | 0.54 | 3.24 | 4.34 ε |
| 9 * | 64.88 + 2.09 KH—0.1 age | 389 | Chile | men | 60–99 | 164.8 ± 6.6 | 0.7 | 3.67 | 5.28 ε |
| 9 * | 73.09 + 1.87 KH—0.19 age | 607 | Mexico | women | 60–99 | 148.3 ± 6.2 | 0.59 | 4.0 | 4.9 ε |
| 9 * | 63.88 + 1.99 KH—0.06 age | 388 | Mexico | men | 60–99 | 162.5 ± 6.3 | 0.67 | 3.67 | 5.28 ε |
| 10 | 86.3 + 3.15 UL | 62 | White American | men | >65 | 169.1 ± 5.6 | |||
| 10 | 80.4 + 3.25 UL | 60 | White American | women | >65 | 158 ± 6.9 | |||
| 10 | 71 + 1.2 DM | 67 | White American | men | >55 | 169.1 ± 5.6 | |||
| 10 | 67 + 1.2 DM | 62 | White American | women | >55 | 158 ± 6.9 | |||
| 10 | 75.00 + 1.91 KH—0.17 age | 229 | White American | women | 60–90 | 158 ± 6.9 | |||
| 10 | 59.01 + 2.08 KH | 229 | White American | men | 60–90 | 169.1 | |||
| 11 * | 52.6+ 2.17 KH | 186 | Mexican | men | 60–97 | 162.9 ± 5.9 | 0.69 | 3.32 | 3.29 |
| 11 * | 73.7+ 1.99 KH—0.23 age | 550 | Mexican | women | 60–97 | 149.3 ± 5.9 | 0.74 | 2.99 | 2.98 |
| 12 | 98.50 + 1.755 KH—0.350 age | 234 | Croatian | women | 85–101 | 152.7 ± 6.0 | 0.52 | 4.4 | |
| 12 | 56.72 + 2.091 KH | 80 | Croatian | men | 85–101 | 167.8 ± 7.0 | 0.6 | 4.5 | |
| 13 | 59.06 + 2.12 KH | 269 | Vietnamese | men | 18–64 | 165.7 ± 5.4 | 0.67 | ||
| 13 | 57.37 + 2.09 KH | 186 | Vietnamese | women | 18–64 | 155.1 ± 5.6 | 0.64 | ||
| 14 * | 94.1 + 1.21 KH | 4898 | Hispanic | women | ≥60 | 153.3 ± 7.8 | 7.08 | ||
| 14 * | 98.2 + 1.29 KH | 3139 | Hispanic | men | ≥60 | 166.4 ± 7.8 | 6.93 | ||
| 14 * | 101.8 + 1.06 KH | 4269 | Hispanic black | women | ≥60 | 154 ± 7.7 | 6.87 | ||
| 14 * | 105.6 + 1.16 KH | 2725 | Hispanic black | men | ≥60 | 167.1 ± 7.9 | 7.12 | ||
| 14 * | 88.5 + 1.32 KH | 319 | Hispanic mestizo | women | ≥60 | 151 ± 6.7 | 5.32 | ||
| 14 * | 67.2 + 1.88 KH | 170 | Hispanic mestizo | men | ≥60 | 164.3 ± 7.5 | 4.36 | ||
| 14 * | 62.6 + 1.81 KH | 629 | Hispanic Mexican | women | ≥60 | 148.5 ± 6.7 | 5.29 | ||
| 14 * | 59.6 + 1.99 KH | 414 | Hispanic Mexican | men | ≥60 | 162.3 ± 6.7 | 5.75 | ||
| 14 * | 109.0 + 0.91 KH | 511 | Hispanic mulatto | women | ≥60 | 154.4 ± 7.6 | 7.49 | ||
| 14 * | 108.9 + 1.08 KH | 271 | Hispanic mulatto | men | ≥60 | 166.3 ± 7.5 | 6.37 | ||
| 14 * | 82.9 + 1.43 KH | 2583 | Hispanic non-white | women | ≥60 | 153.9 ± 8.4 | 7.82 | ||
| 14 * | 87.5 + 1.48 KH | 1623 | Hispanic non-white | men | ≥60 | 166.2 ± 8.2 | 7.28 | ||
| 14 * | 110.8 + 0.87 KH | 2114 | Hispanic white | women | ≥60 | 152.6 ± 7.1 | 6.63 | ||
| 14 * | 112.8 + 1.03 KH | 1515 | Hispanic white | men | ≥60 | 166.7 ± 7.4 | 7.03 | ||
| 15 | 40.915 + 0.457 AS + 0.818 KH | 71 | Indonesian | women | 60–69 | 157.0 ± 6.92 | 0.98 ε | ||
| 15 | 34.426 + 0.513 AS + 0.813 KH | 65 | Indonesian | men | 60–69 | 145.4 ± 5.78 | 0.99 ε | ||
| 16 | 90.20 + 1.538 KH + 5.96 sex (0: women; 1: men)—0.094 age | 752 (50.4% women) | France non-Hispanic Caucasian | women and men | ≥54 | men: 170.6 ± 6.8. women: 157.7 ± 5.9 | 0.77 | 4.4 | |
| 17 | 77.821—0.215 age + 1.132 DM | 271 | Spain | men | ≥65 | 163.1 ± 6.4 | |||
| 17 | 88.854—0.692 age + 0.899 DM | 321 | Spain | women | ≥65 | 150.0 ± 5.2 | |||
| 18 | 67.78 + 2.01 KH | 130 | Chinese | men | 30–90 | 163.2 ± 5.5 | 0.59 | 4.07 | |
| 18 | 39.56 + 0.75 AS | 130 | Chinese | men | 30–90 | 163.2 ± 5.5 | 0.69 | 3.55 | |
| 18 | 78.46 + 1.79 KH—0.066 age | 117 | Chinese | women | 30–90 | 151.5 ± 5.2 | 0.56 | 4.01 | |
| 18 | 38.21 + 0.76 AS | 117 | Chinese | women | 30–90 | 151.5 ± 5.2 | 0.71 | 3.03 |
3.2. Accuracy of Reported Equations
- -
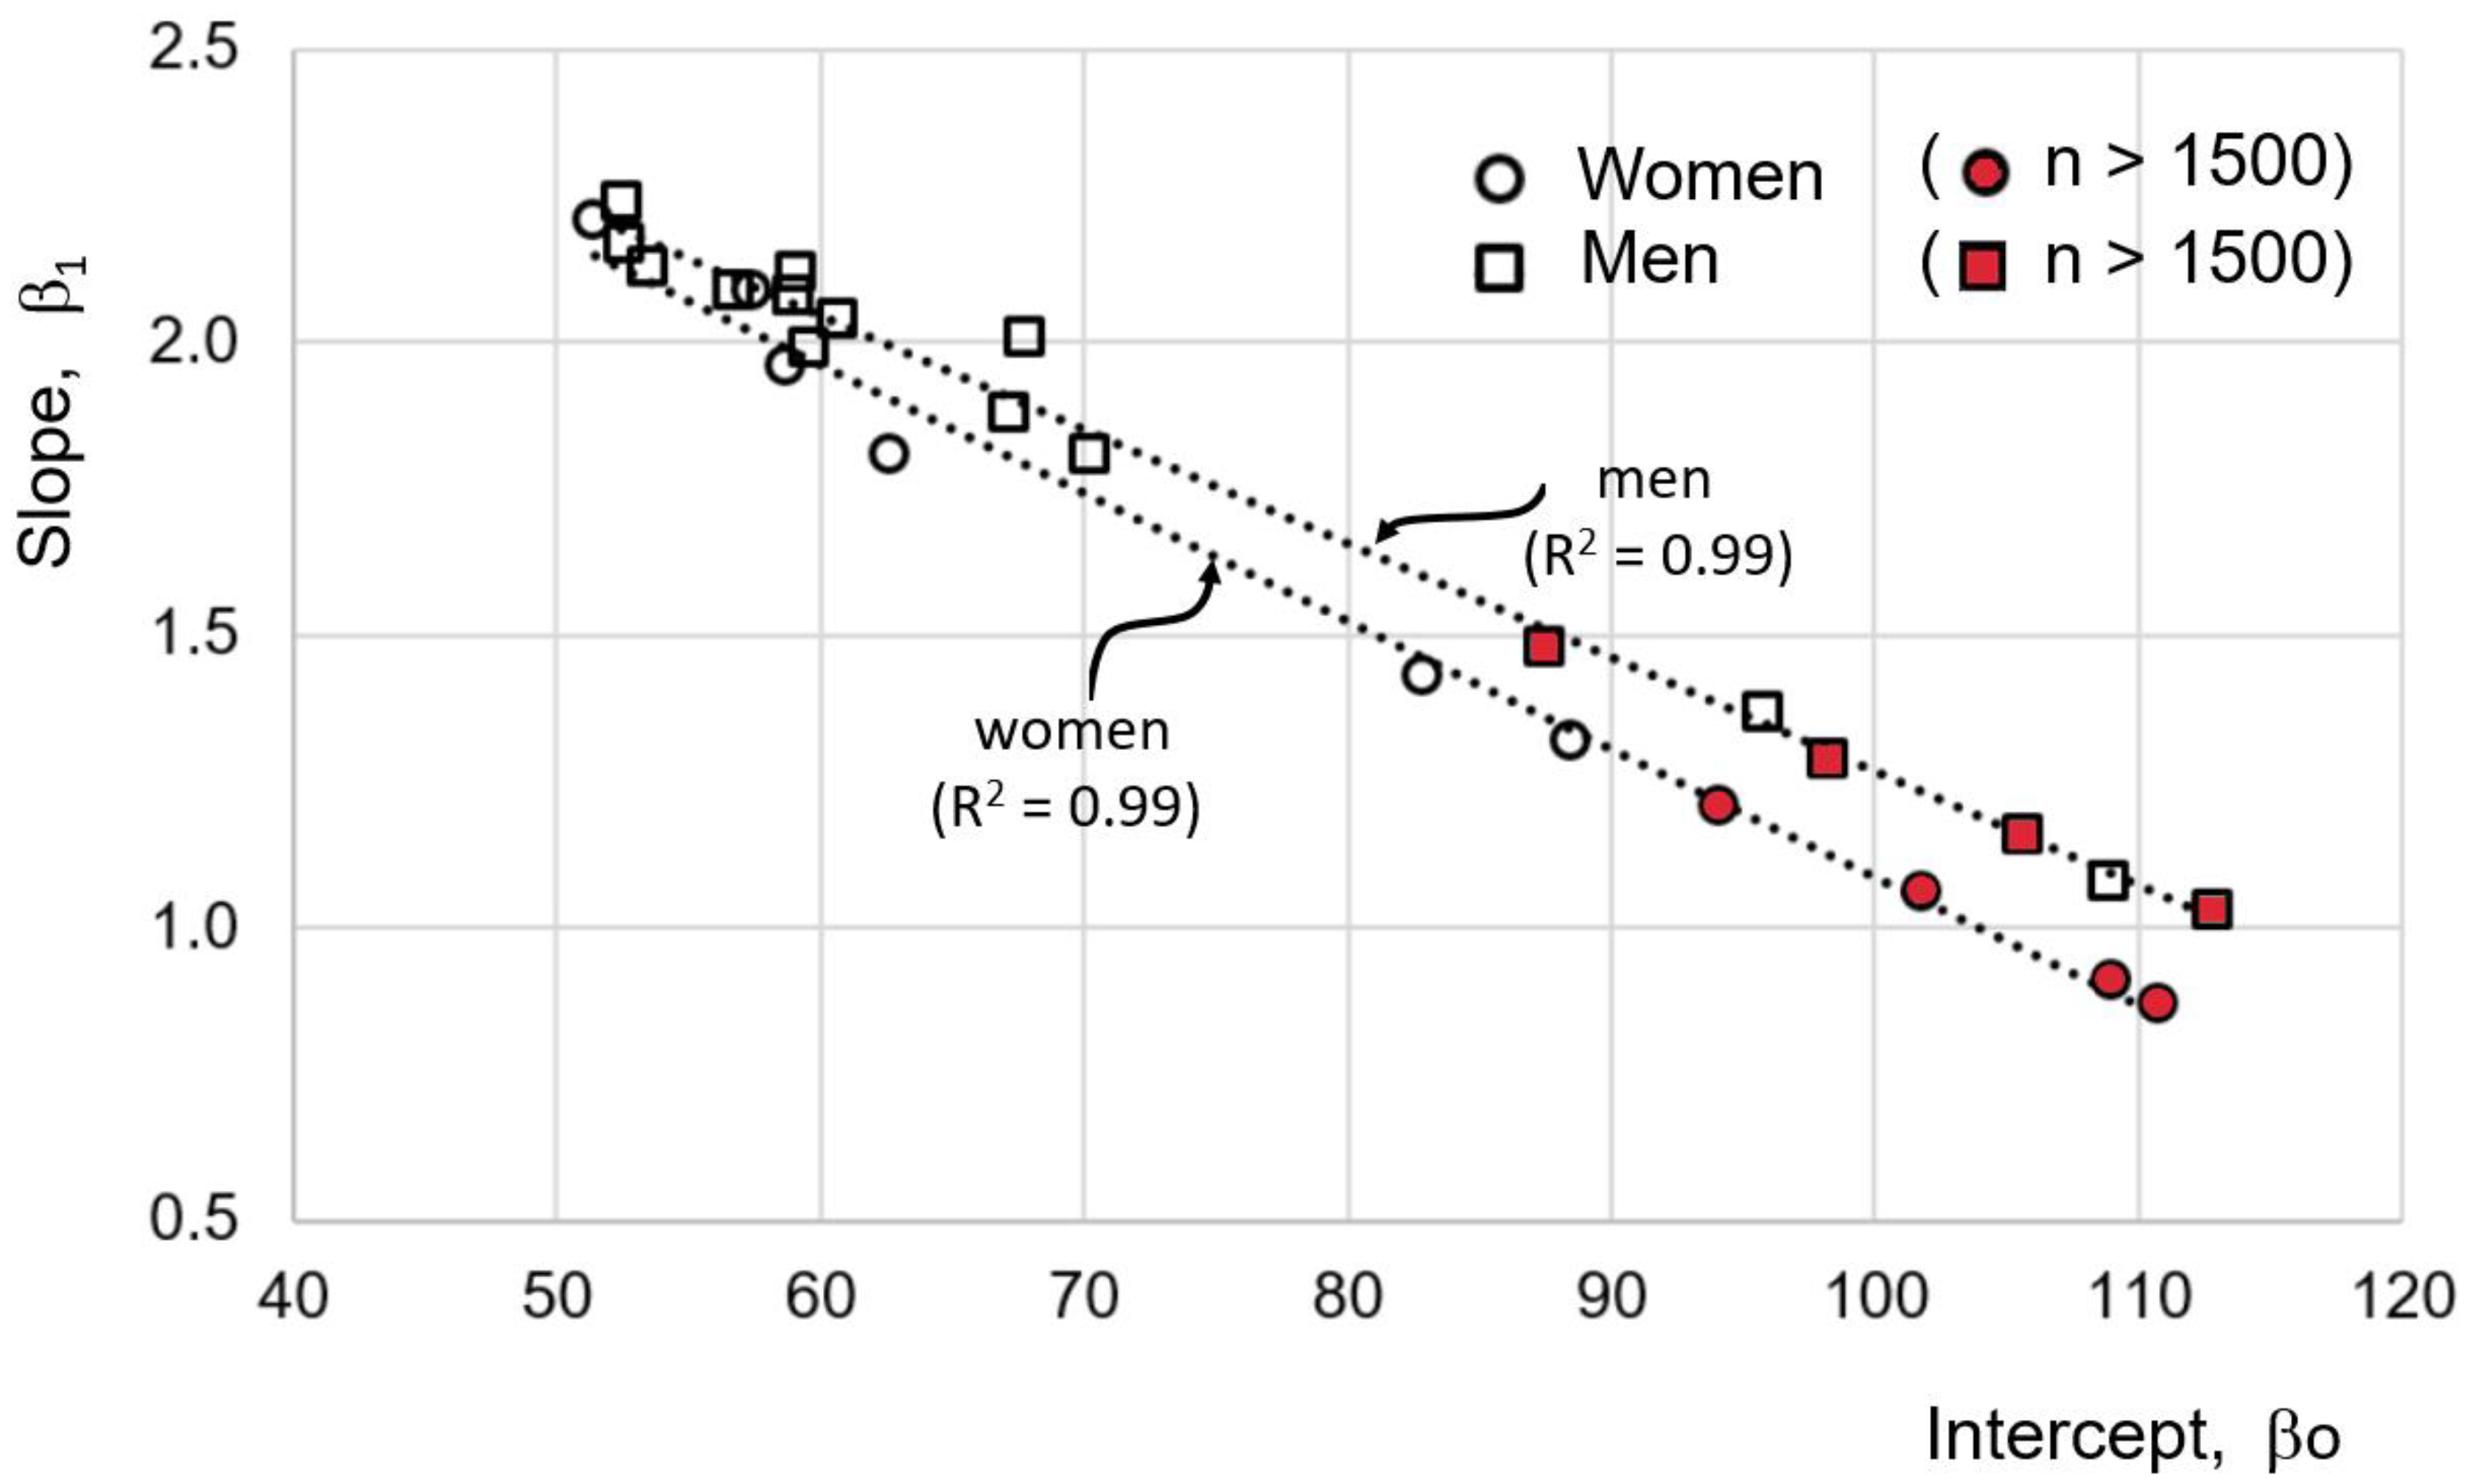
- The average of R2 is 0.67 for eqs of women and 0.68 for eq of men (Table 5).
- -
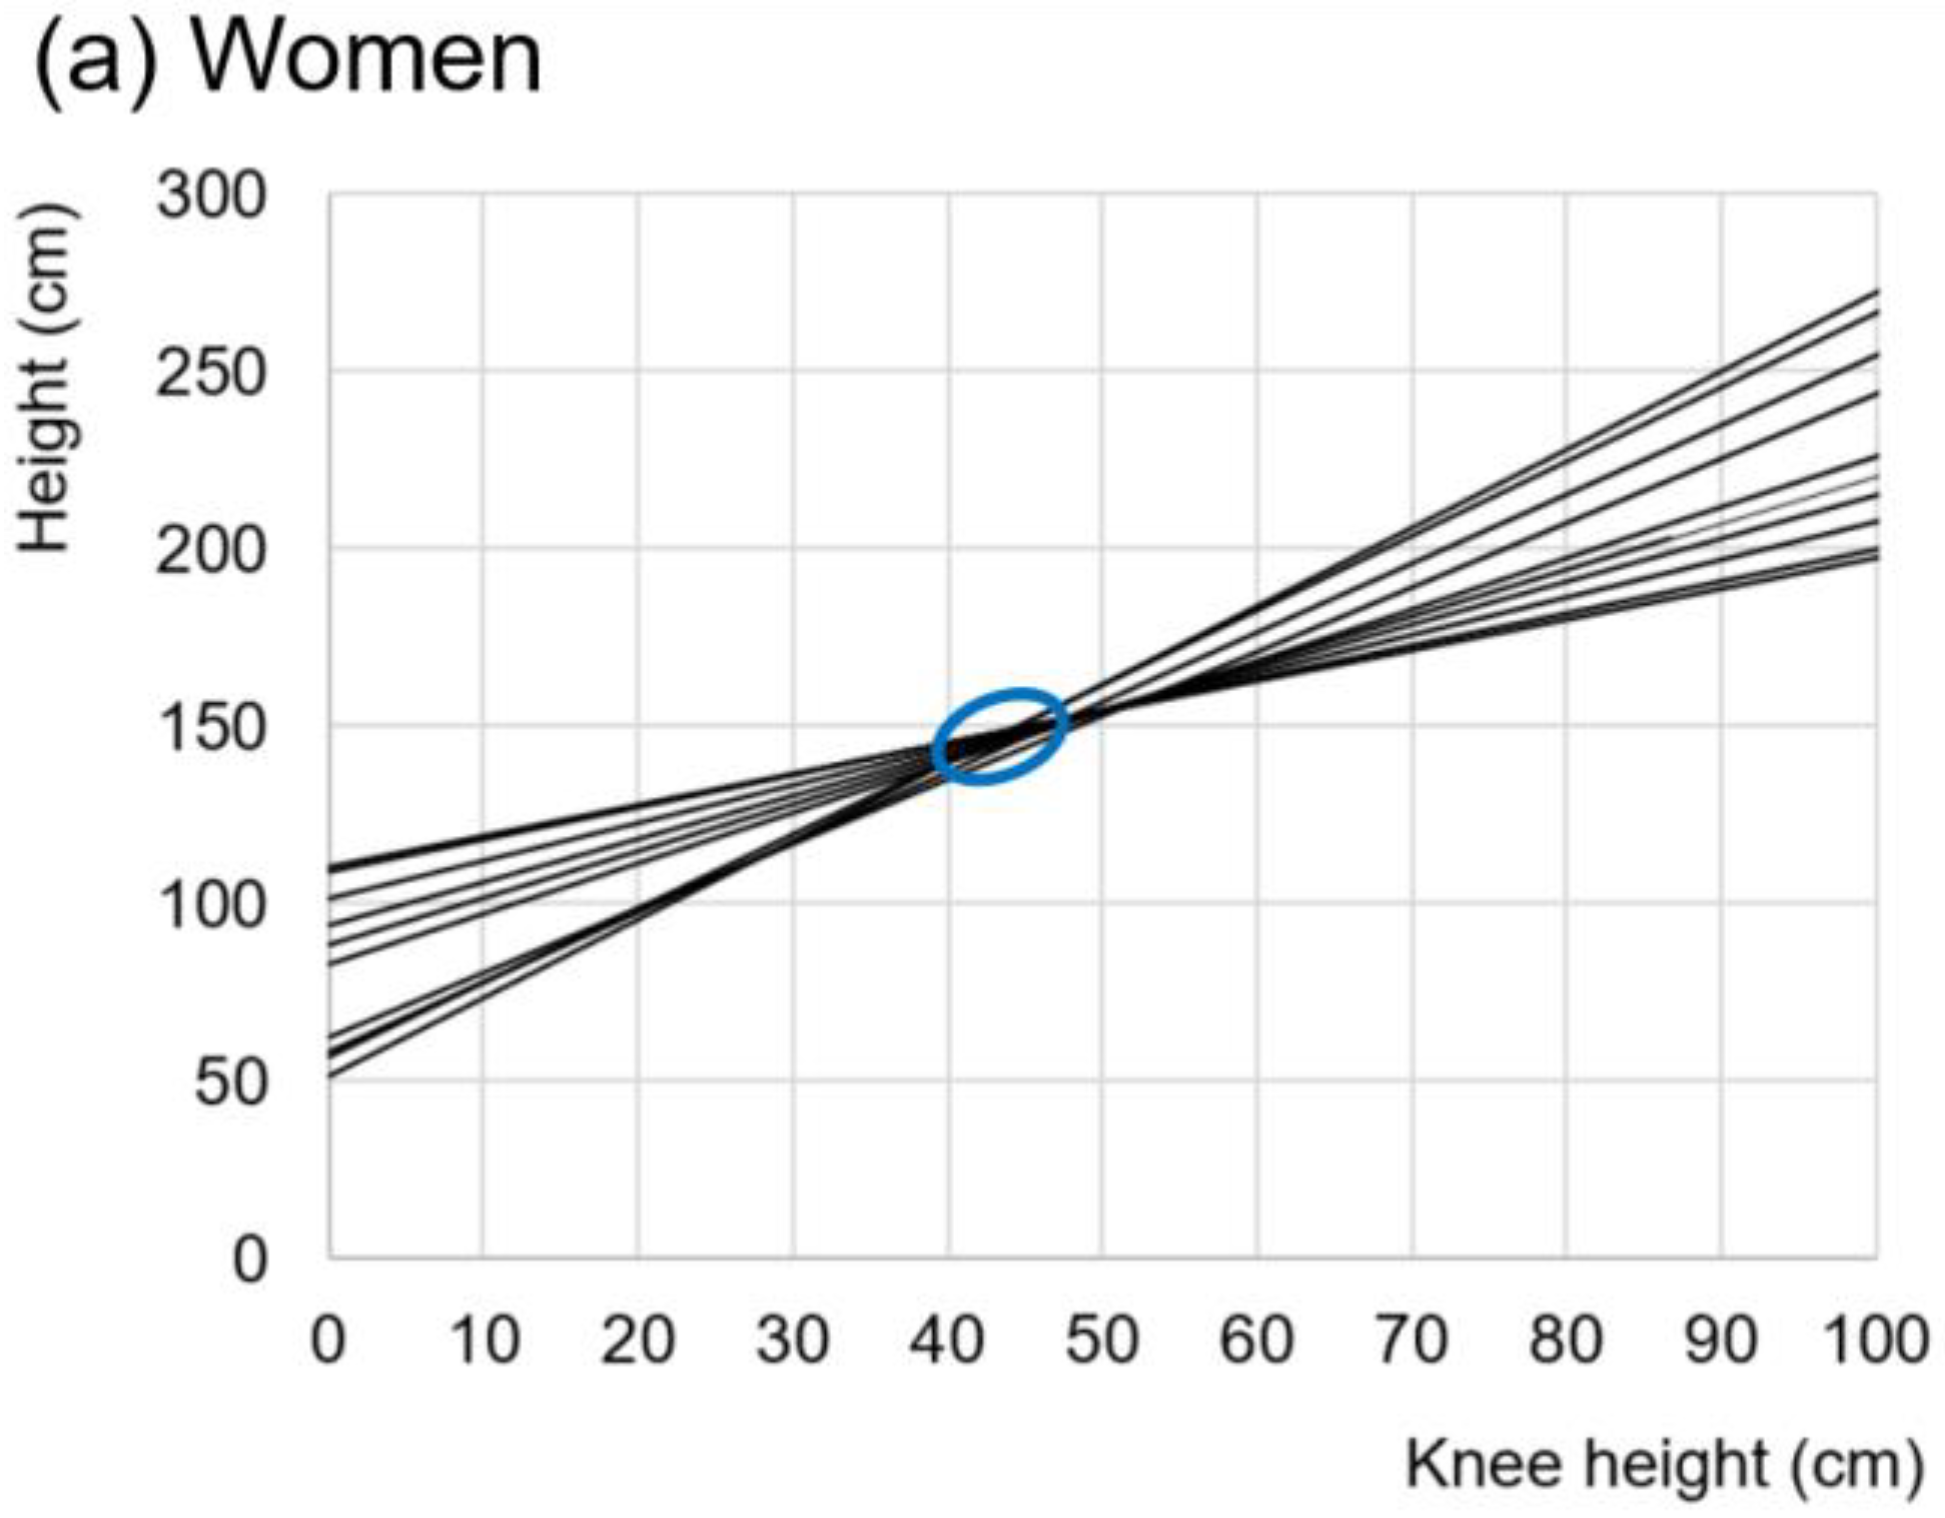
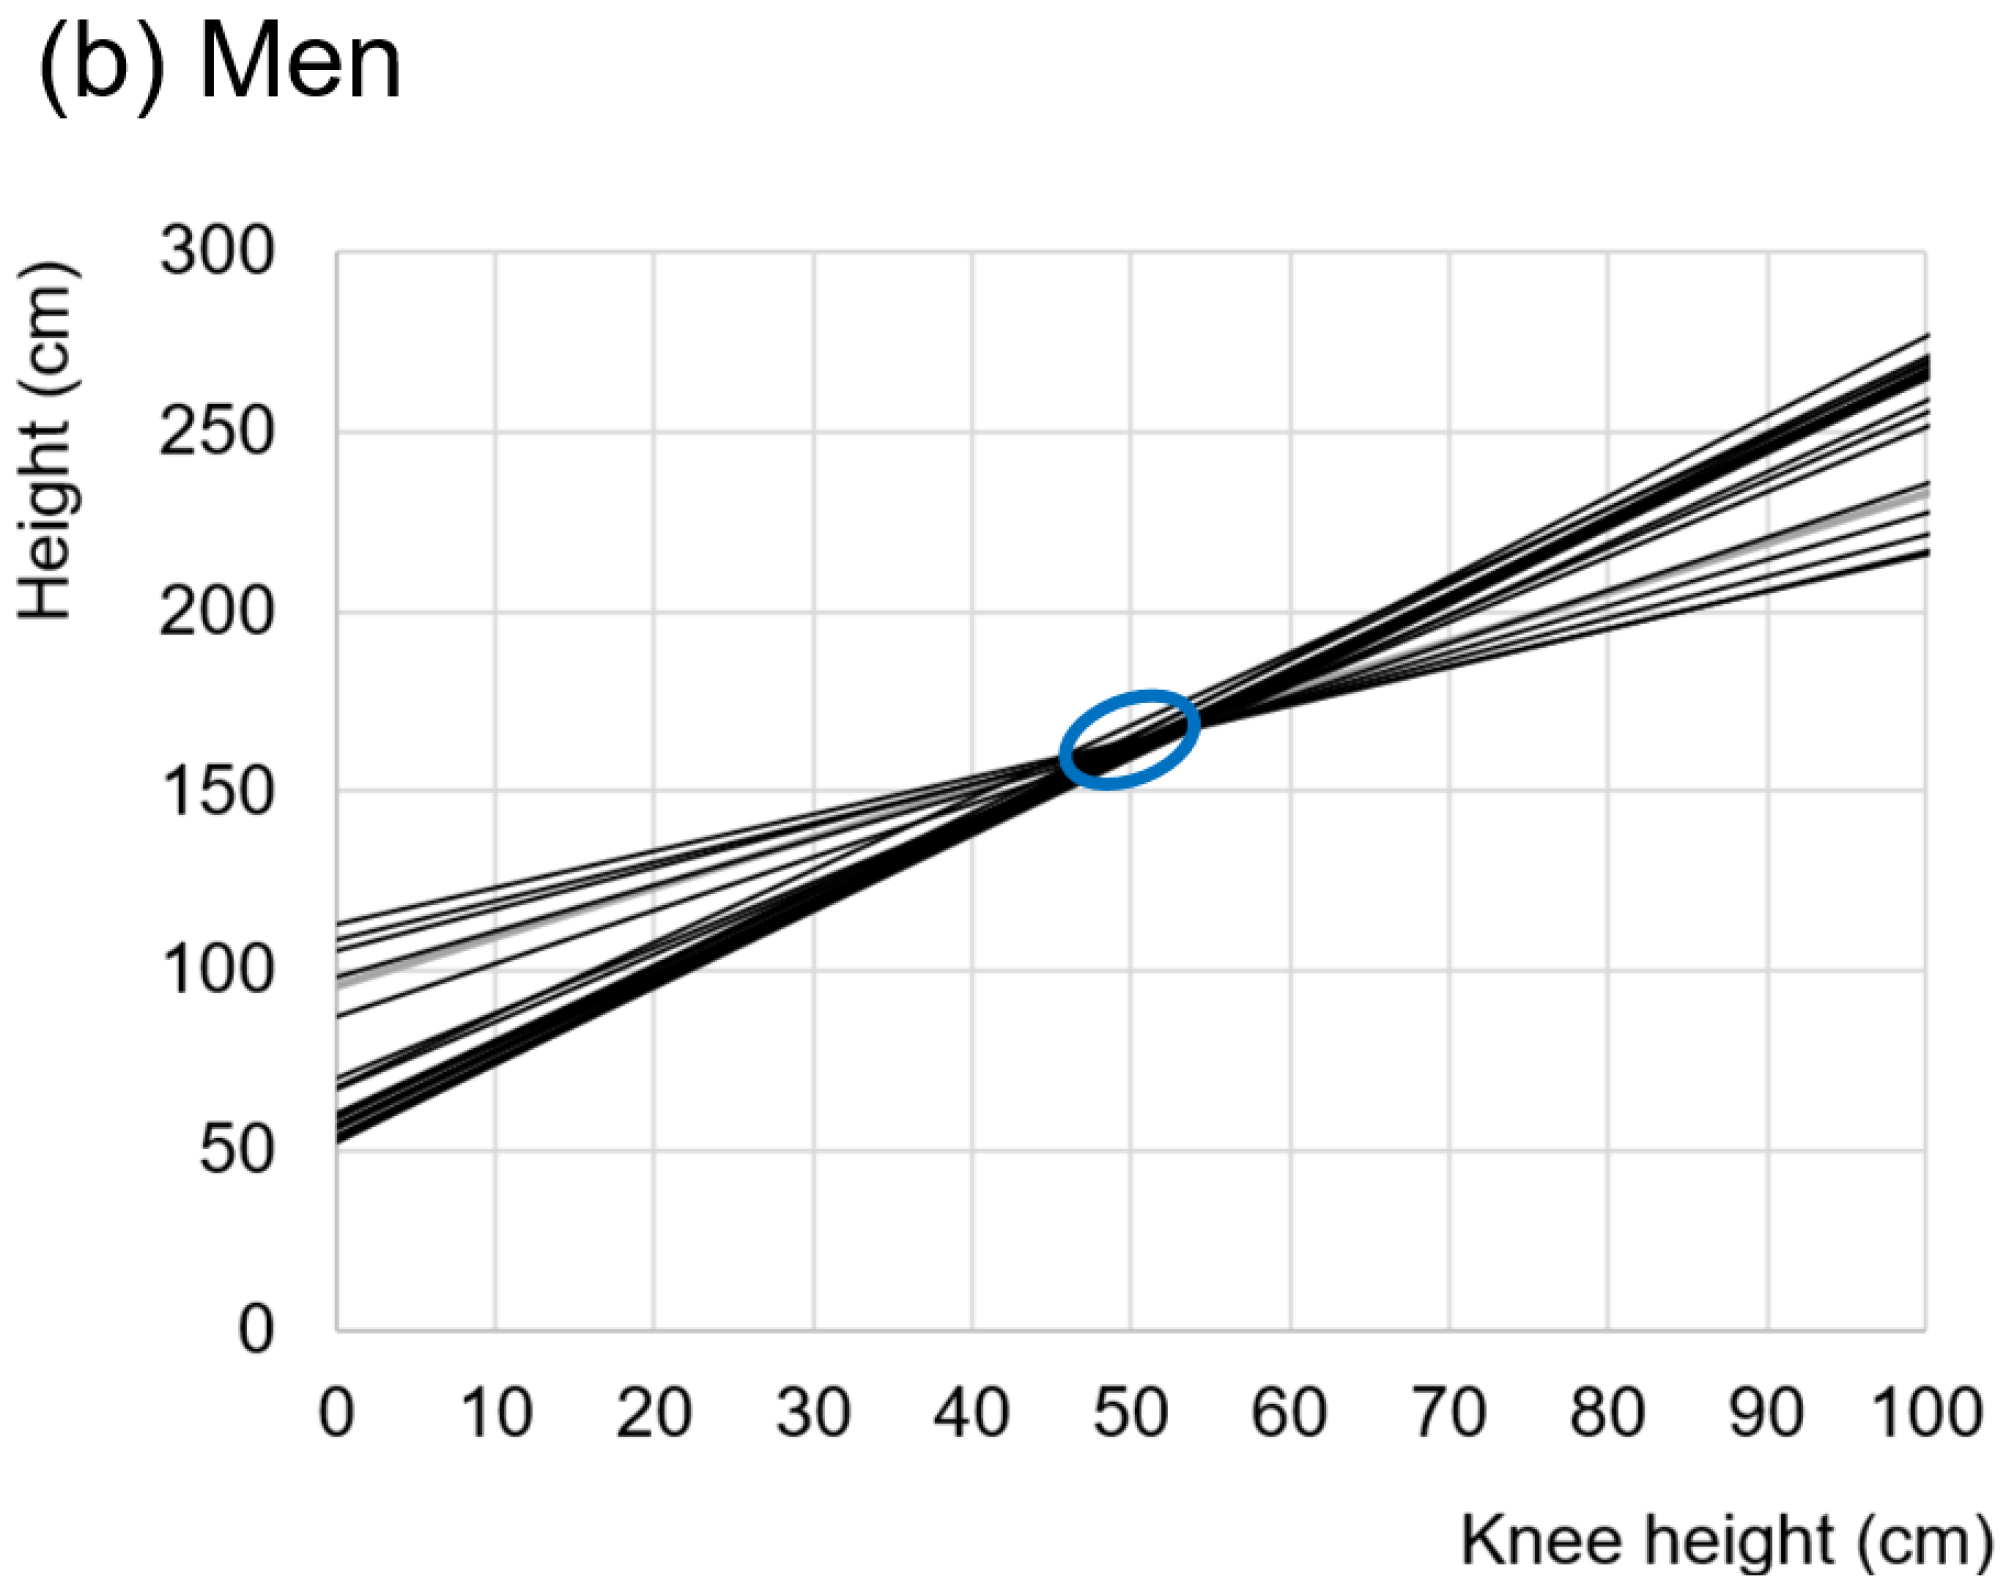
- When plotting the slopes against the y-intercepts, a straight line with R2 of 0.99 is formed, both for eqs for women as well as men (Figure 3).
- -
- In eqs with more than 1500 participants, the intercept is closer to unity (symbols in red in Figure 3), and they are never greater than 1.5. A total of 90% of the equations with slopes greater than 1.5 were derived from less than 500 participants’ samples.
4. Discussion
- What do the results mean?
- 2.
- Highlighting its clinical importance.
- 3.
- In what way and why are the results similar or different between the different authors?
- 4.
- What does this study add to science?
- 5.
- What are the strengths and weaknesses of this study?
4.1. Equations Reported in the Literature
4.2. Estimation of the Parameters of Linear Equations
- -
- women: maximum height = 97.40 + 1.14 · KH +
- -
- men: maximum height = 101.03 + 1.24 · KH +
4.3. Intrinsic Allometric Variability of the Human Being
4.4. Towards the Search for More Precise Allometric Relationships
4.5. Bone Growth and Genetics
5. Conclusions
Author Contributions
Funding
Institutional Review Board Statement
Informed Consent Statement
Data Availability Statement
Conflicts of Interest
References
- Ihira, H.; Sawada, N.; Iwasaki, M.; Yamaji, T.; Goto, A.; Noda, M.; Iso, H.; Tsugane, S.; The JPHC Study Group. Adult height and all-cause and cause-specific mortality in the Japan public health center-based prospective study (JPHC). PLoS ONE 2018, 13, e0197164. [Google Scholar] [CrossRef] [PubMed]
- Lettre, G. Recent progress in the study of the genetics of height. Hum. Genet. 2011, 129, 465–472. [Google Scholar] [CrossRef] [PubMed]
- Fernihough, A.; McGovern, M.E. Physical stature decline and the health status of the elderly population in England. Econ. Hum. Biol. 2015, 16, 30–44. [Google Scholar] [CrossRef]
- Dey, D.K.; Rothenberg, E.; Sundh, V.; Bosaeus, I.; Steen, B. Height and body weight in the elderly. I. A 25-year longitudinal study of a population aged 70 to 95 years. Eur. J. Clin. Nutr. 1999, 53, 905–914. [Google Scholar] [CrossRef] [PubMed]
- Ayuda, M.-I.; Puche-Gil, J. Determinants of height and biological inequality in Mediterranean Spain, 1859–1967. Econ. Hum. Biol. 2014, 15, 101–119. [Google Scholar] [CrossRef] [PubMed]
- Ipsen, J.; Nowak-Szczepanska, N.; Gomula, A.; Aßmann, C.; Hermanussen, M. The association of body height, height variability and inequality. Anthropol. Anz. 2016, 73, 1–6. [Google Scholar] [CrossRef] [PubMed]
- Silventoinen, K. Determinants of variation in adult body height. J. Biosoc. Sci. 2003, 35, 263–285. [Google Scholar] [CrossRef]
- Bozzoli, C.; Deaton, A.; Quintana-Domeque, C. Adult height and childhood disease. Demography 2009, 46, 647–669. [Google Scholar] [CrossRef]
- Nelson, C.P.; Hamby, S.E.; Saleheen, D.; Hopewell, J.C.; Zeng, L.; Assimes, T.L.; Kanoni, S.; Willenborg, C.; Burgess, S.; Amouyel, P.; et al. Genetically determined height and coronary artery disease. N. Engl. J. Med. 2015, 372, 1608–1618. [Google Scholar] [CrossRef]
- Sabah, K.; Chowdhury, A.W.; Khan, H.L.R.; Hasan, A.H.; Haque, S.; Ali, S.; Kawser, S.; Alam, N.; Amin, G.; Mahabub, S.M.E. Body mass index and waist/height ratio for prediction of severity of coronary artery disease. BMC Res. Notes 2014, 7, 246. [Google Scholar] [CrossRef]
- Wall-Medrano, A.; Ramos-Jiménez, A.; Hernandez-Torres, R.P.; Villalobos-Molina, R.; Tapia-Pancardo, D.C.; Jiménez-Flores, J.R.; Méndez-Cruz, A.R.; Murguía-Romero, M.; Gallardo-Ortíz, I.; Urquídez-Romero, R. Cardiometabolic risk in young adults from northern Mexico: Revisiting body mass index and waist-circumference as predictors. BMC Public Health 2016, 16, 236. [Google Scholar] [CrossRef] [PubMed]
- Warrier, V.; Krishan, K.; Shedge, R.; Kanchan, T. Height assessment. In StatPearls, Continuing Education; StatPearls Publishing: Treasure Island, FL, USA, 2021. Available online: https://www.ncbi.nlm.nih.gov/books/NBK551524/ (accessed on 26 July 2021).
- Harrell, F.E. Multivariable modeling strategies. In Regression Modeling Strategies; Springer: Cham, Switzerland, 2015; pp. 63–102. [Google Scholar]
- Nick, T.G.; Hardin, J.M. Regression modeling strategies: An illustrative case study from medical rehabilitation outcomes research. Am. J. Occup. Ther. 1999, 53, 459–470. [Google Scholar] [CrossRef] [PubMed]
- Nunez, E.; Steyerberg, E.W.; Núñez, J. Regression modeling strategies. Rev. Esp. Cardiol. 2011, 64, 501–507. [Google Scholar] [PubMed]
- De Lima, M.F.S.; de Oliveira, L.P.; de Araujo Cabral, N.L.; Liberalino, L.C.P.; Bagni, U.V.; de Lima, K.C.; de Oliveira Lyra, C. Estimating the height of elderly nursing home residents: Which equation to use? PLoS ONE 2018, 13, e0205642. [Google Scholar] [CrossRef]
- Rai, P.; Das, A.; Agrawal, A.K.; Arora, D. Physical anthropometry in estimation of stature: A systematic review. Int. J. Curr. Res. Rev. 2020, 12, 75–79. [Google Scholar] [CrossRef]
- Ćosić, P.; Lisjak, D.; Antolić, D. The iterative multiobjective method in optimization process planning. The. Vjesn. Znan.-Stručni Čas. Teh. Fak. Sveuč. Osijeku 2010, 17, 75–81. [Google Scholar]
- Ojeda, C.J.; Rocco, C. Metodología para selección de modelos de regresión lineal múltiple basada en métodos multiobjetivo. In Proceedings of the XXI Simposio de Estadística Modelos de Regresión, Bogotá, Colombia, 19–23 July 2011; Available online: https://www.researchgate.net/publication/259822092_Metodologia_para_seleccion_de_modelos_de_regresion_lineal_multiple_basada_en_metodos_multiobjetivo (accessed on 18 April 2022).
- Page, M.J.; Moher, D.; Bossuyt, P.M.; Boutron, I.; Hoffmann, T.C.; Mulrow, C.D.; Shamseer, L.; Tetzlaff, J.M.; Akl, E.A.; Brennan, S.E.; et al. PRISMA 2020 explanation and elaboration: Updated guidance and exemplars for reporting systematic reviews. BMJ 2021, 372, n160. [Google Scholar] [CrossRef]
- Kleinbaum, D.G.; Kupper, L.L.; Nizam, H.; Rosenberg, E.S. Applied Regression Analysis and Other Multivariable Methods, 5th ed.; Cengage Learning: Boston, MA, USA, 2014; 1051p, Available online: https://books.google.com.ec/books?id=v590AgAAQBAJ&printsec=frontcover#v=onepage&q&f=false (accessed on 18 April 2022).
- Chumlea, W.C.; Roche, A.F.; Steinbaugh, M.L. Estimating stature from knee height for persons 60 to 90 years of age. J. Am. Geriatr. Soc. 1985, 33, 116–120. [Google Scholar] [CrossRef]
- Jésus, P.; Marin, B.; Pilleron, S.; Guerchet, M.; Mbelesso, P.; Ndamba-Bandzouzi, B.; Preux, P.-M.; Fayemendy, P.; Desport, J.-C. Predictive formulas for estimation of height in sub-Saharan African older people: A new formula (EPIDEMCA study). Nutrition 2020, 73, 110725. [Google Scholar] [CrossRef]
- Palloni, A.; Guend, A. Stature prediction equations for elderly Hispanics in Latin American countries by sex and ethnic background. J. A Biol. Sci. Med. Sci. 2005, 60, 804–810. [Google Scholar] [CrossRef][Green Version]
- Albala, C.; Lebrão, M.L.; León Díaz, E.M.; Ham-Chande, R.; Hennis, A.J.; Palloni, A.; Pratts, O. Encuesta salud, bienestar y envejecimiento (SABE): Metodología de la encuesta y perfil de la población estudiada. Rev. Panam. Salud Pública 2005, 17, 307–322. [Google Scholar] [CrossRef] [PubMed]
- Chumlea, W.C.; Guo, S. Equations for predicting stature in white and black elderly individuals. J. Gerontol. 1992, 47, M197–M203. [Google Scholar] [CrossRef] [PubMed]
- Chumlea, W.C.; Guo, S.S.; Wholihan, K.; Cockram, D.; Kuczmarski, R.J.; Johnson, C.L. Stature prediction equations for elderly non-Hispanic white, non-Hispanic black, and Mexican-American persons developed from NHANES III data. J. Am. Diet. Assoc. 1998, 98, 137–142. [Google Scholar] [CrossRef]
- Hye-Jung, K. Size Korea 2004. Fash. Inform. Technol. 2004, 1, 81–88. [Google Scholar]
- Nguyen, T.H.; Ma, Y.N.; Nguyen, L.T. A knee height equation for estimating height of Vietnamese adults. Nutr. Today 2021, 56, 306–310. [Google Scholar] [CrossRef]
- Bermúdez, O.I.; Becker, E.K.; Tucker, K.L. Development of sex-specific equations for estimating stature of frail elderly Hispanics living in the northeastern United States. Am. J. Clin. Nutr. 1999, 69, 992–998. [Google Scholar] [CrossRef][Green Version]
- Hwang, I.C.; Kim, K.K.; Kang, H.C.; Kang, D.R. Validity of stature-predicted equations using knee height for elderly and mobility impaired persons in Koreans. Epidemiol. Health 2009, 31, e2009004. [Google Scholar] [CrossRef]
- Jiménez-Fontana, P.; Corea, A. Ecuaciones de predicción de la talla a partir de la altura de la rodilla de los adultos mayores de Costa Rica. Poblac. Salud Mesoam. 2014, 12, 68–85. [Google Scholar] [CrossRef]
- Karadag, B.; Ozturk, A.O.; Sener, N.; Altuntas, Y. Use of knee height for the estimation of stature in elderly Turkish people and their relationship with cardiometabolic risk factors. Arch. Gerontol. Geriatr. 2012, 54, 82–89. [Google Scholar] [CrossRef]
- Lera, L.; Santos, J.L.; García, C.; Arroyo, P.; Albala, C. Predictive equations for stature in the elderly: A study in three Latin American cities. Ann. Hum. Biol. 2005, 32, 773–781. [Google Scholar] [CrossRef]
- Malnutrition Advisory Group (MAG). The “MUST” Explanatory Booklet; Malnutrition Action Group (MAG), British Association for Parenteral Enteral Nutrition: Redditch, UK, 2011; 32p, Available online: https://www.bapen.org.uk/pdfs/must/must_explan.pdf (accessed on 18 April 2022).
- Mendoza-Núnez, V.M.; Sánchez-Rodríguez, M.A.; Cervantes-Sandoval, A.; Correa-Muñoz, E.; Vargas-Guadarrama, L.A. Equations for predicting height for elderly Mexican Americans are not applicable for elderly Mexicans. Am. J. Hum. Biol. 2002, 14, 351–355. [Google Scholar] [CrossRef] [PubMed]
- Narančić, N.S.; Miličić, J.; Tomas, Ž.; Zajc Petranović, M.; Škarić-Jurić, T.; Tomek-Roksandić, S. Anthropometric indices of nutritional status in Croatian oldest old: New equations to predict height and weight. Period. Biol. 2013, 115, 483–489. [Google Scholar]
- Pertiwi, J.; Kartasurya, M.I.; Lukmono, D.T.H.; Setyawan, H.; Martini, M. A calculating actual stature of elderly through arm span and knee height measurements. Health Notion 2018, 2, 265–270. [Google Scholar]
- Ritz, P.; Vol, S.; Goxe, D.; Quentel-Soroko, M.F.; Berrut, G.; Tichet, J. Estimation of height from knee-heel length in middle age Caucasian adults. e-SPEN Eur. e-J. Clin. Nutr. Metab. 2007, 2, 17–20. [Google Scholar] [CrossRef][Green Version]
- Weinbrenner, T.; Vioque, J.; Barber, X.; Asensio, L. Estimation of height and body mass index from demi-span in elderly individuals. Gerontology 2006, 52, 275–281. [Google Scholar] [CrossRef] [PubMed]
- Zhang, H.; Hsu-Hage, B.H.; Wahlqvist, M.L. The use of knee height to estimate maximum stature in elderly Chinese. J. Nutr. Health Aging 1998, 2, 84–87. [Google Scholar] [PubMed]
- Huxley, J.S.; Teissier, G. Terminology of relative growth. Nature 1936, 137, 780–781. [Google Scholar] [CrossRef]
- Sun, P.; He, L.; Jia, K.; Yue, Z.; Li, S.; Jin, Y.; Li, Z.; Siwko, S.; Xue, F.; Su, J.; et al. Regulation of body length and bone mass by Gpr126/Adgrg6. Sci. Adv. 2020, 6, eaaz0368. [Google Scholar] [CrossRef]
- Muftić, O.; Milčić, D. Anthropology and ergonomy. In Physical (Biological) Anthropology; EOLSS Publications: Abu Dhabi, United Arab Emirates, 2009; p. 129. [Google Scholar]
- Fogal, A.S.; Franceschini, S.D.C.C.; Priore, S.E.; Cotta, R.M.M.; Ribeiro, A.Q. Stature estimation using the knee height measurement amongst Brazilian elderly. Nutr. Hosp. 2015, 31, 829–834. [Google Scholar]
- Cape, W.; Marais, D.; Marais, M.L.; Labadarios, D. Use of Knee height as a surrogate measure of height in older South Africans. S. Afr. J. Clin. Nutr. 2007, 20, 39–44. [Google Scholar] [CrossRef]
- Elia, M. Nutritional screening of adults: A multidisciplinary responsibility. In The ‘MUST’ Report; Malnutrition Advisory Group, The British Association for Parenteral and Enteral Nutrition: Redditch, UK, 2003; Available online: https://www.bapen.org.uk/pdfs/must/must-report.pdf (accessed on 18 April 2022).
- Gayon, J. History of the concept of allometry. Am. Zool. 2000, 40, 748–758. [Google Scholar] [CrossRef]
- Gould, S.J. Geometric similarity in allometric growth: A contribution to the problem of scaling in the evolution of size. Am. Nat. 1971, 105, 113–136. [Google Scholar] [CrossRef]
- Fischer, B.; Mitteroecker, P. Allometry and sexual dimorphism in the human pelvis. Anat. Rec. 2017, 300, 698–705. [Google Scholar] [CrossRef] [PubMed]
- Mogha, A.; Benesh, A.E.; Patra, C.; Engel, F.B.; Schöneberg, T.; Liebscher, I.; Monk, K.R. Gpr126 functions in Schwann cells to control differentiation and myelination via G-protein activation. J. Neurosci. 2013, 33, 17976–17985. [Google Scholar] [CrossRef]
- Liebscher, I.; Schön, J.; Petersen, S.C.; Fischer, L.; Auerbach, N.; Demberg, L.M.; Mogha, A.; Cöster, M.; Simon, K.-U.; Rothemund, S.; et al. A tethered agonist within the ectodomain activates the adhesion G protein-coupled receptors GPR126 and GPR133. Cell Rep. 2014, 9, 2018–2026. [Google Scholar] [CrossRef]
- Guzmán-Silva, A.; García-Sáinz, J. Receptores acoplados a proteínas G y sus múltiples facetas. Mens. Bioquim. 2018, 42, 118–129. [Google Scholar]


| 1. Partial search of the literature on the subject: A.R.J. |
| 2. Encounter of a possible problem-or study opportunity: A.R.J. |
| 3. Selection of participants: A.R.J. |
| 4. Project design and planning: The whole team |
| 5. Partial and independent search in the literature about the topic: The whole team. |
| 6. Selection of the question and study hypothesis: The whole team. |
| 7. Selection of keywords and elaboration of the syntax for the search of manuscripts in the literature: The whole team. |
| 8. Preparation of inclusion and exclusion criteria: The whole team. |
| 9. Exhaustive and independent search of the manuscripts in reliable metasearch engines: A.R.J., I.A.C.G., J.A.A.S., and M.G.V. |
| 10. Creation of a database of the manuscripts found (Zotero): A.R.J. |
| 11. Elimination of repeated articles: A.R.J. |
| 12. Independent selection by the title of the manuscripts found and the database created in Zotero: A.R.J., I.A.C.G., J.A.A.S., and M.G.V. |
| 13. Elimination of repeated articles: A.R.J. |
| 14. Independent selection by the abstract reading of the selected manuscripts by title: A.R.J., I.A.C.G., J.A.A.S., and M.G.V. |
| 15. Elimination of repeated articles: A.R.J. |
| 16. Selection of the chosen manuscripts to complete reading of the manuscript: The whole team. |
| 17. Analysis, elaboration of Tables, Figures, and discussion of the results: A.R.J., R.P.H.T., and M.M.R. |
| 18. Preparation of the final manuscript: A.R.J, R.P.H.T, and M.M.R. |
| Validity Criteria (Accuracy) |
| 1. Provide a clear and complete description of the methods and procedures. |
| 2. Use of valid and reliable instruments for data collection. If necessary, mention the calibration processes of the instruments. |
| 3. Use of standardized measurement procedures. |
| 4. Technical training in anthropometrics. |
| 5. Randomization and sample size: In this work, we consider an n ≥ 100 and 10 more for each independent variable added to the model; the previous is to favor the central limit theorem or normal distribution of the data. |
6. Report of measurement errors:
|
| 7. Internal validation analysis or cross-validation (generally 50–50% or 80–20% in small populations) and external validation of the model or independent validation (≥50). |
| Reliability Criteria (Precision) |
| 1. Use of normal distribution of the data for each variable in the model. |
2. Elimination or correction of outliers and/or transformation of the data.
|
| 3. Make data transformation in case of outliers cannot be removed or corrected. The data transformation commonly homogenizes the database and makes its estimates more robust; e.g., logarithm, root, power, or exponents transformations normalize the data, remove outliers, and randomize the residuals. |
| 4. Linearity between the dependent and independent variables. Plot the raw data between them and observe their kinetics; if necessary, make transformations. |
| 5. Homoscedasticity or constant variance of the residuals. |
| 6. Theoretical coherence of the associations: expected signs and relevant variables present in the model. |
| 7. Independence of errors or residuals. |
| 8. Normal distribution of errors or residuals. |
| 9. Non-multicollinearity. |
| 10. Determination coefficients: R2 and adjusted R2, plus their confidence intervals. The last two, especially if they are two or more independent variables. |
| 11. Hypothesis test for the general model and the independent variables: generally, p < 0.05. |
12. Model goodness-of-fit criteria.
|
13. Degree of agreement or concordance between the measured value and that estimated by the model:
|
| 14. Have in mind the principle of parsimony, simplicity, and economy. |
| 15. Carry out the inclusion of confounding factors in the models. |
| Sex | Women | Men |
|---|---|---|
| No. Equations | 10 | 18 |
| Total participants | 15,937 | 11,394 |
| Mean R2 | 0.67 | 0.68 |
| Mean CV (Height) | 4.8% | 4.2% |
Publisher’s Note: MDPI stays neutral with regard to jurisdictional claims in published maps and institutional affiliations. |
© 2022 by the authors. Licensee MDPI, Basel, Switzerland. This article is an open access article distributed under the terms and conditions of the Creative Commons Attribution (CC BY) license (https://creativecommons.org/licenses/by/4.0/).
Share and Cite
Ramos-Jiménez, A.; Hernández-Torres, R.P.; Chávez-Guevara, I.A.; Alvarez-Sanchez, J.A.; García-Villalvazo, M.A.; Murguía-Romero, M. Anthropometric Equations to Determine Maximum Height in Adults ≥ 60 Years: A Systematic Review. Int. J. Environ. Res. Public Health 2022, 19, 5072. https://doi.org/10.3390/ijerph19095072
Ramos-Jiménez A, Hernández-Torres RP, Chávez-Guevara IA, Alvarez-Sanchez JA, García-Villalvazo MA, Murguía-Romero M. Anthropometric Equations to Determine Maximum Height in Adults ≥ 60 Years: A Systematic Review. International Journal of Environmental Research and Public Health. 2022; 19(9):5072. https://doi.org/10.3390/ijerph19095072
Chicago/Turabian StyleRamos-Jiménez, Arnulfo, Rosa P. Hernández-Torres, Isaac A. Chávez-Guevara, José A. Alvarez-Sanchez, Marco A. García-Villalvazo, and Miguel Murguía-Romero. 2022. "Anthropometric Equations to Determine Maximum Height in Adults ≥ 60 Years: A Systematic Review" International Journal of Environmental Research and Public Health 19, no. 9: 5072. https://doi.org/10.3390/ijerph19095072
APA StyleRamos-Jiménez, A., Hernández-Torres, R. P., Chávez-Guevara, I. A., Alvarez-Sanchez, J. A., García-Villalvazo, M. A., & Murguía-Romero, M. (2022). Anthropometric Equations to Determine Maximum Height in Adults ≥ 60 Years: A Systematic Review. International Journal of Environmental Research and Public Health, 19(9), 5072. https://doi.org/10.3390/ijerph19095072