
Associations of Dietary Intake with Urinary Melamine and Derivative Concentrations among Children in the GAPPS Cohort

 , , ,
, , , 

Abstract
:
1. Introduction
2. Methods
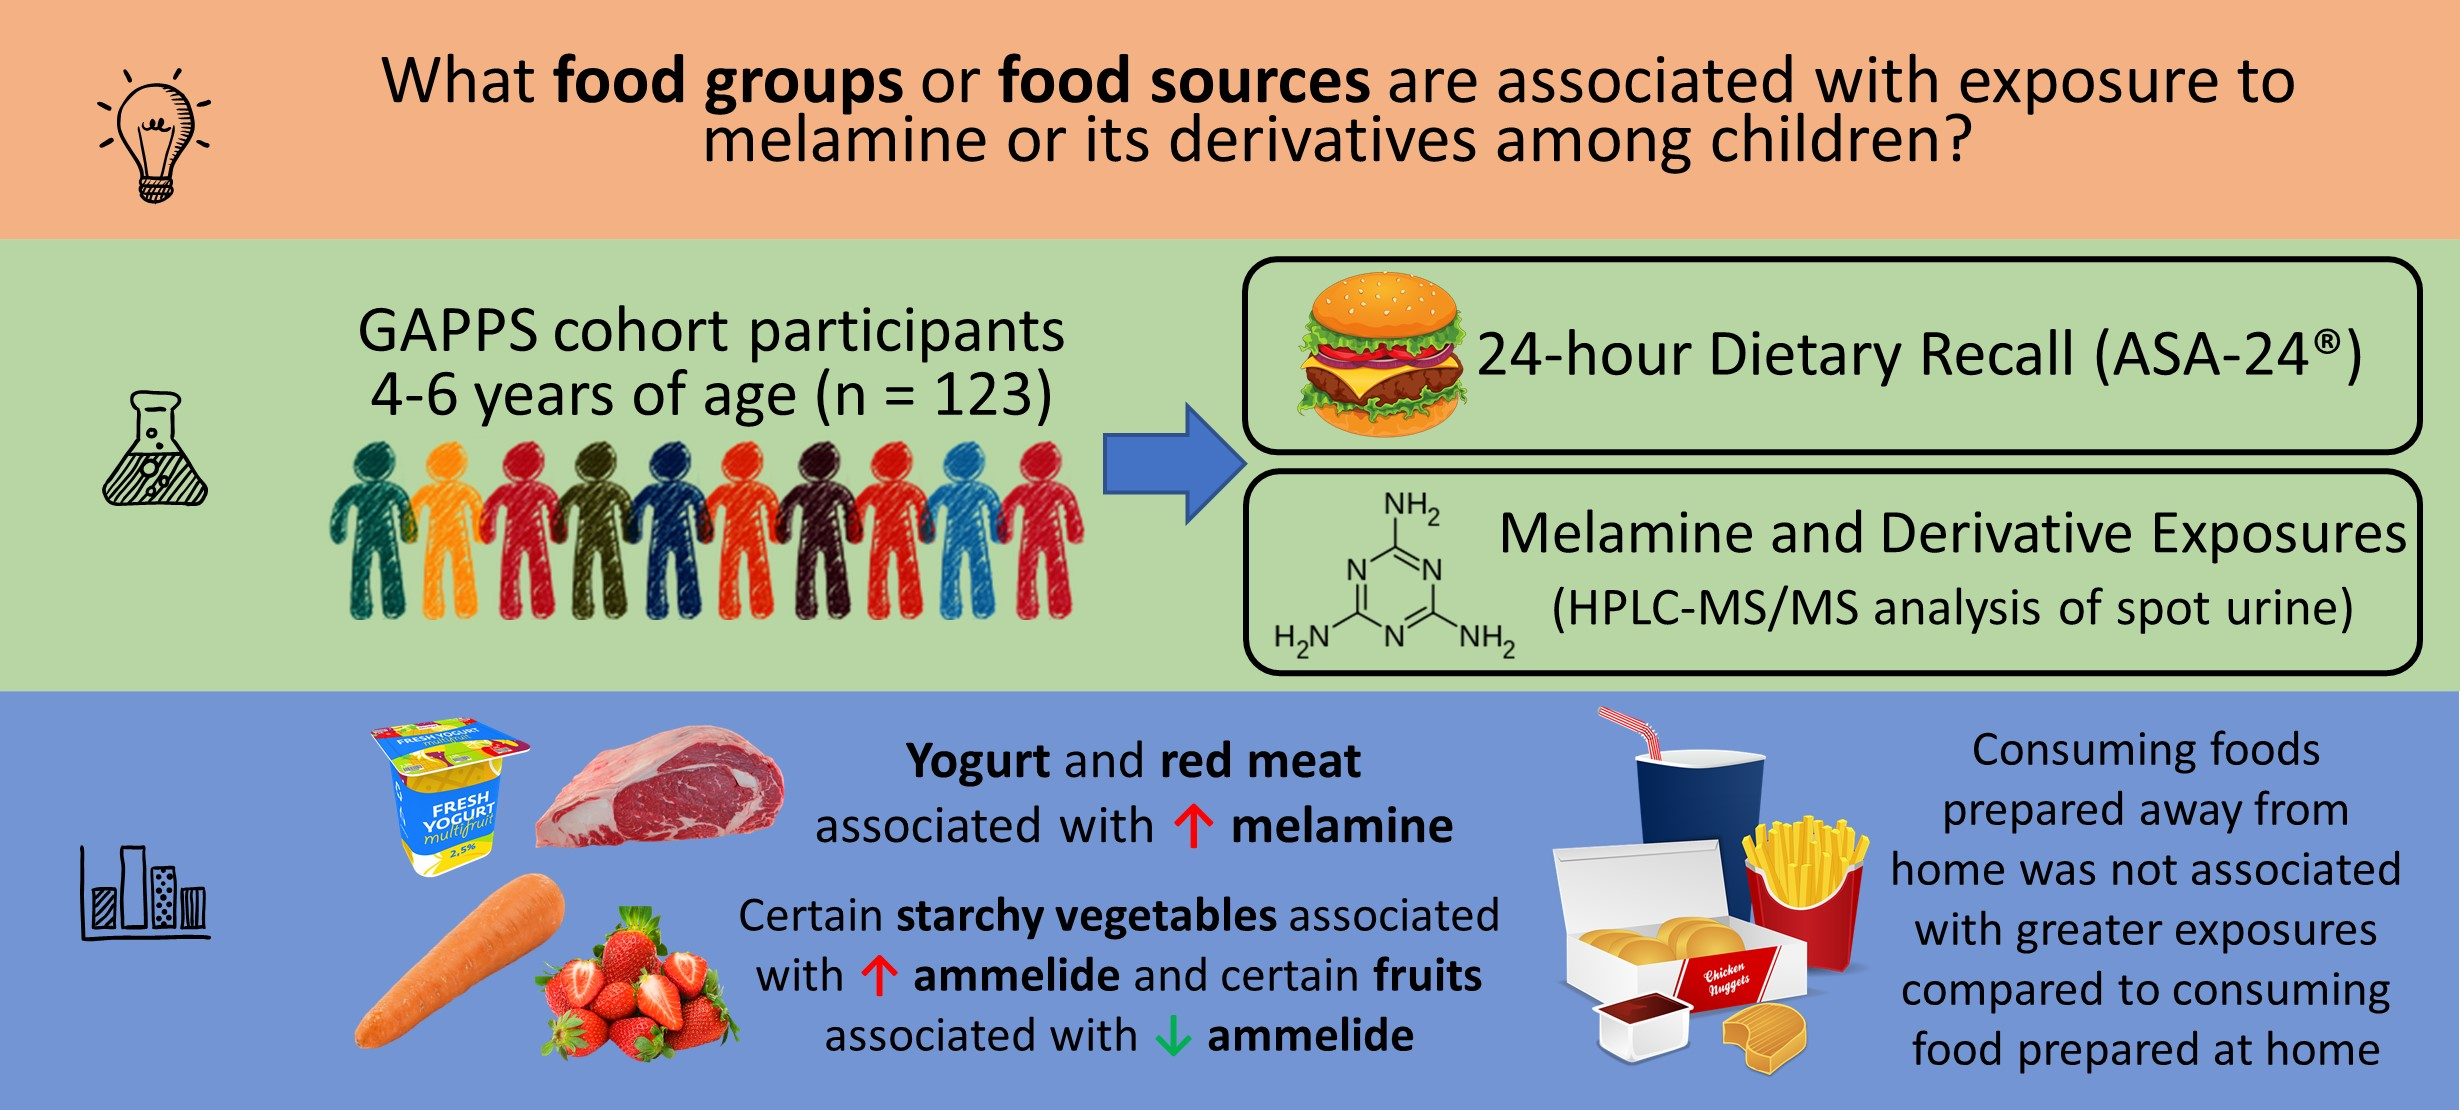
2.1. Participants
2.2. Dietary Assessment
2.3. Classification of Food Source
2.4. Melamine Analysis
2.5. Statistical Analysis
3. Results
4. Discussion
5. Conclusions
Author Contributions
Funding
Institutional Review Board Statement
Informed Consent Statement
Data Availability Statement
Conflicts of Interest
Appendix A

| Melamine | Ammelide | |||||
|---|---|---|---|---|---|---|
| Food Group | n | Intake Range | Minimal 1 | Full 2 | Minimal | Full |
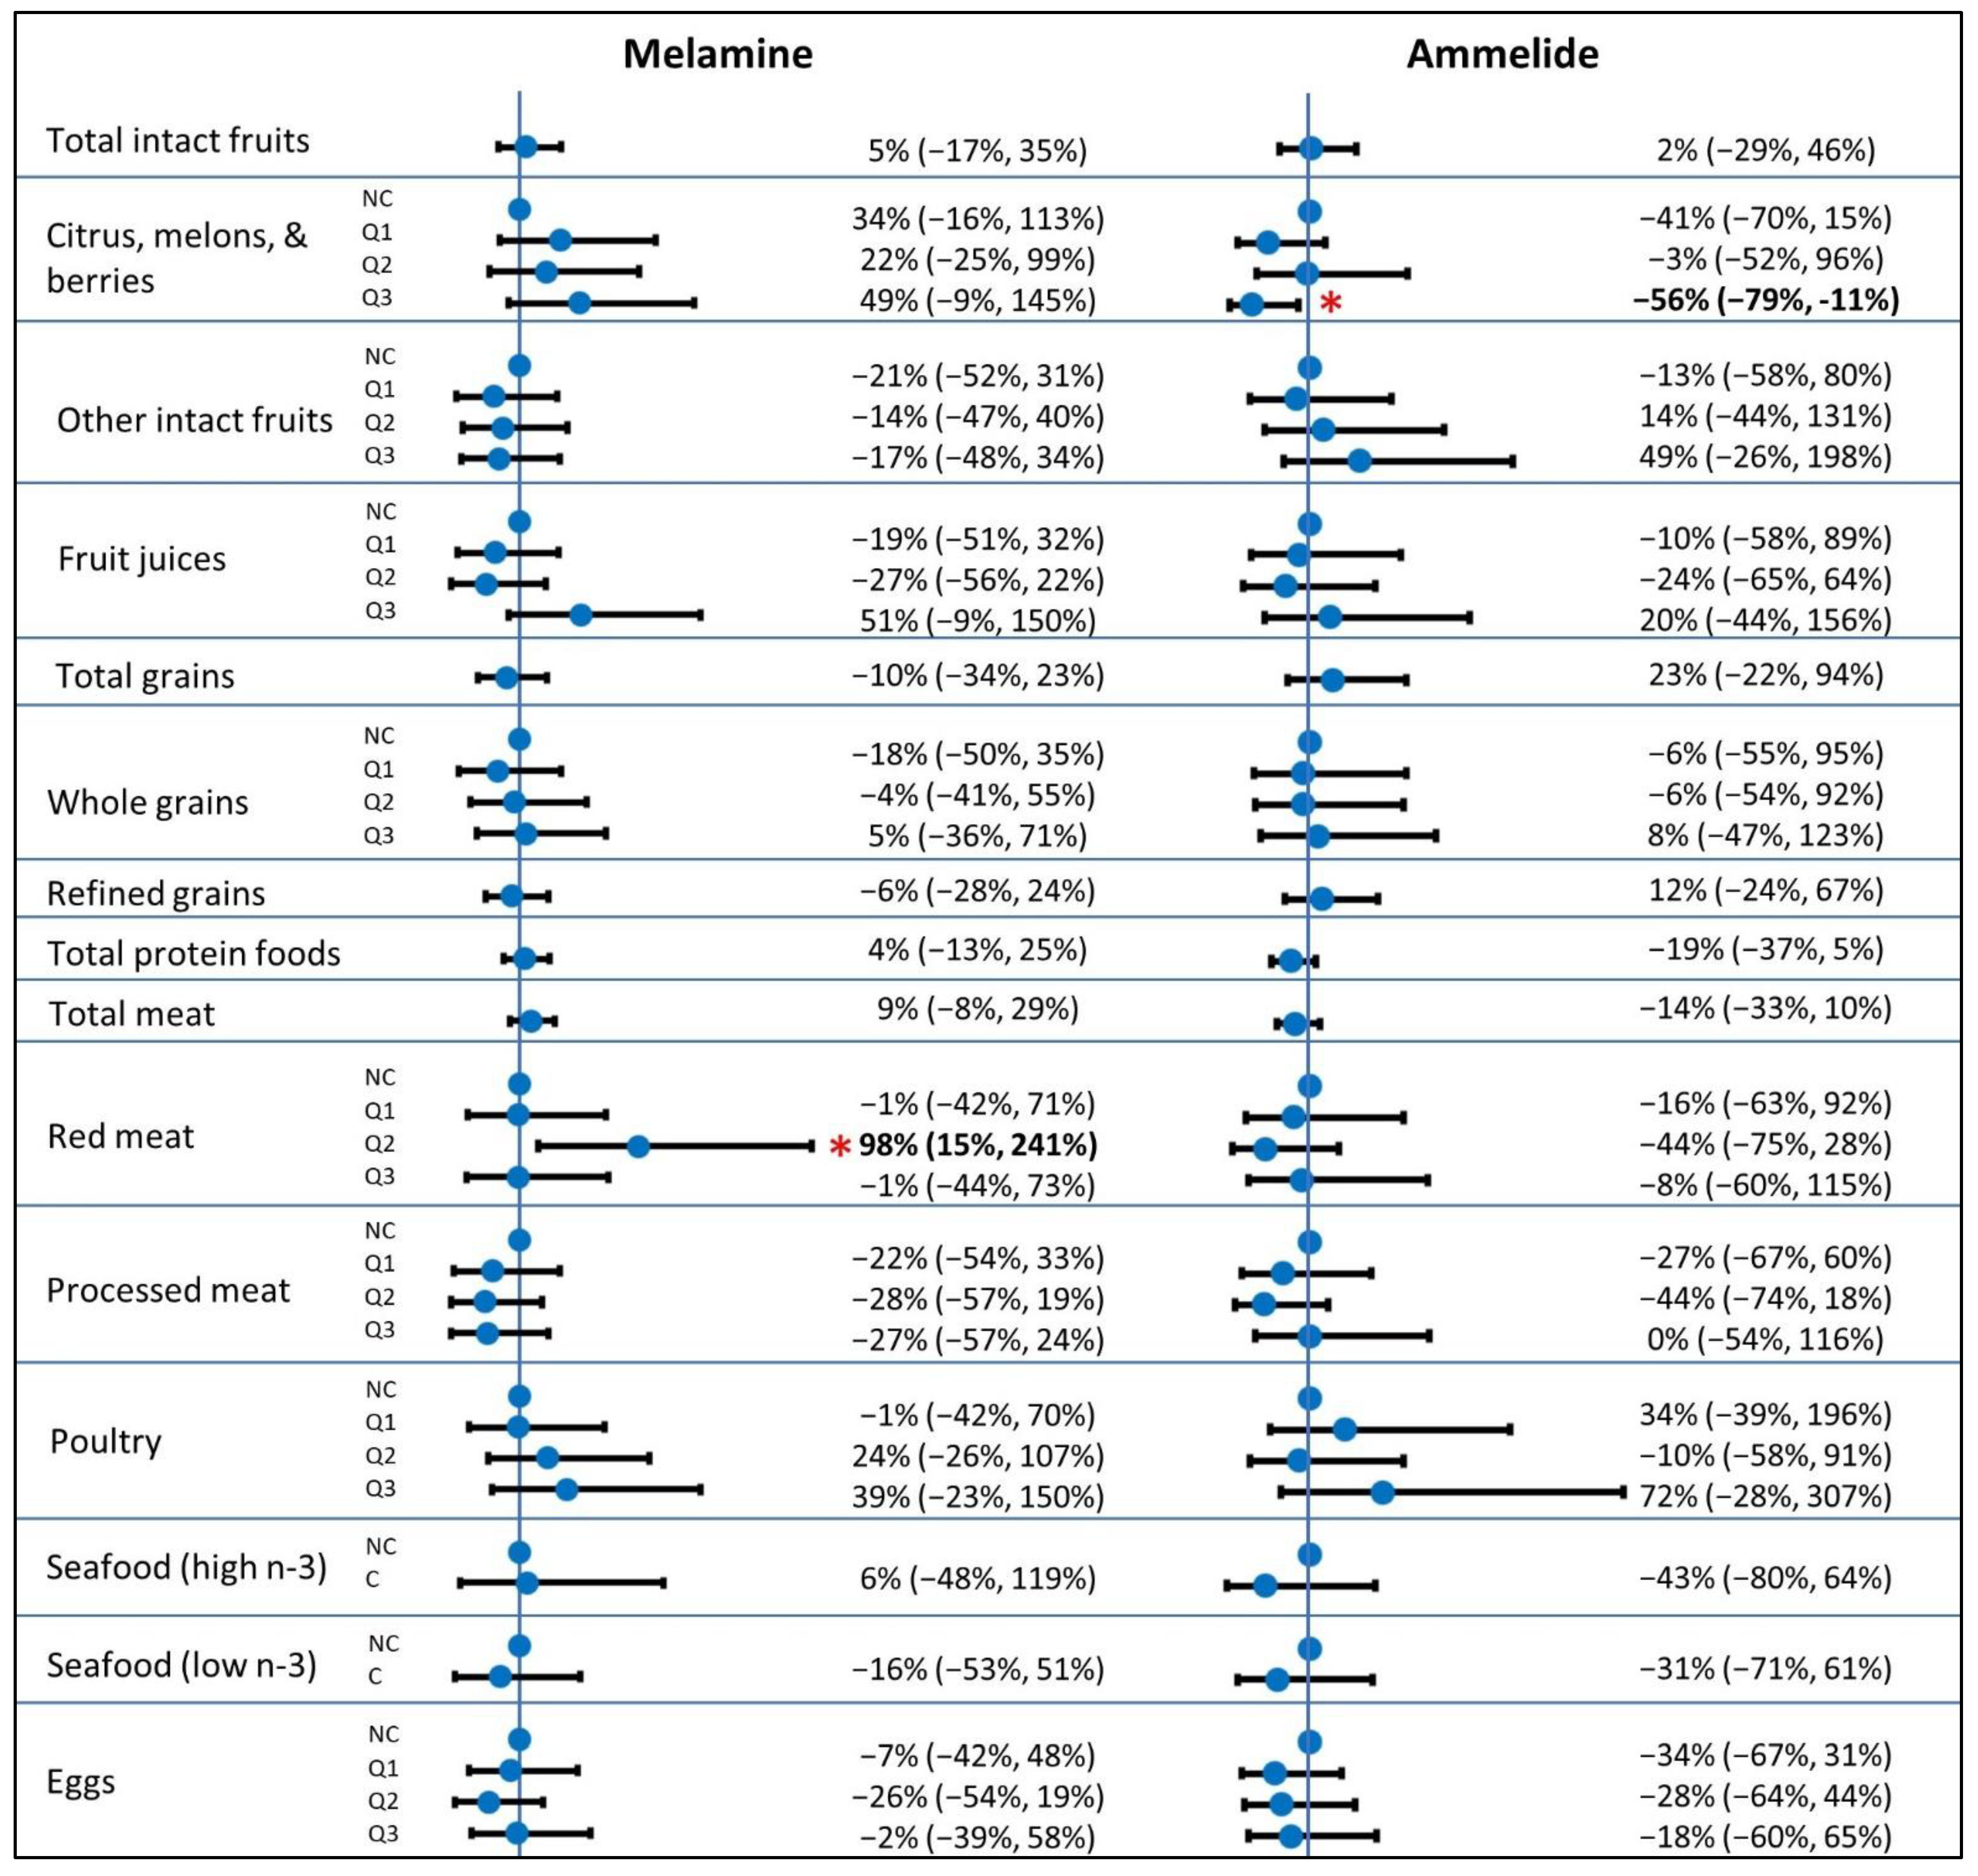
| Total intact fruits, cups | 0.00–6.82 | 5% (−17%, 33%) | 5% (−17%, 35%) | 5% (−25%, 46%) | 2% (−29%, 46%) | |
| Citrus, melons, and berries, cups | ||||||
| NC (ref) | 44 | -- | -- | -- | -- | |
| Q1 | 26 | 0.00–0.18 | 26% (−19%, 98%) | 34% (−16%, 113%) | −34% (−64%, 23%) | −41% (−70%, 15%) |
| Q2 | 27 | 0.21–0.79 | 24% (−20%, 94%) | 22% (−25%, 99%) | 8% (−41%, 101%) | −3% (−52%, 96%) |
| Q3 | 26 | 0.79–4.60 | 37% (−13%, 115%) | 49% (−9%, 145%) | −46% (−71%, 1%) | −56% (−79%, −11%) |
| Other intact fruits, cups | ||||||
| NC (ref) | 36 | -- | -- | -- | -- | |
| Q1 | 29 | 0.00–0.51 | −5% (−40%, 50%) | −21% (−52%, 31%) | −27% (−61%, 37%) | −13% (−58%, 80%) |
| Q2 | 29 | 0.52–1.28 | −12% (−44%, 39%) | −14% (−47%, 40%) | 4% (−45%, 96%) | 14% (−44%, 131%) |
| Q3 | 29 | 1.29–5.66 | −9% (−42%, 44%) | −17% (−48%, 34%) | 32% (−30%, 149%) | 49% (−26%, 198%) |
| Fruit juices, cups | ||||||
| NC (ref) | 62 | -- | -- | -- | -- | |
| Q1 | 20 | 0.00–0.10 | −9% (−42%, 45%) | −19% (−51%, 32%) | −17% (−57%, 62%) | −10% (−58%, 89%) |
| Q2 | 21 | 0.11–0.52 | −25% (−52%, 18%) | −27% (−56%, 22%) | −22% (−59%, 48%) | −24% (−65%, 64%) |
| Q3 | 20 | 0.52–2.48 | 50% (−5%, 139%) | 51% (−9%, 150%) | 4% (−46%, 103%) | 20% (−44%, 156%) |
| Total grains, oz | 0.49–11.29 | −9% (−32%, 23%) | −10% (−34%, 23%) | 14% (−25%, 74%) | 23% (−22%, 94%) | |
| Whole grains, oz | ||||||
| NC (ref) | 31 | -- | -- | -- | -- | |
| Q1 | 30 | 0.10–0.53 | −13% (−46%, 39%) | −18% (−50%, 35%) | −8% (−52%, 78%) | −6% (−55%, 95%) |
| Q2 | 31 | 0.56–1.45 | −4% (−40%, 54%) | −4% (−41%, 55%) | −11% (−54%, 72%) | −6% (−54%, 92%) |
| Q3 | 31 | 1.48–6.44 | 0% (−37%, 59%) | 5% (−36%, 71%) | −1% (−48%, 91%) | 8% (−47%, 123%) |
| Refined grains, oz | 0.45–8.65 | −7% (−28%, 21%) | −6% (−28%, 24%) | 8% (−25%, 55%) | 12% (−24%, 67%) | |
| Total protein foods, oz | 0.00–25.83 | 5% (−12%, 25%) | 4% (−13%, 25%) | −17% (−34%, 6%) | −19% (−37%, 5%) | |
| Total meat, oz | 0.00–16.60 | 10% (−6%, 29%) | 9% (−8%, 29%) | −12% (−29%, 11%) | −14% (−33%, 10%) | |
| Red meat, oz | ||||||
| NC (ref) | 80 | -- | -- | -- | -- | |
| Q1 | 14 | 0.06–0.90 | 0% (−40%, 68%) | −1% (−42%, 71%) | −16% (−60%, 75%) | −16% (−63%, 92%) |
| Q2 | 15 | 0.98–1.98 | 113% (30%, 250%) | 98% (15%, 241%) | −48% (−74%, 7%) | −44% (−75%, 28%) |
| Q3 | 14 | 1.98–8.50 | −4% (−43%, 61%) | −1% (−44%, 73%) | 5% (−50%, 122%) | −8% (−60%, 115%) |
| Processed meat, oz | ||||||
| NC (ref) | 74 | -- | -- | -- | -- | |
| Q1 | 16 | 0.05–0.61 | −26% (−55%, 21%) | −22% (−54%, 33%) | −30% (−65%, 41%) | −27% (−67%, 60%) |
| Q2 | 17 | 0.62–1.48 | −28% (−56%, 16%) | −28% (−57%, 19%) | −42% (−70%, 15%) | −44% (−74%, 18%) |
| Q3 | 16 | 1.55–5.08 | −36% (−61%, 5%) | −27% (−57%, 24%) | 23% (−39%, 147%) | 0% (−54%, 116%) |
| Poultry, oz | ||||||
| NC (ref) | 75 | -- | -- | -- | -- | |
| Q1 | 16 | 0.24–1.18 | −4% (−42%, 57%) | −1% (−42%, 70%) | 14% (−44%, 129%) | 34% (−39%, 196%) |
| Q2 | 16 | 1.18–2.36 | 26% (−23%, 108%) | 24% (−26%, 107%) | −8% (−55%, 85%) | −10% (−58%, 91%) |
| Q3 | 16 | 2.89–9.46 | 37% (−18%, 129%) | 39% (−23%, 150%) | 47% (−29%, 204%) | 72% (−28%, 307%) |
| Seafood (high n-3 fatty acids), oz | ||||||
| NC (ref) | 115 | -- | -- | -- | -- | |
| C | 8 | 0.27–3.78 | 36% (−30%, 162%) | 6% (−48%, 119%) | −38% (−75%, 57%) | −43% (−80%, 64%) |
| Seafood (low n-3 fatty acids), oz | ||||||
| NC (ref) | 111 | -- | -- | -- | -- | |
| C | 12 | 0.52–10.34 | −15% (−51%, 47%) | −16% (−53%, 51%) | −37% (−71%, 35%) | −31% (−71%, 61%) |
| Eggs and egg substitutes, oz | ||||||
| NC (ref) | 46 | -- | -- | -- | -- | |
| Q1 | 25 | 0.00–0.07 | −12% (−44%, 38%) | −7% (−42%, 48%) | −42% (−69%, 9%) | −34% (−67%, 31%) |
| Q2 | 26 | 0.07–0.56 | −27% (−53%, 14%) | −26% (−54%, 19%) | −29% (−62%, 33%) | −28% (−64%, 44%) |
| Q3 | 26 | 0.64–4.39 | 3% (−34%, 62%) | −2% (−39%, 58%) | −26% (−60%, 39%) | −18% (−60%, 65%) |
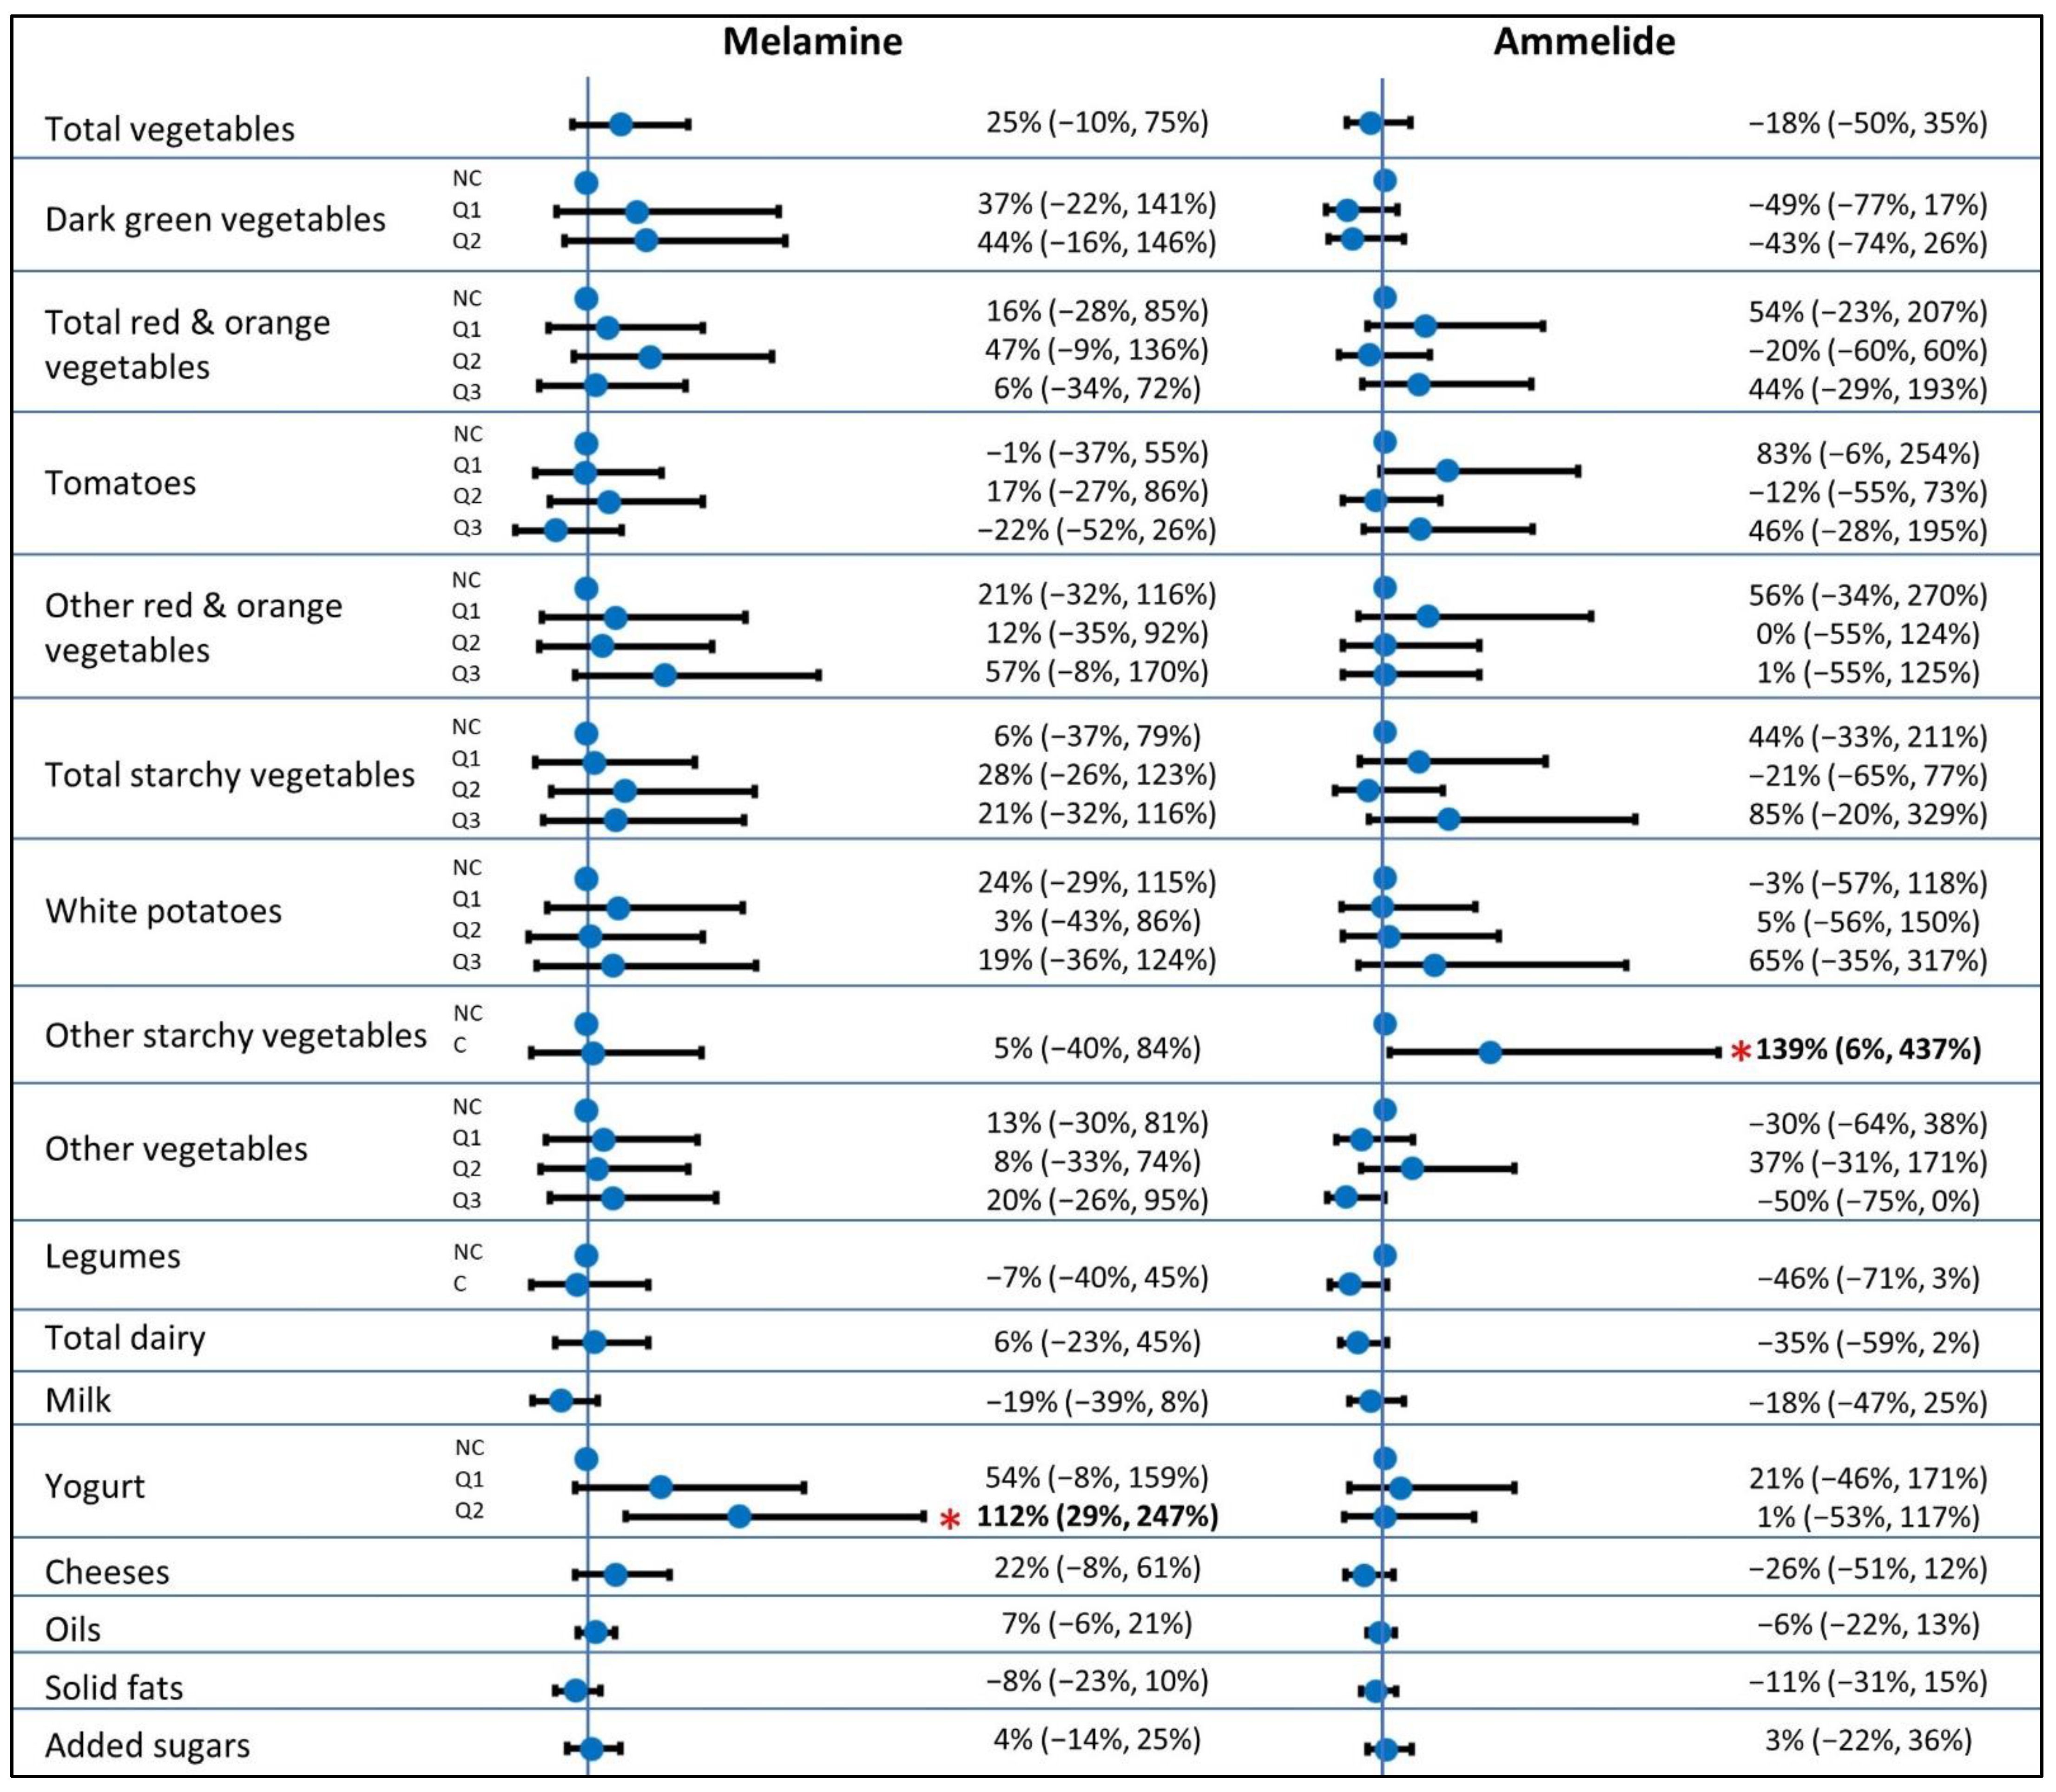
| Total vegetables, cups | 0.00–4.32 | 15% (−17%, 58%) | 25% (−10%, 75%) | −14% (−45%, 35%) | −18% (−50%, 35%) | |
| Dark green vegetables, cups | ||||||
| NC (ref) | 94 | -- | -- | -- | -- | |
| Q1 | 14 | 0.00–0.26 | 17% (−31%, 96%) | 37% (−22%, 141%) | −50% (−76%, 3%) | −49% (−77%, 17%) |
| Q2 | 15 | 0.27–1.30 | 40% (−16%, 132%) | 44% (−16%, 146%) | −35% (−68%, 32%) | −43% (−74%, 26%) |
| Total red/orange vegetables, cups | ||||||
| NC (ref) | 30 | -- | -- | -- | -- | |
| Q1 | 31 | 0.01–0.13 | 11% (−30%, 77%) | 16% (−28%, 85%) | 39% (−27%, 167%) | 54% (−23%, 207%) |
| Q2 | 31 | 0.13–0.30 | 20% (−25%, 91%) | 47% (−9%, 136%) | −16% (−56%, 61%) | −20% (−60%, 60%) |
| Q3 | 31 | 0.30–1.54 | −1% (−38%, 59%) | 6% (−34%, 72%) | 39% (−28%, 168%) | 44% (−29%, 193%) |
| Tomatoes, cups | ||||||
| NC (ref) | 45 | -- | -- | -- | -- | |
| Q1 | 27 | 0.01–0.12 | 1% (−36%, 57%) | −1% (−37%, 55%) | 77% (−5%, 230%) | 83% (−6%, 254%) |
| Q2 | 25 | 0.13–0.28 | −1% (−37%, 55%) | 17% (−27%, 86%) | 5% (−44%, 96%) | −12% (−55%, 73%) |
| Q3 | 26 | 0.29–1.20 | −26% (−53%, 18%) | −22% (−52%, 26%) | 55% (−19%, 195%) | 46% (−28%, 195%) |
| Other red/orange vegetables, cups | ||||||
| NC (ref) | 82 | -- | -- | -- | -- | |
| Q1 | 13 | 0.00–0.07 | 10% (−36%, 88%) | 21% (−32%, 116%) | 67% (−22%, 256%) | 56% (−34%, 270%) |
| Q2 | 14 | 0.09–0.17 | −5% (−43%, 60%) | 12% (−35%, 92%) | −3% (−53%, 102%) | 0% (−55%, 124%) |
| Q3 | 14 | 0.19–1.01 | 59% (−6%, 168%) | 57% (−8%, 170%) | −8% (−56%, 92%) | 1% (−55%, 125%) |
| Total starchy vegetables, cups | ||||||
| NC (ref) | 79 | -- | -- | -- | -- | |
| Q1 | 14 | 0.08–0.25 | 6% (−37%, 80%) | 6% (−37%, 79%) | 40% (−33%, 193%) | 44% (−33%, 211%) |
| Q2 | 16 | 0.26–0.55 | 15% (−30%, 88%) | 28% (−26%, 123%) | 5% (−48%, 109%) | −21% (−65%, 77%) |
| Q3 | 14 | 0.56–2.98 | 21% (−30%, 107%) | 21% (−32%, 116%) | 76% (−17%, 273%) | 85% (−20%, 329%) |
| White potatoes, cups | ||||||
| NC (ref) | 84 | -- | -- | -- | -- | |
| Q1 | 13 | 0.05–0.26 | 22% (−29%, 110%) | 24% (−29%, 115%) | −9% (−58%, 94%) | −3% (−57%, 118%) |
| Q2 | 14 | 0.28–0.55 | −1% (−42%, 66%) | 3% (−43%, 86%) | 31% (−37%, 172%) | 5% (−56%, 150%) |
| Q3 | 12 | 0.56–2.98 | 24% (−31%, 121%) | 19% (−36%, 124%) | 55% (−31%, 249%) | 65% (−35%, 317%) |
| Other starchy vegetables, cups | ||||||
| NC (ref) | 110 | -- | -- | -- | -- | |
| C | 13 | 0.02–0.58 | −2% (−42%, 66%) | 5% (−40%, 84%) | 111% (2%, 338%) | 139% (6%, 437%) |
| Other vegetables, cups | ||||||
| NC (ref) | 48 | -- | -- | -- | -- | |
| Q1 | 25 | 0.01–0.10 | 0% (−36%, 57%) | 13% (−30%, 81%) | −30% (−62%, 28%) | −30% (−64%, 38%) |
| Q2 | 25 | 0.11–0.36 | −1% (−37%, 55%) | 8% (−33%, 74%) | 23% (−34%, 129%) | 37% (−31%, 171%) |
| Q3 | 25 | 0.41–2.71 | 10% (−32%, 77%) | 20% (−26%, 95%) | −51% (−74%, −6%) | −50% (−75%, 0%) |
| Legumes, cups | ||||||
| NC (ref) | 100 | -- | -- | -- | -- | |
| Consumers | 23 | 0.02–0.67 | −6% (−39%, 42%) | −7% (−40%, 45%) | −44% (−68%, 1%) | −46% (−71%, 3%) |
| Total Dairy, cups | 0.00–6.14 | 2% (−24%, 37%) | 6% (−23%, 45%) | −37% (−58%, −6%) | −35% (−59%, 2%) | |
| Milk, cups | 0.00–4.15 | −21% (−41%, 4%) | −19% (−39%, 8%) | −21% (−47%, 18%) | −18% (−47%, 25%) | |
| Yogurt, cups | ||||||
| NC (ref) | 91 | -- | -- | -- | -- | |
| Q1 | 15 | 0.06–0.48 | 22% (−25%, 99%) | 54% (−8%, 159%) | 19% (−42%, 144%) | 21% (−46%, 171%) |
| Q2 | 17 | 0.54–1.51 | 103% (28%, 222%) | 112% (29%, 247%) | −9% (−53%, 78%) | 1% (−53%, 117%) |
| Cheeses, cups | 0.00–4.16 | 19% (−10%, 56%) | 22% (−8%, 61%) | −27% (−50%, 7%) | −26% (−51%, 12%) | |
| Oils, grams | 0.00–76.72 | 4% (−7%, 17%) | 7% (−6%, 21%) | −8% (−22%, 8%) | −6% (−22%, 13%) | |
| Solid fats, grams | 1.38–118.58 | −6% (−20%, 10%) | −8% (−23%, 10%) | −11% (−29%, 11%) | −11% (−31%, 15%) | |
| Added sugars, teaspoons | 0.13–31.47 | 0% (−16%, 20%) | 4% (−14%, 25%) | −1% (−23%, 27%) | 3% (−22%, 36%) | |
References
- Guan, X.; Deng, Y. Melamine-associated urinary stone. Int. J. Surg. 2016, 36, 613–617. [Google Scholar] [CrossRef] [PubMed]
- Hau, A.K.C.; Kwan, T.H.; Li, P.K.T. Melamine toxicity and the kidney. J. Am. Soc. Nephrol. 2009, 20, 245–250. [Google Scholar] [CrossRef] [PubMed] [Green Version]
- Panuwet, P.; Nguyen, J.V.; Wade, E.L.; D’Souza, P.E.; Ryan, P.B.; Barr, D.B. Quantification of melamine in human urine using cation-exchange based high performance liquid chromatography tandem mass spectrometry. J. Chromatogr. B Anal. Technol. Biomed. Life Sci. 2012, 887–888, 48–54. [Google Scholar] [CrossRef]
- Shi, X.L.; Dong, R.H.; Chen, J.S.; Yuan, Y.; Long, Q.; Guo, J.; Li, S.; Chen, B. An assessment of melamine exposure in Shanghai adults and its association with food consumption. Environ. Int. 2020, 135, 105363. [Google Scholar] [CrossRef]
- Liu, C.C.; Wu, C.F.; Chen, B.H.; Huang, S.P.; Goggins, W.; Lee, H.H.; Chou, Y.H.; Wu, W.J.; Huang, C.H.; Shiea, J.; et al. Low exposure to melamine increases the risk of urolithiasis in adults. Kidney Int. 2011, 80, 746–752. [Google Scholar] [CrossRef] [PubMed] [Green Version]
- Sathyanarayana, S.; Flynn, J.T.; Messito, M.J.; Gross, R.; Whitlock, K.B.; Kannan, K.; Karthikraj, R.; Morrison, D.; Huie, M.; Christakis, D.; et al. Melamine and cyanuric acid exposure and kidney injury in US children. Environ. Res. 2019, 171, 18–23. [Google Scholar] [CrossRef] [PubMed]
- Zhu, H.; Kannan, K. Melamine and cyanuric acid in foodstuffs from the United States and their implications for human exposure. Environ. Int. 2019, 130, 104950. [Google Scholar] [CrossRef]
- Lund, K.H.; Petersen, J.H. Migration of formaldehyde and melamine monomers from kitchen- and tableware made of melamine plastic. Food Addit. Contam. 2006, 23, 948–955. [Google Scholar] [CrossRef] [Green Version]
- Chien, C.Y.; Wu, C.F.; Liu, C.C.; Chen, B.H.; Huang, S.P.; Chou, Y.H.; Chang, A.W.; Lee, H.H.; Pan, C.H.; Wu, W.J.; et al. High melamine migration in daily-use melamine-made tableware. J. Hazard. Mater. 2011, 188, 350–356. [Google Scholar] [CrossRef]
- Qin, Y.; Lv, X.; Li, J.; Qi, G.; Diao, Q.; Liu, G.; Xue, M.; Wang, J.; Tong, J.; Zhang, L.; et al. Assessment of melamine contamination in crop, soil and water in China and risks of melamine accumulation in animal tissues and products. Environ. Int. 2010, 36, 446–452. [Google Scholar] [CrossRef]
- Ji, X.; Hang, H.; Lya, W.; Wang, J.; Wang, X.; Wang, X.; Qian, M. Evaluation of cyromazine transferred from feed to chicken products and subsequent assessment of dietary risks to Chinese consumers. J. Food Sci. 2020, 85, 4396–4406. [Google Scholar] [CrossRef] [PubMed]
- EFSA. Scientific Opinion on Melamine in Food and Feed. EFSA J. 2010, 8, 1–145. [Google Scholar] [CrossRef]
- Araújo, R.; Moreira, J.L.; Ratola, N.; Santos, L.; Alves, A. Melamine and Cyanuric Acid in Foodstuffs and Pet Food: Method Validation and Sample Screening. Anal. Lett. 2012, 45, 613–624. [Google Scholar] [CrossRef]
- Melough, M.M.; Foster, D.; Fretts, A.M.; Sathyanarayana, S. Dietary Sources of Melamine Exposure among US Children and Adults in the National Health and Nutrition Examination Survey 2003–2004. Nutrients 2020, 12, 3844. [Google Scholar] [CrossRef]
- Zou, C.C.; Chen, X.Y.; Zhao, Z.Y.; Zhang, W.F.; Shu, Q.; Wang, J.H.; Zhang, L.; Huang, S.J.; Yang, L.L. Outcome of children with melamine-induced urolithiasis: Results of a two-year follow-up. Clin. Toxicol. 2013, 51, 473–479. [Google Scholar] [CrossRef]
- Bolden, A.L.; Rochester, J.R.; Kwiatkowski, C.F. Melamine, beyond the kidney: A ubiquitous endocrine disruptor and neurotoxicant? Toxicol. Lett. 2017, 280, 181–189. [Google Scholar] [CrossRef]
- Blanton, C.A.; Moshfegh, A.J.; Baer, D.J.; Kretsch, M.J. The USDA Automated Multiple-Pass Method accurately estimates group total energy and nutrient intake. J. Nutr. 2006, 136, 2594–2599. [Google Scholar] [CrossRef]
- Saksena, M.J.; Okren, A.M.; Hamrick, K.S.; Anekwe, T.D.; Cho, C.; Dicken, C.; Effland, A.; Elitzak, H.; Guthrie, J.; Hamrick, K.; et al. America’s Eating Habits: Food Away From Home; U.S. Department of Agriculture: Washington, DC, USA, 2018; pp. 1–163.
- Zhu, H.; Kannan, K. Inter-day and inter-individual variability in urinary concentrations of melamine and cyanuric acid. Environ. Int. 2019, 123, 375–381. [Google Scholar] [CrossRef]
- Levine, L. Evaluation of urinary lead determinations. I. The significance of the specific gravity. J. Ind. Hyg. Toxicol. 1945, 27, 217–223. [Google Scholar]
- Hornung, R.W.; Reed, L.D. Estimation of Average Concentration in the Presence of Nondetectable Values. Appl. Occup. Environ. Hyg. 1990, 5, 46–51. [Google Scholar] [CrossRef]
- Wooldridge, J.M. Multiple Regression Analysis: Further Issues. In Introductory Econometrics: A Modern Approach; South-Western Cengage Learning: Mason, OH, USA, 2012; pp. 186–226. ISBN 9781111531041. [Google Scholar]
- Negri, E.; Franceschi, S.; La Vecchia, C.; Filiberti, R.; Guarneri, S.; Nanni, O.; Decarli, A. The application of different correlation coefficients to assess the reproducibility of a food frequency questionnaire. Eur. J. Cancer Prev. 1994, 3, 489–497. [Google Scholar] [CrossRef] [PubMed]
- Lam, C.-W.; Lan, L.; Che, X.; Tam, S.; Wong, S.S.-Y.; Chen, Y.; Jin, J.; Tao, S.-H.; Tang, X.-M.; Yuen, K.-Y.; et al. Diagnosis and spectrum of melamine-related renal disease: Plausible mechanism of stone formation in humans. Clin. Chim. Acta 2009, 402, 150–155. [Google Scholar] [CrossRef] [PubMed]
- US Food and Drug Administation Code of Federal Regulations. Available online: https://www.ecfr.gov/current/title-21/chapter-I/subchapter-E/part-573 (accessed on 1 January 2022).
- Zhu, H.; Loganathan, B.G.; Kannan, K. Occurrence and Profiles of Melamine and Cyanuric Acid in Bovine Feed and Urine from China, India, and the United States. Environ. Sci. Technol. 2019, 53, 7029–7035. [Google Scholar] [CrossRef] [PubMed]
- Tkachenko, A.; Clark, J.; Knutson, N.; Wallace, B.; Bomba, M.; Yacopucci, M.; Rhodes, B.; Nemser, S.M.; Guag, J.; Reimschuessel, R. Investigation of melamine and cyanuric acid deposition in pig tissues using LC-MS/MS methods. Food Chem. Toxicol. 2015, 80, 310–318. [Google Scholar] [CrossRef] [PubMed]
- Cruywagen, C.W.; van de Vyver, W.F.J.; Stander, M.A. Quantification of melamine absorption, distribution to tissues, and excretion by sheep. J. Anim. Sci. 2011, 89, 2164–2169. [Google Scholar] [CrossRef]
- Zapletal, D.; Straková, E.; Novák, P.; Suchý, P. Broiler chickens exposed to melamine and cyanuric acid-contaminated diets. Hum. Exp. Toxicol. 2016, 35, 760–766. [Google Scholar] [CrossRef]
- Valat, C.; Marchand, P.; Veyrand, B.; Amelot, M.; Burel, C.; Eterradossi, N.; Postollec, G. Transfer of melamine in some poultry products. Poult. Sci. 2011, 90, 1358–1363. [Google Scholar] [CrossRef]
- Sun, P.; Wang, J.Q.; Shen, J.S.; Wei, H.Y. Residues of melamine and cyanuric acid in milk and tissues of dairy cows fed different doses of melamine. J. Dairy Sci. 2011, 94, 3575–3582. [Google Scholar] [CrossRef]
- Yang, T.; Huangfu, W.G.; Wu, Y.L. Melamine residues in eggs of laying hens exposed to melamine-contaminated feed. Poult. Sci. 2011, 90, 701–704. [Google Scholar] [CrossRef]
- US Environmental Protection Agency Cyromazine Summary Document. Available online: https://www.regulations.gov/document/EPA-HQ-OPP-2006-0108-0003 (accessed on 1 January 2022).
- Bradley, E.L.; Castle, L.; Day, J.S.; Leak, J. Migration of melamine from can coatings cross-linked with melamine-based resins, into food simulants and foods. Food Addit. Contam.-Part A Chem. Anal. Control. Expo. Risk Assess. 2011, 28, 243–250. [Google Scholar] [CrossRef] [Green Version]
- Takazawa, M.; Suzuki, S.; Kannan, K. Leaching of melamine and cyanuric acid from melamine-based tableware at different temperatures and water-based simulants. Environ. Chem. Ecotoxicol. 2020, 2, 91–96. [Google Scholar] [CrossRef]
- Lynch, R.A.; Hollen, H.; Johnson, D.L.; Bartels, J. The effects of pH on the migration of melamine from children’s bowls. Int. J. Food Contam. 2015, 2, 9. [Google Scholar] [CrossRef] [Green Version]
- Wu, M.T.; Wu, C.F.; Chen, B.H. Behavioral Intervention and Decreased Daily Melamine Exposure from Melamine Tableware. Environ. Sci. Technol. 2015, 49, 9964–9970. [Google Scholar] [CrossRef] [PubMed]
- Lin, Y.T.; Tsai, M.T.; Chen, Y.L.; Cheng, C.M.; Hung, C.C.; Wu, C.F.; Liu, C.C.; Hsieh, T.J.; Shiea, J.; Chen, B.H.; et al. Can melamine levels in 1-spot overnight urine specimens predict the total previous 24-hour melamine excretion level in school children? Clin. Chim. Acta 2013, 420, 128–133. [Google Scholar] [CrossRef]
- Zhu, H.; Kannan, K. Distribution Profiles of Melamine and Its Derivatives in Indoor Dust from 12 Countries and the Implications for Human Exposure. Environ. Sci. Technol. 2018, 52, 12801–12808. [Google Scholar] [CrossRef]
- Zheng, G.; Boor, B.E.; Schreder, E.; Salamova, A. Exposure to melamine and its derivatives in childcare facilities. Chemosphere 2020, 244, 125505. [Google Scholar] [CrossRef]
- Ricciotti, L.; Roviello, G.; Tarallo, O.; Borbone, F.; Ferone, C.; Colangelo, F.; Catauro, M.; Cioffi, R. Synthesis and characterizations of melamine-based epoxy resins. Int. J. Mol. Sci. 2013, 14, 18200–18214. [Google Scholar] [CrossRef] [Green Version]
- Zhu, H.; Kannan, K. Determination of melamine and its derivatives in textiles and infant clothing purchased in the United States. Sci. Total Environ. 2020, 710, 136396. [Google Scholar] [CrossRef]
- Guo, J.; Wu, C.; Zhang, J.; Chang, X.; Zhang, Y.; Cao, Y.; Zhou, Z. Associations of melamine and cyanuric acid exposure with markers of kidney function in adults: Results from NHANES 2003–2004. Environ. Int. 2020, 141, 105815. [Google Scholar] [CrossRef]

| Melamine (ng/mL) | Ammelide (ng/mL) | Cyanuric Acid (ng/mL) | |
|---|---|---|---|
| Number (%) > LOD 1 | 123 (100%) | 122 (99.2%) | 108 (87.8%) |
| Mean (SD) | 6.1 (12.4) | 1.9 (2.1) | 60.6 (221.2) |
| Minimum | 0.41 | 0.02 | 0.02 |
| Maximum | 104.3 | 25.8 | 2110.0 |
| Melamine | Ammelide | Cyanuric Acid | |||||
|---|---|---|---|---|---|---|---|
| n | Mean (SD) | p 1 | Mean (SD) | p | Mean (SD) | p | |
| Total | 123 | 6.1 (12.4) | 1.9 (2.1) | 60.6 (221.2) | |||
| Sex | 0.04 | 0.71 | 0.54 | ||||
| Female | 64 | 4.8 (6.7) | 1.6 (1.1) | 34.9 (55.0) | |||
| Male | 59 | 7.5 (16.5) | 2.2 (2.9) | 88.4 (313.2) | |||
| Site | 0.12 | 0.35 | 0.13 | ||||
| Seattle | 45 | 7.9 (17.9) | 1.6 (1.1) | 95.9 (358.4) | |||
| Yakima | 78 | 5.1 (7.7) | 2.1 (2.5) | 40.2 (54.4) | |||
| Maternal Education | 0.34 | 0.83 | 0.15 | ||||
| <College graduate | 51 | 4.6 (7.1) | 2.0 (2.9) | 41.0 (65.6) | |||
| College graduate | 42 | 7.7 (18.6) | 1.8 (1.3) | 54.7 (188.7) | |||
| Advanced degree | 30 | 6.4 (8.4) | 1.7 (1.4) | 102.2 (381.5) | |||
| Annual Income 2 | 0.68 | 0.76 | 0.64 | ||||
| <$45,000 | 23 | 5.5 (9.4) | 1.7 (1.4) | 45.3 (79.3) | |||
| $45,000 to 75,000 | 22 | 9.0 (25.3) | 1.7 (1.1) | 16.2 (12.9) | |||
| $75,000 to 100,000 | 23 | 7.0 (6.6) | 1.7 (1.5) | 32.3 (30.0) | |||
| $100,000 to 150,000 | 28 | 5.1 (7.8) | 2.4 (3.7) | 43.2 (64.1) | |||
| >$150,000 | 26 | 4.7 (4.8) | 1.8 (1.4) | 157.4 (463.7) | |||
| Child Race and Ethnicity | 0.69 | 0.56 | 0.70 | ||||
| Non-Hispanic White | 69 | 4.7 (6.3) | 2.1 (2.7) | 72.8 (256.3) | |||
| Hispanic White | 21 | 11.0 (26.8) | 1.8 (1.3) | 24.0 (21.5) | |||
| Multiple races | 17 | 5.6 (5.5) | 1.4 (1.2) | 101.2 (294.5) | |||
| Other | 16 | 6.2 (7.0) | 1.5 (0.8) | 12.7 (13.1) | |||
| BMI Status 2 | 0.57 | 0.56 | 0.42 | ||||
| Underweight | 1 | 2.3 | 3.4 | 22.0 | |||
| Healthy Weight | 77 | 7.3 (15.2) | 2.1 (2.6) | 70.0 (243.8) | |||
| Overweight | 21 | 4.4 (4.5) | 1.4 (0.9) | 75.0 (263.4) | |||
| Obese | 23 | 4.2 (5.3) | 1.6 (1.3) | 20.2 (23.7) | |||
| Pesticide use in home 3 | 0.05 | 0.45 | 0.75 | ||||
| No | 108 | 5.8 (13.0) | 1.9 (2.3) | 54.6 (207.1) | |||
| Yes | 15 | 8.1 (7.5) | 1.9 (0.9) | 103.8 (310.3) | |||
| Food Source Category 4 | 0.84 | 0.13 | 0.67 | ||||
| FAH | 62 | 5.1 (1.7) | 1.7 (1.5) | 49.3 (158.9) | |||
| FAFH | 61 | 7.1 (16.8) | 2.1 (2.7) | 72.0 (271.2) | |||
| Minimal 1 | Full 2 | |
|---|---|---|
| Melamine | 0.04 (−0.29, 0.36) | 0.15 (−0.20, 0.49) |
| Ammelide | 0.36 (−0.10, 0.81) | 0.27 (−0.25, 0.78) |
Publisher’s Note: MDPI stays neutral with regard to jurisdictional claims in published maps and institutional affiliations. |
© 2022 by the authors. Licensee MDPI, Basel, Switzerland. This article is an open access article distributed under the terms and conditions of the Creative Commons Attribution (CC BY) license (https://creativecommons.org/licenses/by/4.0/).
Share and Cite
Melough, M.M.; Day, D.B.; Fretts, A.M.; Wang, S.; Flynn, J.T.; de Boer, I.H.; Zhu, H.; Kannan, K.; Sathyanarayana, S. Associations of Dietary Intake with Urinary Melamine and Derivative Concentrations among Children in the GAPPS Cohort. Int. J. Environ. Res. Public Health 2022, 19, 4964. https://doi.org/10.3390/ijerph19094964
Melough MM, Day DB, Fretts AM, Wang S, Flynn JT, de Boer IH, Zhu H, Kannan K, Sathyanarayana S. Associations of Dietary Intake with Urinary Melamine and Derivative Concentrations among Children in the GAPPS Cohort. International Journal of Environmental Research and Public Health. 2022; 19(9):4964. https://doi.org/10.3390/ijerph19094964
Chicago/Turabian StyleMelough, Melissa M., Drew B. Day, Amanda M. Fretts, Sarah Wang, Joseph T. Flynn, Ian H. de Boer, Hongkai Zhu, Kurunthachalam Kannan, and Sheela Sathyanarayana. 2022. "Associations of Dietary Intake with Urinary Melamine and Derivative Concentrations among Children in the GAPPS Cohort" International Journal of Environmental Research and Public Health 19, no. 9: 4964. https://doi.org/10.3390/ijerph19094964
APA StyleMelough, M. M., Day, D. B., Fretts, A. M., Wang, S., Flynn, J. T., de Boer, I. H., Zhu, H., Kannan, K., & Sathyanarayana, S. (2022). Associations of Dietary Intake with Urinary Melamine and Derivative Concentrations among Children in the GAPPS Cohort. International Journal of Environmental Research and Public Health, 19(9), 4964. https://doi.org/10.3390/ijerph19094964