
Associations between Coping Profile and Work Performance in a Cohort of Japanese Employees


Abstract
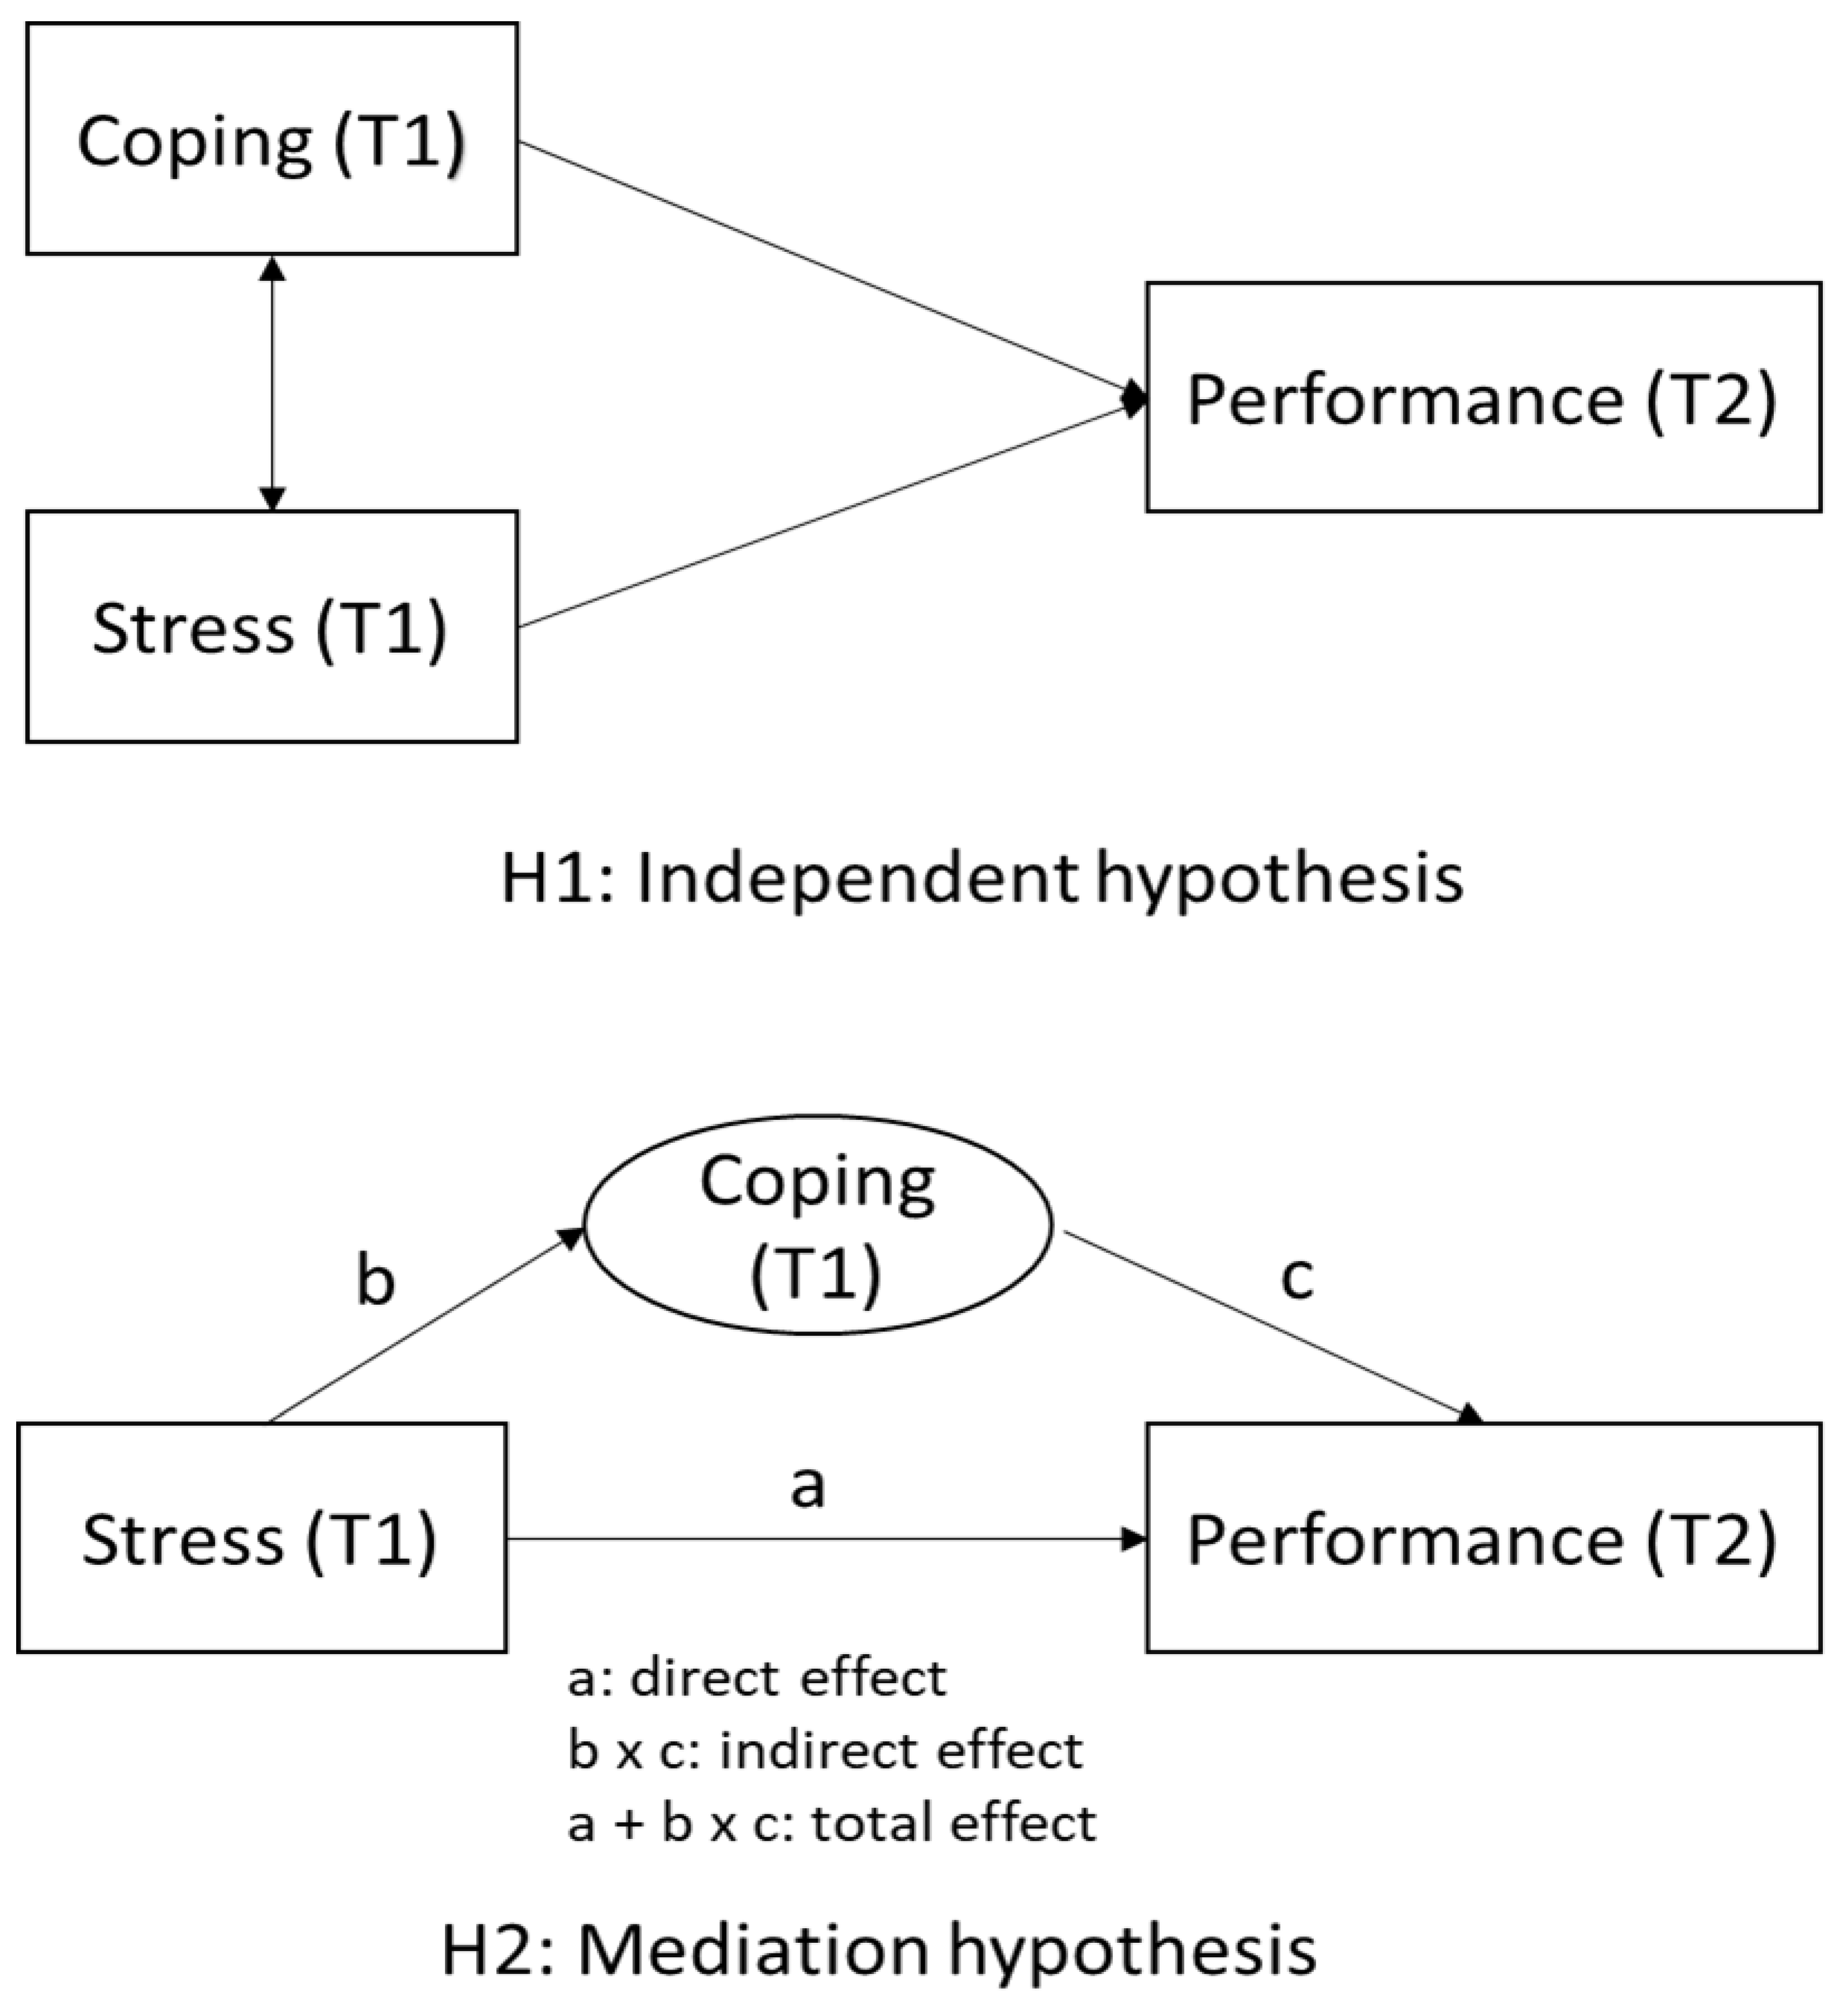
:1. Introduction
2. Materials and Methods
2.1. Design and Participants
2.2. Measures
2.2.1. Presenteeism (Work Performance)
2.2.2. Coping Profile: The Brief-COPE
2.2.3. Perception of Stress
2.3. Covariates
2.4. Data Analysis
3. Results
3.1. Participants
3.2. Descriptive Statistics
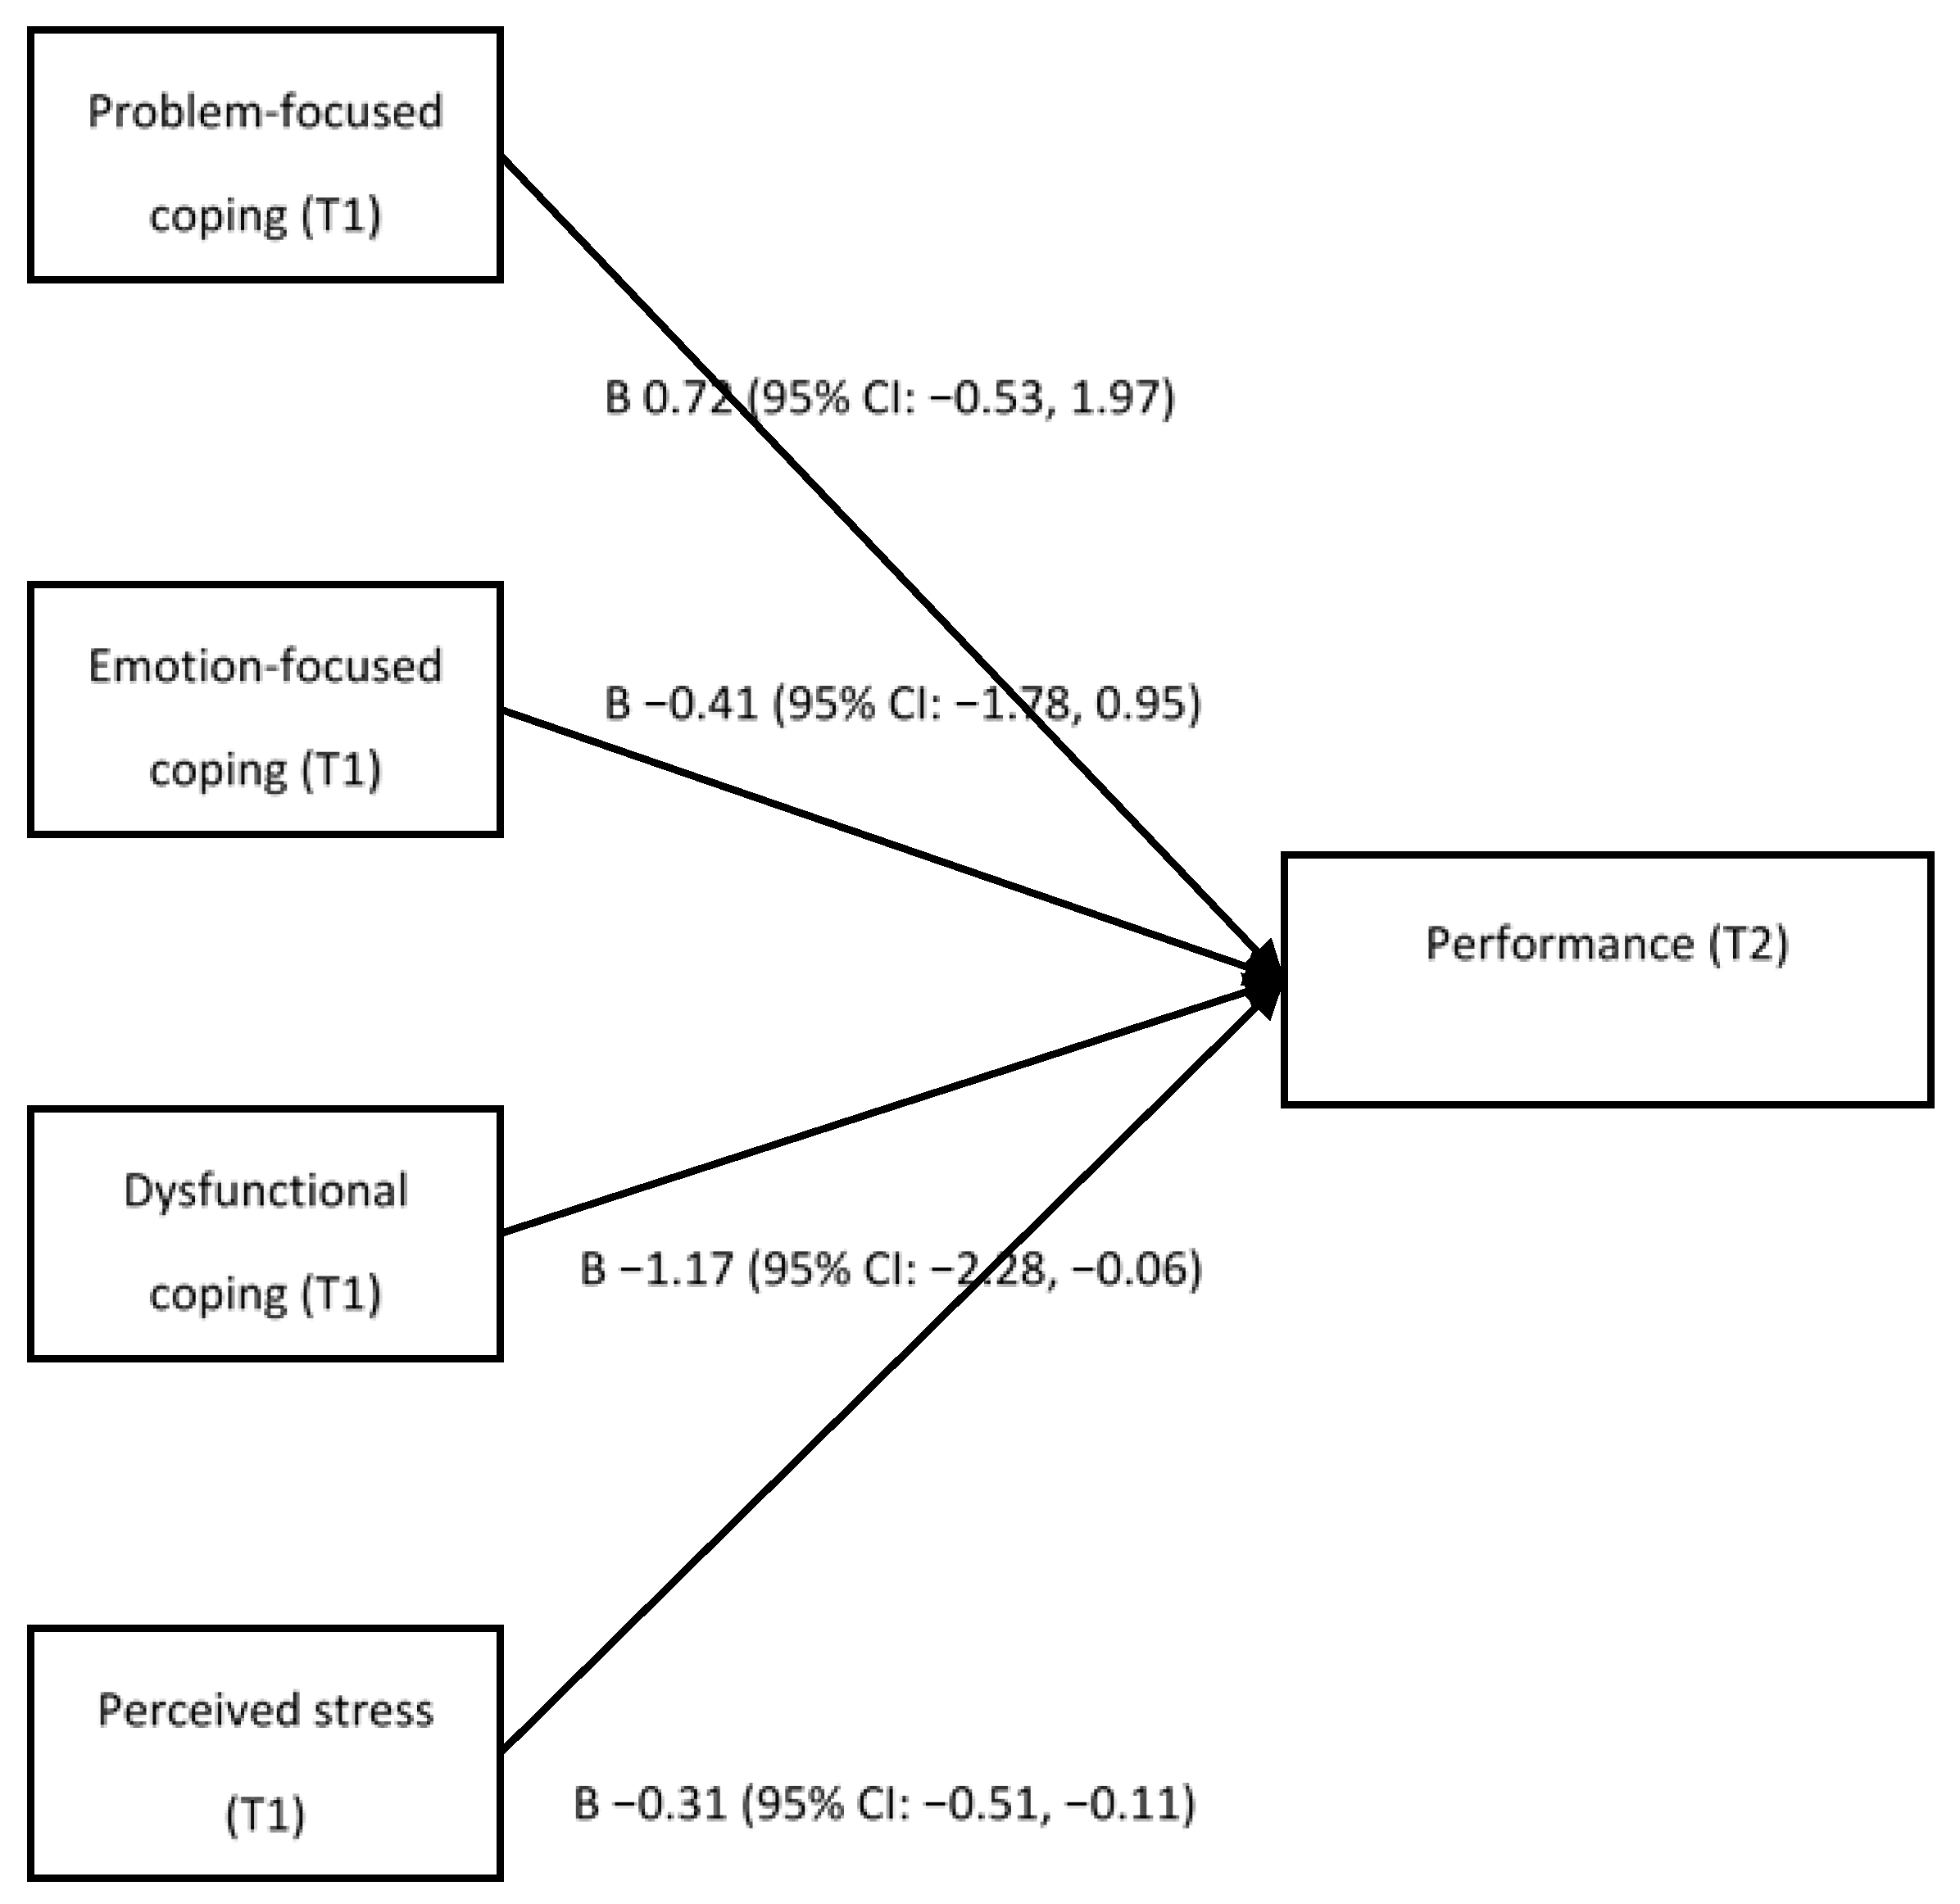
3.3. Association between Coping Profiles and Presenteeism
3.4. Mediating Effects of Coping Profiles
4. Discussion
5. Conclusions
Supplementary Materials
Author Contributions
Funding
Institutional Review Board Statement
Informed Consent Statement
Data Availability Statement
Acknowledgments
Conflicts of Interest
References
- Sparks, K.; Faragher, B.; Cooper, C.L. Well-being and occupational health in the 21st century workplace. J. Occup. Organ. Psychol. 2001, 74, 489–509. [Google Scholar] [CrossRef]
- Collins, J.J.; Baase, C.M.; Sharda, C.E.; Ozminkowski, R.J.; Nicholson, S.; Billotti, G.M.; Turpin, R.S.; Olson, M.; Berger, M.L. The assessment of chronic health conditions on work performance, absence, and total economic impact for employers. J. Occup. Environ. Med. 2005, 47, 547–557. [Google Scholar] [CrossRef] [PubMed]
- Schultz, A.B.; Edington, D.W. Employee health and presenteeism: A systematic review. J. Occup. Rehabil. 2007, 17, 547–579. [Google Scholar] [CrossRef] [PubMed]
- Burton, W.N.; Pransky, G.; Conti, D.J.; Chen, C.Y.; Edington, D.W. The association of medical conditions and presenteeism. J. Occup. Environ. Med. 2004, 46, S38–S45. [Google Scholar] [CrossRef]
- Unmuessig, V.; Fishman, P.A.; Vrijhoef, H.J.; Elissen, A.M.; Grossman, D.C. Association of controlled and uncontrolled hypertension with workplace productivity. J. Clin. Hypertens. 2016, 18, 217–222. [Google Scholar] [CrossRef] [Green Version]
- Karlsson, M.L.; Bjorklund, C.; Jensen, I. The effects of psychosocial work factors on production loss, and the mediating effect of employee health. J. Occup. Environ. Med. 2010, 52, 310–317. [Google Scholar] [CrossRef] [Green Version]
- Johns, G. Presenteeism in the workplace: A review and research agenda. J. Organ. Behav. 2010, 31, 519–542. [Google Scholar] [CrossRef]
- Hwang, J.H.; Jung, H.S. The effects of work characteristics related to work-life imbalance on presenteeism among female workers in the health and social work sectors: Mediation analysis of psychological and physical health problems. Int. J. Environ. Res. Public Health 2021, 18, 6218. [Google Scholar] [CrossRef]
- Aronsson, G.; Gustafsson, K. Sickness presenteeism: Prevalence, attendance-pressure factors, and an outline of a model for research. J. Occup. Environ. Med. 2005, 47, 958–966. [Google Scholar] [CrossRef]
- Yang, T.; Zhu, M.; Xie, X. The determinants of presenteeism: A comprehensive investigation of stress-related factors at work, health, and individual factors among the aging workforce. J. Occup. Health 2015, 58, 25–35. [Google Scholar] [CrossRef] [Green Version]
- Bergstrom, G.; Bodin, L.; Hagberg, J.; Aronsson, G.; Josephson, M. Sickness presenteeism today, sickness absenteeism tomorrow? A prospective study on sickness presenteeism and future sickness absenteeism. J. Occup. Environ. Med. 2009, 51, 629–638. [Google Scholar] [CrossRef] [PubMed]
- Lazarus, R.S. Psychological stress in the workplace. In Occupational Stress, 2nd ed.; Crandall, R., Perrewé, P.L., Eds.; CRC Press: Boca Raton, FL, USA, 2020; pp. 3–14. [Google Scholar]
- Schmidt, B.; Schneider, M.; Seeger, P.; van Vianen, A.; Loerbroks, A.; Herr, R.M. A comparison of job stress models: Associations with employee well-being, absenteeism, presenteeism, and resulting costs. J. Occup. Environ. Med. 2019, 61, 535–544. [Google Scholar] [CrossRef] [PubMed]
- Quick, J.C.; Henderson, D.F. Occupational stress: Preventing suffering, enhancing wellbeing. Int. J. Environ. Res. Public Health 2016, 13, 459. [Google Scholar] [CrossRef] [PubMed] [Green Version]
- Lazarus, R.S.; Folkman, S. Stress, Coping and Adaptation; Springer: New York, NY, USA, 1984. [Google Scholar]
- Taylor, S.E.; Stanton, A.L. Coping resources, coping processes, and mental health. Annu. Rev. Clin. Psychol. 2007, 3, 377–401. [Google Scholar] [CrossRef] [PubMed] [Green Version]
- Danna, K.; Griffin, R.W. Health and well-being in the workplace: A review and synthesis of the literature. J. Manag. 1999, 25, 357–384. [Google Scholar] [CrossRef]
- Skinner, E.A.; Edge, K.; Altman, J.; Sherwood, H. Searching for the structure of coping: A review and critique of category systems for classifying ways of coping. Psychol. Bull. 2003, 129, 216–269. [Google Scholar] [CrossRef] [Green Version]
- Carver, C.S.; Scheier, M.F.; Weintraub, J.K. Assessing coping strategies: A theoretically based approach. J. Pers. Socl. Psychol. 1989, 56, 267–283. [Google Scholar] [CrossRef]
- Carver, C.S. You want to measure coping but your protocol’s too long: Consider the brief COPE. Int. J. Behav. Med. 1997, 4, 92–100. [Google Scholar] [CrossRef]
- Aldridge, A.A.; Roesch, S.C. Developing coping typologies of minority adolescents: A latent profile analysis. J. Adolesc. 2008, 31, 499–517. [Google Scholar] [CrossRef] [Green Version]
- Doron, J.; Trouillet, R.; Maneveau, A.; Ninot, G.; Neveu, D. Coping profiles, perceived stress and health-related behaviors: A cluster analysis approach. Health Promot. Int. 2015, 30, 88–100. [Google Scholar] [CrossRef] [Green Version]
- Nielsen, M.B.; Knardahl, S. Coping strategies: A prospective study of patterns, stability, and relationships with psychological distress. Scand. J. Psychol. 2014, 55, 142–150. [Google Scholar] [CrossRef]
- Brown, S.P.; Westbrook, R.A.; Challagalla, G. Good cope, bad cope: Adaptive and maladaptive coping strategies following a critical negative work event. J. Appl. Psychol. 2005, 90, 792–798. [Google Scholar] [CrossRef] [PubMed]
- Gilbar, O.; Ben-Zur, H.; Lubin, G. Coping, mastery, stress appraisals, mental preparation, and unit cohesion predicting distress and performance: A longitudinal study of soldiers undertaking evacuation tasks. Anxiety Stress Coping 2010, 23, 547–562. [Google Scholar] [CrossRef] [PubMed]
- Rabenu, E.; Yaniv, E.; Elizur, D. The Relationship between psychological capital, coping with stress, well-being, and performance. Curr. Psychol. 2017, 36, 875–887. [Google Scholar] [CrossRef]
- Chang, Y.S.; Edwards, J.K. Examining the relationships among self-efficacy, coping, and job satisfaction using social career cognitive theory: An SEM analysis. J. Career Assess. 2015, 23, 35–47. [Google Scholar] [CrossRef]
- von Elm, E.; Altman, D.G.; Egger, M.; Pocock, S.J.; Gotzsche, P.C.; Vandenbroucke, J.P. STROBE Initiative. The Strengthening the Reporting of Observational Studies in Epidemiology (STROBE) statement: Guidelines for reporting observational studies. Int. J. Surg. 2014, 12, 1495–1499. [Google Scholar] [CrossRef] [Green Version]
- Kessler, R.C.; Ames, M.; Hymel, P.A.; Loeppke, R.; McKenas, D.K.; Richling, D.E.; Stang, P.E.; Ustun, T.B. Using the World Health Organization Health and Work Performance Questionnaire (HPQ) to evaluate the indirect workplace costs of illness. J. Occup. Environ. Med. 2004, 46, S23–S37. [Google Scholar] [CrossRef] [PubMed]
- Kessler, R.; Petukhova, M.; McInnes, K.; World Health Organization Health and Work Performance Questionnaire (HPQ). HPQ Short Form (Absenteeism and Presenteeism Questions and Scoring Rules); Harvard Medical School: Boston, MA, USA, 2007. [Google Scholar]
- Cooper, C.; Katona, C.; Livingston, G. Validity and Reliability of the Brief COPE in carers of people with dementia: The LASER-AD study. J. Nerv. Ment. Dis. 2008, 196, 838–843. [Google Scholar] [CrossRef]
- Coolidge, F.L.; Segal, D.L.; Hook, J.N.; Stewart, S. Personality disorders and coping among anxious older adults. J. Anxiety Disord. 2000, 14, 157–172. [Google Scholar] [CrossRef]
- Cohen, S.; Kamarck, T.; Mermelstein, R. A global measure of perceived stress. J. Health Soc. Behav. 1983, 24, 385–396. [Google Scholar] [CrossRef]
- Mimura, C.; Griffiths, P. A Japanese version of the Perceived Stress Scale: Cross-cultural translation and equivalence assessment. BMC Psychiatry 2008, 8, 85. [Google Scholar] [CrossRef] [PubMed] [Green Version]
- Brown, H.E.; Burton, N.; Gilson, N.D.; Brown, W. Measuring presenteeism: Which questionnaire to use in physical activity research? J. Phys. Act. Health 2014, 11, 241–248. [Google Scholar] [CrossRef] [PubMed]
- Itani, O.; Kaneita, Y.; Otsuka, Y.; Tokiya, M.; Jike, M.; Matsumoto, Y.; Nakagome, S.; Kinoshita, Y. A cross-sectional epidemiological study of the relationship between sleep duration, quality, and rhythm and presenteeism in workers. Sleep Biol. Rhythms 2022, 20, 53–63. [Google Scholar] [CrossRef]
- Halpern, M.T.; Shikiar, R.; Rentz, A.M.; Khan, Z.M. Impact of smoking status on workplace absenteeism and productivity. Tob. Control 2001, 10, 233–238. [Google Scholar] [CrossRef] [PubMed]
- Bowerman, B.L.; O’connell, R.T. Linear Statistical Models: An Applied Approach; Brooks/Cole: Pacific Grove, CA, USA, 1990. [Google Scholar]
- Royston, P.; White, I.R. Multiple imputation by chained equations (MICE): Implementation in Stata. J. Stat. Softw. 2011, 45, 1–20. [Google Scholar] [CrossRef] [Green Version]
- Discacciati, A.; Bellavia, A.; Lee, J.J.; Mazumdar, M.; Valeri, L. Med4way: A Stata Command to Investigate Mediating and Interactive Mechanisms Using the Four-Way Effect Decomposition; Oxford University Press: Oxford, UK, 2019. [Google Scholar]
- Park, J. Work Stress and Job Performance; Statistics Canada: Ottawa, ON, Canada, 2007. [Google Scholar]
- Lu, L.; Kao, S.F.; Siu, O.L.; Lu, C.Q. Work stressors, Chinese coping strategies, and job performance in Greater China. Int. J. Psychol. 2010, 45, 294–302. [Google Scholar] [CrossRef] [Green Version]
- Li, L.; Ai, H.; Gao, L.; Zhou, H.; Liu, X.; Zhang, Z.; Sun, T.; Fan, L. Moderating effects of coping on work stress and job performance for nurses in tertiary hospitals: A cross-sectional survey in China. BMC Health Serv. Res. 2017, 17, 401. [Google Scholar] [CrossRef]
- Bielecky, A.; Chen, C.; Ibrahim, S.; Beaton, D.E.; Mustard, C.A.; Smith, P.M. The impact of co-morbid mental and physical disorders on presenteeism. Scand. J. Work Environ. Health 2015, 41, 554–564. [Google Scholar] [CrossRef] [Green Version]
- Holahan, C.J.; Moos, R.H.; Schaefer, J.A. Coping, stress resistance, and growth: Conceptualizing adaptive functioning. In Handbook of Coping: Theory, Research, Applications; Zeidner, M., Endler, N.S., Eds.; John Wiley & Sons: Hoboken, NJ, USA, 1996; pp. 24–43. [Google Scholar]

| Variables | n | % | Mean | (Range) | SD |
|---|---|---|---|---|---|
| Age (years) | 1359 | 41.1 | (18–66) | 11.2 | |
| Sex, male | 1034 | 76.1 | |||
| Work performance | 1341 | 54.3 | (0–100) | 17.9 | |
| Problem-focused | 1320 | 15.2 | (6–24) | 3.8 | |
| Active coping | 1332 | 5.3 | 1.4 | ||
| Use of instrumental support | 1330 | 4.7 | 1.7 | ||
| Planning | 1334 | 5.2 | 1.6 | ||
| Emotion-focused | 1309 | 20.6 | (10–40) | 4.9 | |
| Acceptance | 1334 | 5.4 | 1.5 | ||
| Use of emotional support | 1332 | 4.1 | 1.6 | ||
| Humor | 1328 | 3.8 | 1.6 | ||
| Positive reframing | 1331 | 4.5 | 1.5 | ||
| Religion | 1331 | 2.7 | 1.1 | ||
| Dysfunctional | 1293 | 22.7 | (12–48) | 5.6 | |
| Behavioral disengagement | 1331 | 3.6 | 1.4 | ||
| Denial | 1327 | 2.7 | 1.2 | ||
| Self-distraction | 1335 | 4.7 | 1.6 | ||
| Substance use | 1327 | 3.3 | 1.8 | ||
| Self-blame | 1331 | 4.3 | 1.7 | ||
| Venting | 1331 | 4.1 | 1.5 | ||
| PSS-10 score | 1294 | 18.4 | (4–37) | 4.9 | |
| Form of employment | |||||
| Standard | 1194 | 87.9 | |||
| Non-standard | 158 | 11.6 | |||
| Unknown | 3 | 0.2 | |||
| Work shift | |||||
| Non-shiftwork | 785 | 57.8 | |||
| Shiftwork | 571 | 42.0 | |||
| Unknown | 3 | 0.2 | |||
| Overworking hours per month | |||||
| <45 h | 1169 | 86.0 | |||
| 45–80 h | 133 | 9.8 | |||
| ≥80 h | 10 | 0.7 | |||
| Unknown | 47 | 3.5 | |||
| Number of days off/month | |||||
| <4 days | 185 | 13.6 | |||
| 4–7 days | 337 | 24.8 | |||
| 8–11 days | 683 | 50.3 | |||
| ≥12 days | 115 | 8.5 | |||
| Unknown | 39 | 2.9 | |||
| Sleep duration | |||||
| <5 h/day | 186 | 13.7 | |||
| 5–6 h/day | 376 | 27.7 | |||
| 6–7 h/day | 644 | 47.4 | |||
| 7–8 h/day | 87 | 6.4 | |||
| ≥8 h/day | 36 | 2.6 | |||
| Unknown | 30 | 2.2 | |||
| Exercise habits (>1 h/week) | |||||
| Yes | 1076 | 79.2 | |||
| No | 251 | 18.5 | |||
| Unknown | 32 | 2.4 | |||
| Current smoking (%) | |||||
| Yes | 921 | 67.8 | |||
| No | 411 | 30.2 | |||
| Unknown | 27 | 2.0 | |||
| Alcohol use | |||||
| Daily | 358 | 26.3 | |||
| Sometimes | 463 | 34.1 | |||
| Never | 513 | 37.7 | |||
| Unknown | 25 | 1.8 |
| Bivariate Regression Analysis | ||||
|---|---|---|---|---|
| β | 95% CI | t-Value | p-Value | |
| Brief COPE | ||||
| Problem-focused | ||||
| Active coping | 0.41 | (−0.40, 1.23) | 0.99 | 0.322 |
| Use of instrumental support | −0.48 | (−1.22, 0.27) | −1.25 | 0.211 |
| Planning | 1.47 | (0.64, 2.30) | 3.47 | 0.001 |
| Emotion-focused | ||||
| Acceptance | 0.02 | (−0.73, 0.77) | 0.05 | 0.960 |
| Use of emotional support | 0.62 | (−0.16, 1.40) | 1.56 | 0.119 |
| Humor | −0.42 | (−1.10, 0.26) | −1.21 | 0.225 |
| Positive reframing | −0.45 | (−1.26, 0.37) | −1.08 | 0.281 |
| Religion | 0.45 | (−0.42, 1.31) | 1.02 | 0.310 |
| Dysfunctional | ||||
| Behavioral disengagement | −0.66 | (−1.41, 0.10) | −1.71 | 0.087 |
| Denial | −1.20 | (−2.09, −0.32) | −2.67 | 0.008 |
| Self-blame | −1.33 | (−1.96, −0.70) | −4.14 | <0.001 |
| Self-distraction | 0.03 | (−0.61, 0.68) | 0.10 | 0.917 |
| Substance use | 0.22 | (−0.31. 0.75) | 0.82 | 0.412 |
| Venting | −0.13 | (−0.85, 0.58) | −0.36 | 0.717 |
| PSS-10 score | −0.36 | (−0.58, −0.15) | −3.37 | 0.001 |
| Multivariate regression analysis | ||||
| β | 95% CI | t-value | p-value | |
| Brief COPE | ||||
| Problem-focused | ||||
| Active coping | −0.21 | (−1.00, 0.58) | −0.53 | 0.598 |
| Use of instrumental support | 0.18 | (−0.53, 0.88) | 0.49 | 0.625 |
| Planning | 0.86 | (0.07, 1.66) | 2.12 | 0.034 |
| Emotion-focused | ||||
| Acceptance | −0.09 | (−0.80, 0.61) | −0.26 | 0.792 |
| Use of emotional support | 0.53 | (−0.22, 1.28) | 1.39 | 0.165 |
| Humor | −0.15 | (−0.79, 0.50) | −0.44 | 0.658 |
| Positive reframing | −0.72 | (−1.49, 0.04) | −1.85 | 0.064 |
| Religion | 0.44 | (−0.39, 1.27) | 1.03 | 0.302 |
| Dysfunctional | ||||
| Behavioral disengagement | −0.21 | (−0.94, 0.52) | −0.56 | 0.575 |
| Denial | −0.63 | (−1.48, 0.23) | −1.44 | 0.149 |
| Self-blame | −1.22 | (−1.83, −0.61) | −3.92 | <0.001 |
| Self-distraction | 0.30 | (−0.33, 0.94) | 0.95 | 0.344 |
| Substance use | 0.32 | (−0.25, 0.90) | 1.11 | 0.269 |
| Venting | −0.31 | (−0.98, 0.35) | −0.93 | 0.353 |
| PSS-10 score | −0.27 | (−0.47, −0.07) | −2.63 | 0.009 |
| Potential Mediators | Total Effect | Controlled Direct Effect | Reference Interaction | Mediated Interaction | Mediation | Pure Indirect Effect | |||||
|---|---|---|---|---|---|---|---|---|---|---|---|
| Problem-focused | −2.71 | (−3.72, −1.69) | −2.59 | (−3.60, −1.58) | −0.02 | (−0.06, 0.02) | 0.04 | (−0.03, 0.11) | 3.50% | −0.13 | (−0.26, 0.00) |
| Active coping | −2.22 | (−3.27, −1.16) | −2.22 | (−3.27, −1.16) | 0.00 | (−0.02, 0.03) | −0.01 | (−0.06, 0.04) | 0.10% | 0.00 | (−0.07, 0.08) |
| Use of instrumental support | −2.25 | (−3.30, −1.20) | −2.24 | (−3.29, −1.19) | −0.01 | (−0.05, 0.03) | 0.02 | (−0.03, 0.07) | 0.10% | −0.02 | (−0.07, 0.03) |
| Planning | −2.20 | (−3.25, −1.14) | −2.15 | (−3.21, −1.09) | −0.01 | (−0.03, 0.02) | 0.01 | (−0.02, 0.04) | 1.80% | −0.05 | (−0.14, 0.04) |
| Acceptance | −2.24 | (−3.29, −1.18) | −2.24 | (−3.30, −1.18) | 0.00 | (−0.02, 0.03) | 0.00 | (−0.02, 0.01) | 0.10% | 0.00 | (−0.02, 0.02) |
| Emotion-focused | −2.60 | (−3.60, −1.61) | −2.61 | (−3.62, −1.60) | −0.03 | (−0.09, 0.02) | 0.07 | (−0.04, 0.19) | 2.50% | −0.03 | (−0.23, 0.16) |
| Use of emotional support | −2.21 | (−3.26, −1.16) | −2.21 | (−3.26, −1.16) | 0.00 | (−0.04, 0.04) | 0.01 | (−0.03, 0.05) | 0.20% | −0.02 | (−0.08, 0.05) |
| Humor | −2.21 | (−3.26, −1.17) | −2.22 | (−3.27, −1.17) | −0.03 | (−0.09, 0.02) | 0.08 | (−0.01, 0.17) | 1.90% | −0.03 | (−0.15, 0.08) |
| Positive reframing | −2.09 | (−3.13, −1.05) | −2.22 | (−3.27, −1.16) | −0.01 | (−0.06, 0.03) | 0.04 | (−0.06, 0.14) | 6.50% | 0.10 | (−0.06, 0.26) |
| Religion | −2.16 | (−3.22, −1.11) | −2.11 | (−3.17, −1.05) | 0.01 | (−0.03, 0.06) | −0.04 | (−0.12, 0.03) | 3.00% | −0.02 | (−0.09, 0.05) |
| Dysfunctional | −3.38 | (−4.32, −2.43) | −2.62 | (−3.63, −1.60) | 0.01 | (−0.16, 0.18) | −0.02 | (−0.34, 0.30) | 22.80% | −0.75 | (−1.18, −0.31) |
| Behavioral disengagement | −2.30 | (−3.35, −1.26) | −2.20 | (−3.26, −1.15) | 0.01 | (−0.06, 0.07) | −0.01 | (−0.11, 0.09) | 4.50% | −0.09 | (−0.25, 0.06) |
| Denial | −2.40 | (−3.46, −1.34) | −2.40 | (−3.46, −1.34) | 0.04 | (−0.03, 0.12) | −0.04 | (−0.12, 0.04) | 1.80% | 0.00 | (−0.04, 0.04) |
| Self-distraction | −2.22 | (−3.27, −1.17) | −2.22 | (−3.27, −1.17) | 0.00 | (−0.02, 0.01) | 0.01 | (−0.02, 0.03) | 0.10% | −0.01 | (−0.05, 0.03) |
| Substance use | −2.15 | (−3.19, −1.10) | −2.16 | (−3.22, −1.11) | −0.06 | (−0.13, 0.01) | 0.09 | (−0.01, 0.20) | 3.50% | −0.02 | (−0.15, 0.12) |
| Self-blame | −3.08 | (−4.10, −2.07) | −2.22 | (−3.28, −1.16) | −0.02 | (−0.15, 0.11) | 0.03 | (−0.21, 0.28) | 27.50% | −0.88 | (−1.30, −0.46) |
| Venting | −2.23 | (−3.28, −1.18) | −2.20 | (−3.26, −1.15) | 0.01 | (−0.02, 0.04) | −0.01 | (−0.06, 0.03) | 1.40% | −0.02 | (−0.09, 0.05) |
Publisher’s Note: MDPI stays neutral with regard to jurisdictional claims in published maps and institutional affiliations. |
© 2022 by the authors. Licensee MDPI, Basel, Switzerland. This article is an open access article distributed under the terms and conditions of the Creative Commons Attribution (CC BY) license (https://creativecommons.org/licenses/by/4.0/).
Share and Cite
Otsuka, Y.; Itani, O.; Matsumoto, Y.; Kaneita, Y. Associations between Coping Profile and Work Performance in a Cohort of Japanese Employees. Int. J. Environ. Res. Public Health 2022, 19, 4806. https://doi.org/10.3390/ijerph19084806
Otsuka Y, Itani O, Matsumoto Y, Kaneita Y. Associations between Coping Profile and Work Performance in a Cohort of Japanese Employees. International Journal of Environmental Research and Public Health. 2022; 19(8):4806. https://doi.org/10.3390/ijerph19084806
Chicago/Turabian StyleOtsuka, Yuichiro, Osamu Itani, Yuuki Matsumoto, and Yoshitaka Kaneita. 2022. "Associations between Coping Profile and Work Performance in a Cohort of Japanese Employees" International Journal of Environmental Research and Public Health 19, no. 8: 4806. https://doi.org/10.3390/ijerph19084806
APA StyleOtsuka, Y., Itani, O., Matsumoto, Y., & Kaneita, Y. (2022). Associations between Coping Profile and Work Performance in a Cohort of Japanese Employees. International Journal of Environmental Research and Public Health, 19(8), 4806. https://doi.org/10.3390/ijerph19084806