
Reduced Muscle Activity of the Upper Extremity in Individuals with Spinal Cord Injuries


Abstract
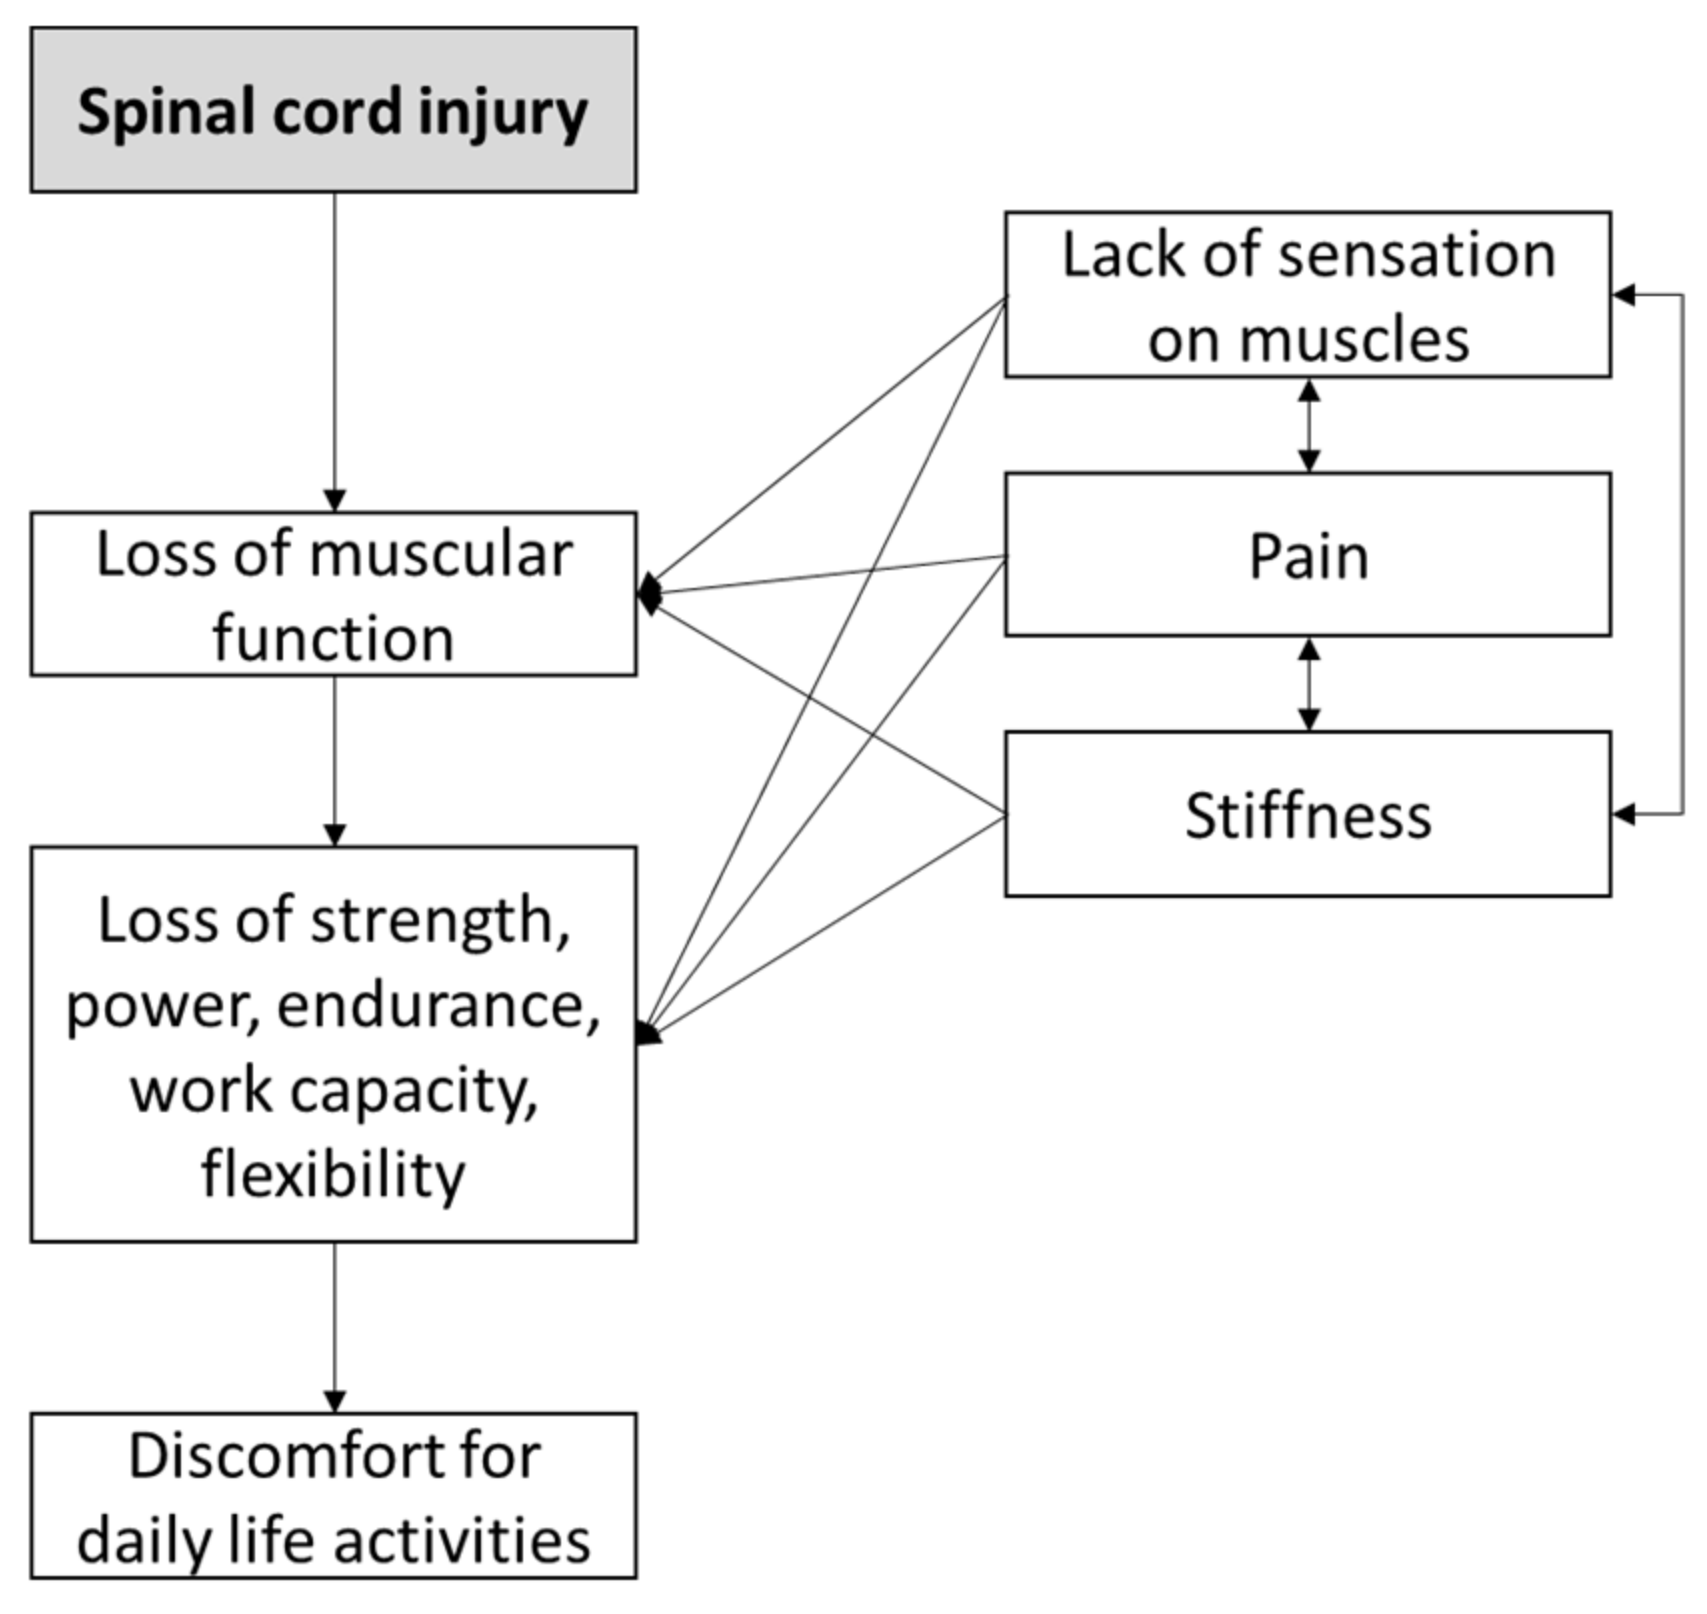
1. Introduction
2. Materials and Methods
2.1. Participants
2.2. Equipment
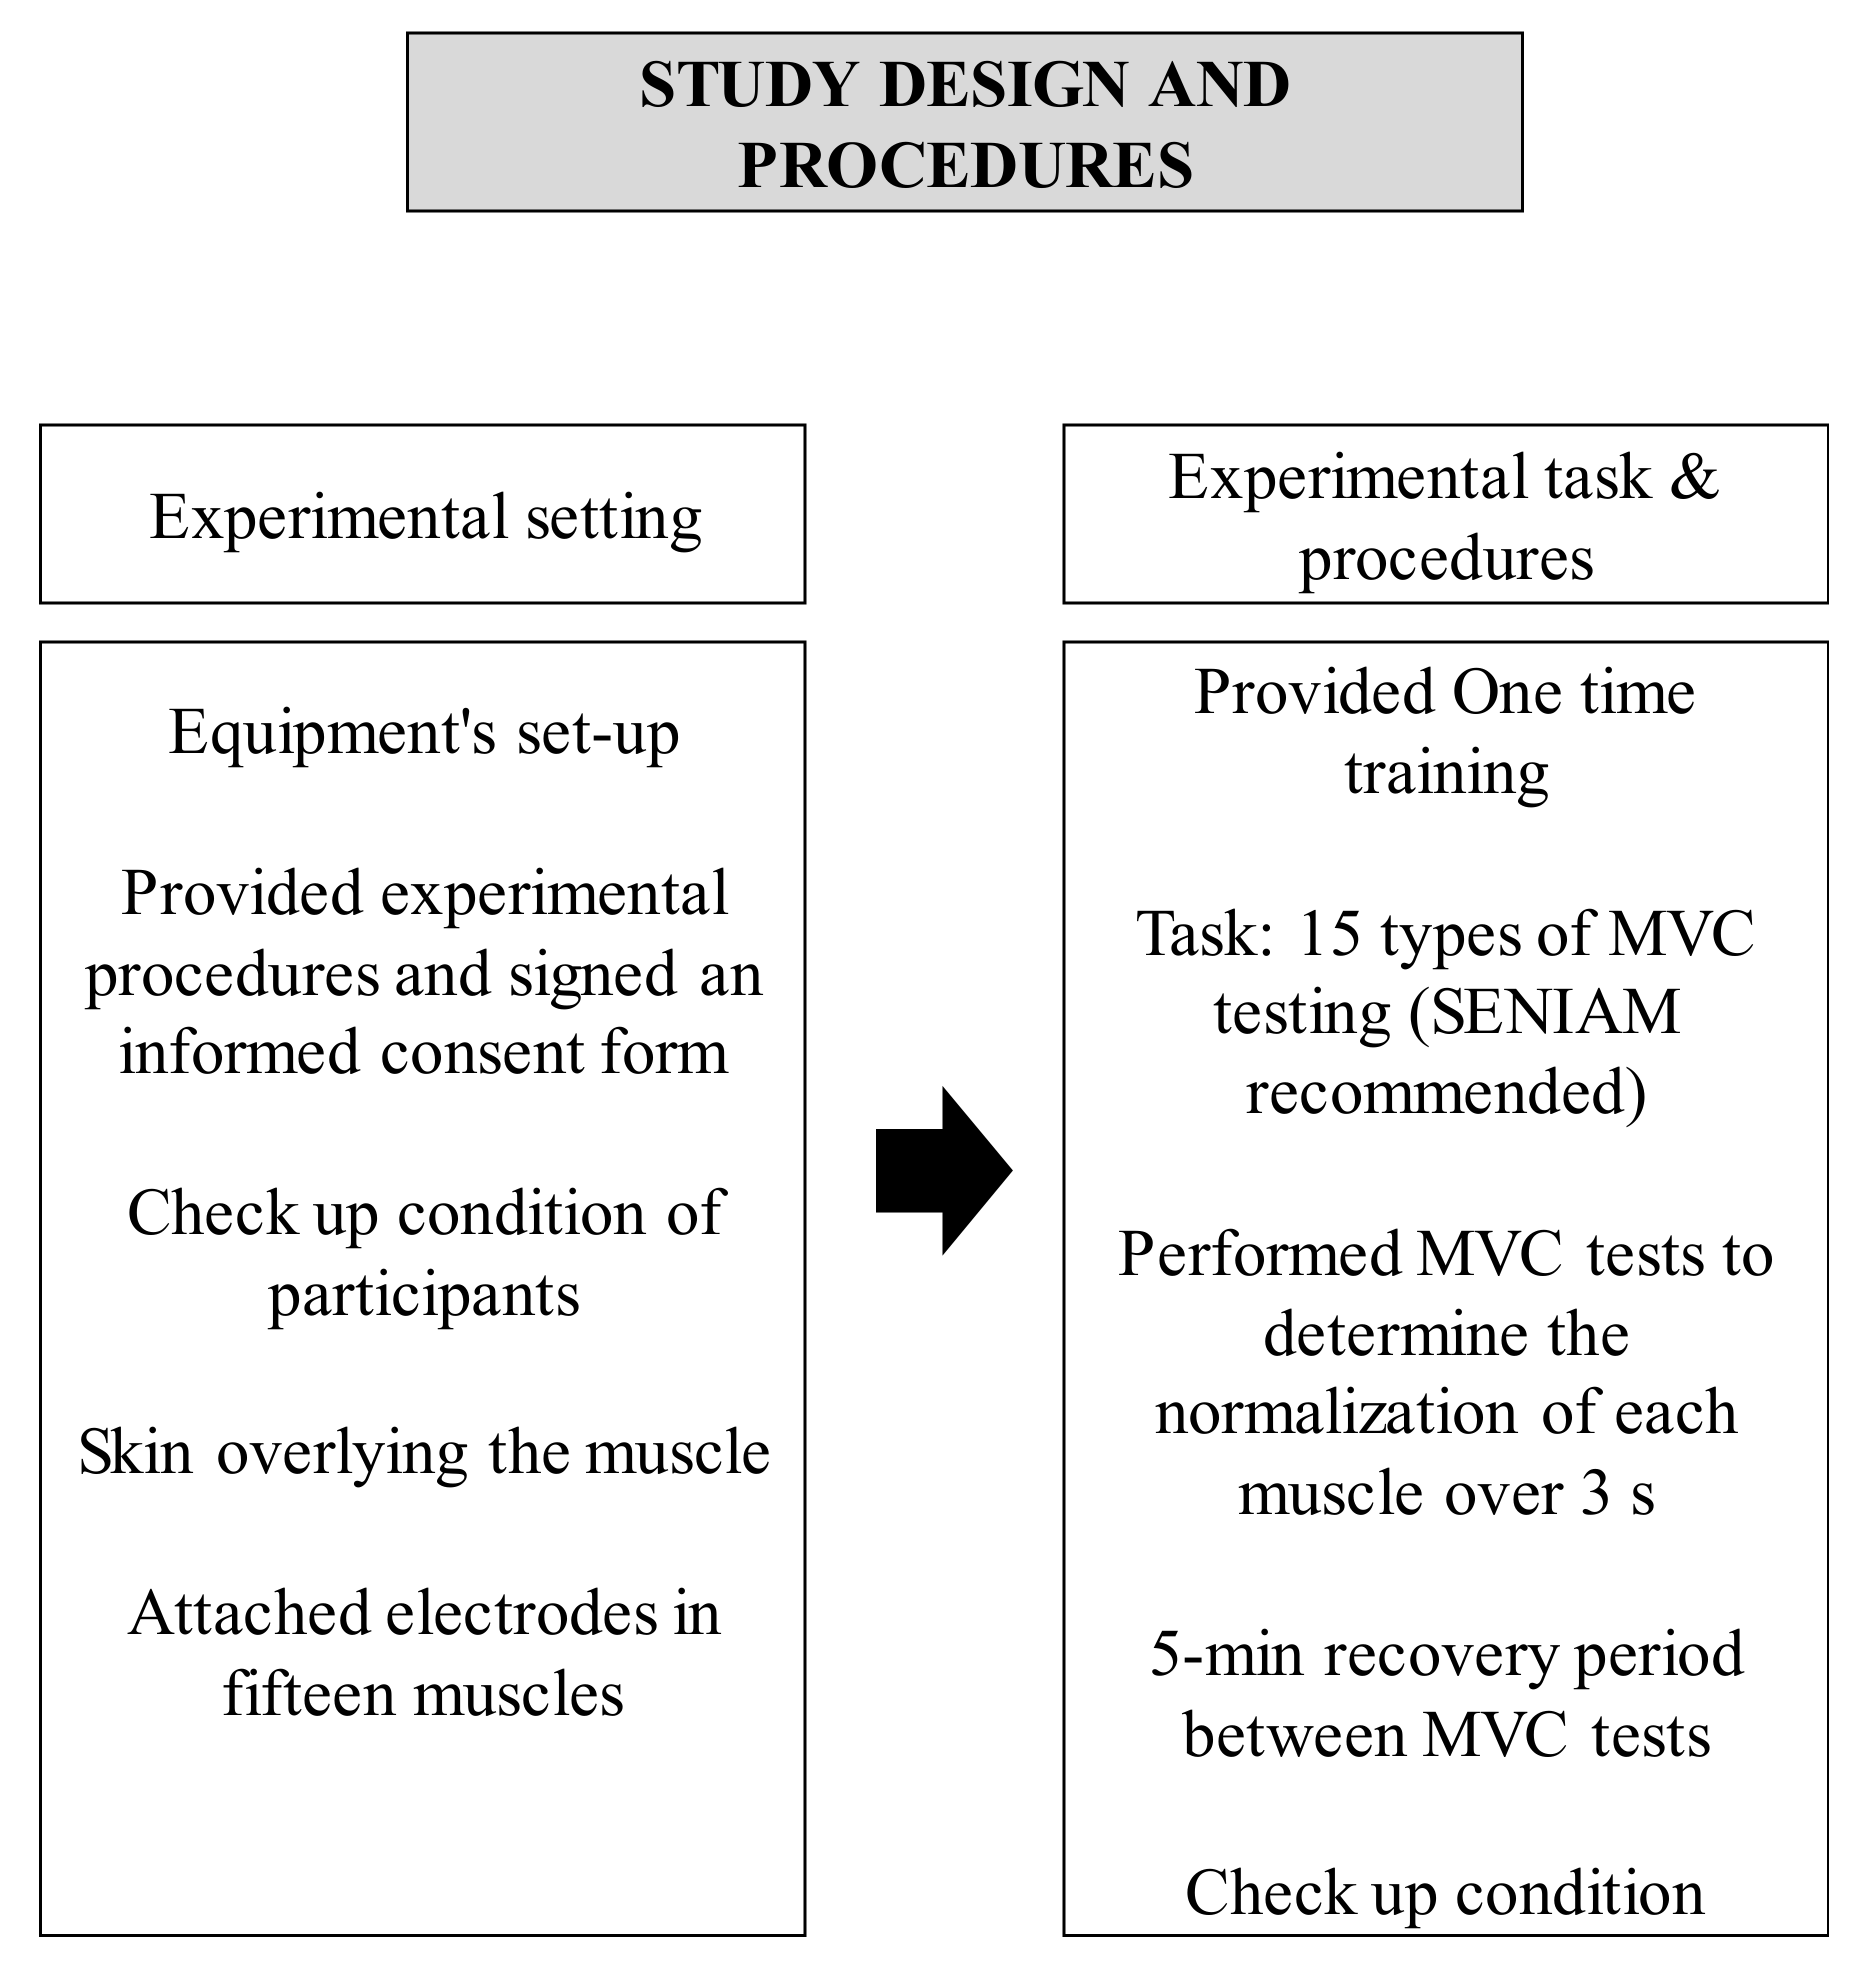
2.3. Experimental Procedures
2.4. Data Analysis
3. Results
3.1. Shoulder Muscles
3.2. Elbow Muscles
3.3. Wrist Muscles
3.4. Finger Muscles
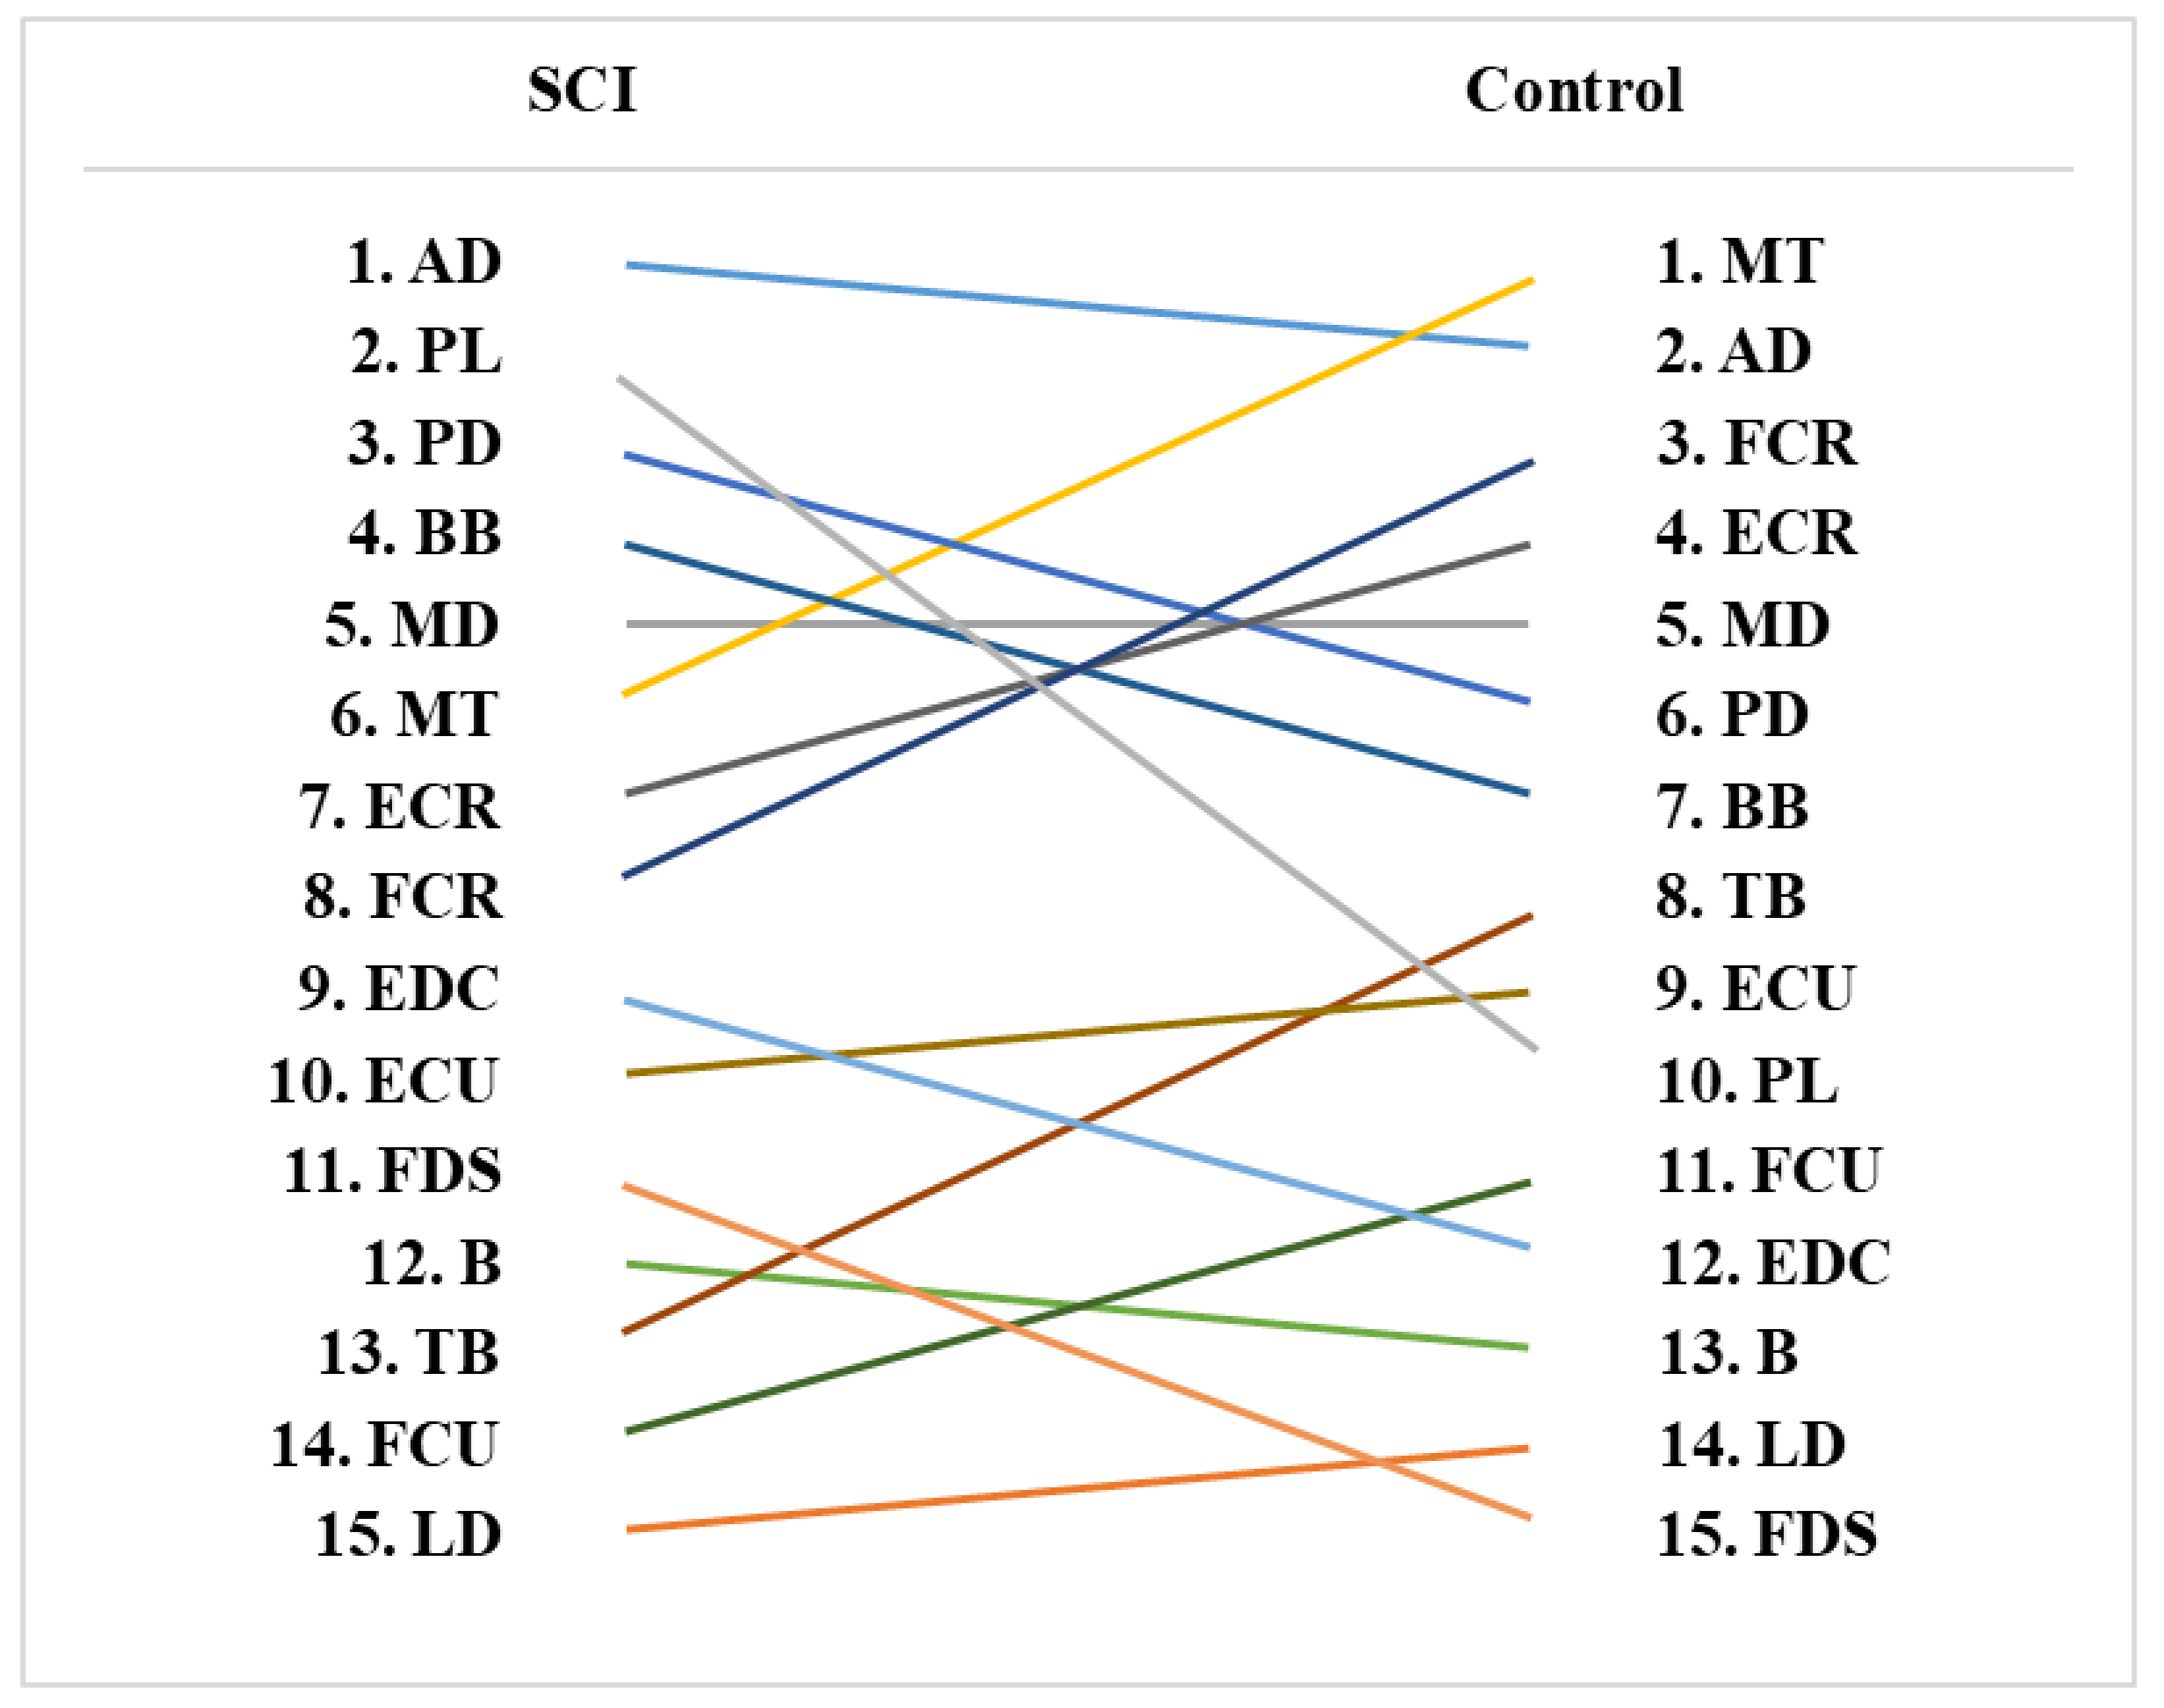
3.5. Muscle Activity Rankings
4. Discussion
5. Conclusions
Author Contributions
Funding
Institutional Review Board Statement
Informed Consent Statement
Data Availability Statement
Conflicts of Interest
References
- Sterner, R.C.; Brooks, N.P. Early Decompression and Short Transport Time After Traumatic Spinal Cord Injury are Associated with Higher American Spinal Injury Association Impairment Scale Conversion. Spine 2022, 47, 59–66. [Google Scholar] [CrossRef] [PubMed]
- Tykocki, T.; Poniatowski Lukasz, A.; Czyz, M.; Wynne-Jones, G. Oblique corpectomy in the cervical spine. Spinal Cord 2018, 56, 426–435. [Google Scholar] [CrossRef] [PubMed]
- James, S.L.; Theadom, A.; Ellenbogen, R.G.; Bannick, M.S.; Montjoy-Venning, W.; Lucchesi, L.R.; Abbasi, N.; Abdulkader, R.; Abraha, H.N.; Adsuar, J.C. Global, regional, and national burden of traumatic brain injury and spinal cord injury 1990–2016: A systematic analysis for the Global Burden of Disease Study. Lancet Neurol. 2019, 18, 56–87. [Google Scholar] [CrossRef]
- Jain, N.B.; Ayers, G.D.; Peterson, E.N.; Harris, M.B.; Morse, L.; O’Connor, K.C.; Garshick, E. Traumatic spinal cord injury in the United States 1993–2012. JAMA 2015, 313, 2236–2243. [Google Scholar] [CrossRef]
- Schoenfeld, A.J.; McCriskin, B.; Hsiao, M.; Burks, R. Incidence and epidemiology of spinal cord injury within a closed American population: The United States military (2000–2009). Spinal Cord 2011, 49, 874–879. [Google Scholar] [CrossRef]
- Furlan, J.C.; Gulasingam, S.; Craven, B.C. Epidemiology of war-related spinal cord injury among combatants: A systematic review. Glob. Spine J. 2019, 9, 545–558. [Google Scholar] [CrossRef]
- Roberts, T.T.; Leonard, G.R.; Cepela, D.J. Classifications in brief: American spinal injury association (ASIA) impairment scale. Clin. Orthop. Relat. Res. 2017, 475, 1499. [Google Scholar] [CrossRef]
- Wojdasiewicz, P.; Poniatowski, A.; Turczyn, P.; Frasuńska, J.; Paradowska-Gorycka, A.; Tarnacka, B. Significance of Omega-3 Fatty Acids in the Prophylaxis and Treatment after Spinal Cord Injury in Rodent Models. Mediat. Inflamm. 2020, 2020, 1–11. [Google Scholar] [CrossRef]
- Baylo-Marín, O.; Flores, Á.; García-Alías, G. Long-term rehabilitation reduces task error variability in cervical spinal cord contused rats. Exp. Neurol. 2022, 348, 113928. [Google Scholar] [CrossRef]
- Flack, J.A.; Sharma, K.D.; Xie, J.Y. Delving into the recent advancements of spinal cord injury treatment: A review of recent progress. Neural Regen. Res. 2022, 17, 283. [Google Scholar]
- Dionyssiotis, Y.; Stathopoulos, K.; Trovas, G.; Papaioannou, N.; Skarantavos, G.; Papagelopoulos, P. Impact on bone and muscle area after spinal cord injury. BoneKEy Rep. 2015, 4, 633. [Google Scholar] [CrossRef] [PubMed]
- McKay, W.B.; Sweatman, W.M.; Field-Fote, E.C. The experience of spasticity after spinal cord injury: Perceived characteristics and impact on daily life. Spinal Cord 2018, 56, 478–486. [Google Scholar] [CrossRef] [PubMed]
- Dalyan, M.; Cardenas, D.D.; Gerard, B. Upper extremity pain after spinal cord injury. Spinal Cord 1999, 37, 191–195. [Google Scholar] [CrossRef] [PubMed]
- Binkhorst, R.A.; Oeseburg, B.; Hopman, M.T. Cardiovascular responses in paraplegic subjects during arm exercise. Eur. J. Appl. Physiol. Occup. Physiol. 1992, 65, 73–78. [Google Scholar] [CrossRef]
- Jehl, J.L.; Gandmontagne, M.; Pastene, G.; Eyssette, M.; Flandrois, R.; Coudert, J. Cardiac output during exercise in paraplegic subjects. Eur. J. Appl. Physiol. Occup. Physiol. 1991, 62, 256–260. [Google Scholar] [CrossRef]
- Jacobs, P.L.; Mahoney, E.T.; Cohn, K.A.; Sheradsky, L.F.; Green, B.A. Oral creatine supplementation enhances upper extremity work capacity in persons with cervical-level spinal cord injury. Arch. Phys. Med. Rehabil. 2002, 83, 19–23. [Google Scholar] [CrossRef]
- Hincapie, J.G.; Kirsch, R.F. EMG-based control for a C5/C6 spinal cord injury upper extremity neuroprosthesis. In Proceedings of the 2007 29th Annual International Conference of the IEEE Engineering in Medicine and Biology Society, Lyon, France, 22–26 August 2007; pp. 2432–2435. [Google Scholar]
- Berlowitz, D.J.; Tamplin, J. Respiratory muscle training for cervical spinal cord injury. Cochrane Database Syst. Rev. 2013, 7, 1–35. [Google Scholar] [CrossRef]
- Dunkerley, A.L.; Ashburn, A.; Stack, E.L. Deltoid triceps transfer and functional independence of people with tetraplegia. Spinal Cord 2000, 38, 435–441. [Google Scholar] [CrossRef][Green Version]
- Buffart, L.M.; Berg-Emons, R.J.; van den Wijlen-Hempel, M.S.; van Stam, H.J.; Roebroeck, M.E. Health-related physical fitness of adolescents and young adults with myelomeningocele. Eur. J. Appl. Physiol. 2008, 103, 181–188. [Google Scholar] [CrossRef][Green Version]
- Donnelly, C.; Eng, J.J.; Hall, J.; Alford, L.; Giachino, R.; Norton, K.; Kerr, D.S. Client-centred assessment and the identification of meaningful treatment goals for individuals with a spinal cord injury. Spinal Cord 2004, 42, 302–307. [Google Scholar] [CrossRef]
- Wyndaele, M.; Wyndaele, J.-J. Incidence, prevalence and epidemiology of spinal cord injury: What learns a worldwide literature survey? Spinal Cord 2006, 44, 523–529. [Google Scholar] [CrossRef] [PubMed]
- Kloosterman, M.G.M.; Snoek, G.J.; Jannink, M.J.A. Systematic review of the effects of exercise therapy on the upper extremity of patients with spinal-cord injury. Spinal Cord 2009, 47, 196–203. [Google Scholar] [CrossRef] [PubMed]
- Popovic, M.R.; Thrasher, T.A.; Adams, M.E.; Takes, V.; Zivanovic, V.; Tonack, M.I. Functional electrical therapy: Retraining grasping in spinal cord injury. Spinal Cord 2006, 44, 143–151. [Google Scholar] [CrossRef] [PubMed]
- Hicks, A.L.; Martin, K.A.; Ditor, D.S.; Latimer, A.E.; Craven, C.; Bugaresti, J.; McCartney, N. Long-term exercise training in persons with spinal cord injury: Effects on strength, arm ergometry performance and psychological well-being. Spinal Cord 2003, 41, 34–43. [Google Scholar] [CrossRef] [PubMed]
- Stegeman, D.; Hermens, H. Standards for surface electromyography: The European project Surface EMG for non-invasive assessment of muscles (SENIAM). Enschede Roessingh Res. Dev. 2007, 10, 8–12. [Google Scholar]
- Mulroy, S.J.; Farrokhi, S.; Newsam, C.J.; Perry, J. Effects of spinal cord injury level on the activity of shoulder muscles during wheelchair propulsion: An electromyographic study. Arch. Phys. Med. Rehabil. 2004, 85, 925–934. [Google Scholar] [CrossRef] [PubMed]
- Perotto, A.O. Anatomical Guide for the Electromyographer: The Limbs and Trunk; Charles C Thomas Publisher: Springfield, IL, USA, 2011. [Google Scholar]
- Kendall, F.P.; McCreary, E.K.; Provance, P.G.; Rodgers, M.; Romani, W.A. Muscles: Testing and Function with Posture and Pain; LWW: Philadelphia, PA, USA, 1993; p. 103. [Google Scholar]
- Akkurt, H.; Karapolat, H.U.; Kirazli, Y.; Kose, T. The effects of upper extremity aerobic exercise in patients with spinal cord injury: A randomized controlled study. Eur. J. Phys. Rehabil. Med. 2017, 53, 219–227. [Google Scholar] [CrossRef]
- Waters, R.; Sie, I. Upper extremity changes with SCI contrasted to common aging in the musculoskeletal system. Top. Spinal Cord Inj. Rehabil. 2001, 6, 61–68. [Google Scholar] [CrossRef]
- Subbarao, J.V.; Klopfstein, J.; Turpin, R. Prevalence and impact of wrist and shoulder pain in patients with spinal cord injury. J. Spinal Cord Med. 1995, 18, 9–13. [Google Scholar] [CrossRef]
- Sie, I.H.; Waters, R.L.; Adkins, R.H.; Gellman, H. Upper extremity pain in the postrehabilitation spinal cord injured patient. Arch. Phys. Med. Rehabil. 1992, 73, 44–48. [Google Scholar]
- Gianini, P.E.S.; Chamlian, T.R.; Arakaki, J.C. Shoulder pain in spinal cord injury. Acta Ortopédica Bras. 2006, 14, 44–47. [Google Scholar] [CrossRef]
- Drongelen S van De Groot, S.; Veeger, H.E.J.; Angenot, E.L.D.; Dallmeijer, A.J.; Post, M.W.M.; Van Der Woude, L.H.V. Upper extremity musculoskeletal pain during and after rehabilitation in wheelchair-using persons with a spinal cord injury. Spinal Cord 2006, 44, 152–159. [Google Scholar] [CrossRef] [PubMed]
- Brouwer, B.; Hopkins-Rosseel, D.H. Motor cortical mapping of proximal upper extremity muscles following spinal cord injury. Spinal Cord 1997, 35, 205–212. [Google Scholar] [CrossRef] [PubMed]
- Ditunno, J.F.; Stover, S.L.; Freed, M.M.; Ahn, J.H. Motor recovery of the upper extremities in traumatic quadriplegia: A multicenter study. Arch. Phys. Med. Rehabil. 1992, 73, 431–436. [Google Scholar] [PubMed]
- Ditunno, J.F., Jr.; Cohen, M.E.; Hauck, W.W.; Jackson, A.B.; Sipski, M.L. Recovery of upper-extremity strength in complete and incomplete tetraplegia: A multicenter study. Arch. Phys. Med. Rehabil. 2000, 81, 389–393. [Google Scholar] [CrossRef] [PubMed]
- Calancie, B.; Molano, M.R.; Broton, J.G. EMG for assessing the recovery of voluntary movement after acute spinal cord injury in man. Clin. Neurophysiol. 2004, 115, 1748–1759. [Google Scholar] [CrossRef]
- McKay, W.B.; Ovechkin, A.V.; Vitaz, T.W.; De Paleville, D.T.; Harkema, S.J. Neurophysiological characterization of motor recovery in acute spinal cord injury. Spinal Cord 2011, 49, 421–429. [Google Scholar] [CrossRef]


| Joint | Muscles | Manual Muscle Testing |
|---|---|---|
| Shoulder | Anterior Deltoid (AD) | Shoulder abduction in slight flexion, with the humerus in slight lateral rotation. In the erect sitting position, it was necessary to place the humerus in slight lateral rotation to increase the effect of gravity on the anterior fibers. |
| Latissimus Dorsi (LD) | Adduction of the arm, with extension, in the medially rotated position. | |
| Middle deltoid (MD) | Adduction of the scapula, with upward rotation (lateral rotation of the inferior angle) and without elevation of the shoulder girdle. The test position was obtained by placing the shoulder in 90° abduction and in lateral rotation sufficient to bring the scapula into lateral rotation of the inferior angle. | |
| Middle Trapezius (MT) | Shoulder abduction without rotation. When placing the shoulder in a test position, the elbow should be flexed to indicate the neutral position of the rotation. | |
| Posterior Deltoid (PD) | Shoulder abduction in slight extension, with the humerus in slight medial rotation. In the erect sitting position, it was necessary to place the humerus in slight medial rotation to have the posterior fibers in an antigravity position. | |
| Elbow | Brachioradialis (B) | Flexion of the elbow, with the forearm neutral between pronation and supination. The belly of the brachioradialis must be seen and felt during this test because the movement can also be produced by other muscles that flex the elbow. |
| Biceps Brachii (BB) | Elbow flexion slightly less than or at a right angle, with the forearm in supination. | |
| Triceps Brachii (TB) | Extension of the elbow joint (to slightly less than full extension). | |
| Wrist | Extensor carpi Radialis (ECR) | Extension of the wrist toward the radial side. Elbow flexion makes the extensor carpi radialis longus less effective by placing it in a shortened position. |
| Extensor Carpi Ulnaris (ECU) | Extension of the wrist toward the ulnar side. | |
| Flexor Carpi Radialis (FCR) | Flexion of the wrist toward the radial side | |
| Flexor Carpi Ulnaris (FCU) | Flexion of the wrist toward the radial side. | |
| Finger | Extensor Digitorum Comunis (EDC) | Extension of the metacarpophalangeal joints of the second through fifth digits with the interphalangeal joints relaxed. |
| Flexor Digitorum Superficialis (FDS) | Flexion of the proximal interphalangeal joint, with the distal interphalangeal joint extended, of the second, third, fourth, and fifth digits. | |
| Palmaris Longus (PL) | Tensing of the palmar fascia by strongly cupping the palm of the hand and flexing the wrist. |
| Muscle | Variable | SCI Patient | Control | % Difference | p-Value |
|---|---|---|---|---|---|
| Anterior Deltoid (AD) | Mean (uV) | 524.00 (282.00) | 509.60 (267.90) | 2.83 | 0.817 |
| Peak (uV) | 657.00 (383.00) | 640.10 (322.80) | 2.64 | 0.803 | |
| CV (%) | 12.29 (5.37) | 16.72 (10.94) | −26.50 | 0.510 | |
| Latissimus Dorsi (LD) | Mean (uV) | 154.20 (74.50) | 333.00 (249.70) | −53.69 | 0.018 * |
| Peak (uV) | 236.10 (111.50) | 409.40 (294.10) | −42.33 | 0.113 | |
| CV (%) | 34.70 (47.60) | 14.79 (8.26) | 134.62 | 0.533 | |
| Middle deltoid (MD) | Mean (uV) | 309.60 (122.10) | 459.30 (237.20) | −32.59 | 0.140 |
| Peak (uV) | 409.00 (158.20) | 580.00 (291.40) | −29.48 | 0.182 | |
| CV (%) | 20.21 (20.88) | 16.82 (9.71) | 20.15 | 0.510 | |
| Middle Trapezius (MT) | Mean (uV) | 329.60 (234.50) | 497.00 (318.20) | −33.68 | 0.182 |
| Peak (uV) | 404.00 (288.00) | 645.80 (391.10) | −37.44 | 0.072 | |
| CV (%) | 11.79 (1.87) | 20.49 (16.54) | −42.45 | 0.034 * | |
| Posterior Deltoid (PD) | Mean (uV) | 381.70 (164.00) | 440.50 (140.30) | −13.35 | 0.153 |
| Peak (uV) | 453.30 (203.90) | 561.70 (168.20) | −19.30 | 0.085 | |
| CV (%) | 10.85 (4.82) | 16.71 (8.66) | −35.07 | 0.079 |
| Muscle | Variable | SCI Patient | Control | % Difference | p-Value |
|---|---|---|---|---|---|
| Brachioradialis (B) | Mean (uV) | 210.10 (83.20) | 331.80 (132.00) | −36.68 | 0.015 * |
| Peak (uV) | 249.60 (102.70) | 418.80 (169.00) | −40.40 | 0.011 * | |
| CV (%) | 9.79 (2.97) | 15.89 (13.17) | −38.39 | 0.149 | |
| Biceps Brachii (BB) | Mean (uV) | 336.70 (207.20) | 428.80 (273.40) | −21.48 | 0.332 |
| Peak (uV) | 412.00 (258.80) | 554.40 (356.40) | −25.69 | 0.242 | |
| CV (%) | 11.88 (2.86) | 17.34 (11.81) | −31.49 | 0.487 | |
| Triceps Brachii (TB) | Mean (uV) | 208.70 (60.00) | 414.30 (255.30) | −49.63 | 0.015 * |
| Peak (uV) | 248.30 (69.60) | 528.20 (322.40) | −52.99 | 0.008 * | |
| CV (%) | 9.98 (1.90) | 18.64 (14.39) | −46.46 | 0.041 * |
| Muscle | Variable | SCI Patient | Control | % Difference | p-Value |
|---|---|---|---|---|---|
| Extensor carpi Radialis (ECR) | Mean (uV) | 310.50 (211.40) | 468.40 (230.80) | −33.71 | 0.122 |
| Peak (uV) | 375.90 (250.40) | 580.70 (287.00) | −35.27 | 0.098 | |
| CV (%) | 16.57 (12.34) | 15.06 (10.11) | 10.03 | 0.789 | |
| Extensor Carpi Ulnaris (ECU) | Mean (uV) | 233.40 (149.70) | 421.20 (237.40) | −44.59 | 0.022 * |
| Peak (uV) | 275.80 (160.70) | 517.70 (286.90) | −46.73 | 0.018 * | |
| CV (%) | 14.07 (13.83) | 15.24 (12.70) | −7.68 | 0.423 | |
| Flexor Carpi Radialis (FCR) | Mean (uV) | 309.10 (159.30) | 479.00 (257.50) | −35.47 | 0.117 |
| Peak (uV) | 373.40 (208.00) | 605.90 (330.60) | −38.37 | 0.113 | |
| CV (%) | 10.77 (6.59) | 16.13 (12.71) | −33.23 | 0.171 | |
| Flexor Carpi Ulnaris (FCU) | Mean (uV) | 207.60 (106.90) | 399.80 (241.60) | −48.07 | 0.015 * |
| Peak (uV) | 238.10 (122.10) | 503.40 (308.20) | −52.70 | 0.009 * | |
| CV (%) | 8.87 (2.47) | 15.96 (14.37) | −44.45 | 0.098 |
| Muscle | Variable | SCI Patient | Control | % Difference | p-Value |
|---|---|---|---|---|---|
| Extensor Digitorum Comunis (EDC) | Mean (uV) | 250.80 (150.40) | 350.70 (192.30) | −28.49 | 0.160 |
| Peak (uV) | 290.60 (160.30) | 433.20 (220.50) | −32.92 | 0.094 | |
| CV (%) | 10.28 (4.78) | 16.55 (12.41) | −37.89 | 0.219 | |
| Flexor Digitorum Superficialis (FDS) | Mean (uV) | 224.30 (119.50) | 267.40 (121.60) | −16.12 | 0.583 |
| Peak (uV) | 256.60 (122.30) | 337.60 (156.10) | −23.99 | 0.332 | |
| CV (%) | 12.41 (11.53) | 14.98 (14.92) | −17.16 | 0.306 | |
| Palmaris Longus (PL) | Mean (uV) | 428.00 (461.00) | 380.50 (257.00) | 12.48 | 0.929 |
| Peak (uV) | 528.00 (552.00) | 508.90 (323.10) | 3.75 | 0.762 | |
| CV (%) | 17.84 (13.38) | 22.60 (16.38) | −21.06 | 0.171 |
Publisher’s Note: MDPI stays neutral with regard to jurisdictional claims in published maps and institutional affiliations. |
© 2022 by the authors. Licensee MDPI, Basel, Switzerland. This article is an open access article distributed under the terms and conditions of the Creative Commons Attribution (CC BY) license (https://creativecommons.org/licenses/by/4.0/).
Share and Cite
Lee, K.-S.; Zaman, M.; Hwang, J. Reduced Muscle Activity of the Upper Extremity in Individuals with Spinal Cord Injuries. Int. J. Environ. Res. Public Health 2022, 19, 4708. https://doi.org/10.3390/ijerph19084708
Lee K-S, Zaman M, Hwang J. Reduced Muscle Activity of the Upper Extremity in Individuals with Spinal Cord Injuries. International Journal of Environmental Research and Public Health. 2022; 19(8):4708. https://doi.org/10.3390/ijerph19084708
Chicago/Turabian StyleLee, Kyung-Sun, Mobasshira Zaman, and Jaejin Hwang. 2022. "Reduced Muscle Activity of the Upper Extremity in Individuals with Spinal Cord Injuries" International Journal of Environmental Research and Public Health 19, no. 8: 4708. https://doi.org/10.3390/ijerph19084708
APA StyleLee, K.-S., Zaman, M., & Hwang, J. (2022). Reduced Muscle Activity of the Upper Extremity in Individuals with Spinal Cord Injuries. International Journal of Environmental Research and Public Health, 19(8), 4708. https://doi.org/10.3390/ijerph19084708