
Quality-of-Life Evaluation among the Oldest-Old in China under the “Active Aging Framework”


Abstract
:1. Introduction
2. Theoretical Framework and Methods
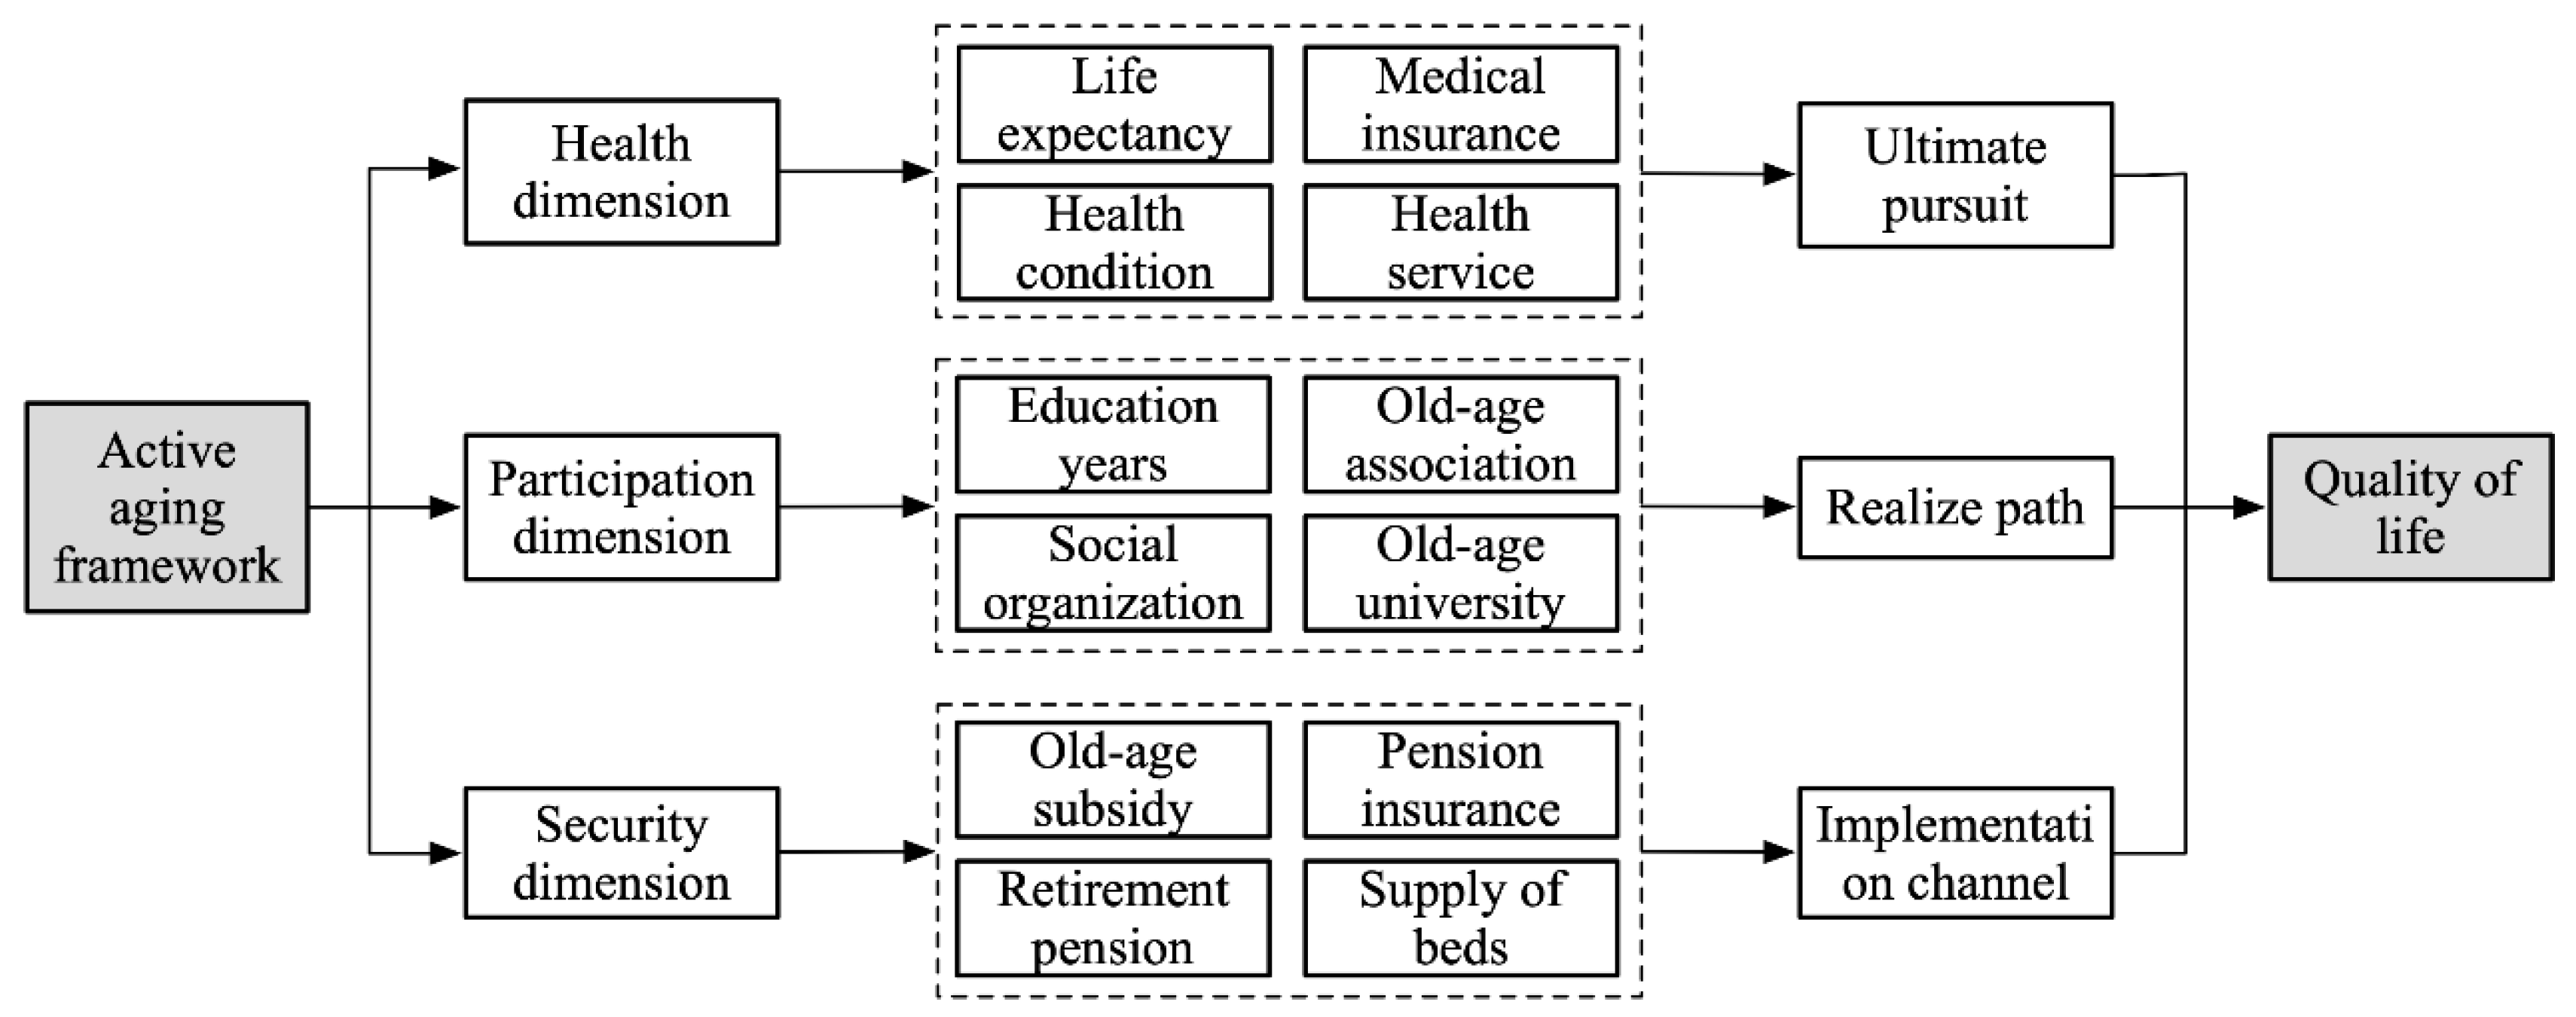
2.1. Theoretical Framework
- (1)
- Health dimension. Health means reducing the chronic diseases caused by aging to extend the time that older adults can enjoy social participation, which is a fundamental pursuit of active aging. As a sensitive indicator of the QoL of older adults, health status could not only reflect the healthy living conditions of older adults directly but could also indirectly reflect their objective living conditions and the similarities and differences in life satisfaction caused by health differences that affect their QoL and well-being later in life [18,19]. The high prevalence of disabilities and loss of life partnership make the health of the oldest-old an urgent concern. Therefore, prioritizing equal access to medical resources, timely care, nursing, and rehabilitation when self-care ability is low are universal needs among the oldest-old [18].
- (2)
- Participation dimension. Participation means that older adults participate in economic, social, cultural, and spiritual activities based on their own needs, preferences and abilities; this is the path to active aging. Social participation is an effective measure of how well older adults maintain social relationships, reshape social roles, and realize social identities [20]. “Activity Theory” and “Social Role Theory” contend that older adults who participate in social activities have higher life satisfaction and stronger social adaptability, which is beneficial to older adults in maintaining longevity and mental health in later life [21]. Studies have shown that social participation not only reduces the risk of death significantly, avoids disability before death, effectively relieves physical-function decline, reduces disease incidence, and improves health, but also can alleviate physical and mental degradation and reduce the incidence of Alzheimer’s disease, loneliness, and sense of loss [22]. At the same time, social participation is closely associated with education level. Older adults with a high level of education are more economically independent, have a lower burden of living, can calmly face and objectively analyze social and family problems, and have stronger adaptability and psychological adjustment capabilities. Older adults with higher education levels can also learn and communicate through books, newspapers, and other media and participate in activities at universities, activity centers, and associations for older adults to increase their life experience and improve their psychological well-being [23].
- (3)
- Security dimension. Security means providing timely care for older adults in need of assistance from families, communities, and society in dealing with various risks and protecting their individual rights and interests. It is the implementation channel for active aging [16]. At present, the social security system, the old age allowance, the retirement payment system, the endowment insurance system, and the minimum living security system constitute the social system to ensure the economic support of older adults in China [24]. Due to their special physical, psychological, and family social support conditions, the urgent need of the oldest-old for social security manifested in two aspects: one is the need for a pension income. The oldest-old individuals were more born before liberation, and their wage and welfare benefits were relatively low. Although the social security system has incorporated them into the system after the reform and opening up, there are still many insecure older adults in urban and rural areas [25]. The second is the demand for old-age facilities. At present, the oldest-old mainly rely on home care. With the increasing weakening of family functioning, this old-age care method rooted in traditional Chinese culture is being challenged, and diversified old-age care methods are imperative [24].
2.2. Evaluation Index System
2.3. Influencing Factors Selection and Assumptions
- (1)
- Population and family structure. The process of increasing the proportion of the oldest-old not only reflects the degree of healthy aging in the group but also the overall health status of older adults in the regions and the new longevity phenomenon [26]. This study found that before major breakthroughs in medicine, aging brought about a decline in the health of the oldest-old. Considering that China’s rapid socioeconomic development in recent years has provided the material basis for the extension of healthy life for older adults [27], we assumed that the higher the proportion of the oldest-old is, the better the QoL in a region. The old-age dependency ratio has an impact on residents’ consumption [28]. This study showed that changes in the demographic structure of a region, such as an increase in the proportion of the older adults, will increase the region’s consumption propensity for medical care, health care, and services, then improve the quality of life in the region [29]. Therefore, we assumed that the higher the old-age dependency ratio in the region is, the better the QoL. Family size is negatively associated with education and the economy significantly, and the miniaturization of family size has a positive impact on marriage and family life. At the same time, it can improve the quality of family life by reducing economic expenses. Therefore, we assumed that the smaller the average household size in the region, the better the QoL [30]. Based on the above assumptions, this paper selects the proportion of the oldest-old in older adults (POO), the old-age dependency ratio (ODR), and the average household size (AHS) to characterize the family structure of the population to analyze the impact on the QoL of the oldest-old.
- (2)
- Economic development. Per capita GDP not only reflects the level and speed of regional development, but also includes the connotation of social equality, which constitutes the material basis for the income level of residents. The proportion of the output value of the secondary and tertiary industries in GDP has the dual nature of sociology and economics. It determines the employment structure of the labor force and measures the regional economic strength, the degree of modernization, and quality of people’s livelihoods. The level of urbanization is closely associated with the quality of material life, the availability of material resources, and spiritual resources. Therefore, this study uses per capita gross domestic product (GDP), the proportion of the output value of secondary and tertiary industries in GDP (PST), and urbanization level (UL) to represent the level of economic development to analyze the impact on the QoL of the oldest-old in China. At the same time, it assumed that the per capita GDP, the proportion of output value of secondary and tertiary industries in GDP, and the urbanization level and the QoL are significantly positively associated.
- (3)
- Social security. As an important social function of the government, social security is closely associated with residents’ health. Social security enables older adults to share the fruits of economic development with dignity and realize the implementation of the quasi-pension policy [31]. Education level can reflect the state’s protection of citizens’ rights to education and has an important impact on the QoL of older adults. Considering that China’s existing social security system includes insurance, assistance, special care, and social welfare, the unemployment rate (UR) and social assistance expenditure per capita (SAE) are selected as the representations. With reference to existing research [32], the per capita years of education (AYE) is included in the social security category, and we assumed that per capita social assistance expenditure, unemployment rate, and the QoL of the oldest-old have a significant positive correlation, and per capita education level and QoL have a significant positive correlation.
2.4. Methods and Data Sources
2.4.1. Current Life Table
2.4.2. Multi-Index Comprehensive Evaluation
2.4.3. Coefficient of Variation
2.4.4. Panel Data Model
2.4.5. Data Sources
3. Results
3.1. Single-Dimensional Measurement
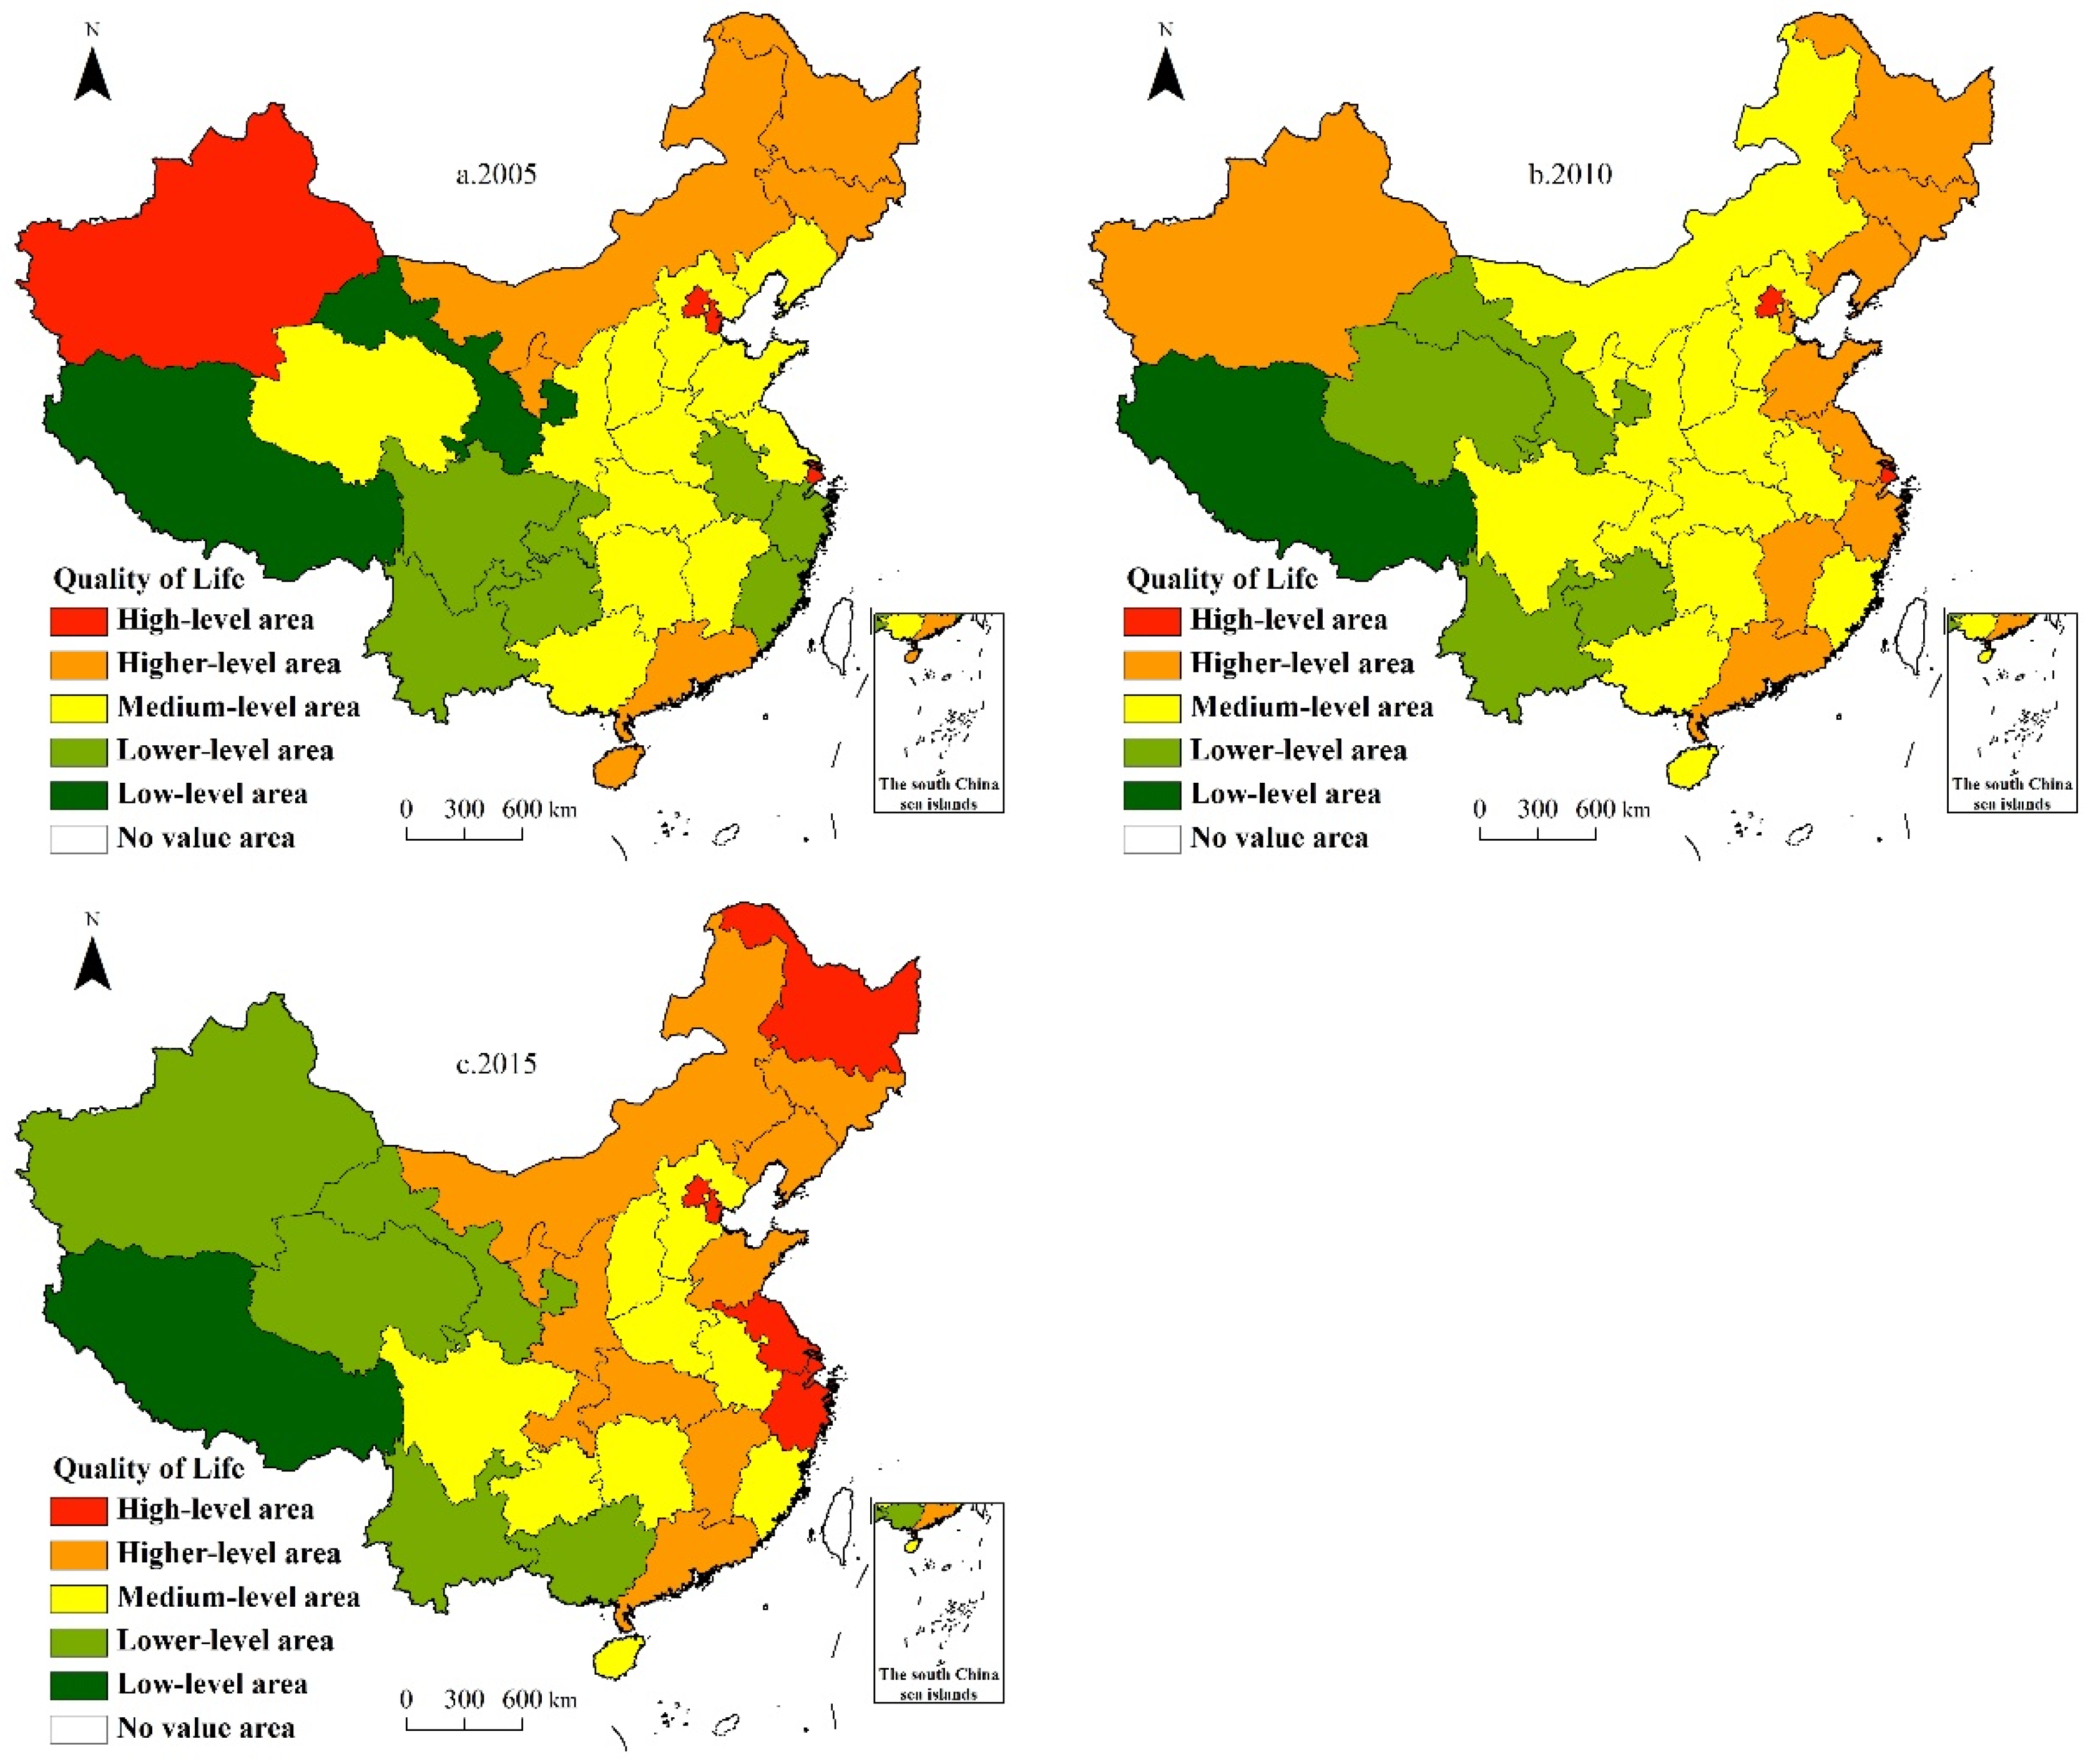
3.2. Comprehensive Measurement
3.3. Analysis of Influencing Factors
- (1)
- The old-age dependency ratio (ODR) was significantly positively associated with the QoL, which was completely consistent with our previous hypothesis. The possible reason is that the higher the old-age dependency ratio in the region, the higher the aging degree, and the regions with higher aging degree usually have better socioeconomic conditions and higher quality of laborers, which can provide more social resources, pension care services, medical facilities, improve the health and participation quality of the oldest-old, and then improve their quality of life.
- (2)
- The average household size (AHS) was significantly positively associated with the regional QoL, which was consistent with our hypothesis. Family size, as a guarantee for intergenerational economic support, life care, and spiritual comfort, is the core foundation of family care for older adults and plays an outstanding role in improving their QoL and subjective well-being [37]. The “family support theory” also contends that older adults living with their children are more likely to receive daily care and timely assistance in cases of illness or emergency [38]. However, with the implementation of the “one-child” policy, the family size in China has changed from traditional direct or joint extended families to nuclear small and empty nest families. The miniaturization of family size weakens the function of family financial support and services, and reduces the QoL and subjective well-being of older adults [39].
- (3)
- Per capita years of education (AYE) was significantly positively associated with regional QoL. Areas with higher AYE also have higher education levels for older adults, and education can promote health through two pathways. On the one hand, a higher education level means a better job and a higher income, which is conducive to improving health investment in health care and nutrition status of the older adults. On the other hand, a higher education level means stronger cognition and health awareness, and more health knowledge can be acquired through developing good living habits, thus improving the quality of life [40].
- (4)
- Per capita social assistance expenditure (SAE) was negatively associated with regional QoL, which is consistent with our hypothesis. The possible reason lies in the fact that the current level of social assistance in China is generally low, and the assistance standards lack uniformity and standardization. The oldest-old, especially the poor, disabled, and sick, face a lack of material life information, daily care and nursing, and targeted service aid measures [41]. In addition, older adults are a socially disadvantaged group. The provision of social assistance increases the psychological burden on the oldest-old to a certain extent, widens the gap between them and other populations, and hinders the improvement of their QoL.
- (5)
- Contrary to our previous assumptions, the proportion of the oldest-old in the older adults (POO) and the proportion of the output value of secondary and tertiary industries in GDP (PST) were significantly negatively correlated with the QoL. ① For the POO, one possible reason is that the health, participation, and security development levels that constitute the improvement of QoL are not in harmony with the growth of the number of the oldest-old. The social medical security, endowment insurance, health services, old-age subsidies, and infrastructure for community activities for the oldest-old are insufficient to meet the basic needs of the growing number of the oldest-old. Take the regional old-age subsidy as an example. In 2015, the proportion of the oldest-old in the eastern region was higher than that in the western region, but the standardized average of the old-age subsidy coverage rate (1.288) lagged behind that of the western region (2.860). This was mainly because the poverty problem in the western region was more severe than that in other regions; thus, the old-age subsidy, which was a welfare program for the oldest-old, played a more important role in poverty relief in the western region, and the age restrictions were more relaxed [42]. For example, Shaanxi and Qinghai provinces, where the coverage rate of the old-age subsidy exceeds 100%, target individuals aged 70 and above. In terms of people’s livelihoods, the old-age subsidy system has become the primary choice for western provinces to enhance their competitiveness, and the state has corresponding policy preferences for these areas [42]. ② For the PST, the secondary and tertiary industries are usually used to measure the overall economic strength and modernization degree of a region, reflecting society’s ability to absorb employment. However, in the context of the miniaturization of the family, the huge supply gap in the social pension service industry, and the extent of the domestic service industry, the secondary and tertiary industries result in a lack of care resources or an insufficient supply of care services for the offspring of families. The old-age care service industry is an emerging industry formed by the needs of older adults in the consumption market. It is still in its infancy, stagnating in terms of pension economic sources, service providers, service content, and level of care, especially in the developed eastern regions where the oldest-old population is growing rapidly. How to balance and coordinate the contradiction between the old-age service industry and the growing demand of the oldest-old has become an important concern for protecting people’s livelihoods in the new era.
4. Conclusions and Discussion
Author Contributions
Funding
Institutional Review Board Statement
Informed Consent Statement
Data Availability Statement
Conflicts of Interest
References
- Yao, Y. An innovative achievement in the study of quality of life for the elderly in China: On the blue book of ageing development report on the quality of life for the elderly in China. Sci. Res. Aging 2020, 8, 13–17. [Google Scholar]
- Luo, X.; Li, J. Quality of life index of elderly in China and its regional differences. Sci. Res. Ageing 2020, 8, 24–37. [Google Scholar]
- United Nations Department of Economic and Social Affairs (UN DESA). World Population Prospects: The 2012 Revision. Volume II: Demographic Profiles; UN DESA, Population Division: New York, NY, USA, 2013; Available online: https://www.un.org/zh/node/89721 (accessed on 17 June 2013).
- Ćwirlej-Sozańska, A.B.; Wiśniowska-Szurlej, A.; Wilmowska-Pietruszyńska, A.; Sozański, B. Factors associated with disability and quality of life among the oldest-old living in community in Poland—A cross-sectional study. Ann. Agric. Environ. Med. 2020, 27, 621–629. [Google Scholar] [CrossRef]
- Galbraith, J.K. The Affluent Society; Houghton Mifflin: Boston, MA, USA, 1976. [Google Scholar]
- Lawton, M.P. Spatial Behavior of Older People. In Ecology and Aging; Pastalan, L.A., Carson, D.H., Eds.; Institute of Gerontology, University of Michigan: Ann Arbor, MI, USA, 1970. [Google Scholar]
- Ware, J.E.; Gandek, B. Overview of the SF-36 Health Survey and the International Quality of Life Assessment (IQOLA) Project. J. Clin. Epidemiol. 1998, 51, 903–912. [Google Scholar] [CrossRef]
- Lawton, M.P. Environment and other determinants of well-being in older people. Gerontologist 1983, 23, 349–357. [Google Scholar] [CrossRef] [PubMed]
- Maridal, J.H. A worldwide measure of societal quality of life. Soc. Indic. Res. 2018, 134, 1–38. [Google Scholar] [CrossRef]
- Vo, N.X.; Vo, T.Q.; Watanapongvanich, S.; Witvorapong, N. Measurement and determinants of quality of life of older adults in Ho Chi Minh City, Vietnam. Soc. Indic. Res. 2019, 142, 1285–1303. [Google Scholar] [CrossRef]
- Hussenoeder, F.S.; Conrad, I.; Roehr, S.; Fuchs, A.; Pentzek, M.; Bickel, H.; Moesch, E.; Weyerer, S.; Werle, J.; Wiese, B.; et al. Mild cognitive impairment and quality of life in the oldest old: A closer look. Qual. Life Res. 2020, 29, 1675–1683. [Google Scholar] [CrossRef] [Green Version]
- Song, H.J.; Park, S.; Kwon, J.W. Quality of life of middle-aged adults in single households in South Korea. Qual. Life Res. 2018, 27, 2117–2125. [Google Scholar] [CrossRef]
- Li, D.; Chen, T.; Wu, Z. Quality of life and satisfaction of senior citizens in China from 1998 to 2005. Chin. J. Gerontol. 2008, 19, 1943–1945. [Google Scholar]
- Wu, X.; Xu, Q. An analysis on the Basic physical function of the oldest-old in China. Chin. J. Popul. Sci. 2004, Suppl. 1, 107–112, 178. [Google Scholar]
- Xu, X.; Zhao, Y.; Xia, S.; Cui, P.; Tang, W.; Hu, X.; Wu, B. Quality of life and its associated factors among centenarians in Nanjing, China: A cross-sectional study. Soc. Indic. Res. 2020, 14, 735–755. [Google Scholar] [CrossRef]
- World Health Organization. Policy Framework for Active Ageing; Hualing Press: Beijing, China, 2003. [Google Scholar]
- Hu, H.; Li, Y.; Zhang, C.; Zhang, J. Participation of social activities, health promotion and disability prevention: Emipirical Analysis based on active ageing structure. Chin. J. Popul. Sci. 2017, 4, 87–96+128. [Google Scholar]
- Wu, C. To improve scientific understanding of the quality of life of the elderly. Popul. Res. 2002, 5, 1–5. [Google Scholar]
- Naidoo, Y. A Multi-dimensional individual well-being framework: With an application to older Australians. Soc. Indic. Res. 2019, 146, 581–608. [Google Scholar] [CrossRef]
- Xie, L.; Wang, B. Social participation profile of the Chinese elderly in the context of active ageing: Patterns and determinants. Popul. Res. 2019, 43, 17–30. [Google Scholar]
- Li, W.; Hu, H.; Li, S.; Xia, L. Social activities and health promotion of the elderly: A survey based on tracking data from 2005 to 2014. Popul. Dev. 2018, 24, 90–100. [Google Scholar]
- Yang, H.; Xiang, Y. Analysis on factors of the elderly social participation in rural Zhejiang. Zhejiang Soc. Sci. 2014, 11, 147–152, 160. [Google Scholar]
- Zhang, Y.; Zhang, H.; Gao, F.; Cen, A.; Zhang, L. Social participation and quality of life of the elderly in Ningbo. Chin. J. Gerontol. 2016, 36, 4085–4087. [Google Scholar]
- Chen, T. Current situation, problems and countermeasures of economic and medical security of the elderly. Mod. Econ. Inf. 2016, 5, 146–148. [Google Scholar]
- Liu, X.; Tang, J. Social security of the elderly in China. Chin. Public Adm. 2011, 6, 20–23. [Google Scholar]
- Zeng, Y. A Review on International Trends in Interdisciplinary Research of Factors Affecting Health Aging; Science China Press: Berjing, China, 2011; Volume 56, pp. 2929–2940. [Google Scholar]
- Wu, C.; Jiang, X. On the strategy of “Health Aging”. Soc. Sci. China. 1996, 5, 52–64. [Google Scholar]
- Wang, H.; Huang, J. An empirical study on the relationship between population age structure and household consumption in Urban and rural China. Popul. Econ. 2015, 2, 11–20. [Google Scholar]
- Modigliani, F.; Brumberg, R. Utility analysis and the consumption function: An interpretation of cross-section data. J. Post Keynes. Econ. 1954, 1, 388–436. [Google Scholar]
- Yan, Z.; Hou, M.; Bai, T. The Changes and characteristics of household size in Guangdong. South China Popul. 2015, 30, 1–10. [Google Scholar]
- Liu, H. Regional differences in social security expenditure and quality of life of the aged. J. Macro-Qual. Res. 2018, 7, 73–86. [Google Scholar]
- Xiang, Y.; Hu, T. Social security expenditure and quality of life of the elderly population. J. Macro-Qual. Res. 2020, 8, 31. [Google Scholar]
- Chen, Q.; Wang, F.; Li, X.; Yang, J.; Yu, S.; Hu, J. Construction of abridged life table for health evaluation of local resident using Excel program. J. South. Med. Univ. 2012, 32, 627–630. [Google Scholar]
- Li, H.; Li, X.; Tian, S.; Li, S.; Zhao, P. Temporal and spatial variation characteristics and mechanism of urban human settlement: Case study of Liaoning province. Geogr. Res. 2017, 36, 1323–1338. [Google Scholar]
- Yu, G.; Li, J.; Sun, J.; Shen, P.; Yang, C. Research on BMI influencing factors of urban male adolescents in China based on geographical detector. Geogr. Res. 2019, 38, 2288–2301. [Google Scholar]
- Yang, J. Data Management and Model Anlysis; China Renmin Univeristy Press: Beijing, China, 2012. [Google Scholar]
- Wei, Q.; Su, H.; Lv, J.; Yao, J.; Jin, C. Research on the influence of family size, social support, health status on the subjective well-being of rural elderly women. Northwest Popul. 2020, 41, 106–115. [Google Scholar]
- Logan, J.R.; Bian, F.; Bian, Y. Tradition and change in the urban Chinese family: The case of living arrangements. Soc. Forces 1998, 76, 851–882. [Google Scholar] [CrossRef]
- Li, M. Living arrangement of China’s widowed elderly and its quality of life: Based on the 4th survey on the living conditions of China’s urban and rural older persons. Northwest Popul. 2019, 40, 93–103. [Google Scholar]
- Muszalik, M.; Dijkstra, A.; Kędziora-Kornatowska, K.; Zielińska-Więczkowska, H.; Kornatowski, T. Independence of elderly patients with arterial hypertension in fulfilling their needs, in the aspect of functional assessment and quality of life (QoL). Arch. Gerontol. Geriatr. 2011, 52, 204–209. [Google Scholar] [CrossRef] [PubMed]
- Chen, Y.; Miao, G. Poverty and social assistance for the ages. Shandong Soc. Sci. 2015, 7, 104–113. [Google Scholar]
- Yang, L.; Ning, Y. Study on the differences in the development level of China’s pension security-An empirical analysis based on the panel data 2011. Stud. Soc. Chin. Charact. 2013, 4, 81–87. [Google Scholar]
- Leopold, L.; Engelhartdt, H. Education and physical health trajectories in old age. Evidence from the Survey of Health, Ageing and Retirement in Europe (SHARE). Int. J. Public Health 2013, 58, 23–31. [Google Scholar] [CrossRef] [Green Version]
- Yu, X.; Sun, Y. The model of “internet + old-age service”: The innovative development of old-age service in new era. Popul. J. 2017, 39, 58–66. [Google Scholar]


| Target Layer (A) | Criterion Layer (B) | Index Layer (C) | Unit | Index Nature | Symbol |
|---|---|---|---|---|---|
| Quality of life (A) | Health dimension (B1) | C1: The average life expectancy | Year | Positive | ALE |
| C2: The disability rate of older adults | % | Negative | DR | ||
| C3: The spouse rate of older adults | % | Positive | SR | ||
| C4: The participation rate of the basic medical insurance for urban employees | % | Positive | UBMI | ||
| C5: The number of medical and health technical personnel per 100 oldest-old | People | Positive | PMHT | ||
| Participation dimension (B2) | C6: The average years of education of older adults | Year | Positive | AYE | |
| C7: The number of old-age activity centers per 1000 older adults | % | Positive | SAC | ||
| C8: The number of old-age organizations per 1000 older adults | % | Positive | OAO | ||
| C9: The number of geriatric associations per 10,000 older adults | Number | Positive | OAA | ||
| C10: The old-age school enrollment rate of older adults | % | Positive | OAS | ||
| Security dimension (B3) | C11: The old-age subsidy coverage rate | % | Positive | OSC | |
| C12: The coverage rate of older adults’ retirement pension 1 | % | Positive | PCR | ||
| C13: The urban pension insurance participation rate | % | Positive | UBPI | ||
| C14: The number of old-age service beds per 1000 older adults | Number | Positive | BOC | ||
| C15: The urban employees’ basic pension insurance benefits | 10,000 RMB | Positive | BPB | ||
| C16: The socialized pension payment rate 2 | % | Positive | SPP |
| Health Quality (%) | Participation Quality (%) | Security Quality (%) | |||||||
|---|---|---|---|---|---|---|---|---|---|
| 2005 | 2010 | 2015 | 2005 | 2010 | 2015 | 2005 | 2010 | 2015 | |
| National | 1.26 | 1.24 | 1.23 | 1.56 | 1.44 | 1.52 | 1.86 | 1.58 | 1.53 |
| East | 1.19 | 1.16 | 1.15 | 1.34 | 1.28 | 1.35 | 1.52 | 1.45 | 1.41 |
| Central | 1.18 | 1.21 | 1.18 | 1.61 | 1.43 | 1.49 | 1.83 | 1.21 | 1.32 |
| West | 1.33 | 1.30 | 1.32 | 1.72 | 1.58 | 1.77 | 1.73 | 1.55 | 1.64 |
| Northeast | 1.21 | 1.14 | 1.14 | 1.34 | 1.33 | 1.42 | 1.85 | 1.65 | 1.48 |
| Year | National Average | Maximum | Minimum | Eastern Average | Central Average | Western Average | Northeast Average |
|---|---|---|---|---|---|---|---|
| 2005 | 0.5595 | 0.8662 (Shanghai) | 0.1521 (Tibet) | 0.6395 | 0.6705 | 0.5414 | 0.5637 |
| 2010 | 0.5704 | 0.8147 (Beijing) | 0.1163 (Tibet) | 0.6626 | 0.6552 | 0.5226 | 0.6450 |
| 2015 | 0.5833 | 0.7943 (Beijing) | 0.0804 (Tibet) | 0.6715 | 0.6649 | 0.5220 | 0.6456 |
| Variables | Coefficient | Standard Error | T Value | p Value | 95% Confidence Interval |
|---|---|---|---|---|---|
| Constant | −0.283 | 0.372 | −0.76 | 0.450 | [−1.028, 0.462] |
| POO | −0.013 *** | 0.004 | −3.61 | 0.001 | [−0.020, −0.006] |
| ODR | 0.022 *** | 0.007 | 3.15 | 0.003 | [0.008, 0.035] |
| AHS | 0.105 * | 0.059 | 1.79 | 0.080 | [−0.013, 0.224] |
| lnGDP | −0.060 | 0.052 | −1.16 | 0.253 | [−0.163, 0.044] |
| PST | −0.005 ** | 0.003 | −2.12 | 0.038 | [−0.011, 0.000] |
| UL | 0.005 | 0.003 | 1.36 | 0.179 | [−0.002, 0.011] |
| UR | −0.021 | 0.019 | −1.06 | 0.295 | [−0.060, 0.018] |
| AYE | 0.163 *** | 0.039 | 4.17 | 0.000 | [0.085, 0.242] |
| SAE | −0.001 ** | 0.000 | −2.06 | 0.044 | [−0.001, 0.000] |
| Mean dependent var | 0.571 | SD dependent var | 0.137 | ||
| R-squared | 0.483 | Number of obs | 93.000 | ||
| F-test | 5.495 | Prob > F | 0.000 | ||
| Akaike crit. (AIC) | −332.960 | Bayesian crit. (BIC) | −307.634 | ||
Publisher’s Note: MDPI stays neutral with regard to jurisdictional claims in published maps and institutional affiliations. |
© 2022 by the authors. Licensee MDPI, Basel, Switzerland. This article is an open access article distributed under the terms and conditions of the Creative Commons Attribution (CC BY) license (https://creativecommons.org/licenses/by/4.0/).
Share and Cite
Xu, X.; Zhao, Y.; Zhou, J.; Xia, S. Quality-of-Life Evaluation among the Oldest-Old in China under the “Active Aging Framework”. Int. J. Environ. Res. Public Health 2022, 19, 4572. https://doi.org/10.3390/ijerph19084572
Xu X, Zhao Y, Zhou J, Xia S. Quality-of-Life Evaluation among the Oldest-Old in China under the “Active Aging Framework”. International Journal of Environmental Research and Public Health. 2022; 19(8):4572. https://doi.org/10.3390/ijerph19084572
Chicago/Turabian StyleXu, Xin, Yuan Zhao, Jianfang Zhou, and Siyou Xia. 2022. "Quality-of-Life Evaluation among the Oldest-Old in China under the “Active Aging Framework”" International Journal of Environmental Research and Public Health 19, no. 8: 4572. https://doi.org/10.3390/ijerph19084572
APA StyleXu, X., Zhao, Y., Zhou, J., & Xia, S. (2022). Quality-of-Life Evaluation among the Oldest-Old in China under the “Active Aging Framework”. International Journal of Environmental Research and Public Health, 19(8), 4572. https://doi.org/10.3390/ijerph19084572