Abstract
Secondhand smoke (SHS) exposure remains a major public health concern in the United States. Homes have become the primary source of SHS exposure, with elevated risks for residents of multiunit housing. Though this differential risk is well-documented, little is known about whether SHS exposure varies by floor height. The aim of this study was to examine whether SHS accumulates in higher floors of multiunit housing. Using validated passive nicotine sampling monitors, we sampled air nicotine concentrations on multiple floors of 21 high-rise (>15 floors) buildings in New York City. Within the buildings, measurements were collected in three locations: non-smoking individual apartments, hallways and stairwells. Measurements were collected in two winter and two summer waves to account for potential seasonality effects. We analyzed the percent of filters with detectable nicotine and quantified nicotine concentration (µg/m3). Higher floor levels were positively associated with both airborne nicotine measures, with some variation by location and season observed. In winter, the trends were statistically significant in apartments (floors ≤7: 0.022 µg/m3; floors 8–14: 0.026 µg/m3; floors ≥15: 0.029 µg/m3; p = 0.011) and stairwells (floors ≤7: 0.18 µg/m3; floors 8–14: 0.19 µg/m3; floors ≥15: 0.59 µg/m3; p = 0.006). These findings can inform interventions to mitigate the SHS exposure of residents in multiunit housing.
1. Introduction
In the decades since the landmark 1964 Surgeon General report on smoking and health, smoking prevalence among adults in the United States (U.S.) has steadily declined, from more than 40% of U.S. adults in the 1960s to less than 20% in 2018 [1]. Despite this progress, tobacco smoke remains the leading cause of preventable death in the U.S., with secondhand smoke (SHS) exposure accounting for up to 41,000 deaths annually [2,3].
Smoke-free policies have been highly effective in reducing SHS exposure in public settings, such as bars and restaurants [3]. As a result, the home environment is now the major source of SHS exposure. Residents of multiunit housing (MUH) are especially at risk, as smoke can travel between individual residences and building common spaces [4]. A nationwide survey of U.S. adults revealed that 34.4% of MUH residents living in smoke-free homes still experience SHS incursions from sources outside of their own units [5].
Ventilation is a major factor in how SHS moves throughout MUH. Buildings are ventilated by natural air exchange (which results from pressure differences and air buoyancy), infiltration (uncontrolled airflow through cracks and leaks of the building) and mechanical ventilation (i.e., fans) [6]. These modes of air distribution create pockets of varying pressure and temperature, which in turn cause air to flow between and within the spaces of the building. Included in this is a phenomenon called the stack effect, wherein temperature differentials move air vertically inside the building: warm air rises, creating a powerful upward-flowing current [7,8,9].
Although there is an abundance of research on the stack effect and other vertical airflow phenomena in MUH, as well as an abundance of research on SHS exposure in MUH, studies examining whether SHS exposure risk increases at higher floor levels in MUH are lacking [4,5,6,7,8,9,10,11,12,13,14,15,16,17]. Tobacco smoke (a mixture of gases and particulate matter) is able to travel along surrounding airflows and generally rises, being warmer than the surrounding air [7,8,9]. In this brief analysis, we leveraged a large, longitudinal dataset of indoor air nicotine concentration data collected as part of a quasi-experimental study in 21 high-rise buildings (>15 floors) in New York City, to investigate whether SHS accumulates by floor.
2. Materials and Methods
2.1. Study Population
We selected a sample of 21 high-rise (>15 floors) buildings in New York City (NYC), comprised of 10 NYC Housing Authority (NYCHA) buildings and 11 private sector buildings which consisted of affordable or rent-assisted housing matched on population demographics. The buildings ranged from 21 to 44 stories high. The study protocol and procedures have been described elsewhere [18].
2.2. Air Nicotine Concentration
To measure airborne nicotine, we used passive bisulfate-coated filters which have been validated by previous studies as a low-cost, accurate method for quantifying environmental tobacco smoke [18,19]. Research staff placed filters in three different settings throughout the buildings: the individual apartments of non-smoking households, as well as building hallways and stairwells. The placement guidelines were uniform across the three settings and dictated that the filters be placed 1–2 m from the floor and at least 1 m away from a window or ventilation system, while also avoiding ‘dead zones’ such as corners [18]. As a quality control measure, we deployed duplicate filters for 2% of our samples. Duplicates were placed next to sample filters for the duration of the collection period, and their results were then compared against those of the sample filters to measure the uncertainty of our method. Four waves of data were collected in total, with two summer (April–September, 2018–2019) and two winter (December–March, 2018–2020) waves to account for potential seasonal influence. The filters were prepared and analyzed at Johns Hopkins University Bloomberg School of Public Health using the school’s Secondhand Smoke Exposure Assessment Laboratory standard operating procedures. The nicotine limit of detection (LOD) for the filters was 0.017 µg/m3 [20].
2.3. Data Analysis
Air nicotine concentrations were calculated using geometric means, and the percentage of filters with detectable nicotine were estimated using the LOD. We used descriptive statistics to characterize nicotine exposure stratified by floor groupings, which consisted of floors 7 and lower, floors 8 through 14, and floors 15 and above. Floor groupings were chosen using NYC building code, which defines a high-rise as having occupied floors more than 75 feet above street level, or roughly 7 floors. Differences between floor groupings were compared using a chi-square test of independence or a one-way analysis of variance. Last, we performed a sensitivity analysis using simple linear regression to determine if floor height was a significant predictor of nicotine concentration. A regression coefficient and coefficient of determination, or R2, were calculated for each unit type and season. All estimates were configured to be statistically significant (p < 0.05). Analyses were conducted on Stata 16.1. (StataCorp LLC, College Station, TX, USA).
3. Results
A total of 1198 measurements were collected over the study period. Table 1 presents the resultant nicotine concentrations across different floor groups for each unit setting (non-smoking apartments, stairwells and hallways) and season. A comparison of nicotine concentration across the floor groups showed some significant differences. As floor height increased, apartments in winter showed an increase in both nicotine concentration (floors ≤7: 0.022 µg/m3 (95% CI, 0.019–0.025); floors 8–14: 0.026 µg/m3 (95% CI, 0.022–0.031); floors ≥15: 0.029 µg/m3 [95% CI, 0.025–0.033] p = 0.011) and the proportion of filters with detectable nicotine (floors ≤7: 14.6%; floors 8–14: 21.9%; floors ≥15: 28.3%, p = 0.041) (Table 1). Stairwells followed the same general trend for both summer and winter. Stairwells in summer showed an increase in nicotine concentration across the three floor groups (0.13 µg/m3 (95% CI 0.05–0.35), 0.28 µg/m3 (95% CI 0.17–0.45), and 0.35 µg/m3 (95% CI 0.23–0.512), p = 0.203 from lowest to highest, respectively). The proportion of filters with detectable nicotine also increased in tandem with floor height (72.7%, 89.5%, 96.9%, p = 0.067). Stairwells in winter followed the same trend for nicotine concentration (0.18 (95% CI 0.06–0.53), 0.19 (95% CI 0.11–0.33), 0.59 (95% CI 0.37–0.93), p = 0.006), though filters above LOD did show a slight dip in the second highest floor group (80%, 75.7%, 93.3%, p = 0.153). For hallways, there was no discernible pattern in geometric means, and similarly the proportion of filters with detectable nicotine did not follow any particular trend, irrespective of season. The trends remained similar when aggregated by season (Table S1).

Table 1.
Descriptive statistics.
Despite these trends, the R2 was quite low for all locations and seasons (Table 2). In addition, the measurement of geometric means did yield high variability, in some cases having ranges from the LOD (0.017 µg/m3) to 5.903 µg/m3, as with the winter stairwell results (Figure 1). Last, the coefficient of variation generated using our duplicate sample results indicated only 8% variability, suggesting that the results from filters were reliable.
Table 2.
Sensitivity Analysis Based on Coefficient of Determination.
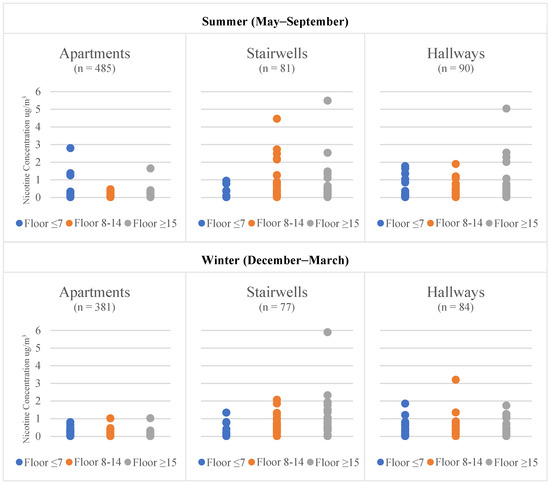
Figure 1.
Variance in Air Nicotine Concentration by Location and Season.
4. Discussion
To the best of our knowledge, this is the first study examining the effect of floor height on airborne nicotine concentration in high-rise MUH. As per the literature, we expected to see an accumulation of nicotine in higher levels of the buildings, given that nicotine is expelled in both the gaseous and particle phases of secondhand cigarette smoke and has an ability to ride prevailing airflow, which moves vertically throughout high-rise buildings [7,9,10].
The fact that we saw some evidence of this effect, specifically in apartments and stairwells, could be a true indication of a rise in SHS with increasing floor level. That the trends were mostly consistent across two different measurements, both concentration and the presence of airborne nicotine, adds credibility. Where trends in SHS were seen, the results were often significant or nearly significant. In addition, based on our assessment of the variability of the findings compared to the duplicate filters, we have confidence that the results reflect true differences. Finally, our nicotine concentrations were in line with those seen in similar settings using comparable methods of measurement, as was our more general finding that SHS exposure is building-wide, including non-smoking homes and especially in building common areas [11,12].
Other studies examining air flow in MUH have implicated doors as the primary source of air transfer within buildings [4,10]. McKeen and Liao demonstrated that hallways in particular contain myriad sources of leakage as a result of their proximity to both individual units and building shafts, and that corridor air flow is highly variable depending on ever-shifting pressure differentials within the building, airtightness, and outside temperature [10]. These factors may explain why we did not see a discernible pattern among our sample hallways, which had exposure to at least twelve apartment unit doors, two stairwells, and two elevators, and occasionally direct exposure to the outdoors in the form of windows or terraces.
Regarding seasonality and airborne nicotine, our findings were mostly consistent with those of previous literature. In the winter months, the stack effect within buildings becomes more pronounced as the temperature divergence between the inside and outside of the building is increased [9,10]. To that end, we expected to see more pronounced trends in the winter wave of our data collection, as was the case in our apartment results, which showed a pattern of increasing concentration with floor height in winter, as well as stairwells, where the increase in airborne nicotine concentration was statistically significant. However, due to the increased likelihood that smokers choose to stay indoors to smoke, as well as decreased ventilation with the outdoors, we expected to see increased concentrations in the winter months, which, apart from a modest increase seen in apartments, did not clearly appear in our data [10,11,13,14]. In the summer months, the use of air conditioners can create a reverse stack effect wherein air flows downward through the building. Though less powerful than the normal stack effect, the reverse stack is also a result of temperature differences between the inside and outside air [9,15]. As none of our study sites had building-wide cooling systems, it is possible that the reverse stack would primarily affect apartments where air conditioners were located. This may explain why a clear trend existed in our winter apartment results, but not in summer.
Despite our results, we cannot completely disregard the possibility of chance in the effect of floor height on airborne nicotine concentration, especially when considering the R2 seen in the sensitivity analysis. Possible sources of obfuscation include the sample sizes and the variation in measurements. Though the overall study had a large sample size, the number decreased when divided into categories, as can be seen for stairwells and hallways. Moreover, the within-category variation was quite large in some cases.
SHS transfer is dependent on many variables, including building ventilation, the built environment, the outside environment, and human behavior. One limitation of this study is that we did not have background information or data for these extraneous variables that may confound or otherwise affect measurements. An additional limitation of the study could be that the specific selection of buildings and settings (e.g., urban and restricted to U.S.) may mean that the results are not generalizable. The strengths of our study include the use of validated passive nicotine filters to measure airborne nicotine, allowing for a reliable, objective measure of SHS [21,22]. In addition, we examined exposure in multiple buildings, as well as multiple settings within those buildings, allowing for a large and varied sample.
5. Conclusions
Our investigation into the relationship between floor height and SHS exposure in high-rise MUH found evidence of the accumulation of SHS at higher floors. We also saw high levels of SHS exposure in common areas overall. Further studies are needed to confirm the varying risk of SHS exposure in high-rise settings and to evaluate whether this exposure can be mitigated. While strategies to reduce SHS incursions in occupied buildings exist, these treatments are imperfect, logistically difficult and costly, thus severely limiting their feasibility in low-funding contexts such as public housing [16,17]. Given the demonstrable risk of SHS exposure in MUH and in high-rises in particular, the importance of smoke-free housing (SFH) policies is quite clear. Until recently, SFH policies remained largely a voluntary option for building managers, with few examples of enacted policies at the state, local or federal level [23]. In 2018, the U.S. Department of Housing and Urban Development implemented a rule requiring all public housing authorities (PHAs) to implement smoke-free housing policies. Studies are ongoing to document the protective effect these rules have on PHA residents, a population that is at disproportionate risk of SHS exposure due to socioeconomic factors and their residence within MUH.
Supplementary Materials
The following are available online at https://www.mdpi.com/article/10.3390/ijerph19073794/s1: Table S1: Nicotine Concentration, 21 Low-Income High-Rise Buildings, Aggregated by Season.
Author Contributions
Conceptualization, E.G., D.S., A.R., L.E.T. and T.G.; data curation, E.A. and R.C.; formal analysis, E.G. and E.A.; funding acquisition, D.S. and L.E.T.; investigation, E.G., E.A. and A.T.; methodology, D.S., A.R., L.E.T. and T.G.; project administration, E.A., A.T.; resources, A.R., R.C. and T.G.; supervision, D.S., L.E.T. and T.G.; validation, E.A., A.T., A.R. and T.G.; visualization, E.G.; writing—original draft preparation, E.G.; writing—review and editing, E.G., E.A., A.T., D.S., A.R., R.C., L.E.T. and T.G. All authors have read and agreed to the published version of the manuscript.
Funding
This study was funded by the National Cancer Institute (NCI) at the National Institutes of Health (R01CA220591). NCI played no role in study design, data collection and analysis, manuscript writing, or the decision to submit the paper for publication.
Institutional Review Board Statement
The study was approved by New York University Grossman School of Medicine’s Institutional Review Board (IRB number: i17–00968).
Informed Consent Statement
Informed consent from participants was obtained prior to conducting the study.
Data Availability Statement
The data that support the findings of this study are available from the corresponding author upon reasonable request.
Conflicts of Interest
The authors declare no potential conflict of interest with respect to the research, authorship, and publication of this article.
References
- Cornelius, M.E.; Wang, T.W.; Jamal, A.; Loretan, C.G.; Neff, L.J. Tobacco Product Use Among Adults—United States, 2019. MMWR Morb. Mortal Wkly. Rep. 2020, 69, 1736–1742. [Google Scholar] [CrossRef] [PubMed]
- Homa, D.M.; Neff, L.J.; King, B.A.; Caraballo, R.S.; Bunnell, R.E.; Babb, S.D.; Garrett, B.E.; Sosnoff, C.S.; Wang, L. Vital signs: Disparities in nonsmokers’ exposure to secondhand smoke--United States, 1999–2012. MMWR Morb. Mortal Wkly. Rep. 2015, 64, 103–108. [Google Scholar] [PubMed]
- National Center for Chronic Disease Prevention and Health Promotion (US) Office on Smoking and Health. The Health Consequences of Smoking—50 Years of Progress: A Report of the Surgeon General. In Reports of the Surgeon General; Centers for Disease Control and Prevention: Atlanta, GA, USA, 2014. [Google Scholar]
- King, B.A.; Travers, M.J.; Cummings, K.M.; Mahoney, M.C.; Hyland, A.J. Secondhand smoke transfer in multiunit housing. Nicotine Tob. Res. 2010, 12, 1133–1141. [Google Scholar] [CrossRef] [PubMed]
- Nguyen, K.H.; Gomez, Y.; Homa, D.M.; King, B.A. Tobacco Use, Secondhand Smoke, and Smoke-Free Home Rules in Multiunit Housing. Am. J. Prev. Med. 2016, 51, 682–692. [Google Scholar] [CrossRef] [PubMed] [Green Version]
- Liu, D.-L.; Nazaroff, W.W. Particle Penetration Through Building Cracks. Aerosol Sci. Technol. 2003, 37, 565–573. [Google Scholar] [CrossRef] [Green Version]
- Ahn, C.-S.; Kim, D.-Y.; Park, C.; Kim, M.-W.; Kim, T.; Bang, B.-H.; An, S.; Yarin, A.L.; Yoon, S.S. Experimental and numerical study of smoke behavior in high-rise stairwells with open and closed windows. Int. J. Therm. Sci. 2020, 157, 106500. [Google Scholar] [CrossRef]
- Ricketts, L. A Field Study of Airflow in a High-Rise Multi-Unit Residential Building. UWSpace 2014. Available online: http://hdl.handle.net/10012/8190 (accessed on 15 June 2021).
- Bilyaz, S.; Buffington, T.; Ezekoye, O.A. The effect of fire location and the reverse stack on fire smoke transport in high-rise buildings. Fire Saf. J. 2021, 126, 103446. [Google Scholar] [CrossRef]
- McKeen, P.; Liao, Z. The influence of airtightness on contaminant spread in MURBs in cold climates. Build Simul. 2021, 15, 1–16. [Google Scholar] [CrossRef] [PubMed]
- Arku, R.E.; Adamkiewicz, G.; Vallarino, J.; Spengler, J.D.; Levy, D.E. Seasonal variability in environmental tobacco smoke exposure in public housing developments. Indoor Air 2015, 25, 13–20. [Google Scholar] [CrossRef] [PubMed] [Green Version]
- Russo, E.T.; Hulse, T.E.; Adamkiewicz, G.; Levy, D.E.; Bethune, L.; Kane, J.; Reid, M.; Shah, S.N. Comparison of indoor air quality in smoke-permitted and smoke-free multiunit housing: Findings from the Boston Housing Authority. Nicotine Tob. Res. 2015, 17, 316–322. [Google Scholar] [CrossRef] [PubMed] [Green Version]
- Zota, A.; Adamkiewicz, G.; Levy, J.I.; Spengler, J.D. Ventilation in public housing: Implications for indoor nitrogen dioxide concentrations. Indoor Air 2005, 15, 393–401. [Google Scholar] [CrossRef] [PubMed]
- Kaufman, P.; Zhang, B.; Bondy, S.J.; Klepeis, N.; Ferrence, R. Not just ‘a few wisps’: Real-time measurement of tobacco smoke at entrances to office buildings. Tob Control 2011, 20, 212–218. [Google Scholar] [CrossRef] [PubMed]
- Mijorski, S.; Cammelli, S. Stack Effect in High-Rise Buildings: A Review. Int. J. High-Rise Build. 2016, 5, 327–338. [Google Scholar] [CrossRef] [Green Version]
- Bohac, D.L.; Hewett, M.J.; Hammond, S.K.; Grimsrud, D.T. Secondhand smoke transfer and reductions by air sealing and ventilation in multiunit buildings: PFT and nicotine verification. Indoor Air 2011, 21, 36–44. [Google Scholar] [CrossRef] [PubMed]
- Lim, H.; Seo, J.; Song, D.; Yoon, S.; Kim, J. Interaction analysis of countermeasures for the stack effect in a high-rise office building. Build. Environ. 2020, 168, 2–13. [Google Scholar] [CrossRef]
- Cardozo, R.A.; Feinberg, A.; Tovar, A.; Vilcassim, M.J.R.; Shelley, D.; Elbel, B.; Kaplan, S.; Wyka, K.; Rule, A.M.; Gordon, T.; et al. A protocol for measuring the impact of a smoke-free housing policy on indoor tobacco smoke exposure. BMC Public Health 2019, 19, 666. [Google Scholar] [CrossRef] [PubMed] [Green Version]
- Hammond, S.K.; Leaderer, B.P. A diffusion monitor to measure exposure to passive smoking. Environ. Sci. Technol. 1987, 21, 494–497. [Google Scholar] [CrossRef] [PubMed]
- Johns Hopkins Bloomberg School of Public Health Secondhand Smoke Monitoring: Analysis. Available online: http://www.shsmonitoring.org/analysis/lab/ (accessed on 15 June 2021).
- Rice, J.L.; Brigham, E.; Dineen, R.; Muqueeth, S.; O’Keefe, G.; Regenold, S.; Koehler, K.; Rule, A.; McCormack, M.; Hansel, N.N.; et al. The feasibility of an air purifier and secondhand smoke education intervention in homes of inner city pregnant women and infants living with a smoker. Environ. Res. 2018, 160, 524–530. [Google Scholar] [CrossRef] [PubMed] [Green Version]
- Klassen, A.C.; Lee, N.L.; Pankiewicz, A.; Ward, R.; Shuster, M.; Ogbenna, B.T.; Wade, A.; Boamah, M.; Osayameh, O.; Rule, A.M.; et al. Secondhand Smoke Exposure and Smoke-free Policy in Philadelphia Public Housing. Tob. Regul. Sci. 2017, 3, 192–203. [Google Scholar] [CrossRef] [PubMed] [Green Version]
- Office on Smoking and Health. The Health Consequences of Involuntary Exposure to Tobacco Smoke; Centers for Disease Control and Prevention: Atlanta, GA, USA, 2006.
Publisher’s Note: MDPI stays neutral with regard to jurisdictional claims in published maps and institutional affiliations. |
© 2022 by the authors. Licensee MDPI, Basel, Switzerland. This article is an open access article distributed under the terms and conditions of the Creative Commons Attribution (CC BY) license (https://creativecommons.org/licenses/by/4.0/).