
The Negative Effects of Long Time Physical Activity Calorie Equivalent Labeling on Purchase Intention for Unhealthy Food

Abstract
:1. Introduction
2. Hypothesis Development
2.1. The Effects of PACE Labels on Unhealthy Food Products
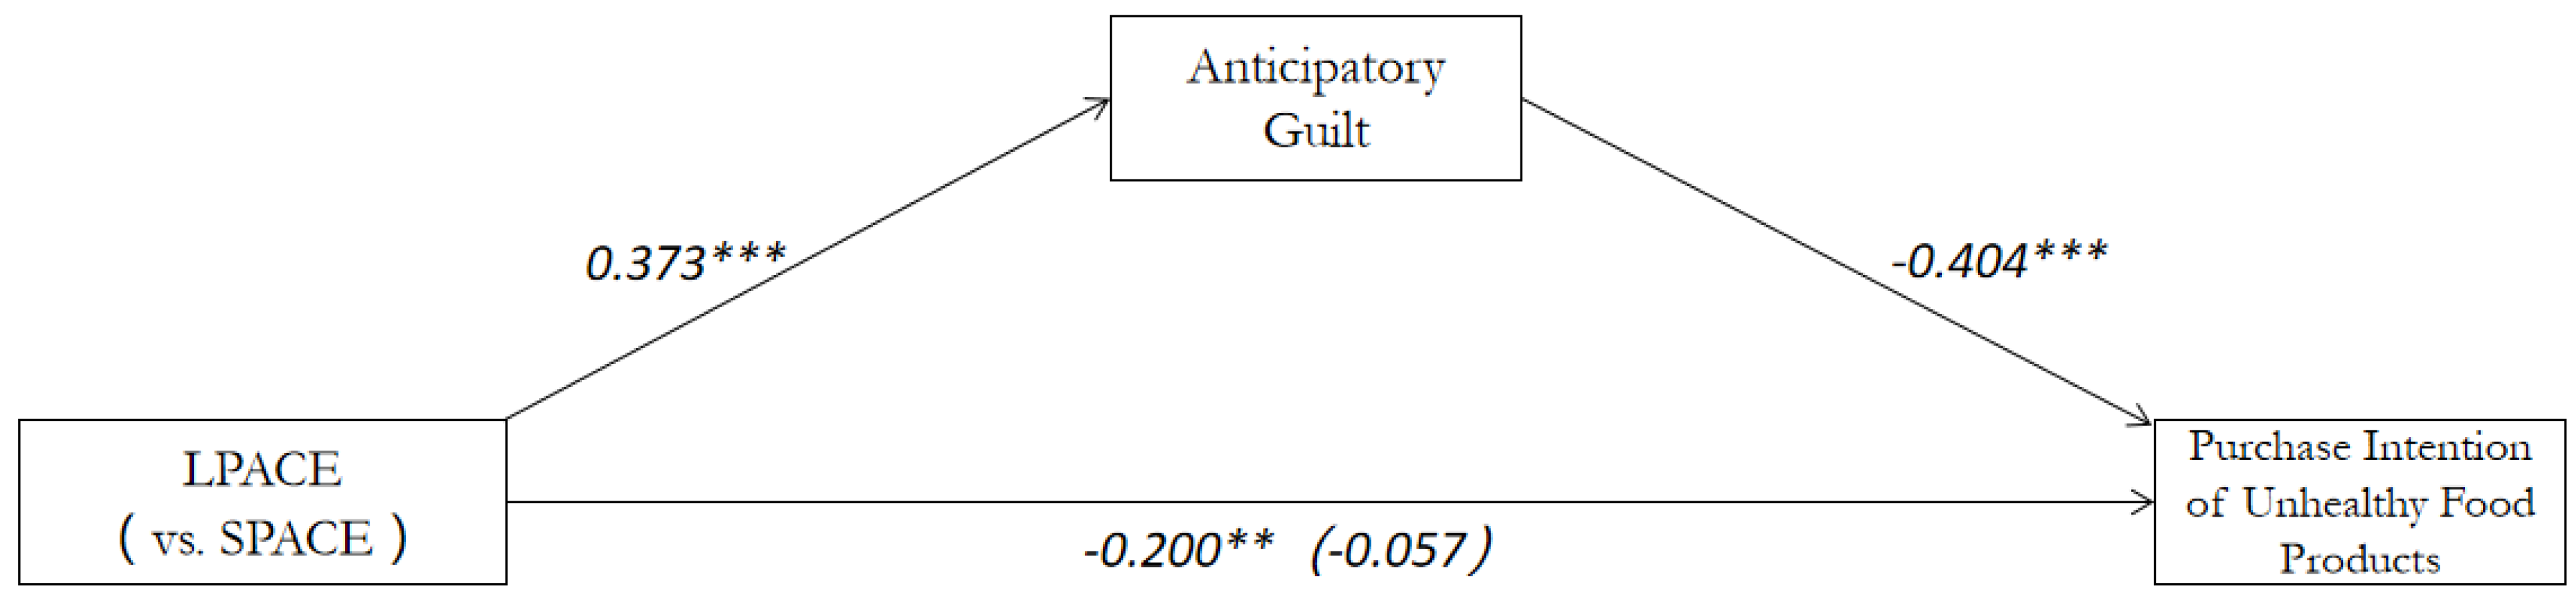
2.2. Anticipatory Guilt
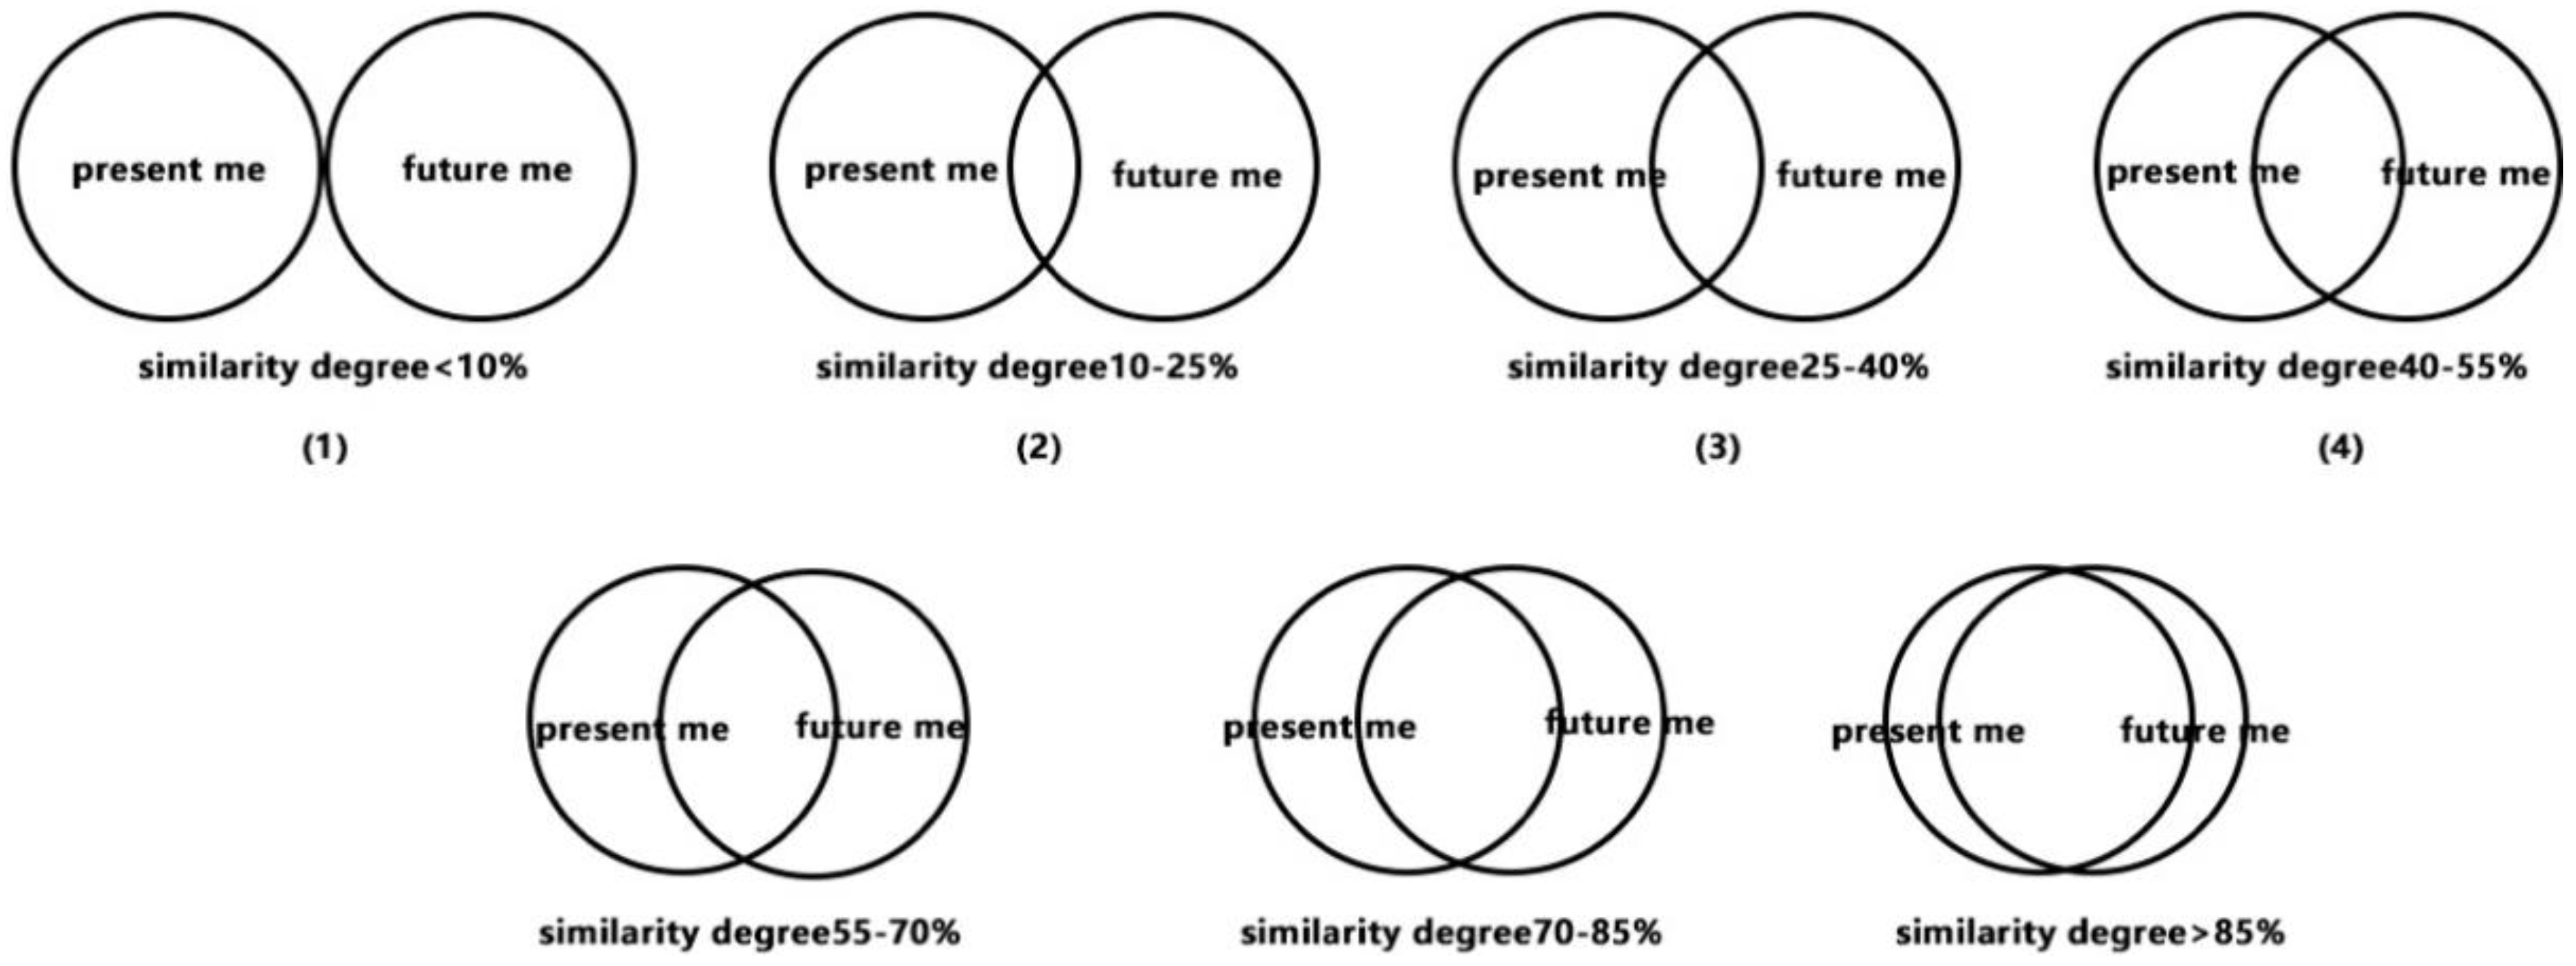
2.3. Future Self-Continuity
3. Materials and Methods
3.1. Study 1: Primary Examination of Main and Mediating Effects
3.1.1. Methodology
3.1.2. Procedure and Materials
3.1.3. Results
3.2. Study 2: Re-Examination of Main and Mediating Effects
3.2.1. Methodology
3.2.2. Procedure and Materials
3.2.3. Results
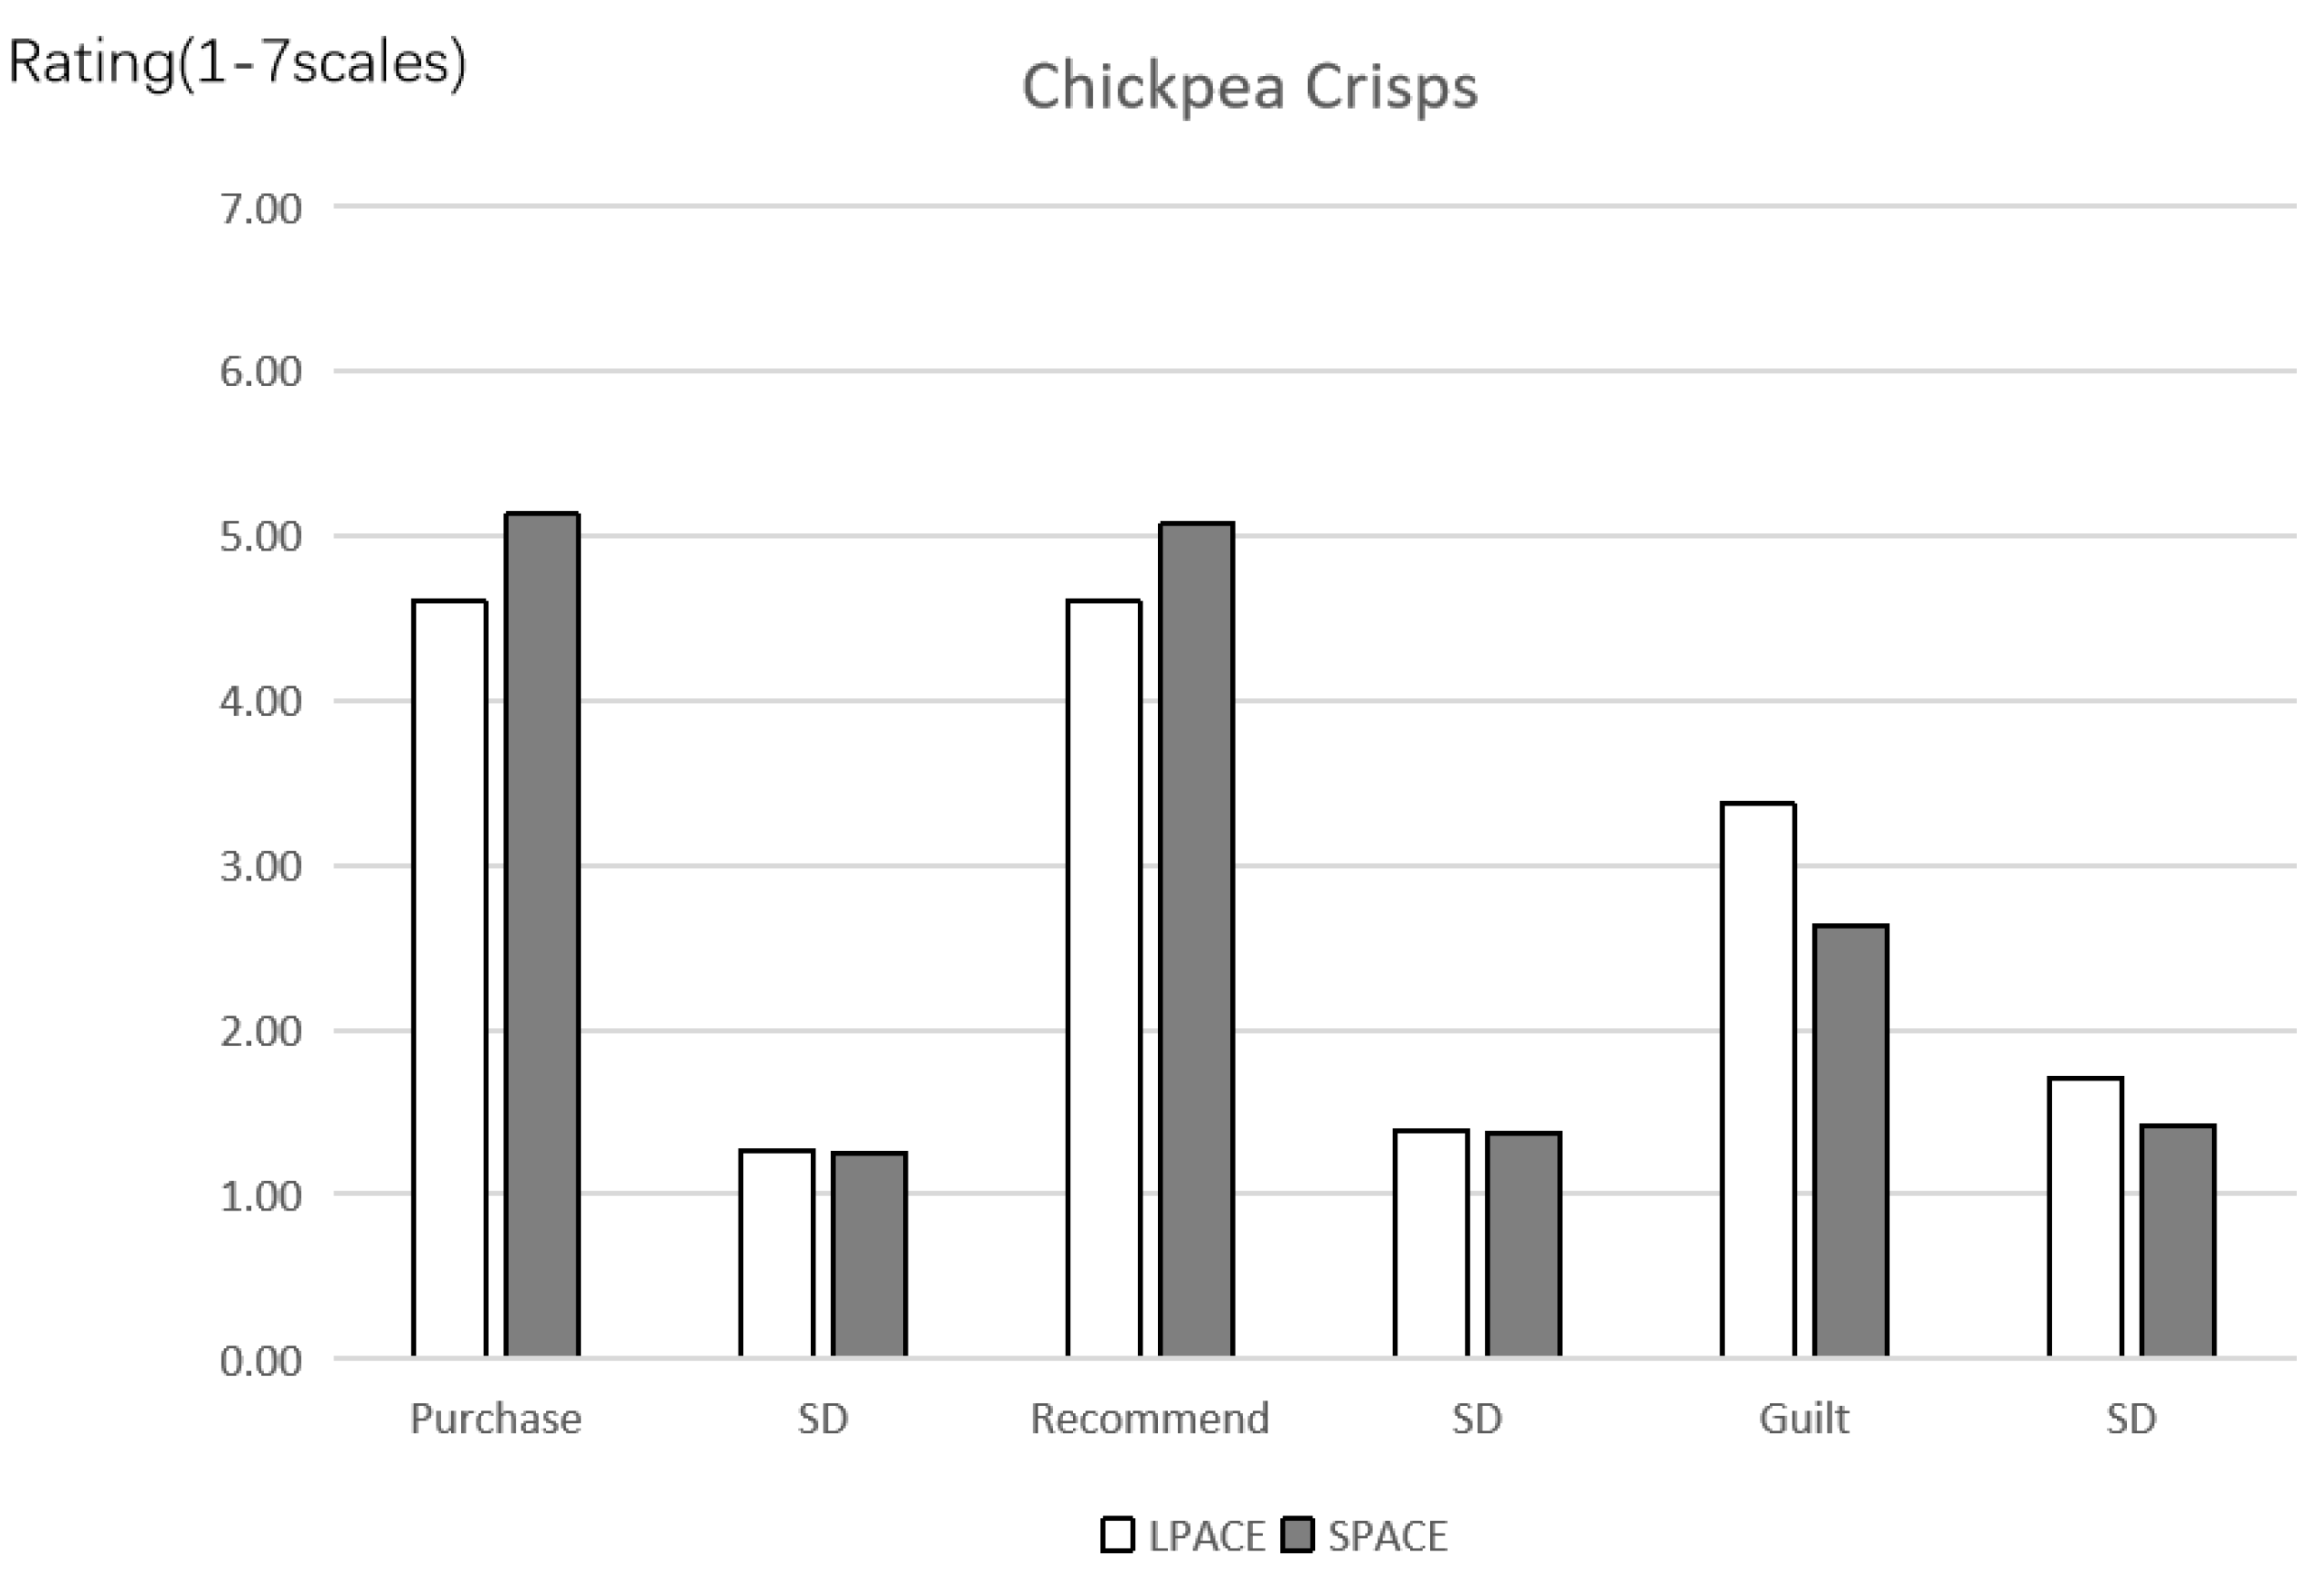
3.3. Study 3: Re-Examination of Main and Mediating Effects
3.3.1. Methodology
3.3.2. Procedure and Materials
3.3.3. Results
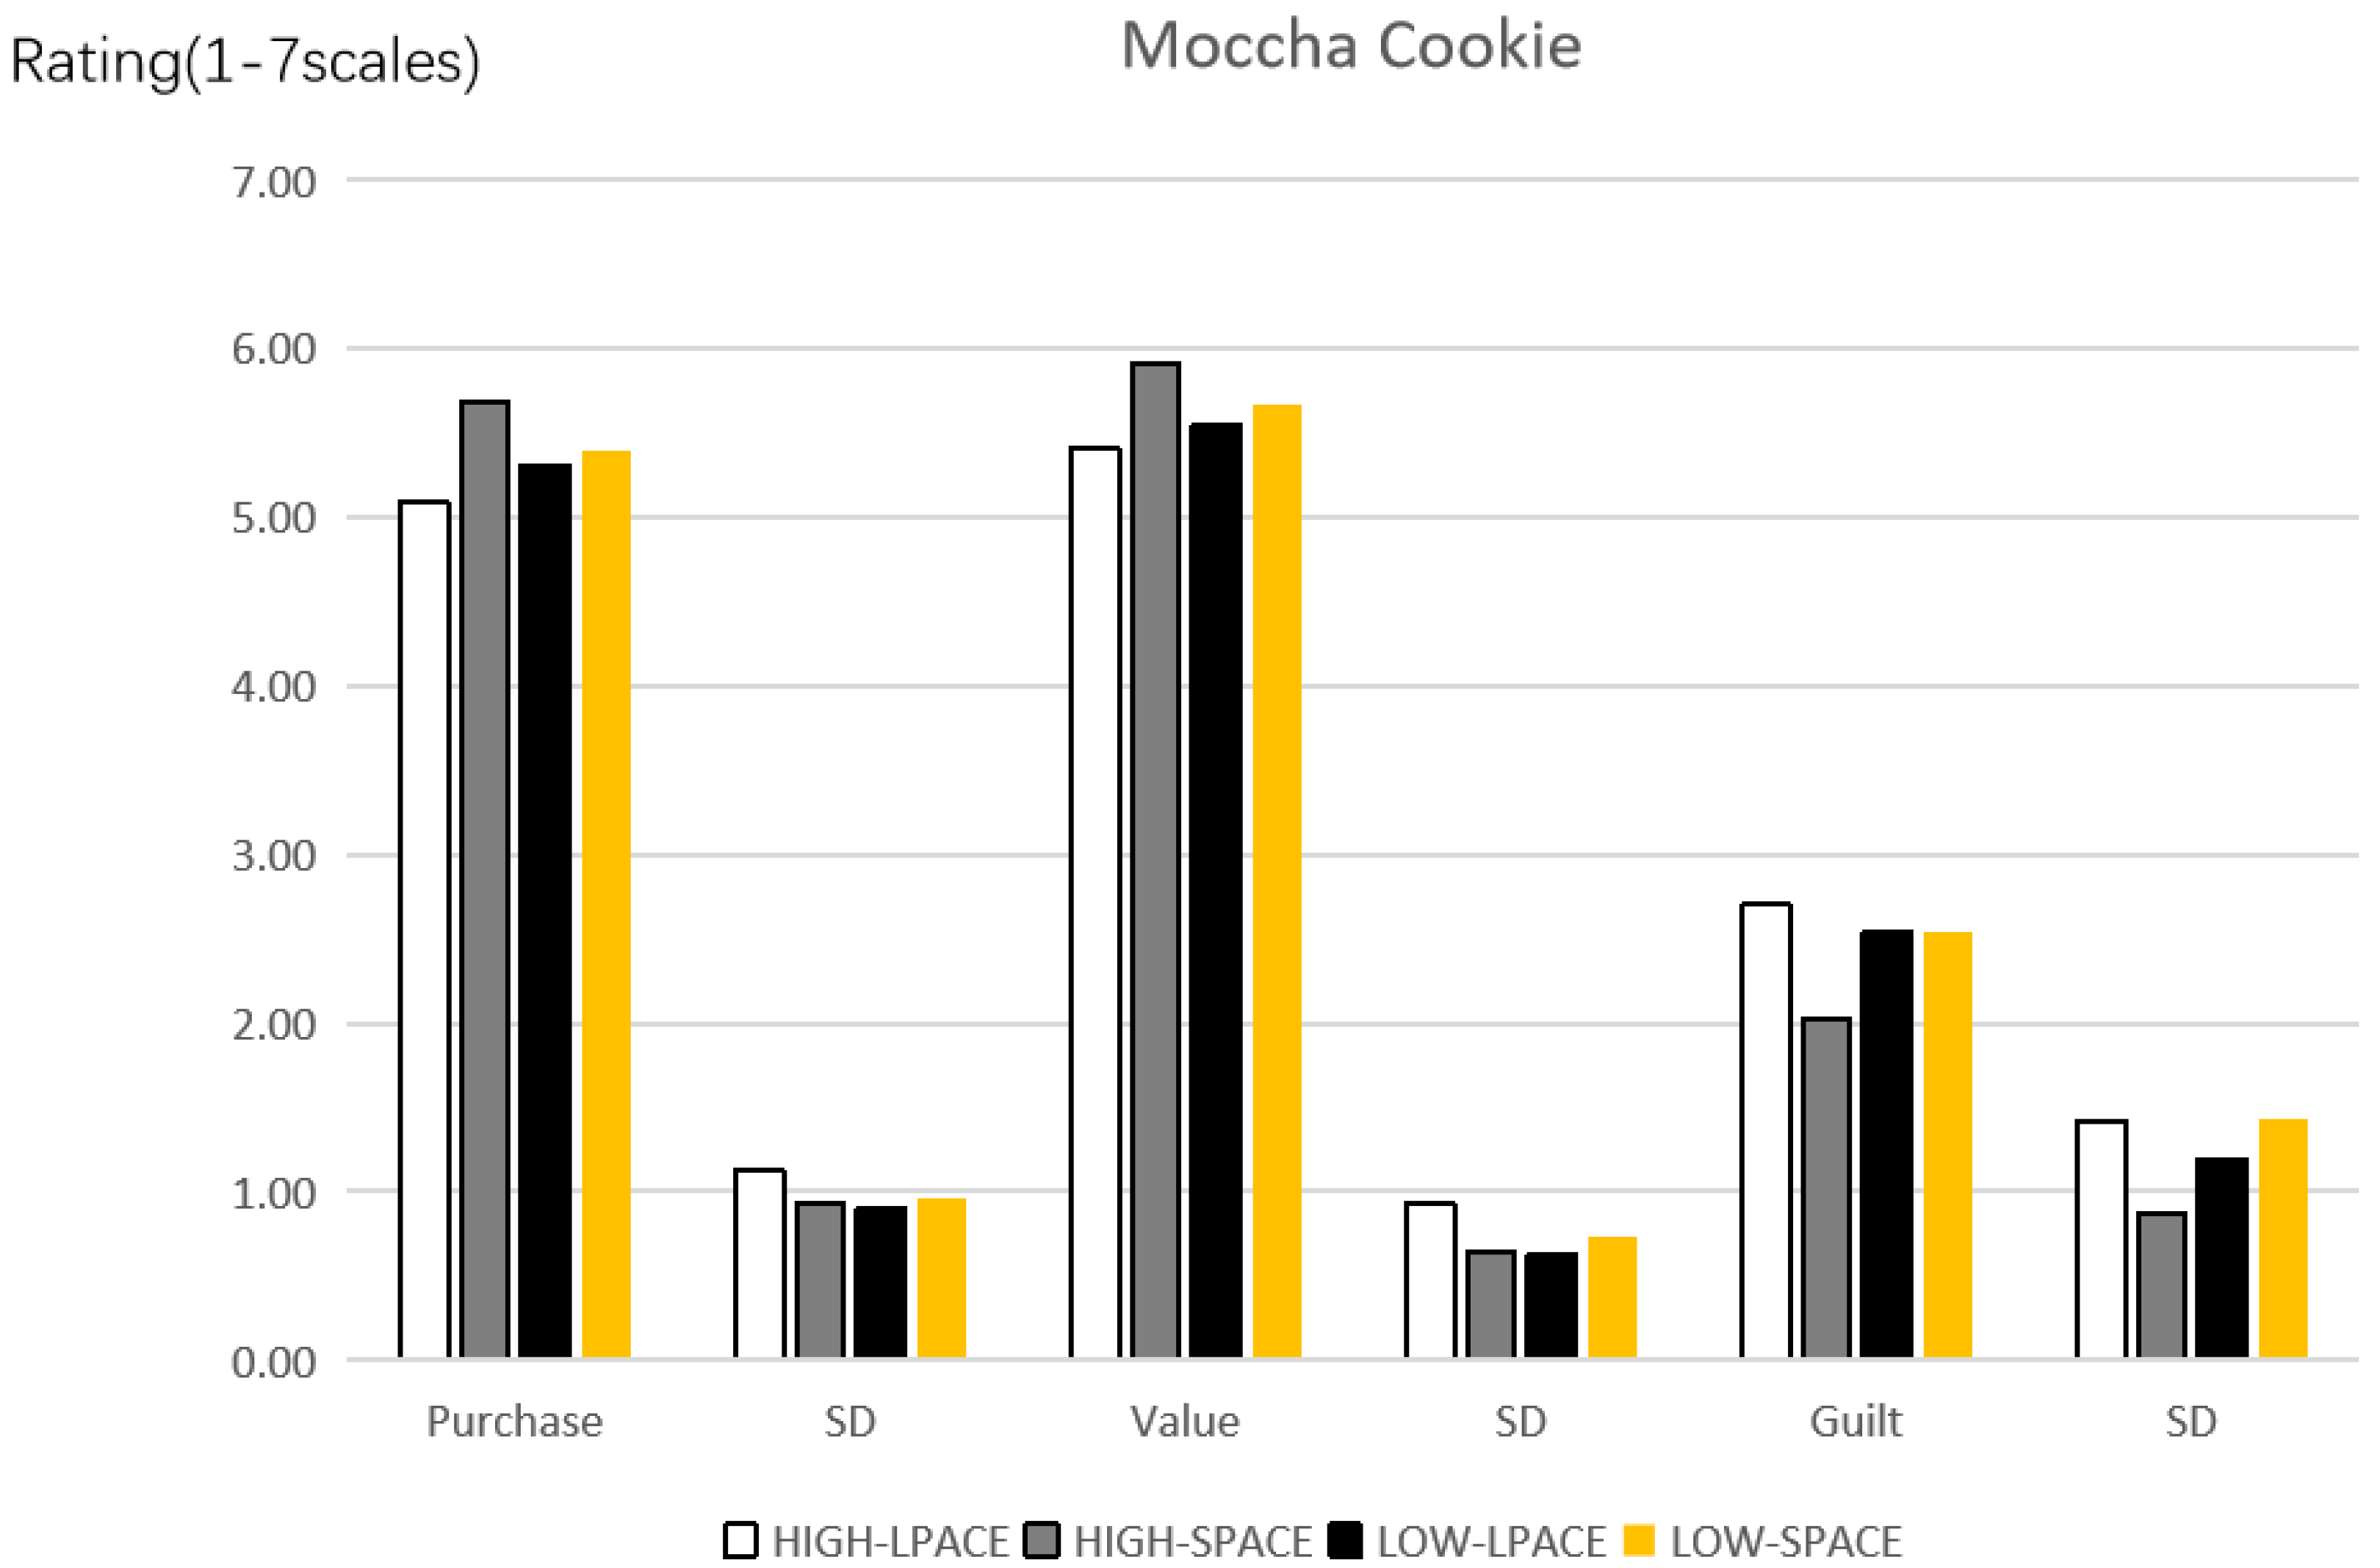
3.4. Study 4: Examination of Moderation effects
3.4.1. Methodology
3.4.2. Procedure and Materials
3.4.3. Results
4. General Discussion
4.1. Practical Implication
4.2. Limitations and Future Research Directions
5. Conclusions
Author Contributions
Funding
Institutional Review Board Statement
Informed Consent Statement
Data Availability Statement
Conflicts of Interest
References
- Bui, M.; Krishen, A.S. So close yet so far away: The moderating effect of regulatory focus orientation on health behavioral intentions. Psychol. Mark. 2015, 32, 522–531. [Google Scholar] [CrossRef]
- James, P.T.; Rigby, N.; Leach, R.; Force, I.O.T. The obesity epidemic, metabolic syndrome and future prevention strategies. Eur. J. Prev. Cardiol. 2004, 11, 3–8. [Google Scholar] [CrossRef] [PubMed]
- Martens, L.; De Smet, S.; Yusof, M.; Rajasekharan, S. Association between overweight/obesity and periodontal disease in children and adolescents: A systematic review and meta-analysis. Eur. Arch. Paediatr. Dent. 2017, 18, 69–82. [Google Scholar] [CrossRef] [PubMed]
- Pi-Sunyer, F.X. The obesity epidemic: Pathophysiology and consequences of obesity. Obes. Res. 2002, 10, 97S–104S. [Google Scholar] [CrossRef]
- Quan, S. Sustainable food consumption behaviors: Incentives and intervention strategies. World Agric. 2020, 6, 23–35. [Google Scholar]
- Yang, X.; Huang, Y.; Han, M.; Wen, X.; Zheng, Q.; Chen, Q.; Chen, Q. The Differential Effects of Physical Activity Calorie Equivalent Labeling on Consumer Preferences for Healthy and Unhealthy Food Products: Evidence from a Choice Experiment. Int. J. Environ. Res. Public Health 2021, 18, 1860. [Google Scholar] [CrossRef]
- Frieden, T.R.; Dietz, W.; Collins, J. Reducing childhood obesity through policy change: Acting now to prevent obesity. Health Aff. 2010, 29, 357–363. [Google Scholar] [CrossRef]
- Sacks, G.; Swinburn, B.; Lawrence, M. Obesity Policy Action framework and analysis grids for a comprehensive policy approach to reducing obesity. Obes. Rev. 2009, 10, 76–86. [Google Scholar] [CrossRef]
- Wilson, A.L.; Buckley, E.; Buckley, J.D.; Bogomolova, S. Nudging healthier food and beverage choices through salience and priming. Evidence from a systematic review. Food Qual. Prefer. 2016, 51, 47–64. [Google Scholar] [CrossRef]
- Thaler, R.H. From cashews to nudges: The evolution of behavioral economics. Am. Econ. Rev. 2018, 108, 1265–1287. [Google Scholar] [CrossRef] [Green Version]
- Cadario, R.; Chandon, P. Which healthy eating nudges work best? A meta-analysis of field experiments. Mark. Sci. 2020, 39, 465–486. [Google Scholar] [CrossRef]
- Chao, W.-Y.; Lehto, M.; Pitts, B.; Hass, Z. Evaluation of the effectiveness of an interpretive nutrition label format in improving healthy food discrimination using Signal Detection Theory. In International Conference on Applied Human Factors and Ergonomics; Springer: Berlin, Germany, 2020; pp. 342–348. [Google Scholar]
- Mozaffarian, D.; Afshin, A.; Benowitz, N.L.; Bittner, V.; Daniels, S.R.; Franch, H.A.; Jacobs, D.R., Jr.; Kraus, W.E.; Kris-Etherton, P.M.; Krummel, D.A. Population approaches to improve diet, physical activity, and smoking habits: A scientific statement from the American Heart Association. Circulation 2012, 126, 1514–1563. [Google Scholar] [CrossRef] [PubMed]
- Food and Drug Administration. FDA Proposes Draft Menu and Vending Machine Labeling Requirements; United States Department of Health and Human Services: Washington, DC, USA, 2011. [Google Scholar]
- Viera, A.J.; Tuttle, L.; Olsson, E.; Gras-Najjar, J.; Gizlice, Z.; Hales, D.; Linnan, L.; Lin, F.-C.; Noar, S.M.; Ammerman, A. Effects of physical activity calorie expenditure (PACE) labeling: Study design and baseline sample characteristics. BMC Public Health 2017, 17, 702. [Google Scholar] [CrossRef] [PubMed]
- Akhlaghi, M.; Ghobadi, S.; Zare, M.; Foshati, S. Effect of nuts on energy intake, hunger, and fullness, a systematic review and meta-analysis of randomized clinical trials. Crit. Rev. Food. Sci. 2020, 60, 84–93. [Google Scholar] [CrossRef]
- Brownell, K.D.; Koplan, J.P. Front-of-package nutrition labeling—An abuse of trust by the food industry? N. Engl. J. Med. 2011, 364, 2373–2375. [Google Scholar] [CrossRef] [Green Version]
- Hamlin, R.P.; McNeill, L.S.; Moore, V. The impact of front-of-pack nutrition labels on consumer product evaluation and choice: An experimental study. Public Health Nutr. 2015, 18, 2126–2134. [Google Scholar] [CrossRef] [Green Version]
- Grunert, K.G.; Wills, J.M. A review of European research on consumer response to nutrition information on food labels. J. Public Health 2007, 15, 385–399. [Google Scholar] [CrossRef] [Green Version]
- Hersey, J.C.; Wohlgenant, K.C.; Arsenault, J.E.; Kosa, K.M.; Muth, M.K. Effects of front-of-package and shelf nutrition labeling systems on consumers. Nutr. Rev. 2013, 71, 1–14. [Google Scholar] [CrossRef]
- Temple, N.J.; Fraser, J. Food labels: A critical assessment. Nutrition 2014, 30, 257–260. [Google Scholar] [CrossRef]
- Dowray, S.; Swartz, J.J.; Braxton, D.; Viera, A.J. Potential effect of physical activity based menu labels on the calorie content of selected fast food meals. Appetite 2013, 62, 173–181. [Google Scholar] [CrossRef]
- Viera, A.J.; Antonelli, R. Potential effect of physical activity calorie equivalent labeling on parent fast food decisions. Pediatrics 2015, 135, e376–e382. [Google Scholar] [CrossRef] [PubMed] [Green Version]
- Daley, A.J.; McGee, E.; Bayliss, S.; Coombe, A.; Parretti, H.M. Effects of physical activity calorie equivalent food labelling to reduce food selection and consumption: Systematic review and meta-analysis of randomised controlled studies. J. Epidemiol. Community Health 2020, 74, 269–275. [Google Scholar] [CrossRef] [PubMed]
- Shah, M.; Bouza, B.; Adams-Huet, B.; Jaffery, M.; Esposito, P.; Dart, L. Effect of calorie or exercise labels on menus on calories and macronutrients ordered and calories from specific foods in Hispanic participants: A randomized study. J. Investig. Med. 2016, 64, 1261–1268. [Google Scholar] [CrossRef] [PubMed]
- Seyedhamzeh, S.; Bagheri, M.; Keshtkar, A.A.; Qorbani, M.; Viera, A.J. Physical activity equivalent labeling vs. calorie labeling: A systematic review and meta-analysis. Int. J. Behav. Nutr. Phys. Act. 2018, 15, 88. [Google Scholar] [CrossRef]
- Hartley, I.E.; Keast, R.S.; Liem, D.G. Physical activity-equivalent label reduces consumption of discretionary snack foods. Public Health Nutr. 2018, 21, 1435–1443. [Google Scholar] [CrossRef] [Green Version]
- Block, L.G.; Grier, S.A.; Childers, T.L.; Davis, B.; Ebert, J.E.; Kumanyika, S.; Laczniak, R.N.; Machin, J.E.; Motley, C.M.; Peracchio, L. From nutrients to nurturance: A conceptual introduction to food well-being. J. Public Policy Mark. 2011, 30, 5–13. [Google Scholar] [CrossRef] [Green Version]
- Ersner-Hershfield, H.; Garton, M.T.; Ballard, K.; Samanez-Larkin, G.R.; Knutson, B. Don’t stop thinking about tomorrow: Individual differences in future self-continuity account for saving. Judgm. Decis. Mak. 2009, 4, 280. [Google Scholar]
- Viera, A.J.; Gizlice, Z.; Tuttle, L.; Olsson, E.; Gras-Najjar, J.; Hales, D.; Linnan, L.; Lin, F.-C.; Noar, S.M.; Ammerman, A. Effect of calories-only vs physical activity calorie expenditure labeling on lunch calories purchased in worksite cafeterias. BMC Public Health 2019, 19, 107. [Google Scholar] [CrossRef]
- Masic, U.; Christiansen, P.; Boyland, E. The influence of calorie and physical activity labelling on snack and beverage choices. Appetite 2017, 112, 52–58. [Google Scholar] [CrossRef]
- Tangari, A.H.; Bui, M.; Haws, K.L.; Liu, P.J. That’s not so bad, I’ll eat more! Backfire effects of calories-per-serving information on snack consumption. J. Mark. 2019, 83, 133–150. [Google Scholar] [CrossRef]
- Geng, X.; Zhang, F.; Wang, Y.; Fan, L.; Yao, Y. Health goal priming decreases high-calorie food consumption. Acta Psychol. Sin. 2018, 50, 840–847. [Google Scholar]
- Wilson, T.D.; Gilbert, D.T. Affective Forecasting. Adv. Exp. Soc. Psychol. 2003, 35, 345–411. [Google Scholar]
- Wilson, T.D.; Gilbert, D.T. The impact bias is alive and well. J. Personal. Soc. Psychol. 2013, 105, 740. [Google Scholar] [CrossRef] [PubMed]
- Elder, R.S.; Mohr, G.S. Guilty displeasures: How imagined guilt dampens consumer enjoyment. Appetite 2020, 150, 104641. [Google Scholar] [CrossRef]
- Desmet, P.M.; Schifferstein, H.N. Sources of positive and negative emotions in food experience. Appetite 2008, 50, 290–301. [Google Scholar] [CrossRef]
- Macht, M.; Dettmer, D. Everyday mood and emotions after eating a chocolate bar or an apple. Appetite 2006, 46, 332–336. [Google Scholar] [CrossRef]
- Ramanathan, S.; Williams, P. Immediate and delayed emotional consequences of indulgence: The moderating influence of personality type on mixed emotions. J. Consum. Res. 2007, 34, 212–223. [Google Scholar] [CrossRef]
- Blum, A. Shame and guilt, misconceptions and controversies: A critical review of the literature. Traumatology 2008, 14, 91–102. [Google Scholar] [CrossRef]
- Tracy, J.L.; Robins, R.W. Putting the Self into Self-Conscious Emotions: A Theoretical Model. Psychol. Inq. 2004, 15, 103–125. [Google Scholar] [CrossRef]
- Tangney, J.P.; Miller, R.S.; Flicker, L.; Barlow, D.H. Are shame, guilt, and embarrassment distinct emotions? J. Personal. Soc. Psychol. 1996, 70, 1256. [Google Scholar] [CrossRef]
- Giner-Sorolla, R. Guilty pleasures and grim necessities: Affective attitudes in dilemmas of self-control. J. Personal. Soc. Psychol. 2001, 80, 206. [Google Scholar] [CrossRef] [PubMed]
- Patrick, V.M.; Chun, H.H.; MacInnis, D.J. Affective forecasting and self-control: Why anticipating pride wins over anticipating shame in a self-regulation context. J. Consum. Psychol. 2009, 19, 537–545. [Google Scholar] [CrossRef]
- Tiggemann, M.; Kemps, E. The phenomenology of food cravings: The role of mental imagery. Appetite 2005, 45, 305–313. [Google Scholar] [CrossRef] [PubMed]
- Stroebe, W.; Mensink, W.; Aarts, H.; Schut, H.; Kruglanski, A.W. Why dieters fail: Testing the goal conflict model of eating. J. Exp. Soc. Psychol. 2008, 44, 26–36. [Google Scholar] [CrossRef] [Green Version]
- Hofmann, W.; van Koningsbruggen, G.M.; Stroebe, W.; Ramanathan, S.; Aarts, H. As pleasure unfolds: Hedonic responses to tempting food. Psychol. Sci. 2010, 21, 1863–1870. [Google Scholar] [CrossRef] [Green Version]
- Moore, D.J.; Konrath, S. “I can almost taste it:” Why people with strong positive emotions experience higher levels of food craving, salivation and eating intentions. J. Consum. Psychol. 2015, 25, 42–59. [Google Scholar] [CrossRef] [Green Version]
- Mohr, G.S.; Lichtenstein, D.R.; Janiszewski, C. The effect of marketer-suggested serving size on consumer responses: The unintended consequences of consumer attention to calorie information. J. Mark. 2012, 76, 59–75. [Google Scholar] [CrossRef] [Green Version]
- Sedikides, C.; Gaertner, L.; O’Mara, E.M. Individual self, relational self, collective self: Hierarchical ordering of the tripartite self. Psychol. Stud. 2011, 56, 98–107. [Google Scholar] [CrossRef]
- Papies, E.; Stroebe, W.; Aarts, H. Pleasure in the mind: Restrained eating and spontaneous hedonic thoughts about food. J. Exp. Soc. Psychol. 2007, 43, 810–817. [Google Scholar] [CrossRef]
- Fedoroff, I.D.; Polivy, J.; Herman, C.P. The effect of pre-exposure to food cues on the eating behavior of restrained and unrestrained eaters. Appetite 1997, 28, 33–47. [Google Scholar] [CrossRef]
- Welch-Ross, M. Personalizing the Temporally Extended Self: Evaluative Self-Awareness and the Development of Autobiographical Memory; Lawrence Erlbaum Associates Publishers: Washington, DC, USA, 2001. [Google Scholar]
- Sheldon, O.J.; Fishbach, A. Anticipating and resisting the temptation to behave unethically. Personal. Soc. Psychol. Bull. 2015, 41, 962–975. [Google Scholar] [CrossRef] [PubMed] [Green Version]
- Adelman, R.M.; Herrmann, S.D.; Bodford, J.E.; Barbour, J.E.; Graudejus, O.; Okun, M.A.; Kwan, V.S. Feeling closer to the future self and doing better: Temporal psychological mechanisms underlying academic performance. J. Personal. 2017, 85, 398–408. [Google Scholar] [CrossRef] [PubMed]
- Rutchick, A.M.; Slepian, M.L.; Reyes, M.O.; Pleskus, L.N.; Hershfield, H.E. Future self-continuity is associated with improved health and increases exercise behavior. J. Exp. Psychol. Appl. 2018, 24, 72. [Google Scholar] [CrossRef] [PubMed]
- Yunzhi, L.; Ziyan, Y.; Yuqi, W.; Jun, C.; Huajian, C. The concept of future self-continuity and its effects. Adv. Psychol. Sci. 2018, 26, 2161. [Google Scholar]
- Blouin-Hudon, E.M.C.; Pychyl, T.A. A mental imagery intervention to increase future self-continuity and reduce procrastination. Appl. Psychol. 2017, 66, 326–352. [Google Scholar] [CrossRef]
- Liberman, N.; Trope, Y. Traversing psychological distance. Trends Cogn. Sci. 2014, 18, 364–369. [Google Scholar] [CrossRef]
- Gneezy, A. Field experimentation in marketing research. J. Mark. Res. 2017, 54, 140–143. [Google Scholar] [CrossRef]
- Lynch, J.G. Theory and external validity. J. Acad. Mark. Sci. 1999, 27, 367–376. [Google Scholar] [CrossRef] [Green Version]
- Cvelbar, L.K.; Grün, B.; Dolnicar, S. Which hotel guest segments reuse towels? Selling sustainable tourism services through target marketing. J. Sustain. Tour. 2017, 25, 921–934. [Google Scholar] [CrossRef]
- Fong, N.M.; Fang, Z.; Luo, X. Geo-conquesting: Competitive locational targeting of mobile promotions. J. Mark. Res. 2015, 52, 726–735. [Google Scholar] [CrossRef] [Green Version]
- Huang, Y.; Yang, X.; Li, X.; Chen, Q. Less Is Better: How Nutrition and Low-Carbon Labels Jointly Backfire on the Evaluation of Food Products. Nutrients 2021, 13, 1088. [Google Scholar] [CrossRef] [PubMed]
- Winterich, K.P.; Nenkov, G.Y.; Gonzales, G.E. Knowing what it makes: How product transformation salience increases recycling. J. Mark. 2019, 83, 21–37. [Google Scholar] [CrossRef]
- Zhao, M.; Dahl, D.W.; Hoeffler, S. Optimal visualization aids and temporal framing for new products. J. Consum. Res. 2014, 41, 1137–1151. [Google Scholar] [CrossRef]
- Huang, Y.; Sengupta, J. The influence of disease cues on preference for typical versus atypical products. J. Consum. Res. 2020, 47, 393–411. [Google Scholar] [CrossRef]
- Gai, P.J.; Klesse, A.-K. Making recommendations more effective through framings: Impacts of user-versus item-based framings on recommendation click-throughs. J. Mark. 2019, 83, 61–75. [Google Scholar] [CrossRef]
- Newman, G.E.; Gorlin, M.; Dhar, R. When going green backfires: How firm intentions shape the evaluation of socially beneficial product enhancements. J. Consum. Res. 2014, 41, 823–839. [Google Scholar] [CrossRef] [Green Version]
- Preacher, K.J.; Hayes, A.F. Asymptotic and resampling strategies for assessing and comparing indirect effects in multiple mediator models. Behav. Res. Methods 2008, 40, 879–891. [Google Scholar] [CrossRef]
- Van Gelder, J.-L.; Hershfield, H.E.; Nordgren, L.F. Vividness of the future self predicts delinquency. Psychol. Sci. 2013, 24, 974–980. [Google Scholar] [CrossRef] [Green Version]
- Zhang, M.; Aggarwal, P. Looking ahead or looking back: Current evaluations and the effect of psychological connectedness to a temporal self. J. Consum. Psychol. 2015, 25, 512–518. [Google Scholar] [CrossRef]
- Bartels, D.M.; Urminsky, O. To know and to care: How awareness and valuation of the future jointly shape consumer spending. J. Consum. Res. 2015, 41, 1469–1485. [Google Scholar] [CrossRef] [Green Version]
- Lin, W.; Zengxiang, C.; Yun, H. Effect of legacy motivation on individuals’ financial risk-taking: Mediating role of future self-continuity. Acta Psychol. Sin. 2020, 52, 1004. [Google Scholar] [CrossRef]
- Vaughn, R. How advertising works: A planning model. J. Advert. Res. 1980, 20, 27–33. [Google Scholar]
- Spiller, S.A.; Fitzsimons, G.J.; Lynch, J.G., Jr.; McClelland, G.H. Spotlights, floodlights, and the magic number zero: Simple effects tests in moderated regression. J. Mark. Res. 2013, 50, 277–288. [Google Scholar] [CrossRef]
- Evans, A.E.; Weiss, S.R.; Meath, K.J.; Chow, S.; Vandewater, E.A.; Ness, R.B. Adolescents’ awareness and use of menu labels in eating establishments: Results from a focus group study. Public Health Nutr. 2016, 19, 830–840. [Google Scholar] [CrossRef] [Green Version]
- Yang, A.X.; Urminsky, O. The foresight effect: Local optimism motivates consistency and local pessimism motivates variety. J. Consum. Res. 2015, 42, 361–377. [Google Scholar] [CrossRef] [Green Version]
- Khan, U.; Dhar, R. Where there is a way, is there a will? The effect of future choices on self-control. J. Exp. Psychol. Gen. 2007, 136, 277. [Google Scholar] [CrossRef] [Green Version]
- Alba, J.W.; Williams, E.F. Pleasure principles: A review of research on hedonic consumption. J. Consum. Psychol. Aesthet. 2013, 23, 2–18. [Google Scholar] [CrossRef]


| Study | Hypothesis | Grouping | Major Variables | Stimulant | Movement |
|---|---|---|---|---|---|
| 1 | H1 & H2 | Intergroups: label (LPACE vs. SPACE vs. calories) | Purchase intention, Exercise preference | potato chips | Walk vs. running |
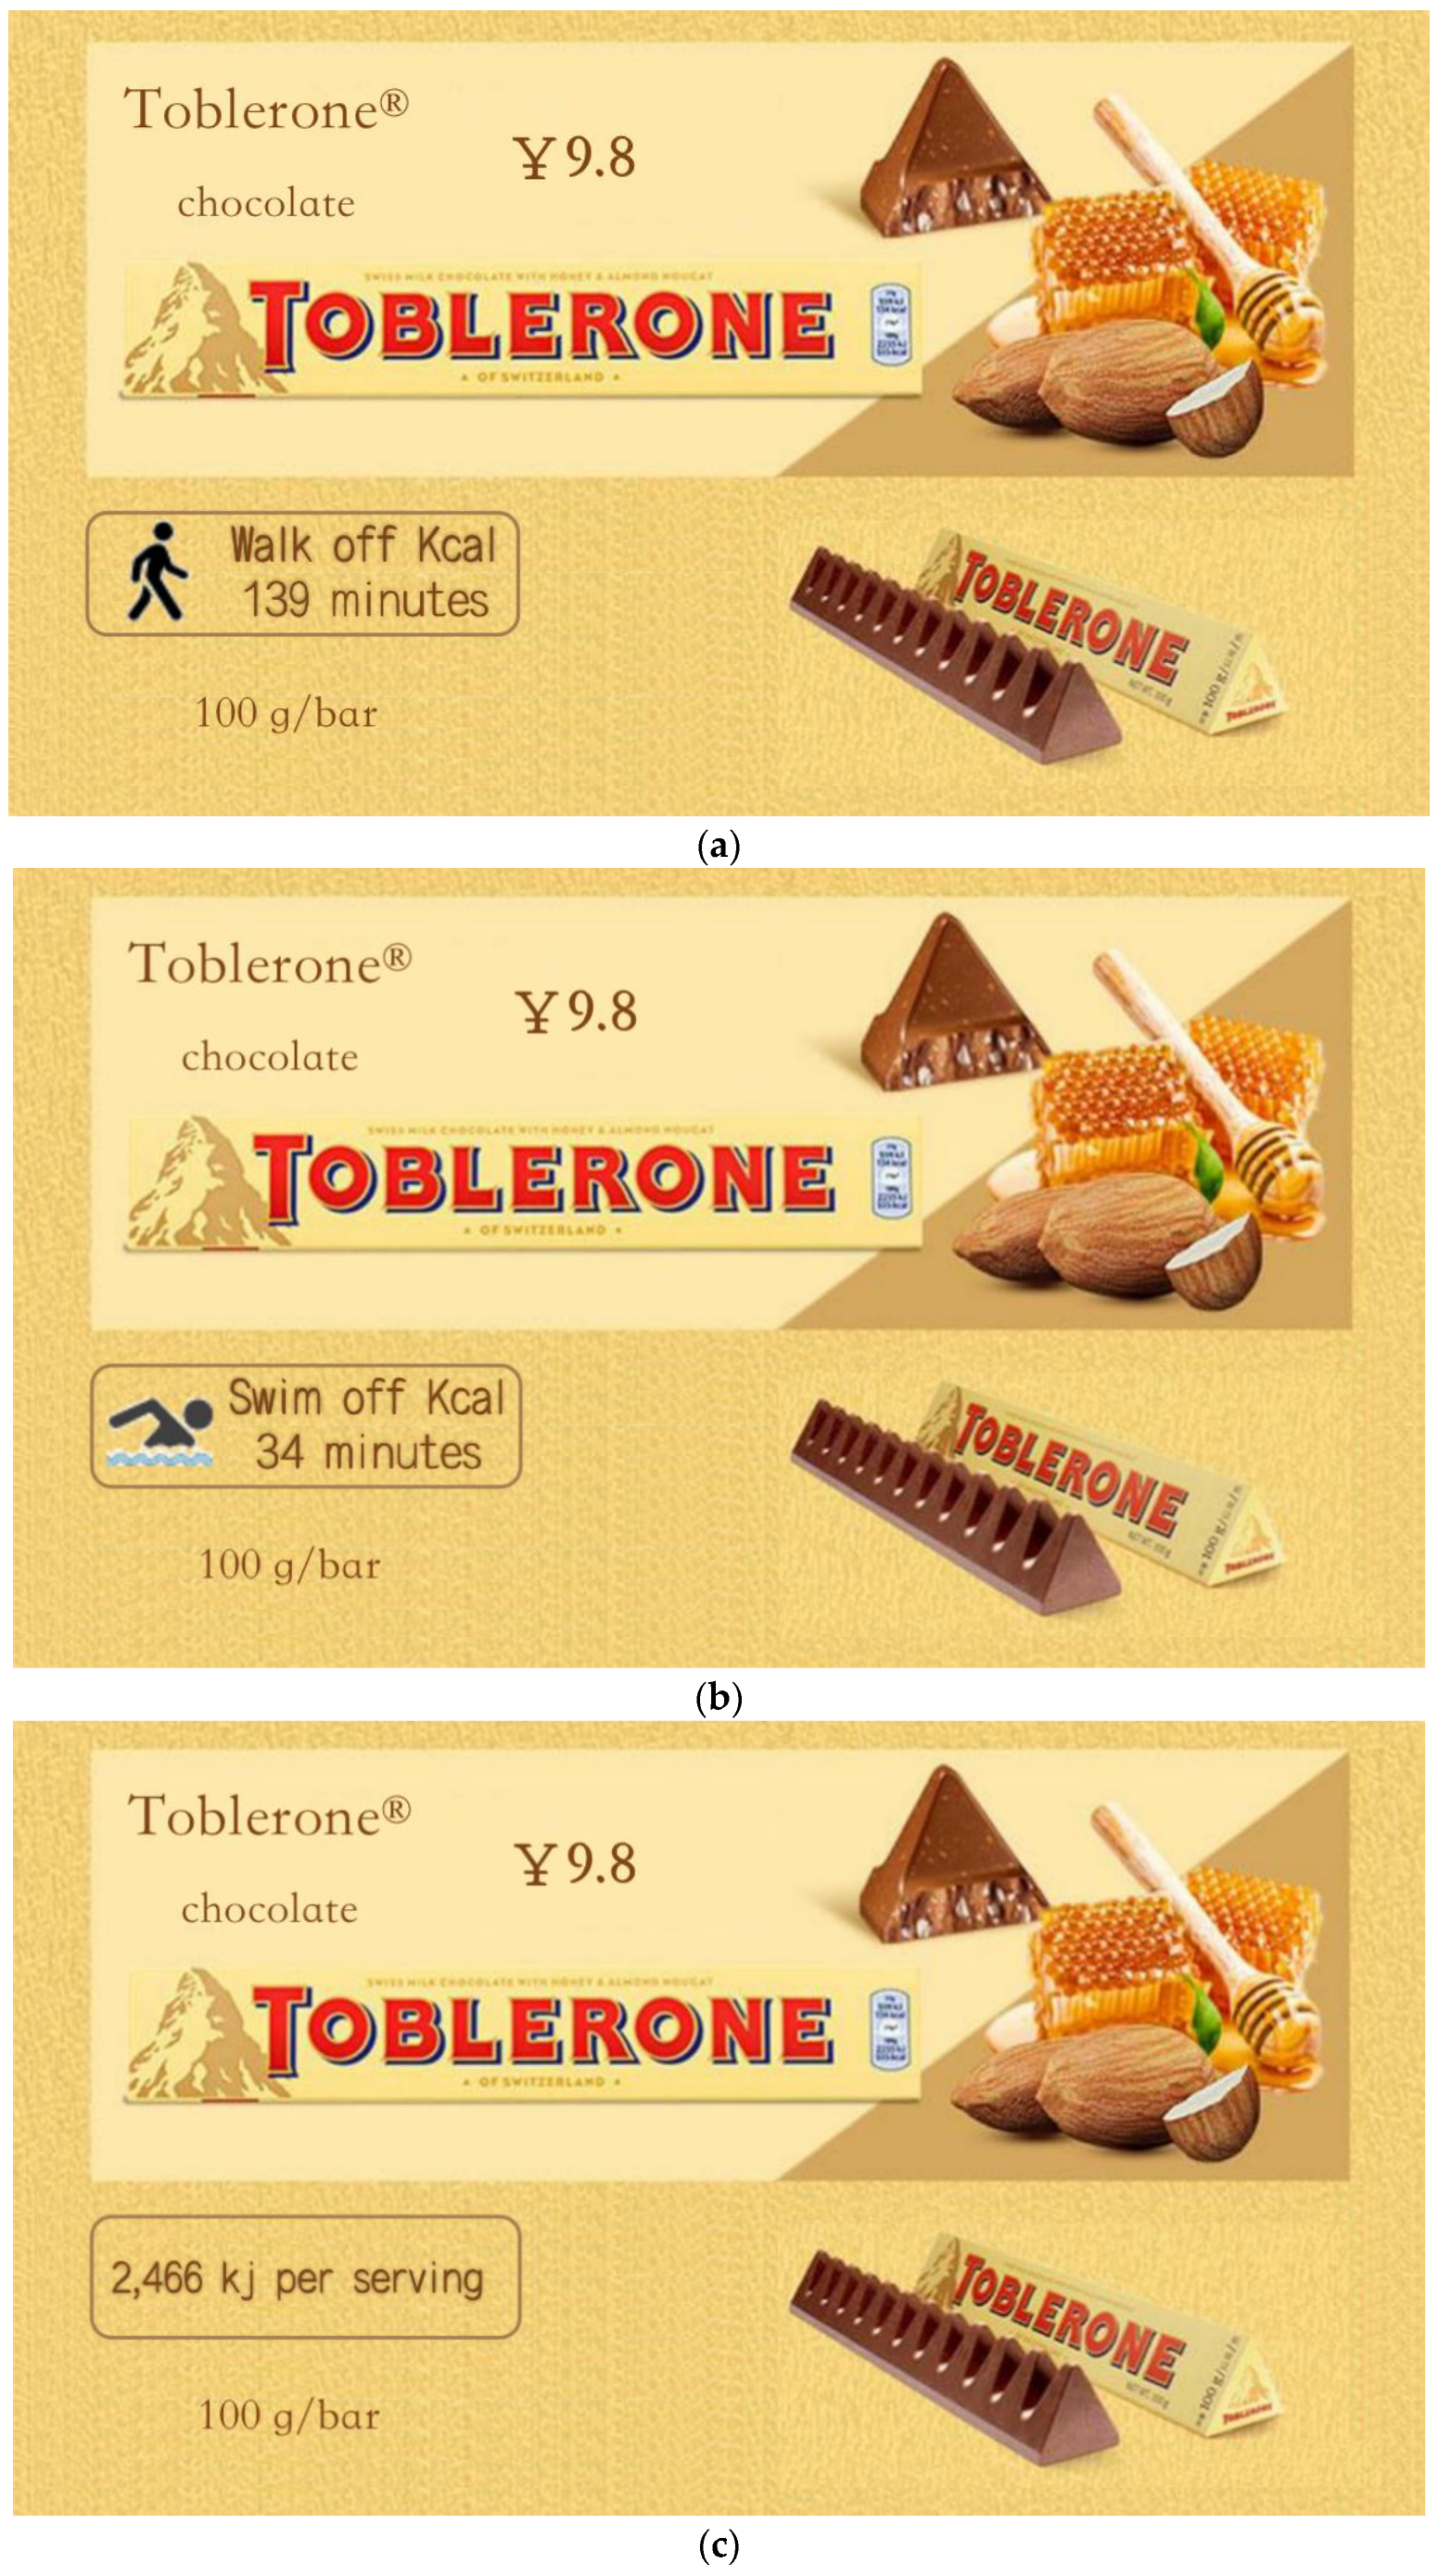
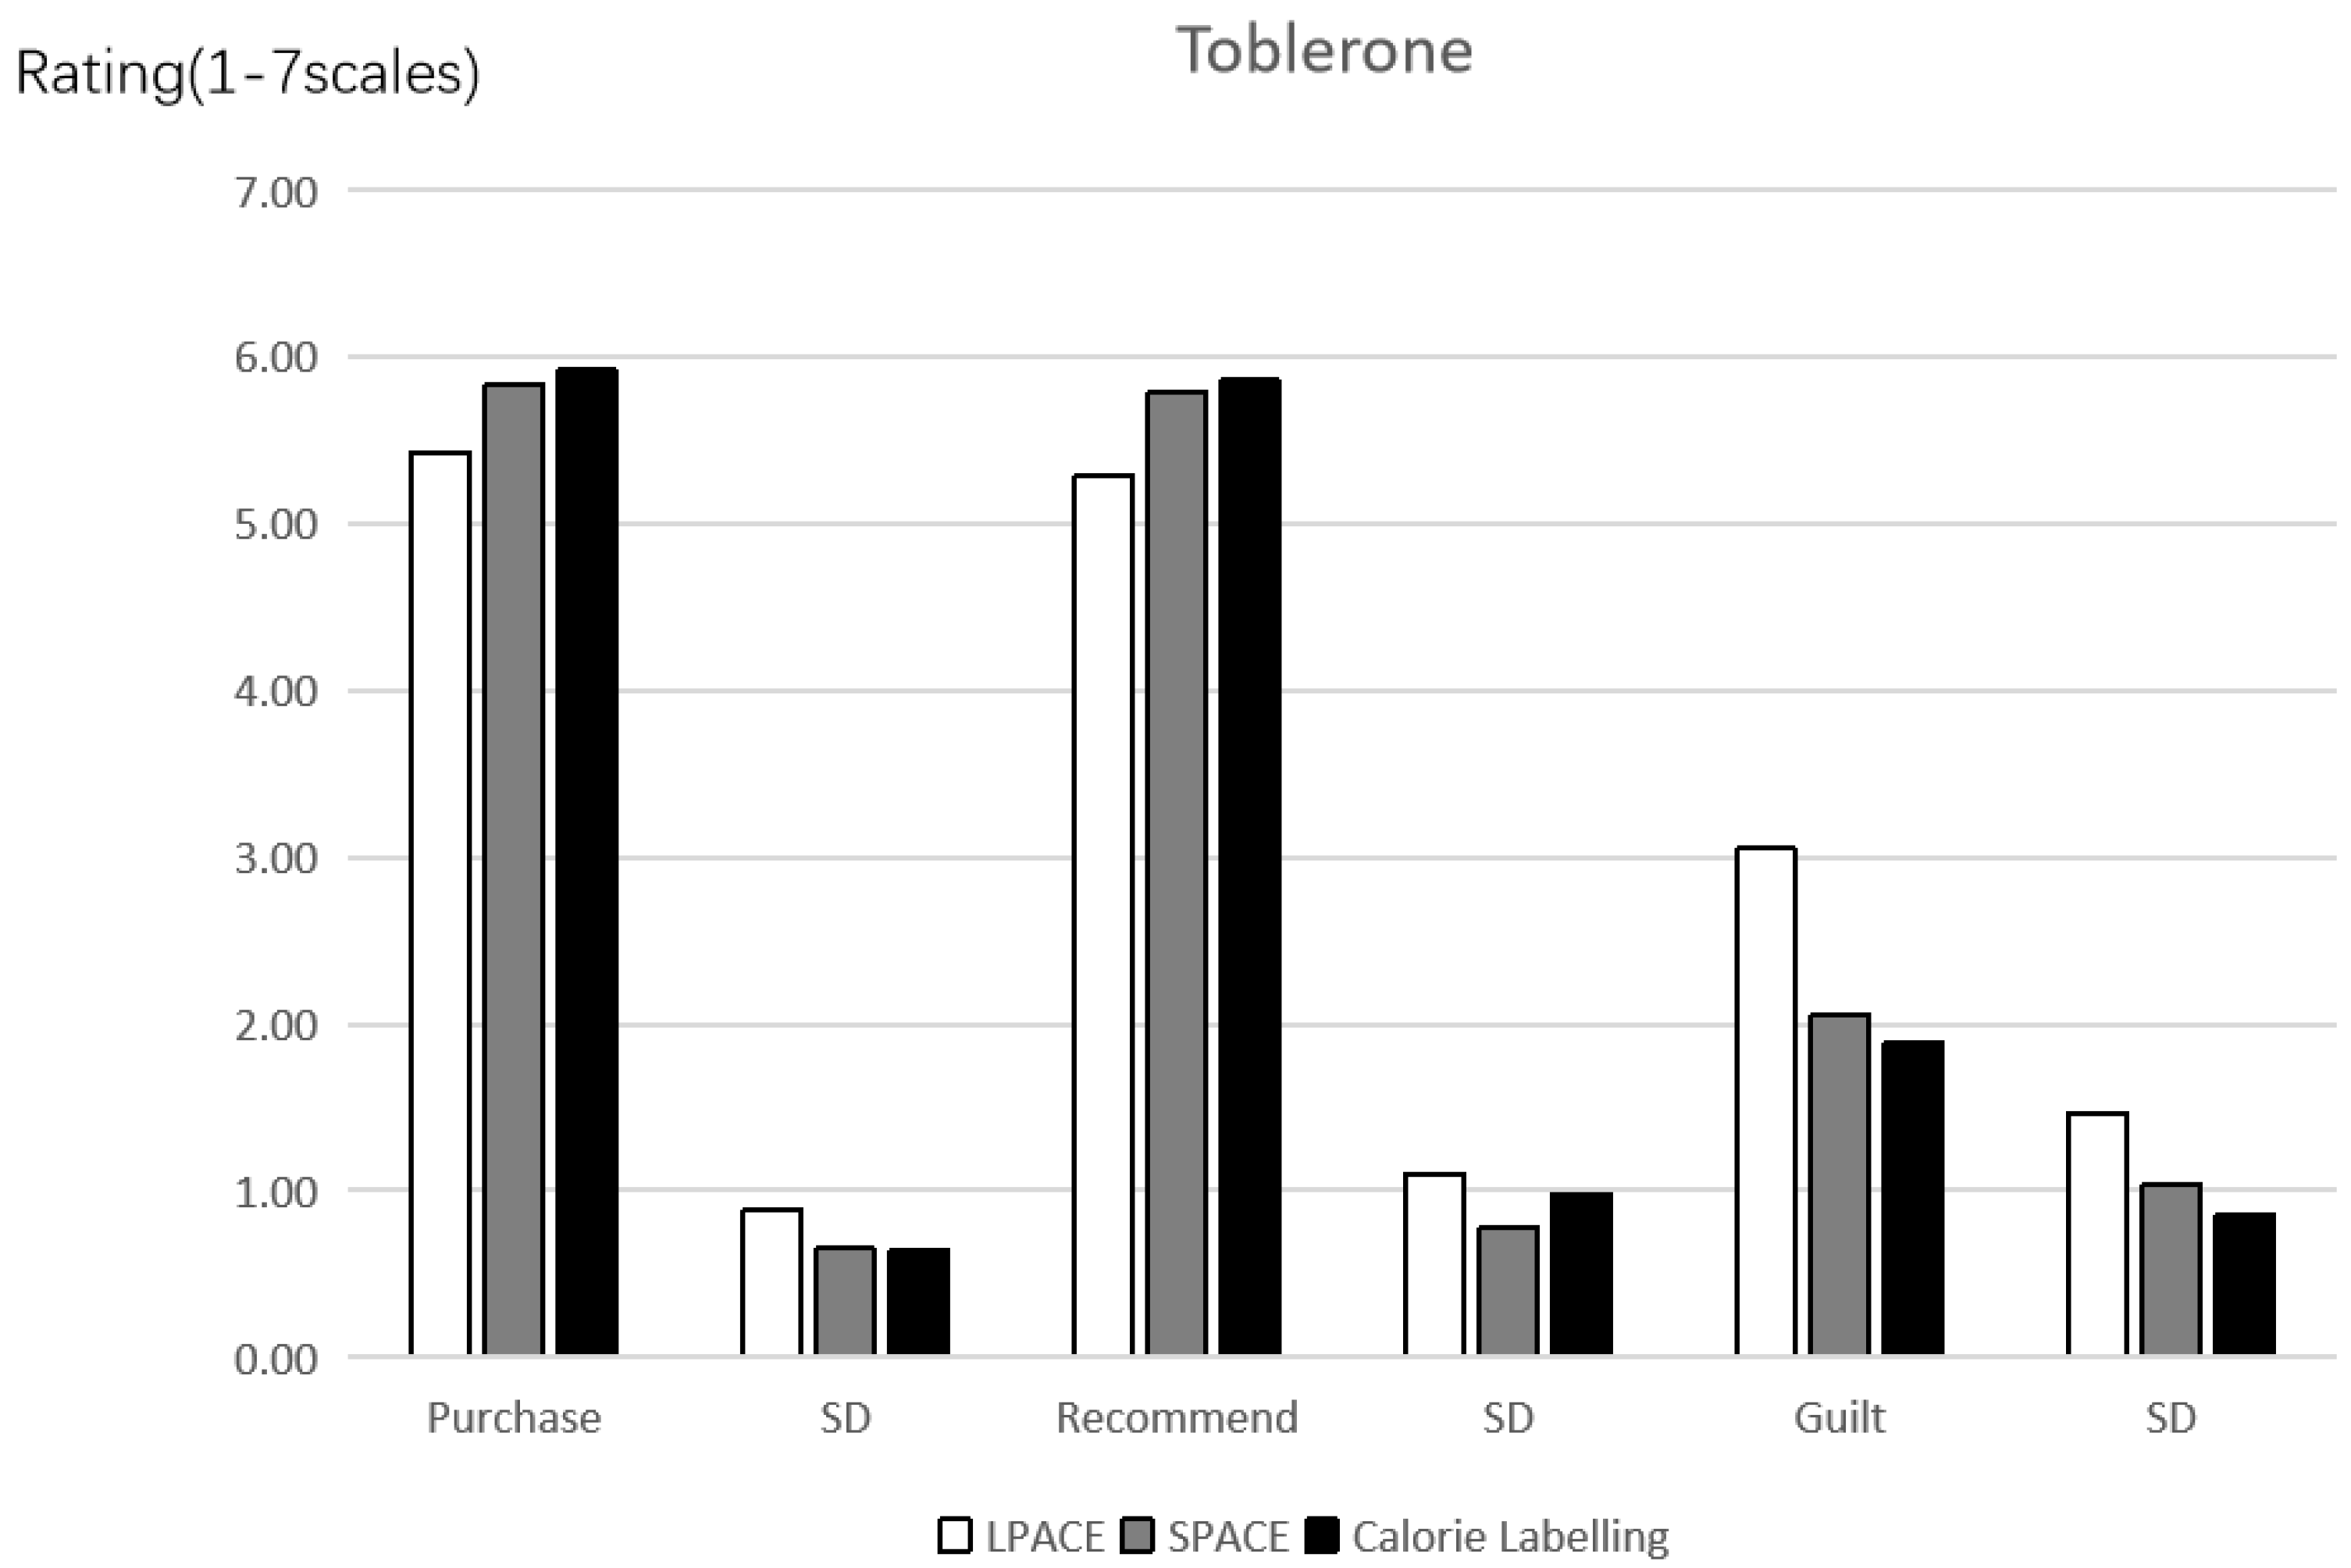
| 2 | H1 & H2 | Intergroup: label (LPACE vs. SPACE vs. calories) | Recommendation intention, Emotions (except guilt) | chocolate | Walk vs. swimming |
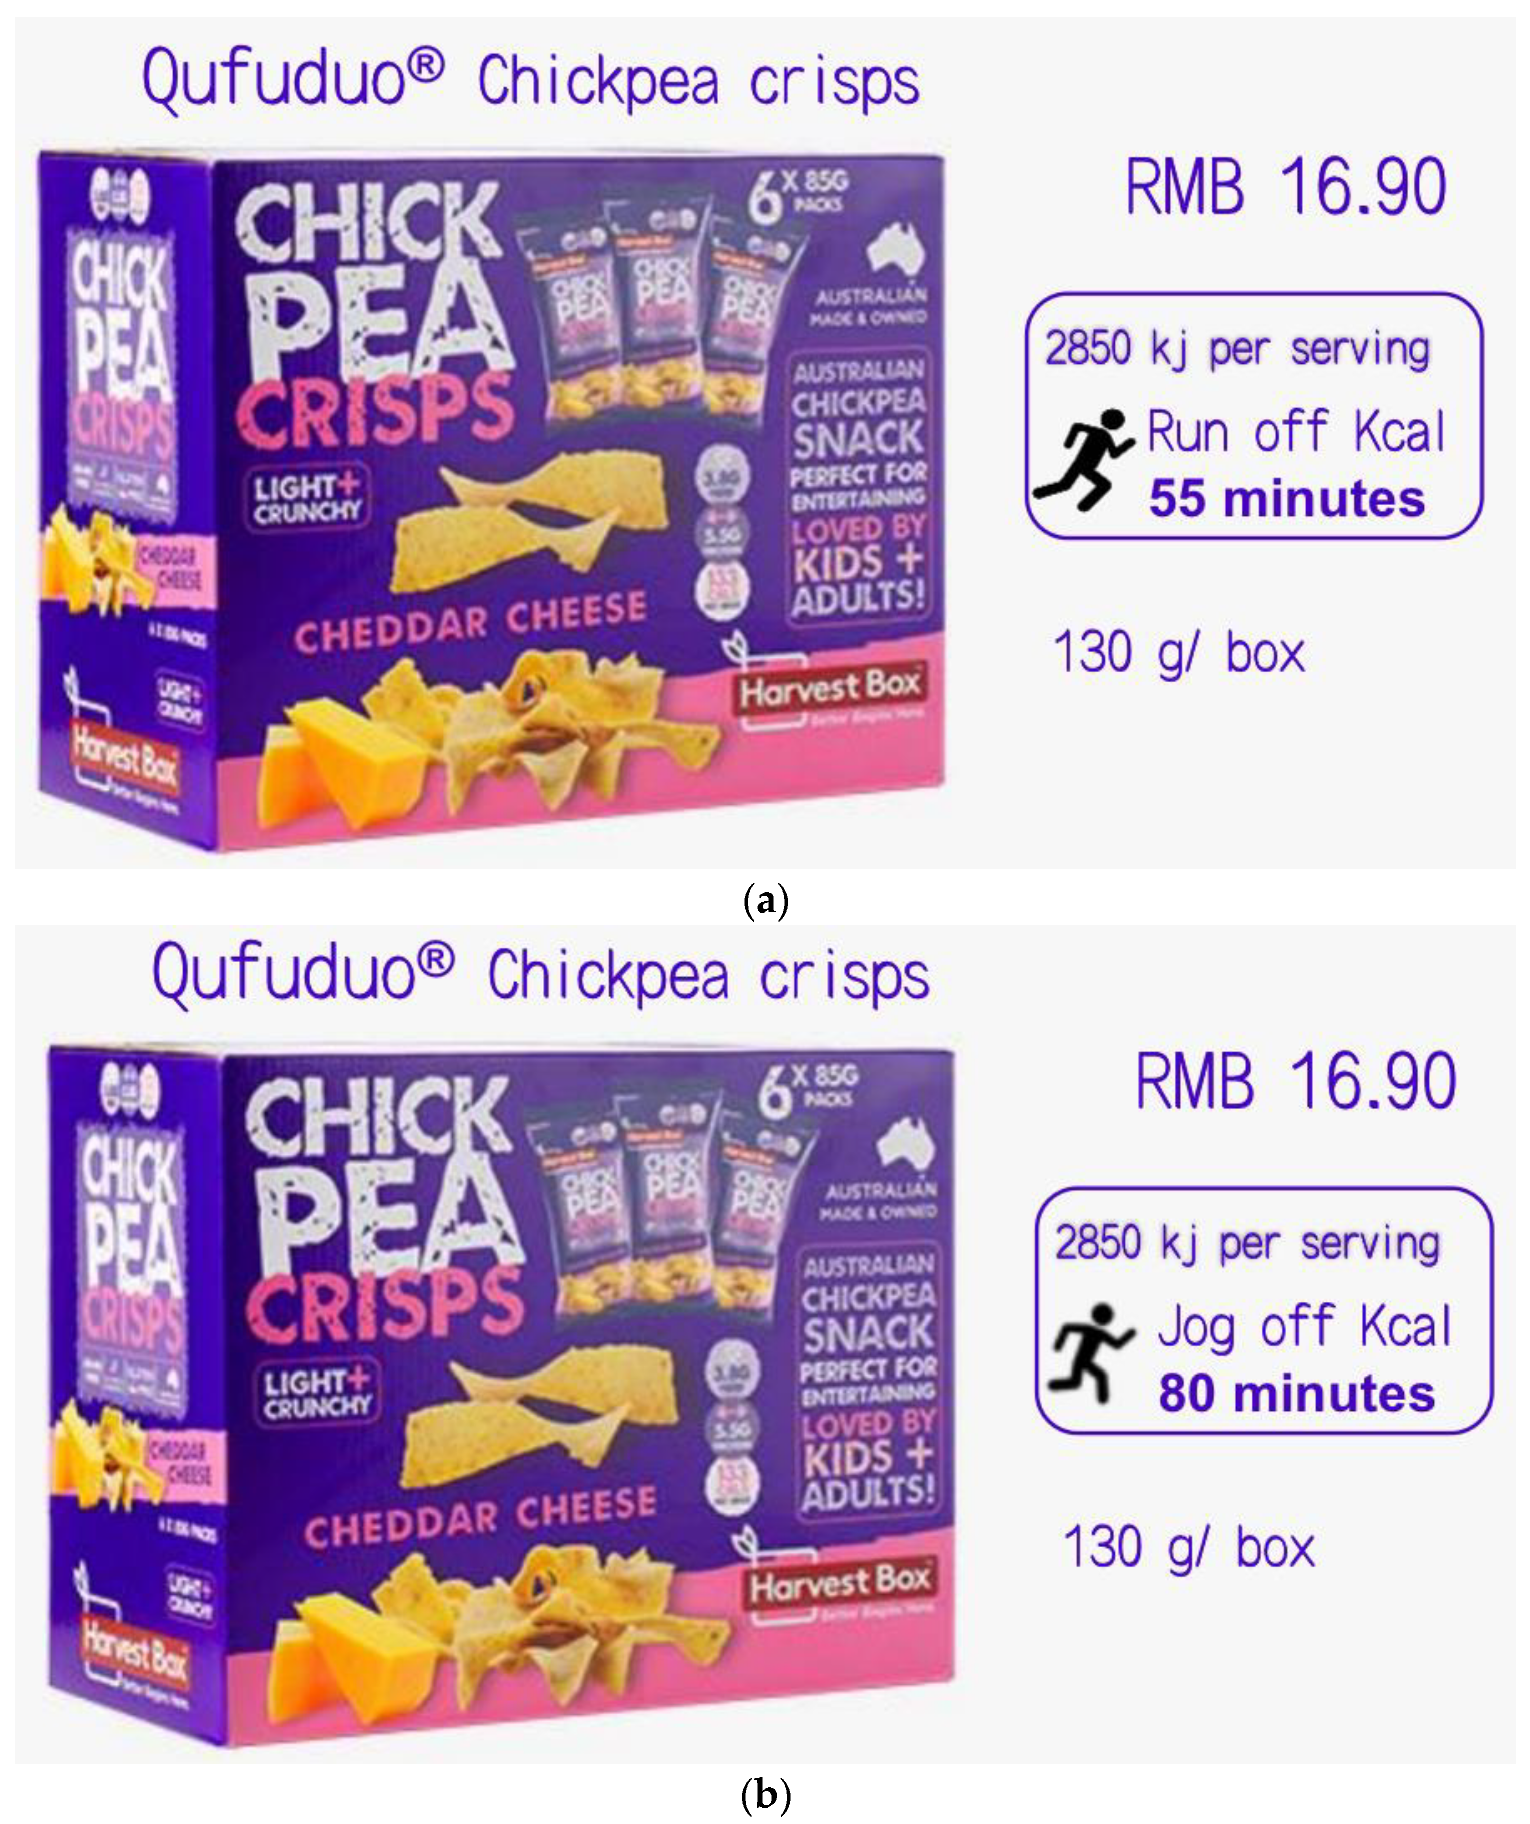
| 3 | H1 & H2 | Intergroup: label (LPACE + calories vs. SPACE + calories) | Purchase intention, Recommendation intention, Demographic | Chickpea crisps | Jogging vs. running |
| 4 | H1 & H2 & H3 | Intergroup: 2 labels (LPACE vs. SPACE) × 2 future self-continuity (high vs. Low) | Perceived value, Involvement in food choices | cookies | Walk vs. rope skipping |
| Socio-Demographic Indicators | Study 1 | Study 2 | Study 3 | Study 4 | |
|---|---|---|---|---|---|
| Variable | Definitions | Percentage | Percentage | Percentage | Percentage |
| Gender | Male | 43.5% | 57.0% | 42.9% | 51.7% |
| Female | 56.5% | 43.0% | 57.1% | 48.3% | |
| Age | ≤20 years old | 3.2% | 2.6% | 8.1% | 2.6% |
| 21–30 years old | 67.6% | 71.7% | 53.5% | 67.2% | |
| 31–40 years old | 22.2% | 24.3% | 29.7% | 27.6% | |
| ≥41 years old | 6.9% | 1.3% | 8.8% | 2.6% | |
| Education | Senior high school and below | 4.2% | 1.7% | 7.7% | 2.2% |
| junior college | 17.1% | 11.7% | 11.0% | 12.5% | |
| bachelor’s degree | 70.4% | 76.1% | 69.6% | 75.9% | |
| post-graduate degree and above | 8.3% | 10.4% | 11.7% | 9.5% | |
| disposable income | 2000 yuan and below | 7.9% | 8.3% | 19.0% | 9.5% |
| 2001–4000 yuan | 25.0% | 20.0% | 20.1% | 24.6% | |
| 4001–6000 yuan | 34.7% | 23.0% | 21.2% | 34.9% | |
| 6001 yuan and above | 32.4% | 48.7% | 39.6% | 31.0% | |
| BMI | ≤18.4 | 17.6% | 12.6% | 14.7% | 14.2% |
| 18.5–23.9 | 69.9% | 70.9% | 67.7% | 73.7% | |
| ≥24.0 | 12.5% | 16.5% | 17.6% | 12.1% | |
| Valid sample size | 216 | 230 | 273 | 232 | |
Publisher’s Note: MDPI stays neutral with regard to jurisdictional claims in published maps and institutional affiliations. |
© 2022 by the authors. Licensee MDPI, Basel, Switzerland. This article is an open access article distributed under the terms and conditions of the Creative Commons Attribution (CC BY) license (https://creativecommons.org/licenses/by/4.0/).
Share and Cite
Huang, Y.; Yang, X.; Chen, Q. The Negative Effects of Long Time Physical Activity Calorie Equivalent Labeling on Purchase Intention for Unhealthy Food. Int. J. Environ. Res. Public Health 2022, 19, 3463. https://doi.org/10.3390/ijerph19063463
Huang Y, Yang X, Chen Q. The Negative Effects of Long Time Physical Activity Calorie Equivalent Labeling on Purchase Intention for Unhealthy Food. International Journal of Environmental Research and Public Health. 2022; 19(6):3463. https://doi.org/10.3390/ijerph19063463
Chicago/Turabian StyleHuang, Yuanhao, Xiaoke Yang, and Qian Chen. 2022. "The Negative Effects of Long Time Physical Activity Calorie Equivalent Labeling on Purchase Intention for Unhealthy Food" International Journal of Environmental Research and Public Health 19, no. 6: 3463. https://doi.org/10.3390/ijerph19063463
APA StyleHuang, Y., Yang, X., & Chen, Q. (2022). The Negative Effects of Long Time Physical Activity Calorie Equivalent Labeling on Purchase Intention for Unhealthy Food. International Journal of Environmental Research and Public Health, 19(6), 3463. https://doi.org/10.3390/ijerph19063463