
Analysis of Adolescent Physical Activity Levels and Their Relationship with Body Image and Nutritional Habits

 ,
, 
 and
and 
Abstract
1. Introduction
2. Materials and Methods
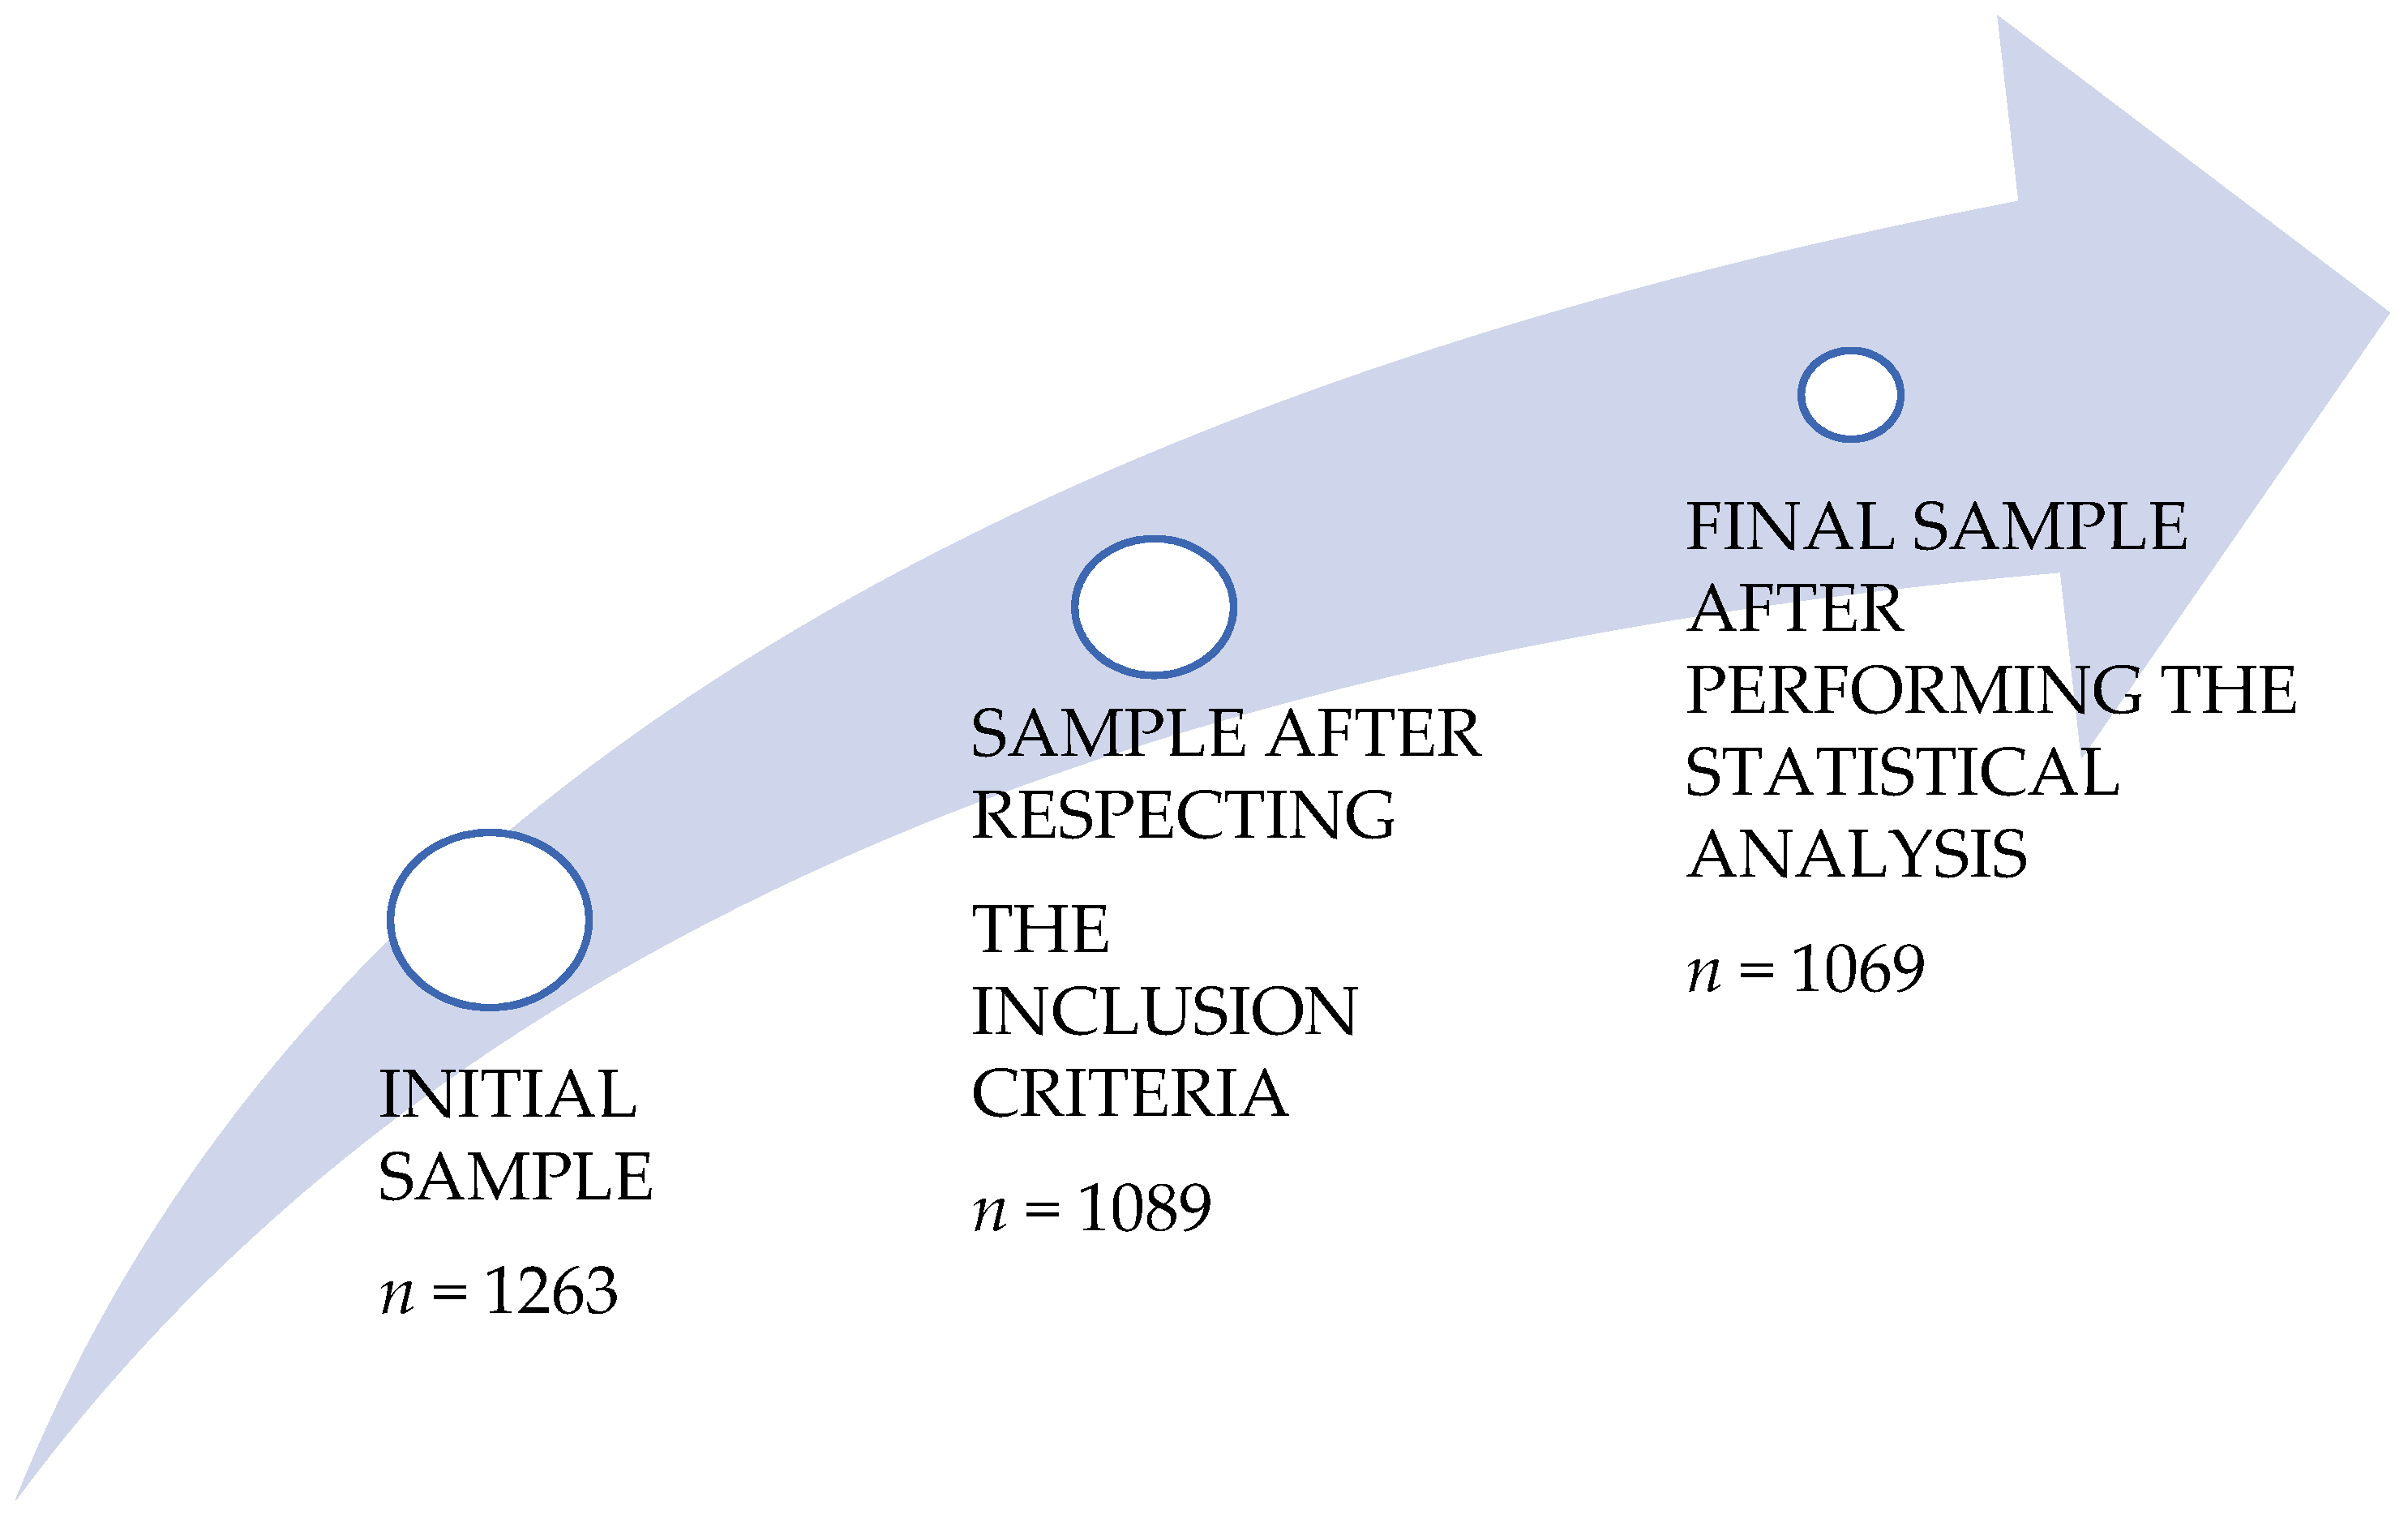
2.1. Sample
2.2. Design and Instruments
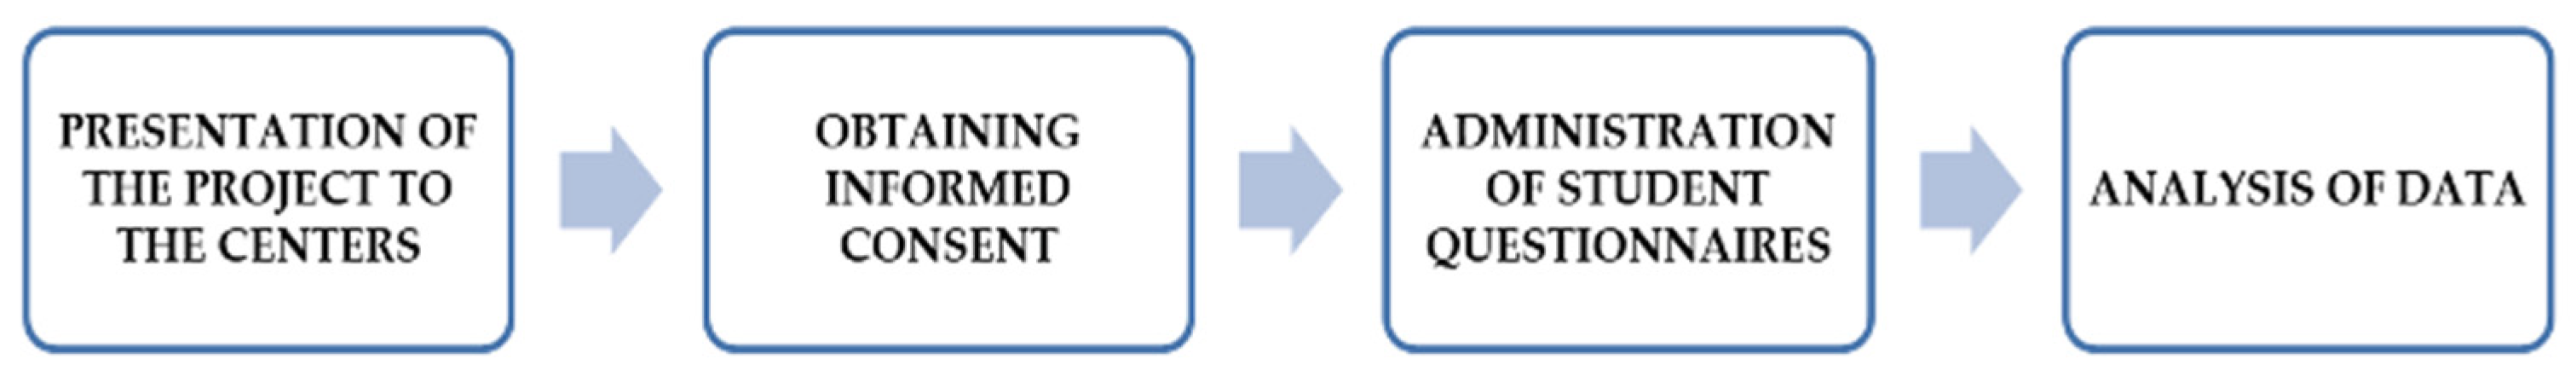
2.3. Procedure
2.4. Statistical Analysis
3. Results
3.1. Descriptive Statistics, Reliability and Correlations
3.2. Cluster Analysis to Obtain Physical Activity Profiles
3.3. Difference Analysis among Clusters
3.4. Differences in Physical Activity Profiles According to Gender
4. Discussion
5. Conclusions
Author Contributions
Funding
Institutional Review Board Statement
Informed Consent Statement
Data Availability Statement
Conflicts of Interest
References
- Lizandra, J.; Gregori-Font, M. Study of eating habits, physical activity, socioeconomic status and sedentary lifestyle in adolescents in the city of Valencia. Rev. Esp. Nutr. Hum. Diet. 2021, 25, 199–211. [Google Scholar] [CrossRef]
- Arnett, J.J. Adolescence and Emerging Adulthood: A Cultural Approach, 3rd ed.; Pearson Education: London, UK, 2008. [Google Scholar]
- Duno, M.; Acosta, E. Body image perception among university adolescents. Rev. Chil. Nutr. 2019, 46, 545–553. [Google Scholar] [CrossRef]
- Gallego, R.M.; Gallego, I.M.; Pérez, J.A.F.; Rodríguez, P.G.; Cordeiro, M.F.; Reneda, A.R.; Cotelo, N.V.; Rodríguez, N.F.A.; Echevarría, I.R. Analysis of nutritional habits and physical activity among adolescent students. RIVACANGAS. Rev. Esp. Nutr. Comunitaria 2017, 23, 447–455. [Google Scholar]
- Inchley, J.; Currie, D.; Budisavljevic, S.; Torsheim, T.; Jåstad, A.; Cosma, A.; Kelly, C.; Arnarsson, Á.M.; Barnekow, V.; Weber, M.M. (Eds.) Spotlight on Adolescent Health and Well-Being. Findings from the 2017/2018 Health Behaviour in School-Aged Children (HBSC) Survey in Europe and Canada. International report. Volume 1. Key Findings; WHO Regional Office for Europe: Copenhagen, Denmark, 2020; Available online: http://apps.who.int/iris (accessed on 23 November 2021).
- Aranceta-Bartrina, J.; Gianzo-Citores, M.; Pérez-Rodrigo, C. Prevalence of overweight, obesity and abdominal obesity in the Spanish population aged 3 to 24 years. The ENPE study. Rev. Esp. Cardiol. 2020, 73, 290–299. [Google Scholar] [CrossRef] [PubMed]
- Martínez-Gómez, D.; Eisenmann, J.C.; Gómez-Martínez, S.; Veses, A.; Marcos, A.; Veiga, O. Sedentary lifestyle, adiposity and cardiovascular risk factors in adolescents. AFINOS study. Rev. Esp. Cardiol. 2010, 63, 277–285. [Google Scholar] [CrossRef]
- Bawaked, A.R.; Fernández-Barrés, S.; Navarrete-Muñoz, E.M.; González-Palacios, S.; Guxens, M.; Irizar, A.; Lertxundi, A.; Sunyer, J.; Vioque, J.; Schröder, H.; et al. Impact of lifestyle behaviors in early childhood on obesity and cardiometabolic risk in children: Results from the Spanish INMA birth cohort study. Pediatr. Obes. 2020, 15, e12590. [Google Scholar] [CrossRef]
- Escalante, Y. Physical activity, physical exercise and physical condition in the field of public health. Rev. Esp. Salud Pública 2011, 84, 325–328. [Google Scholar] [CrossRef] [PubMed]
- Sanz-Martín, D. Levels of moderate-vigorous physical activity of adolescents from the municipality of Soria. Sportis 2017, 3, 100–122. [Google Scholar] [CrossRef][Green Version]
- Valencia-Peris, A. Physical Activity and Sedentary Use of Screen Technology Media in Adolescents. Doctoral Thesis, University of Valencia, Valencia, Spain, 2013. [Google Scholar]
- Enríquez Peralta, R.E.; Quintana, M. Self-perception of body image and practices to correct it in adolescents of an educational institution, Lima-Peru. An. Fac. Med. 2016, 77, 117–122. [Google Scholar] [CrossRef]
- Rodríguez, D.; Alvis, K. Generalities of body image and its implications in sports. J. Fac. Med. 2015, 63, 279–287. [Google Scholar]
- Castro Lemus, N. Re-conceptualization of the body image construct from a multidisciplinary. Arbo 2016, 192, 353. [Google Scholar] [CrossRef][Green Version]
- Vaquero-Cristóbal, R.; Alacid, F.; Muyor, J.M.; López-Miñarro, P.Á. Body image; literature review. Nutr. Hosp. 2013, 28, 27–35. [Google Scholar] [CrossRef]
- Santana, M.L.; Silva, R.C.; Assis, A.M.; Raich, R.M.; Machado, M.E.; de J. Pinto, E.; de Moraes, L.T.; da C. Ribeiro Júnior, H. Factors associated with body image dissatisfaction among adolescents in public schools students in Salvador, Brazil. Nutr. Hosp. 2013, 28, 747–755. [Google Scholar] [CrossRef] [PubMed]
- Fortes, L.S.; Amaral, A.C.; Almeida, S.S.; Ferreira, M.E. Effects of psychological, morphological and sociodemographic variables on adolescents’ eating behavior. Rev. Paul. Pediatr. 2013, 31, 182–188. [Google Scholar] [CrossRef] [PubMed][Green Version]
- Farrow, C.V.; Fox, C.L. Gender differences in the relationships between bullying at school and unhealthy eating and shape-related attitudes and behaviours. Br. J. Educ. Psychol. 2011, 81 Pt 3, 409–420. [Google Scholar] [CrossRef]
- Xanthopoulos, M.S.; Borradaile, K.E.; Hayes, S.; Sherman, S.; Vander Veur, S.; Grundy, K.M.; Nachmani, J.; Foster, G.D. The impact of weight, sex, and race/ethnicity on body dissatisfaction among urban children. Body Image 2011, 8, 385–389. [Google Scholar] [CrossRef] [PubMed]
- Bully, P.; Elosua, P. Changes in body dissatisfaction relative to gender and age: The modulating character of BMI. Span. J. Psychol. 2011, 14, 313–322. [Google Scholar] [CrossRef]
- Jiménez Flores, P.; Jiménez Cruz, A.; Bacardi Gascón, M. Body-image dissatisfaction in children and adolescents: A systematic review. Nutr. Hosp. 2017, 34, 479–489. [Google Scholar] [CrossRef] [PubMed]
- Babic, M.J.; Morgan, P.J.; Plotnikoff, R.C.; Lonsdale, C.; White, R.L.; Lubans, D.R. Physical activity and physical self-concept in youth: Systematic review and meta-analysis. Sports Med. 2014, 44, 1589–1601. [Google Scholar] [CrossRef]
- Niswah, I.; Rah, J.H.; Roshita, A. The association of body image perception with dietary and physical activity behaviors among adolescents in Indonesia. Food Nutr. Bull. 2021, 42 (Suppl. 1), S109–S121. [Google Scholar] [CrossRef] [PubMed]
- Tapia-Serrano, M.A.; Sevil-Serrano, J.; Sánchez-Oliva, D.; Vaquero-Solís, M.; Sánchez-Miguel, P.A. Effects of a school-based intervention on physical activity, sleep duration, screen time, and diet in children. Rev. Psicodidáctica 2022, 27, 56–65. [Google Scholar] [CrossRef]
- Sevil-Serrano, J.; Aibar-Solana, A.; Abós, Á.; Julián, J.A.; García-González, L. Healthy or unhealthy? The cocktail of health-related behavior profiles in spanish adolescents. Int. J. Environ. Res. Public Health 2019, 16, 3151. [Google Scholar] [CrossRef] [PubMed]
- Craig, C.L.; Marshall, A.L.; Sjöström, M.; Bauman, A.E.; Booth, M.L.; Ainsworth, B.E.; Pratt, M.; Ekelund, U.; Yngve, A.; Sallis, J.F.; et al. International physical activity questionnaire: 12-Country reliability and validity. Med. Sci. Sports Exerc. 2003, 35, 1381–1395. [Google Scholar] [CrossRef] [PubMed]
- Orbach, I.; Mikulincer, M. The body investment scale: Construction and validation of a body experience scale. Psychol. Assess. 1998, 10, 415–425. [Google Scholar] [CrossRef]
- Field, A. Discoring Statistics Using IBM SPSS Statistics, 5th ed.; SAGE Publications: London, UK, 2017. [Google Scholar]
- Chen, T.J.; Watson, K.B.; Michael, S.L.; Carlson, S.A. Sex-stratified trends in meeting physical activity guidelines, participating in sports, and attending physical education among US adolescents, youth risk behavior survey 2009–2019. J. Phys. Act. Health 2021, 18, S102–S113. [Google Scholar] [CrossRef] [PubMed]
- Marques, A.; Henriques-Neto, D.; Peralta, M.; Martins, J.; Demetriou, Y.; Schönbach, D.M.I.; Gaspar de Matos, M. Prevalence of physical activity among adolescents from 105 low, middle, and high-income countries. Int. J. Environ. Res. Public Health 2020, 17, 3145. [Google Scholar] [CrossRef] [PubMed]
- Steene-Johannessen, J.; Hansen, B.H.; Dalene, K.E.; Kolle, E.; Northstone, K.; Møller, N.C.; Grøntved, A.; Wedderkopp, N.; Kriemler, S.; Page, A.S.; et al. Variations in accelerometry measured physical activity and sedentary time across Europe—harmonized analyses of 47,497 children and adolescents. Int. J. Behav. Nutr. Phys. Act. 2020, 17, 38. [Google Scholar] [CrossRef] [PubMed]
- Woods, C.B.; Crowley, E.; Powell, C.; O’Brien, W.; Murphy, M.H.; Belton, S.; Saunders, J.; Connolly, S.; Farmer, O.; Ng, K. Socio-ecological correlates of physical activity in a nationally representative sample of adolescents across Ireland and Northern Ireland. Prev. Med. Rep. 2021, 23, 101472. [Google Scholar] [CrossRef] [PubMed]
- Ruiz, J.R.; Ortega, F.B.; Martínez-Gómez, D.; Labayen, I.; Moreno, L.A.; De Bourdeaudhuij, I.; Manios, Y.; González-Gross, M.; Mauro, B.; Molnar, D.; et al. Objectively measured physical activity and sedentary time in European adolescents: The HELENA study. Am. J. Epidemiol. 2011, 174, 173–184. [Google Scholar] [CrossRef]
- Beale, N.; Eldridge, E.; Delextrat, A.; Esser, P.; Bushnell, O.; Curtis, E.; Wassenaar, T.; Wheatley, C.; Johansen-Berg, H.; Dawes, H. Exploring activity levels in physical education lessons in the UK: A cross-sectional examination of activity types and fitness levels. BMJ Open Sport Exerc. Med. 2021, 7, e000924. [Google Scholar] [CrossRef]
- Farooq, A.; Martin, A.; Janssen, X.; Wilson, M.G.; Gibson, A.M.; Hughes, A.; Reilly, J.J. Longitudinal changes in moderate-to-vigorous-intensity physical activity in children and adolescents: A systematic review and meta-analysis. Obes. Rev. 2020, 21, e12953. [Google Scholar] [CrossRef] [PubMed]
- Kirchengast, S.; Marosi, A. Gender differences in body composition, physical activity, eating behavior and body image among normal weight adolescents—an evolutionary approach. Coll. Antropol. 2008, 32, 1079–1086. [Google Scholar] [PubMed]
- Aubert, S.; Brazo-Sayavera, J.; González, S.A.; Janssen, I.; Manyanga, T.; Oyeyemi, A.L.; Picard, P.; Sherar, L.B.; Turner, E.; Tremblay, M.S. Global prevalence of physical activity for children and adolescents; inconsistencies, research gaps, and recommendations: A narrative review. Int. J. Behav. Nutr. Phys. 2021, 18, 81. [Google Scholar] [CrossRef] [PubMed]
- Lim, J.; Kim, J.S.; Park, S.; Lee, O.; So, W.Y. Relationship of physical activity and sedentary time with metabolic health in children and adolescents measured by accelerometer: A narrative review. Healthcare 2021, 9, 709. [Google Scholar] [CrossRef] [PubMed]
- Hay, J.; Maximova, K.; Durksen, A.; Carson, V.; Rinaldi, R.L.; Torrance, B.; Ball, G.D.C.; Majumdar, S.R.; Plotnikoff, R.C.; Veugelers, P.; et al. Physical activity intensity and cardiometabolic risk in youth. Arch. Pediatr. Adolesc. Med. 2012, 166, 1022–1029. [Google Scholar] [CrossRef]
- Lopes, L.; Santos, R.; Coelho-e-Silva, M.; Draper, C.; Mota, J.; Jidovtseff, B.; Clark, C.; Schmidt, M.; Morgan, P.; Duncan, M.; et al. A narrative review of motor competence in children and adolescents: What we know and what we need to find out. Int. J. Environ. Res. Public Health 2020, 18, 18. [Google Scholar] [CrossRef]
- Costigan, S.A.; Lubans, D.R.; Lonsdale, C.; Sanders, T.; del Pozo Cruz, B. Associations between physical activity intensity and well-being in adolescents. Prev. Med. 2019, 125, 55–61. [Google Scholar] [CrossRef]
- Steele, R.M.; van Sluijs, E.M.; Cassidy, A.; Griffin, S.J.; Ekelund, U. Targeting sedentary time or moderate-and vigorous-intensity activity: Independent relations with adiposity in a population-based simple of 10-y-old British children. Am. J. Clin. Nutr. 2009, 90, 1185–1192. [Google Scholar] [CrossRef]
- Janssen, I.; LeBlanc, A.G. Systematic review of the health benefits of physical activity and fitness in school-age children and youth. Int. J. Behav. Nutr. Phys. Act. 2010, 7, 40. [Google Scholar] [CrossRef]
- García-Artero, E.; Ortega, F.B.; Ruiz, J.; Mesa, J.L.; Delgado-Fernández, M.; González-Gross, M.; García Fuentes, M.; Vicente-Rodríguez, G.; Gutiérrez, A.; Castillo, M.J. The lipid-metabolic profile in adolescents is more influenced by physical condition than by physical activity (AVENA study). Rev. Esp. Cardiol. 2007, 60, 581–588. [Google Scholar] [CrossRef]
- Ndagire, C.T.; Muyonga, J.H.; Nakimbugwe, D. Fruit and vegetable consumption, leisure-time physical activity, and sedentary behavior among children and adolescent students in Uganda. Food Sci. Nutr. 2019, 7, 599–607. [Google Scholar] [CrossRef] [PubMed]
- Ibarra Mora, J.; Ventura-Vall-Llovera, C.; Hernández Mosqueira, C. Level of physical activity, eating habits, and their relationship with academic performance in adolescent students at COMEDUC foundation, Chile. J. Phys. Educ. Sport 2019, 19, 2397–2404. [Google Scholar] [CrossRef]
- Mera-Mamián, A.Y.; Tabares González, E.; Montoya-González, S.; Muñoz Rodríguez, D.; Monsalve, F. Practical recommendations to avoid physical deconditioning during confinement due to the pandemic associated with COVID-19. Univ. Salud 2020, 22, 166–177. [Google Scholar] [CrossRef]
- Matzkin, V.; Maldini, A.; Gutiérrez, R.P. Eating patterns before and during the COVID-19 pandemic in a group of children from La Pampa. Actual Nutr. 2021, 22, 35–43. [Google Scholar]
- Mendoza-Balcazar, J.; Biler-Reyes, S.A.; Macías-Vera, M.Y.; del Carmen Ormaza-Esmeraldas, E. Socio-economic factors and their effects on eating habits during the Covid-19 pandemic year 2020–2021 in the City of Manta. FIPCAEC 2021, 6, 3–17. [Google Scholar] [CrossRef]
- Fantineli, E.R.; Silva, M.P.D.; Campos, J.G.; Malta Neto, N.A.; Pacífico, A.B.; Campos, W. Body image among adolescents: The association between nutritional status and physical activity. Cien. Saude Colet. 2020, 25, 3989–4000. [Google Scholar] [CrossRef]
- Jankauskiene, R.; Baceviciene, M. Body image concerns and body weight overestimation do not promote healthy behaviour: Evidence from adolescents in Lithuania. Int. J. Environ. Res. Public Health 2019, 16, 864. [Google Scholar] [CrossRef]
- Taylor, S.E. Health Psychology, 10th ed.; McGraw-Hill Education: New York, NY, USA, 2007. [Google Scholar]
- Escolar, M.; Martínez, M.; González, M.; Medina, M.; Mercado, E.; Lara, F. Risk factors of eating disorders among university students: Estimation of vulnerability by age. J. Mex. Food Disor. 2017, 8, 105–112. [Google Scholar] [CrossRef]
- Ricciardelli, L.A.; Mccabe, M.P.; Holt, K.E.; Finemore, J. A biopsychosocial model for understanding body image and body change strategies among children. Appl. Dev. Psychol. 2003, 24, 475–495. [Google Scholar] [CrossRef]
- Miranda, V.P.; Amorim, P.R.S.; Bastos, R.R.; Souza, V.G.; Faria, E.R.; Franceschini, S.C.; Teixeira, P.C.; de Morais, N.S.; Priore, S.E. Body image disorders associated with lifestyle and body composition of female adolescents. Public Health Nutr. 2021, 24, 95–105. [Google Scholar] [CrossRef]
- Tebar, W.R.; Canhin, D.S.; Colognesi, L.A.; Morano, A.E.V.A.; Silva, D.T.C.; Christofaro, D.G.D. Body dissatisfaction and its association with domains of physical activity and of sedentary behavior in a sample of 15,632 adolescents. Int. J. Adolesc. Med. Health 2020, 33, 539–546. [Google Scholar] [CrossRef] [PubMed]
- Spencer, R.A.; Rehman, L.; Kirk, S.F. Understanding gender norms, nutrition, and physical activity in adolescent girls: A scoping review. Int. J. Behav. Nutr. Phys. Act. 2015, 12, 6. [Google Scholar] [CrossRef]
- Martínez Gómez, D.; Veiga Núñez, O.L. Body Dissatisfaction in Adolescents: Relationships with Physical Activity and Body Mass Index. Rev. Int. Med. Cienc. Act. Fís. Deporte 2007, 7, 253–265. Available online: http://cdeporte.rediris.es/revista/revista27/artinsatisfaccion41e.htm (accessed on 17 November 2021).
- Cruz, S.; Maganto, M. Body mass index, concern about thinness and body satisfaction in adolescents. Rev. Psicol. Gral. Aplic. 2002, 55, 455–473. [Google Scholar]
- Ayensa, J.I.B.; Guillén Grima, F.; Garrido Landívar, E. Body dissatisfaction in adolescents measured with the Body Shape Questionnaire (BSQ). Effect of anonymity, gender and age. Int. J. Clin. Health 2002, 2, 439–450. [Google Scholar]
- Silva, L.P.R.D.; Tucan, A.R.O.; Rodrigues, E.L.; Del Ré, P.V.; Sanches, P.M.A.; Bresan, D. Dissatisfaction about body image and associated factors: A study of young undergraduate students. Einstein 2019, 17, eAO4642. [Google Scholar] [CrossRef]
- Cafri, G.; Thompson, J.K. Measuring male body image: A review of the current methodology. Psychol. Men. Masc. 2004, 5, 18–29. [Google Scholar] [CrossRef]
- Pallan, M.J.; Hiam, L.C.; Duda, J.L.; Adab, P. Body image, body dissatisfaction and weight status in South Asian children: A cross-sectional study. BMC Public Health 2011, 11, 21. [Google Scholar] [CrossRef]
- Xu, X.; Mellor, D.; Kiehne, M.; Ricciardelli, L.A.; McCabe, M.P.; Xu, Y. Body dissatisfaction, engagement in body change behaviors and sociocultural influences on body image among Chinese adolescents. Body Image 2010, 7, 156–164. [Google Scholar] [CrossRef] [PubMed]
- Trejo Ortiz, P.M.; Castro Veloz, D.; Facio Solís, A.; Mollinedo Montano, F.E.; Valdez Esparza, G. Disatisfaction with de body shape associated to the Body Mass Index in adolescents. Rev. Cubana Enfermer. 2010, 26, 144–154. [Google Scholar]
- Gehrman, C.A.; Hovell, M.F.; Sallis, J.F.; Keating, K. The effects of a physical activity and nutrition intervention on body dissatisfaction, drive for thinness, and weight concerns in pre-adolescents. Body Image 2006, 3, 345–351. [Google Scholar] [CrossRef] [PubMed]
- Dias, S.S.; Lages, M.; Frontini, R.; Luís, L.; Dixe, M.D.A.; Sousa, P. Association between food choices motivators and physical activity in body image (dis)satisfaction in portuguese adolescents. Front. Public Health 2021, 9, 651228. [Google Scholar] [CrossRef] [PubMed]
- Molina-García, J. Recommendations about plysical activity and contexts of intervention at school age: The role of the educational center. In The Eight Areas of Health Education at School. Comsal Project; Catalan, V.G., Ed.; Tirant Humanities: Valencia, Spain, 2016. [Google Scholar]
- González Gallego, J. Towards a physiology of sedentary lifestyle. Arch. Med. Deporte 2013, 30, 74–75. [Google Scholar]


| R | M | SD | A | K | 2 | 3 | 4 | 5 | 6 | 7 | 8 | 9 | 10 | 11 | 12 | 13 | ||
|---|---|---|---|---|---|---|---|---|---|---|---|---|---|---|---|---|---|---|
| 1 | Fruit consumption | 1–7 | 4.53 | 1.86 | −0.167 | −1.143 | 0.505 ** | −0.048 | −0.042 | 0.351 ** | 0.310 ** | 0.006 | 0.327 ** | −0.002 | 0.111 ** | 0.106 ** | 0.105 ** | 0.080 ** |
| 2 | Vegetables and greens consumption | 1–7 | 4.57 | 1.83 | −0.200 | −1.050 | - | −0.019 | −0.001 | 0.230 ** | 0.299 ** | −0.025 | 0.338 ** | −0.052 | 0.080 ** | 0.010 | 0.052 | 0.072 * |
| 3 | Sugary drinks consumption | 1–7 | 2.72 | 1.80 | 0.991 | −0.035 | - | 0.421 ** | 0.208 ** | 0.109 ** | 0.485 ** | 0.081 ** | 0.312 ** | 0.090 ** | −0.017 | 0.009 | −0.026 | |
| 4 | Sweets and candies consumption | 1–7 | 2.95 | 1.62 | 0.809 | −0.118 | - | 0.100 ** | 0.098 ** | 0.530 ** | 0.003 | 0.316 ** | 0.097 ** | −0.075 * | −0.039 | −0.068 * | ||
| 5 | Natural juice consumption | 1–7 | 3.66 | 1.97 | 0.264 | −1.147 | - | −0.401 ** | 0.209 ** | 0.305 ** | 0.151 ** | 0.156 ** | 0.088 ** | 0.077 * | 0.072 * | |||
| 6 | Dried fruit consumption | 1–7 | 3.45 | 1.87 | 0.434 | −0.953 | - | 0.238 ** | 0.327 ** | 0.143 ** | 0.129 ** | 0.071 * | 0.106 * | 0.084 ** | ||||
| 7 | French fries consumption | 1–7 | 2.198 | 1.63 | 0.825 | −0.080 | - | 0.136 ** | 0.510 ** | 0.145 ** | −0.063 ** | −0.050 | −0.013 | |||||
| 8 | Fish consumption | 1–7 | 3.33 | 1.66 | 0.342 | −0.684 | - | 0.278 ** | 0.137 ** | 0.040 | 0.091 ** | 0.043 | ||||||
| 9 | Hamburgers/hot dogs consumption | 1–7 | 2.91 | 1.46 | 0.722 | 0.070 | - | 0.109 ** | −0.013 | 0.054 | −0.014 | |||||||
| 10 | Body-image index | 1–5 | 2.51 | 0.55 | −0.861 | 0.208 | - | 0.128 ** | 0.010 | 0.016 | ||||||||
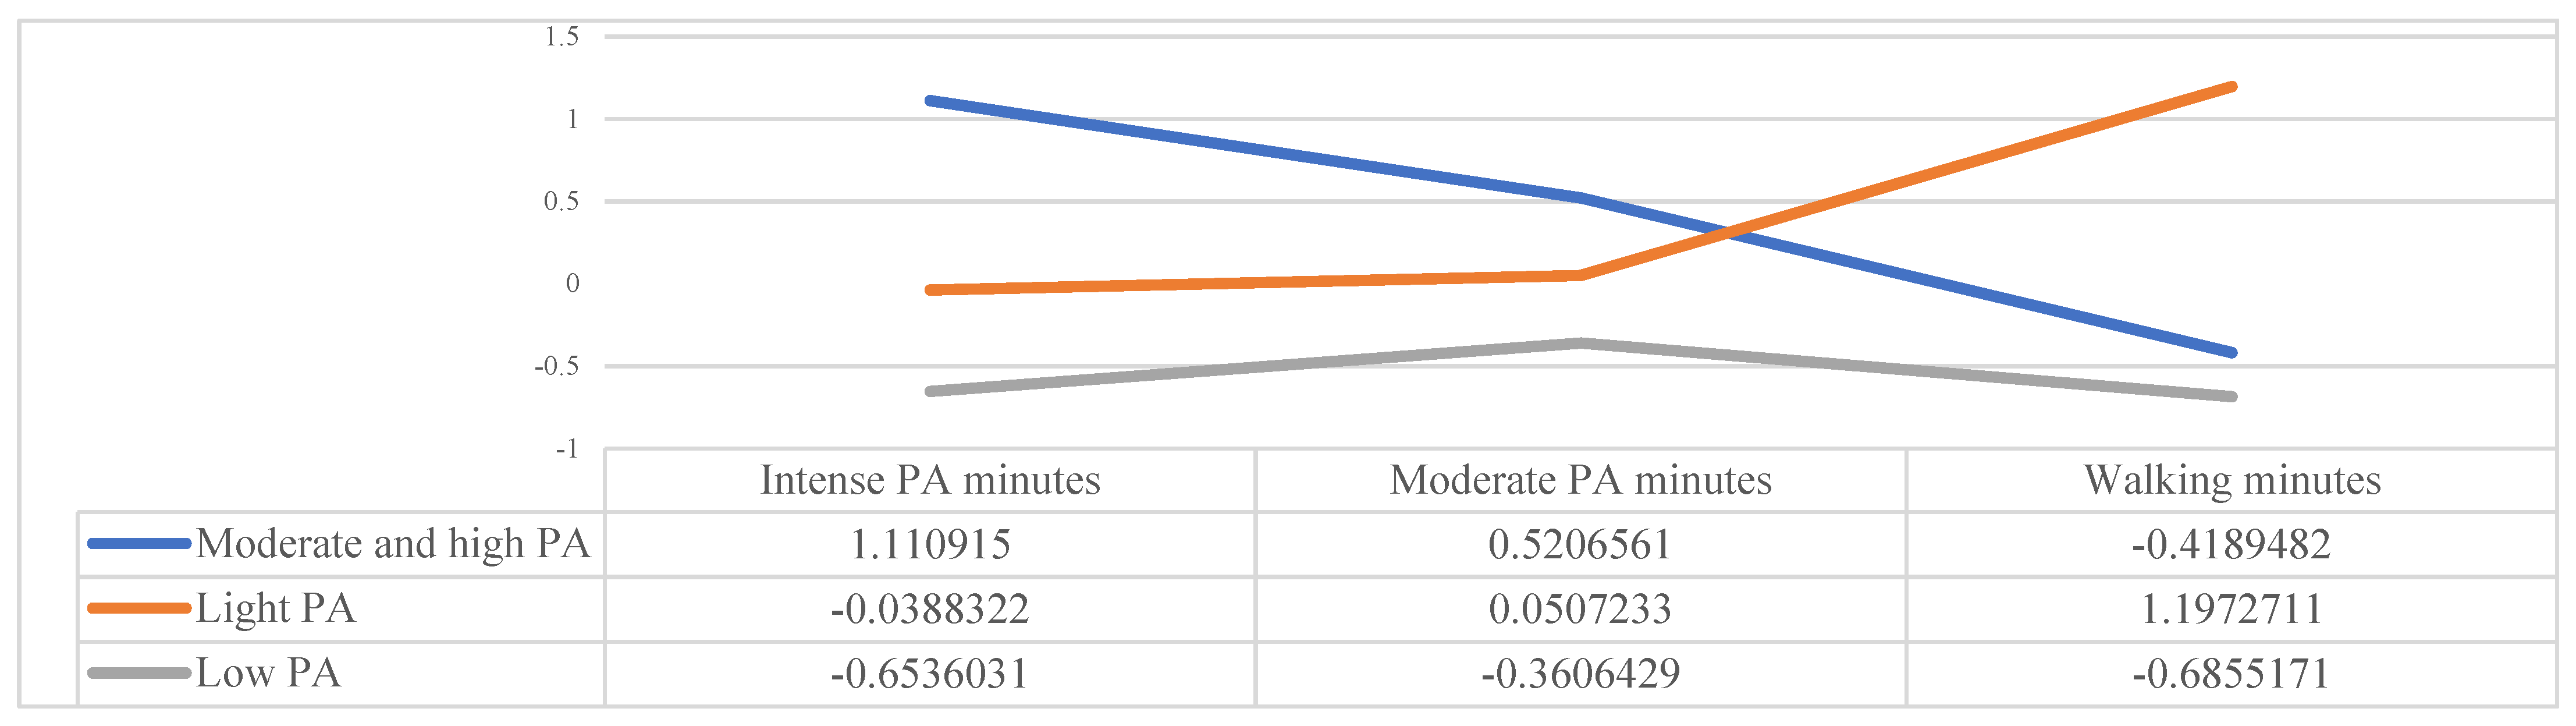
| 11 | Intense PA minutes per day | - | 45.36 | 41.44 | 0.737 | 0.014 | - | 0.295 ** | 0.092 ** | |||||||||
| 12 | Moderate PA minutes per day | - | 34.64 | 35.00 | 1.212 | 1.751 | - | 0.085 ** | ||||||||||
| 13 | Walking minutes per day | - | 68.12 | 48.94 | 0.735 | 0.110 | - |
| Cluster “Moderate and High Physical Activity” | Cluster “Light Physical Activity” | Cluster “Low Physical Activity” | |||||||
|---|---|---|---|---|---|---|---|---|---|
| M | SD | M | SD | M | SD | p | eTa | F | |
| Intense PA minutes per day | 91.40 | 32.32 | 43.75 | 35.48 | 18.27 | 21.31 | <0.001 | 0.495 | 531.898 |
| Moderate PA minutes per day | 52.86 | 38.98 | 36.41 | 33.41 | 22.01 | 27.72 | <0.001 | 0.125 | 77.226 |
| Walking minutes per day | 47.63 | 25.78 | 126.71 | 30.47 | 34.57 | 22.93 | <0.001 | 0.711 | 1336.048 |
| Gender | Profiles | Gender × Profiles | ||||
|---|---|---|---|---|---|---|
| F | p-Value | F | p-Value | F | p-Value | |
| Fruit consumption | 1.21 | 0.27 | 1.91 | 0.15 | 4.07 * | 0.02 |
| Vegetables and greens consumption | 11.61 ** | 0.01 | 0.74 | 0.48 | 5.32 ** | 0.01 |
| Sugary drinks consumption | 1.72 | 0.19 | 0.59 | 0.56 | 0.02 | 0.98 |
| Sweets and candies consumption | 11.31 ** | 0.01 | 0.79 | 0.46 | 0.66 | 0.52 |
| Natural juice consumption | 1.23 | 0.27 | 2.01 | 0.14 | 3.16 * | 0.04 |
| Dried fruit consumption | 2.35 | 0.13 | 2.66 | 0.07 | 7.72 ** | 0.01 |
| French fries consumption | 0.92 | 0.38 | 0.93 | 0.40 | 2.19 | 0.11 |
| Fish consumption | 0.45 | 0.50 | 2.38 | 0.09 | 1.78 | 0.17 |
| Hamburgers/hot dogs consumption | 1.56 | 0.21 | 0.43 | 0.65 | 0.99 | 0.37 |
| Body image index | 32.596 ** | 0.01 | 1.09 | 0.34 | 0.31 | 0.65 |
| Male vs. Female × 1 | Male vs. Female × 2 | Male vs. Female × 3 | |
|---|---|---|---|
| Fruit consumption | 0.215 | −0.559 * | −0.046 |
| Vegetables and greens consumption | −0.416 * | −0.868 ** | 0.099 |
| Sweets and candies consumption | −0.323 * | −0.208 | −0.510 ** |
| Natural juice consumption | 0.225 | −0.504 * | −0.140 |
| Dried fruit consumption | 0.251 | −0.797 ** | 0.001 |
| 1 vs. 2 | 1 vs. 3 | 3 vs. 2 | ||
|---|---|---|---|---|
| Fruit consumption | Male | 0.210 | −0.145 | 0.355 |
| Female | −0.564 * | −0.406 | −0.158 | |
| Vegetables and greens consumption | Male | 0.064 | −0.321 | 0.385 |
| Female | −0.388 * | 0.194 | −0.582 * | |
| Natural juice consumption | Male | 0.214 | −0.127 | 0.342 |
| Female | −0.515 * | −0.493 | −0.022 | |
| Dried fruit consumption | Male | 0.289 | −0.186 | 0.476 |
| Female | −0.759 ** | −0.437 | −0.322 |
| Cluster “Moderate and High Physical Activity” | Cluster “Light Physical Activity” | Cluster “Low Physical Activity” | |||||
|---|---|---|---|---|---|---|---|
| n | % | n | % | n | % | ||
| Gender | Men | 169 | 60.4 | 137 | 38.4 | 147 | 27.1 |
| Women | 111 | 39.6 | 220 | 61.6 | 305 | 72.9 | |
| eTa | 0.231 | ||||||
| Chi2 | 57.707 *** | ||||||
Publisher’s Note: MDPI stays neutral with regard to jurisdictional claims in published maps and institutional affiliations. |
© 2022 by the authors. Licensee MDPI, Basel, Switzerland. This article is an open access article distributed under the terms and conditions of the Creative Commons Attribution (CC BY) license (https://creativecommons.org/licenses/by/4.0/).
Share and Cite
Manzano-Sánchez, D.; Palop-Montoro, M.V.; Arteaga-Checa, M.; Valero-Valenzuela, A. Analysis of Adolescent Physical Activity Levels and Their Relationship with Body Image and Nutritional Habits. Int. J. Environ. Res. Public Health 2022, 19, 3064. https://doi.org/10.3390/ijerph19053064
Manzano-Sánchez D, Palop-Montoro MV, Arteaga-Checa M, Valero-Valenzuela A. Analysis of Adolescent Physical Activity Levels and Their Relationship with Body Image and Nutritional Habits. International Journal of Environmental Research and Public Health. 2022; 19(5):3064. https://doi.org/10.3390/ijerph19053064
Chicago/Turabian StyleManzano-Sánchez, David, María Victoria Palop-Montoro, Milagros Arteaga-Checa, and Alfonso Valero-Valenzuela. 2022. "Analysis of Adolescent Physical Activity Levels and Their Relationship with Body Image and Nutritional Habits" International Journal of Environmental Research and Public Health 19, no. 5: 3064. https://doi.org/10.3390/ijerph19053064
APA StyleManzano-Sánchez, D., Palop-Montoro, M. V., Arteaga-Checa, M., & Valero-Valenzuela, A. (2022). Analysis of Adolescent Physical Activity Levels and Their Relationship with Body Image and Nutritional Habits. International Journal of Environmental Research and Public Health, 19(5), 3064. https://doi.org/10.3390/ijerph19053064