
Association between Noise Annoyance and Mental Health Outcomes: A Systematic Review and Meta-Analysis

 ,
,
Abstract
1. Introduction
2. Methods
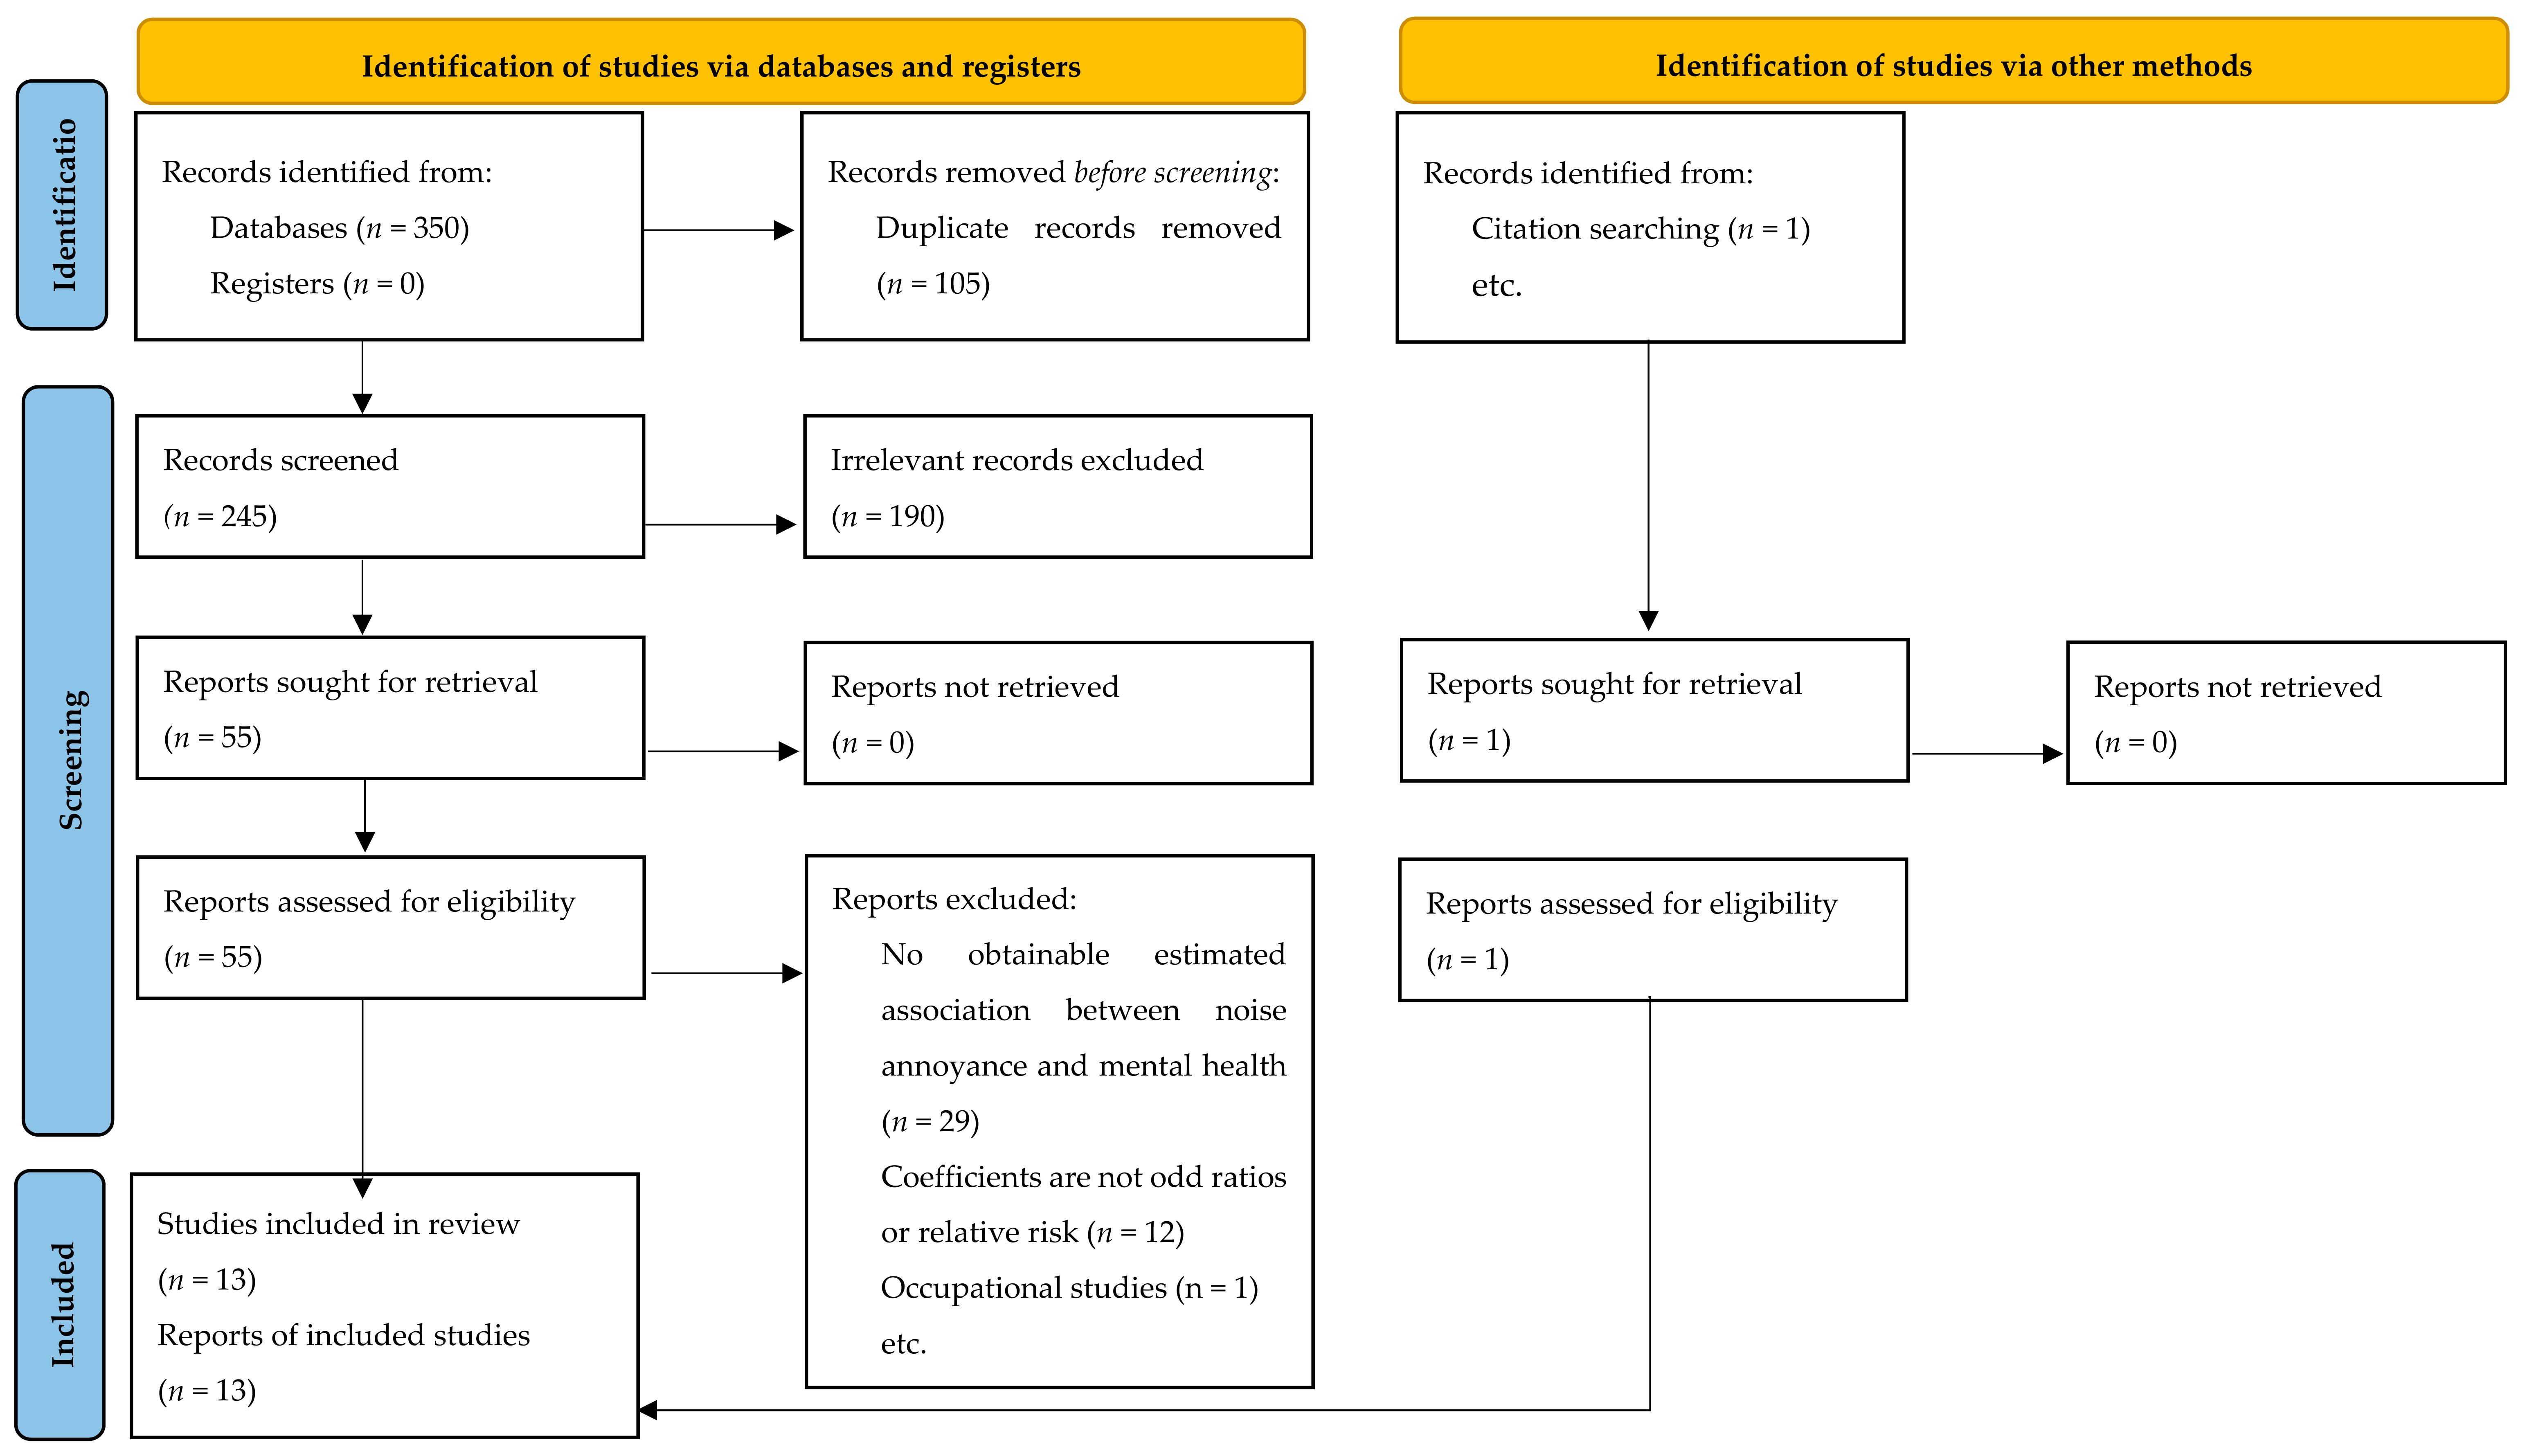
2.1. Paper Identification
2.2. Definition of Outcomes
2.3. Definition of Exposure
2.4. Effect Size Extraction
2.5. Risk of Bias
2.6. Statistical Analysis
2.7. Quality of Evidence
3. Results
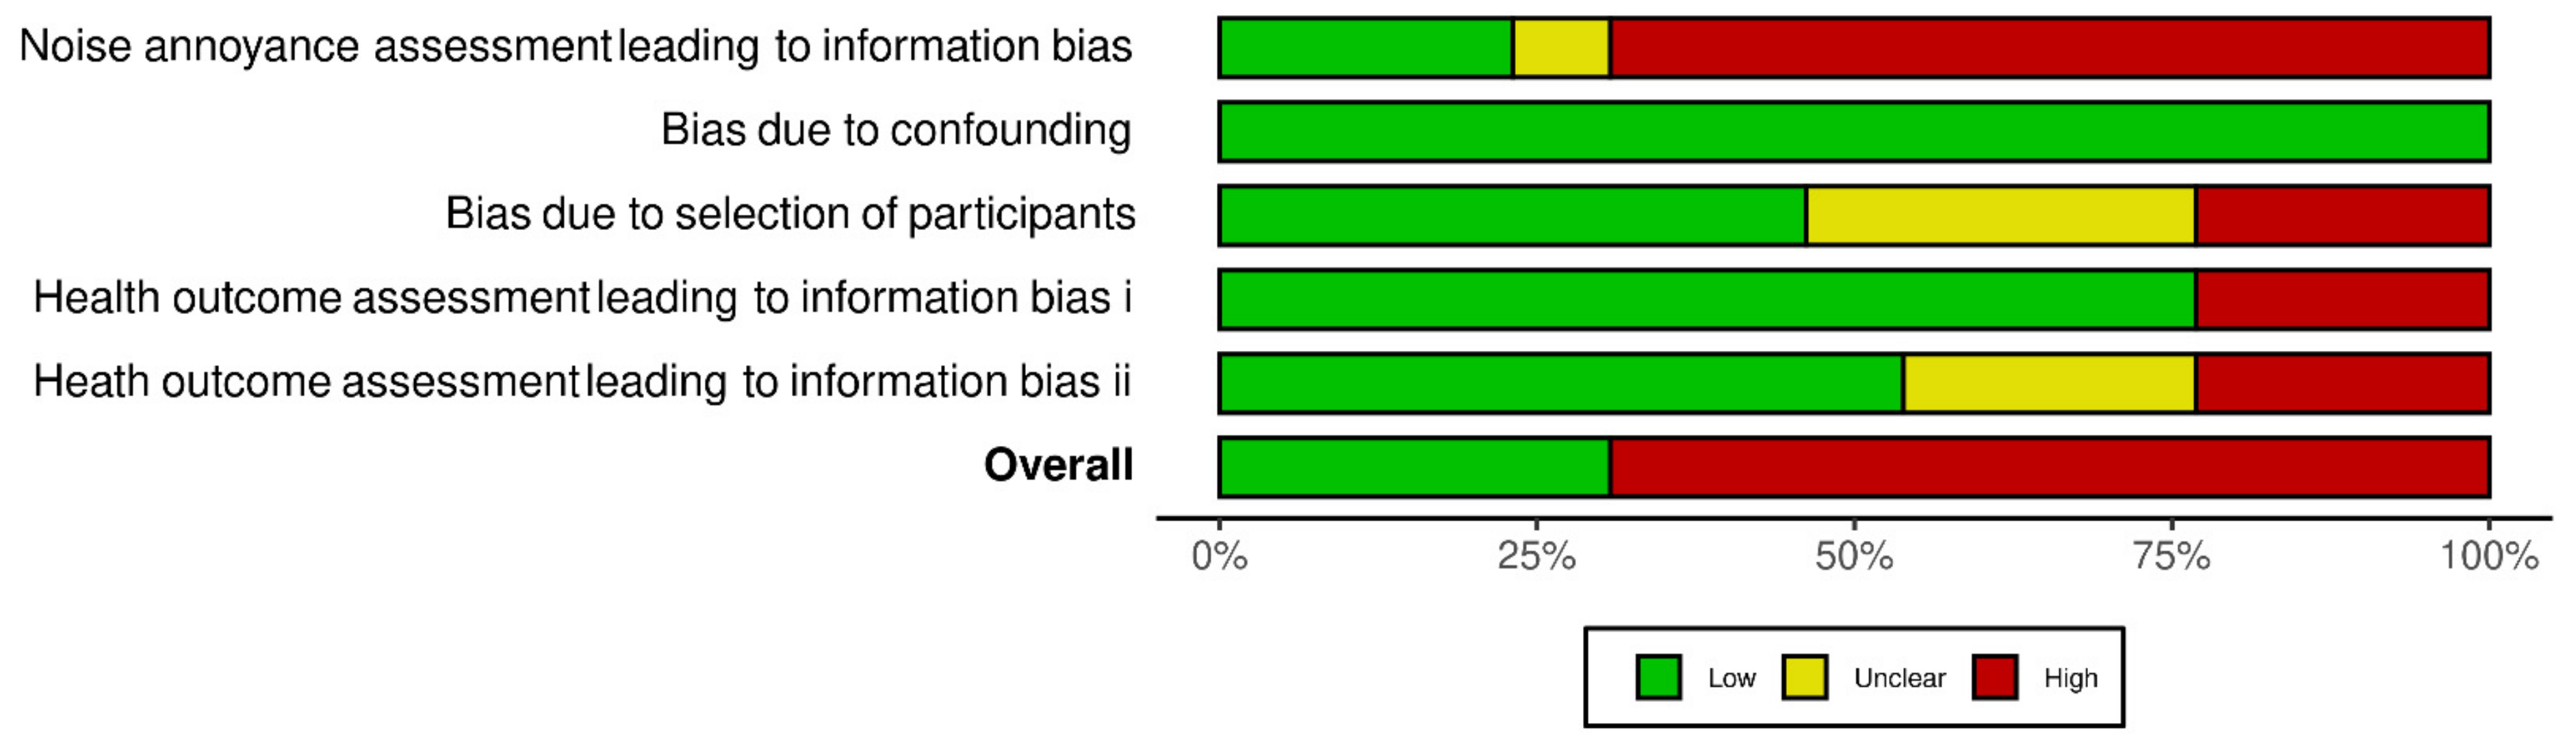
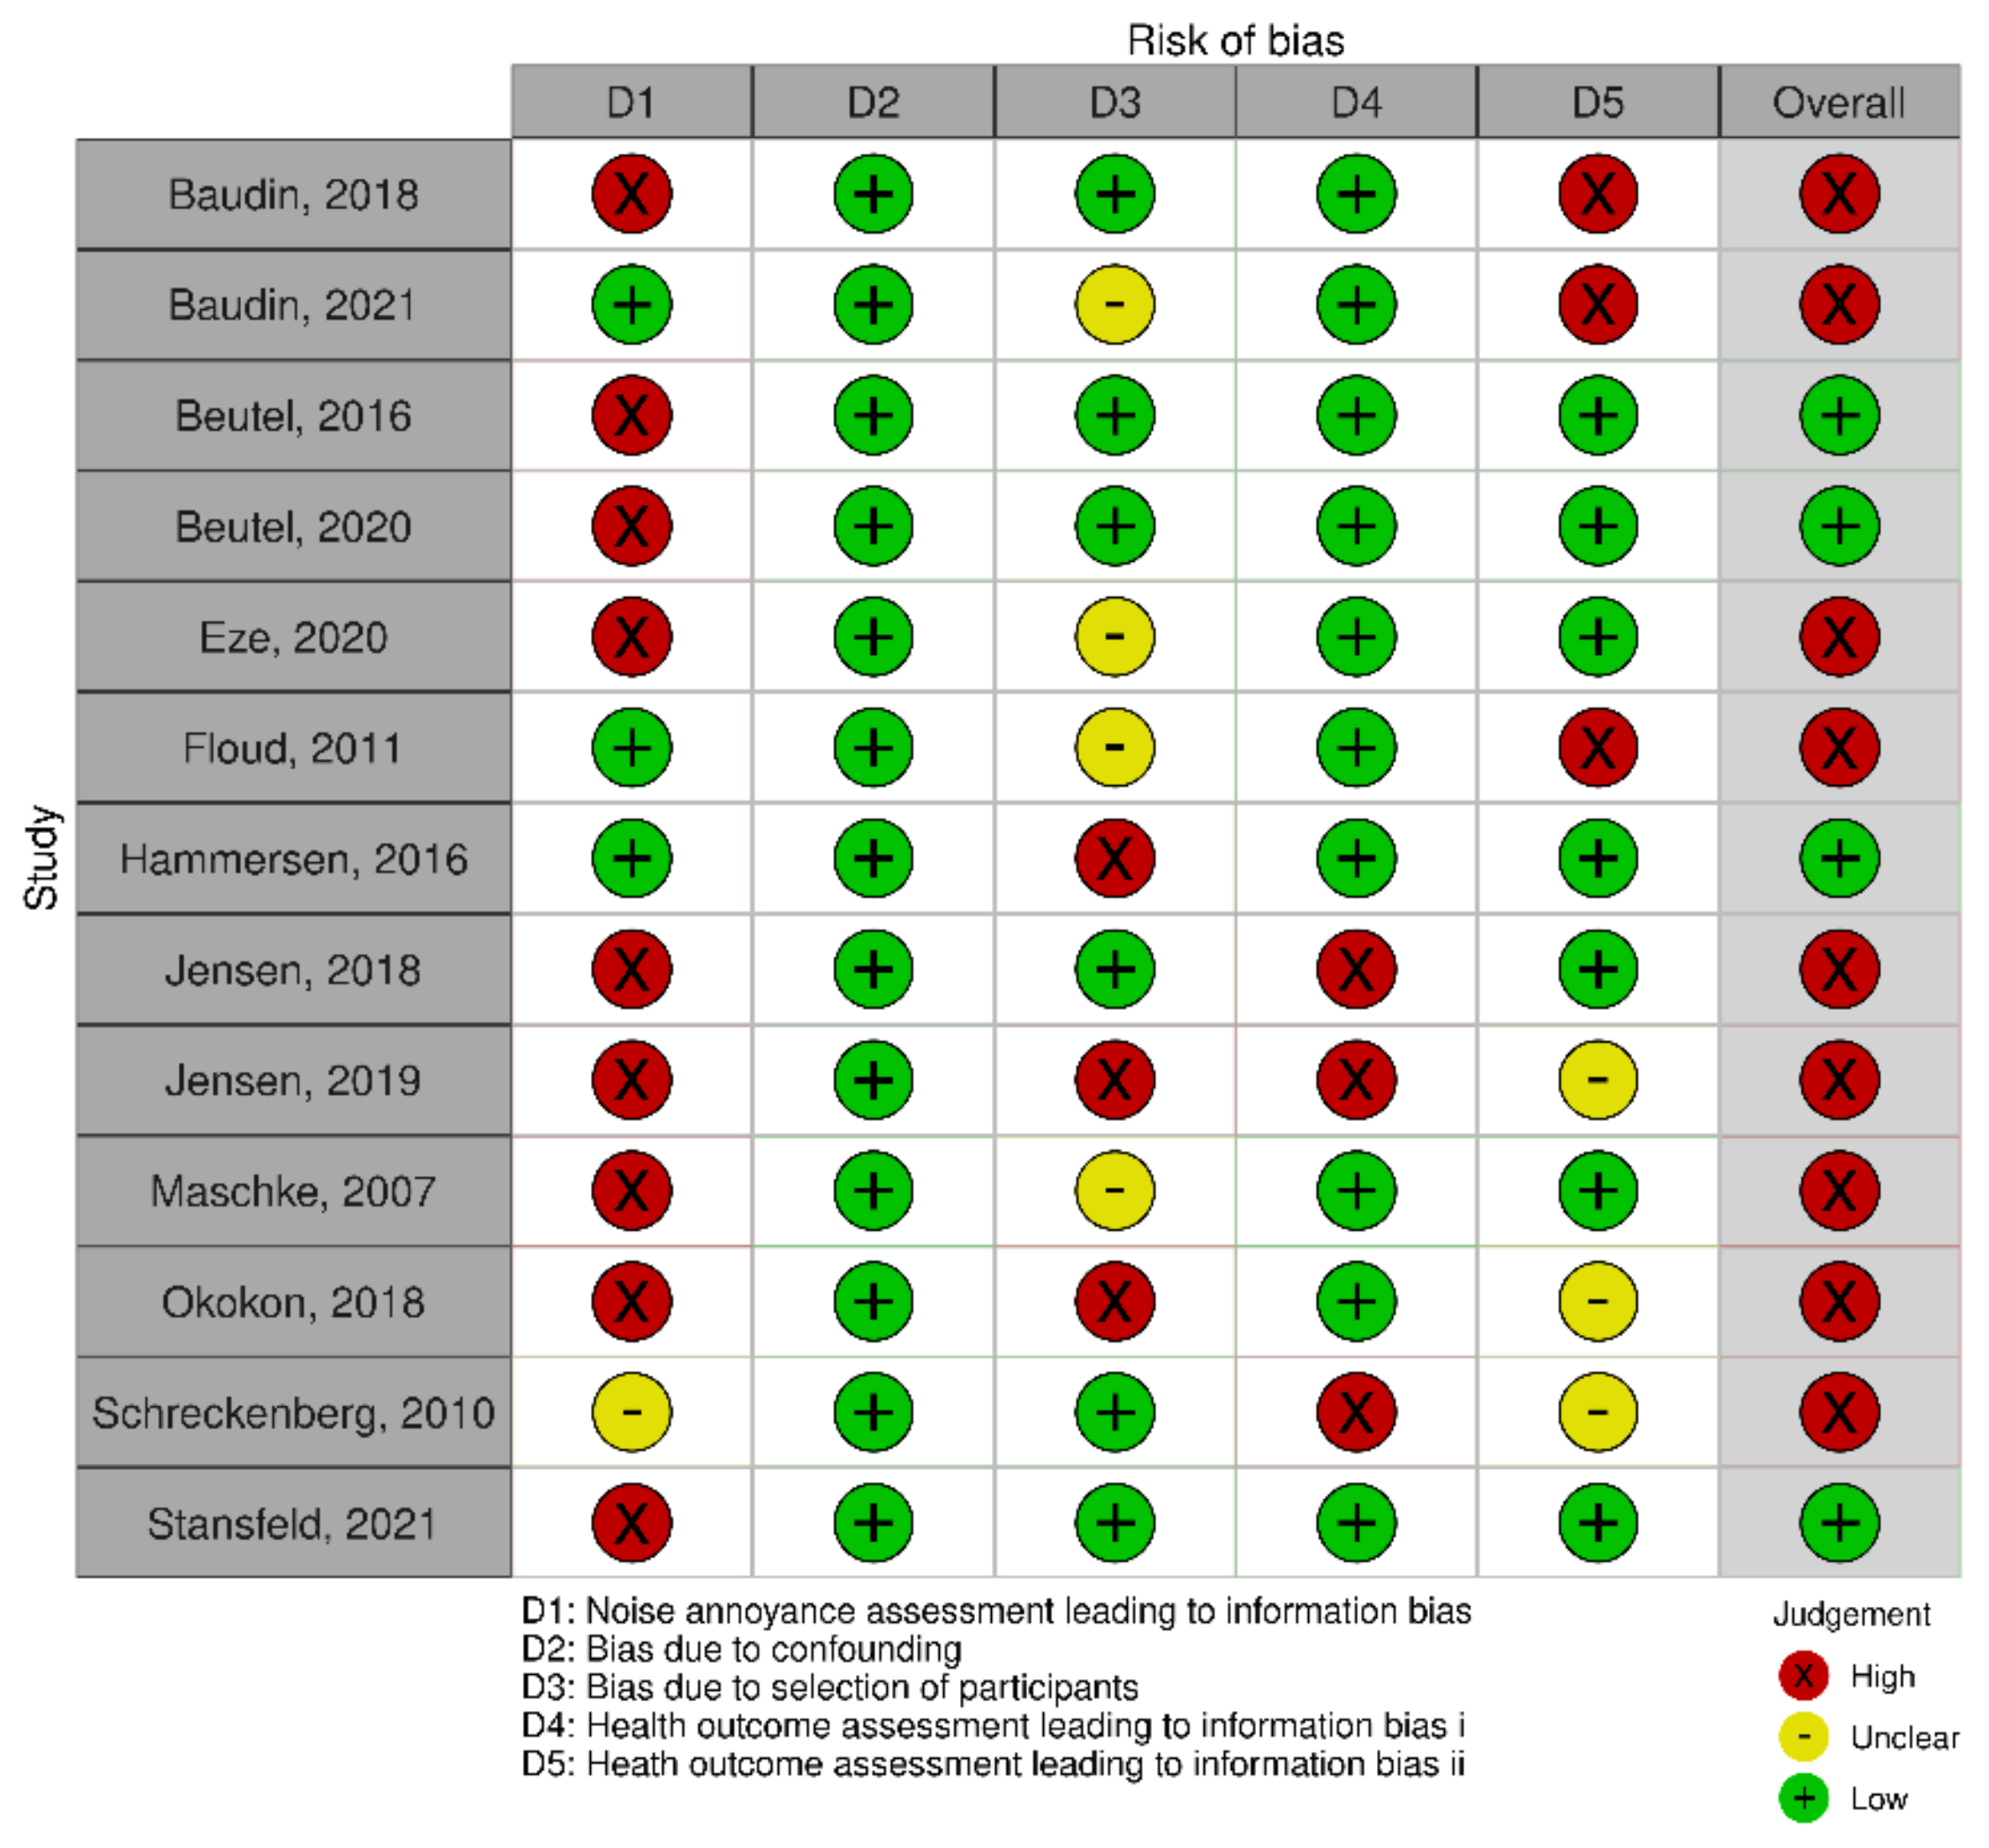
3.1. Risk of Bias
3.2. Meta-Analysis Results
3.2.1. Depression
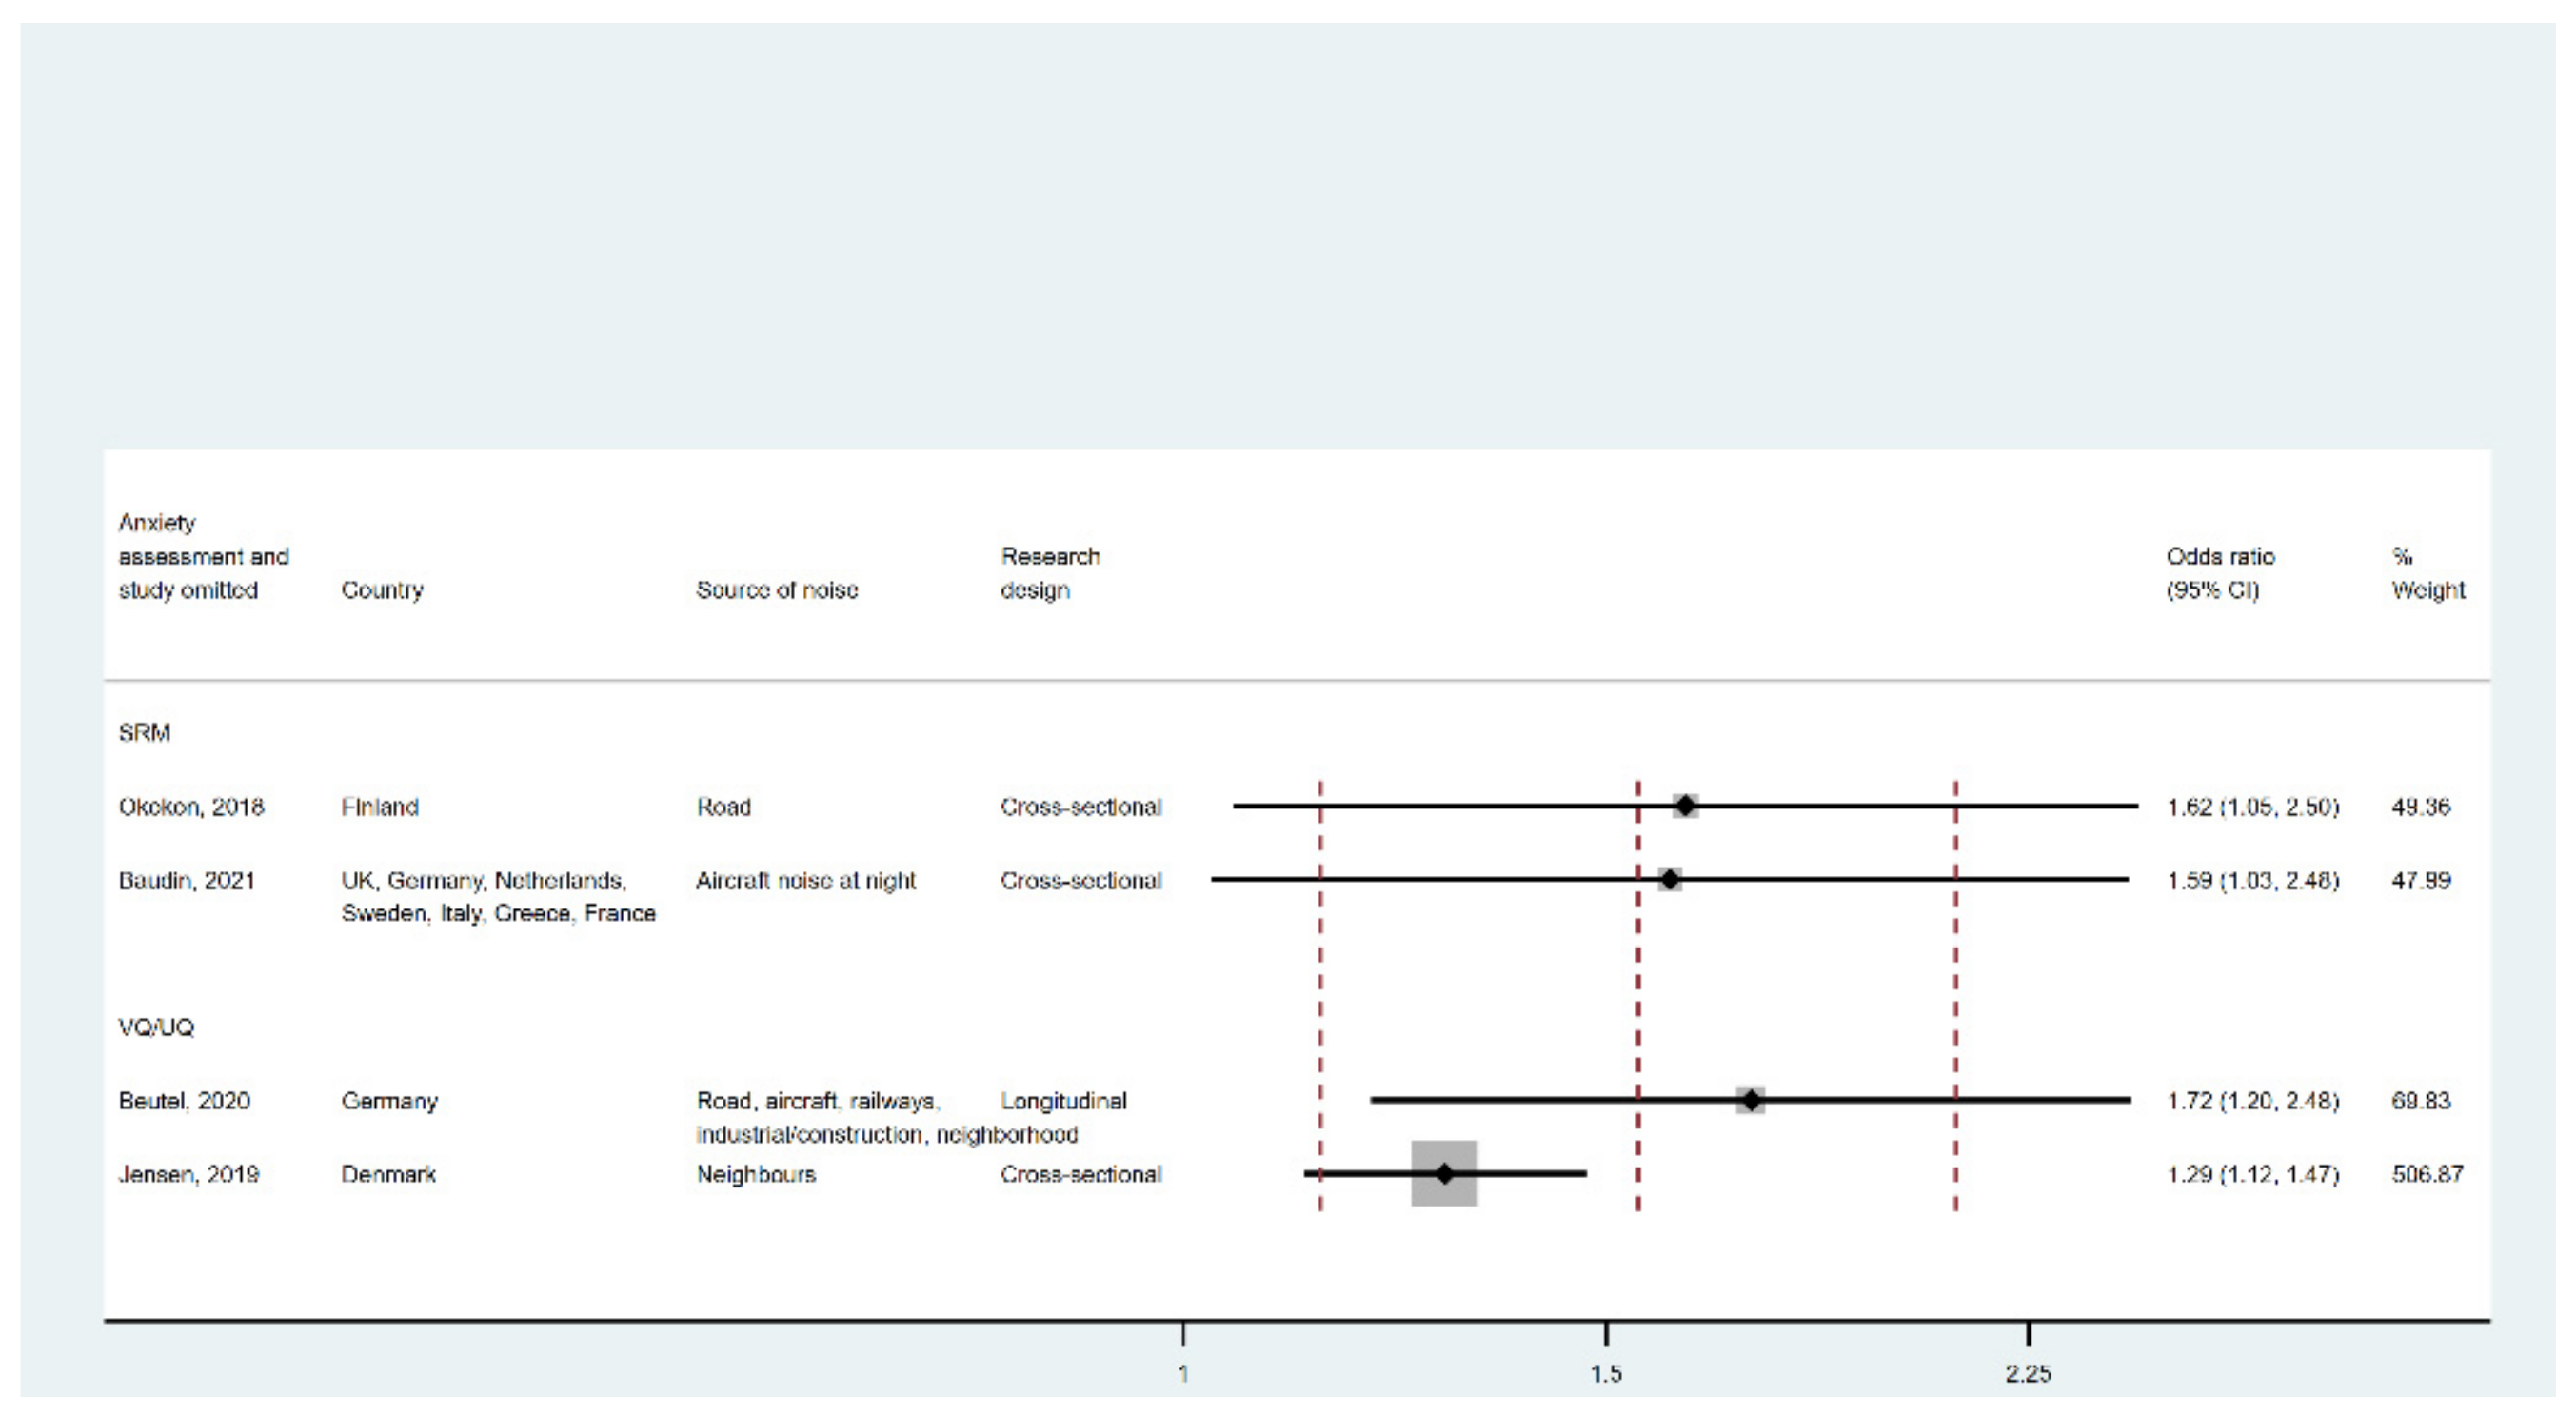
3.2.2. Anxiety Disorder
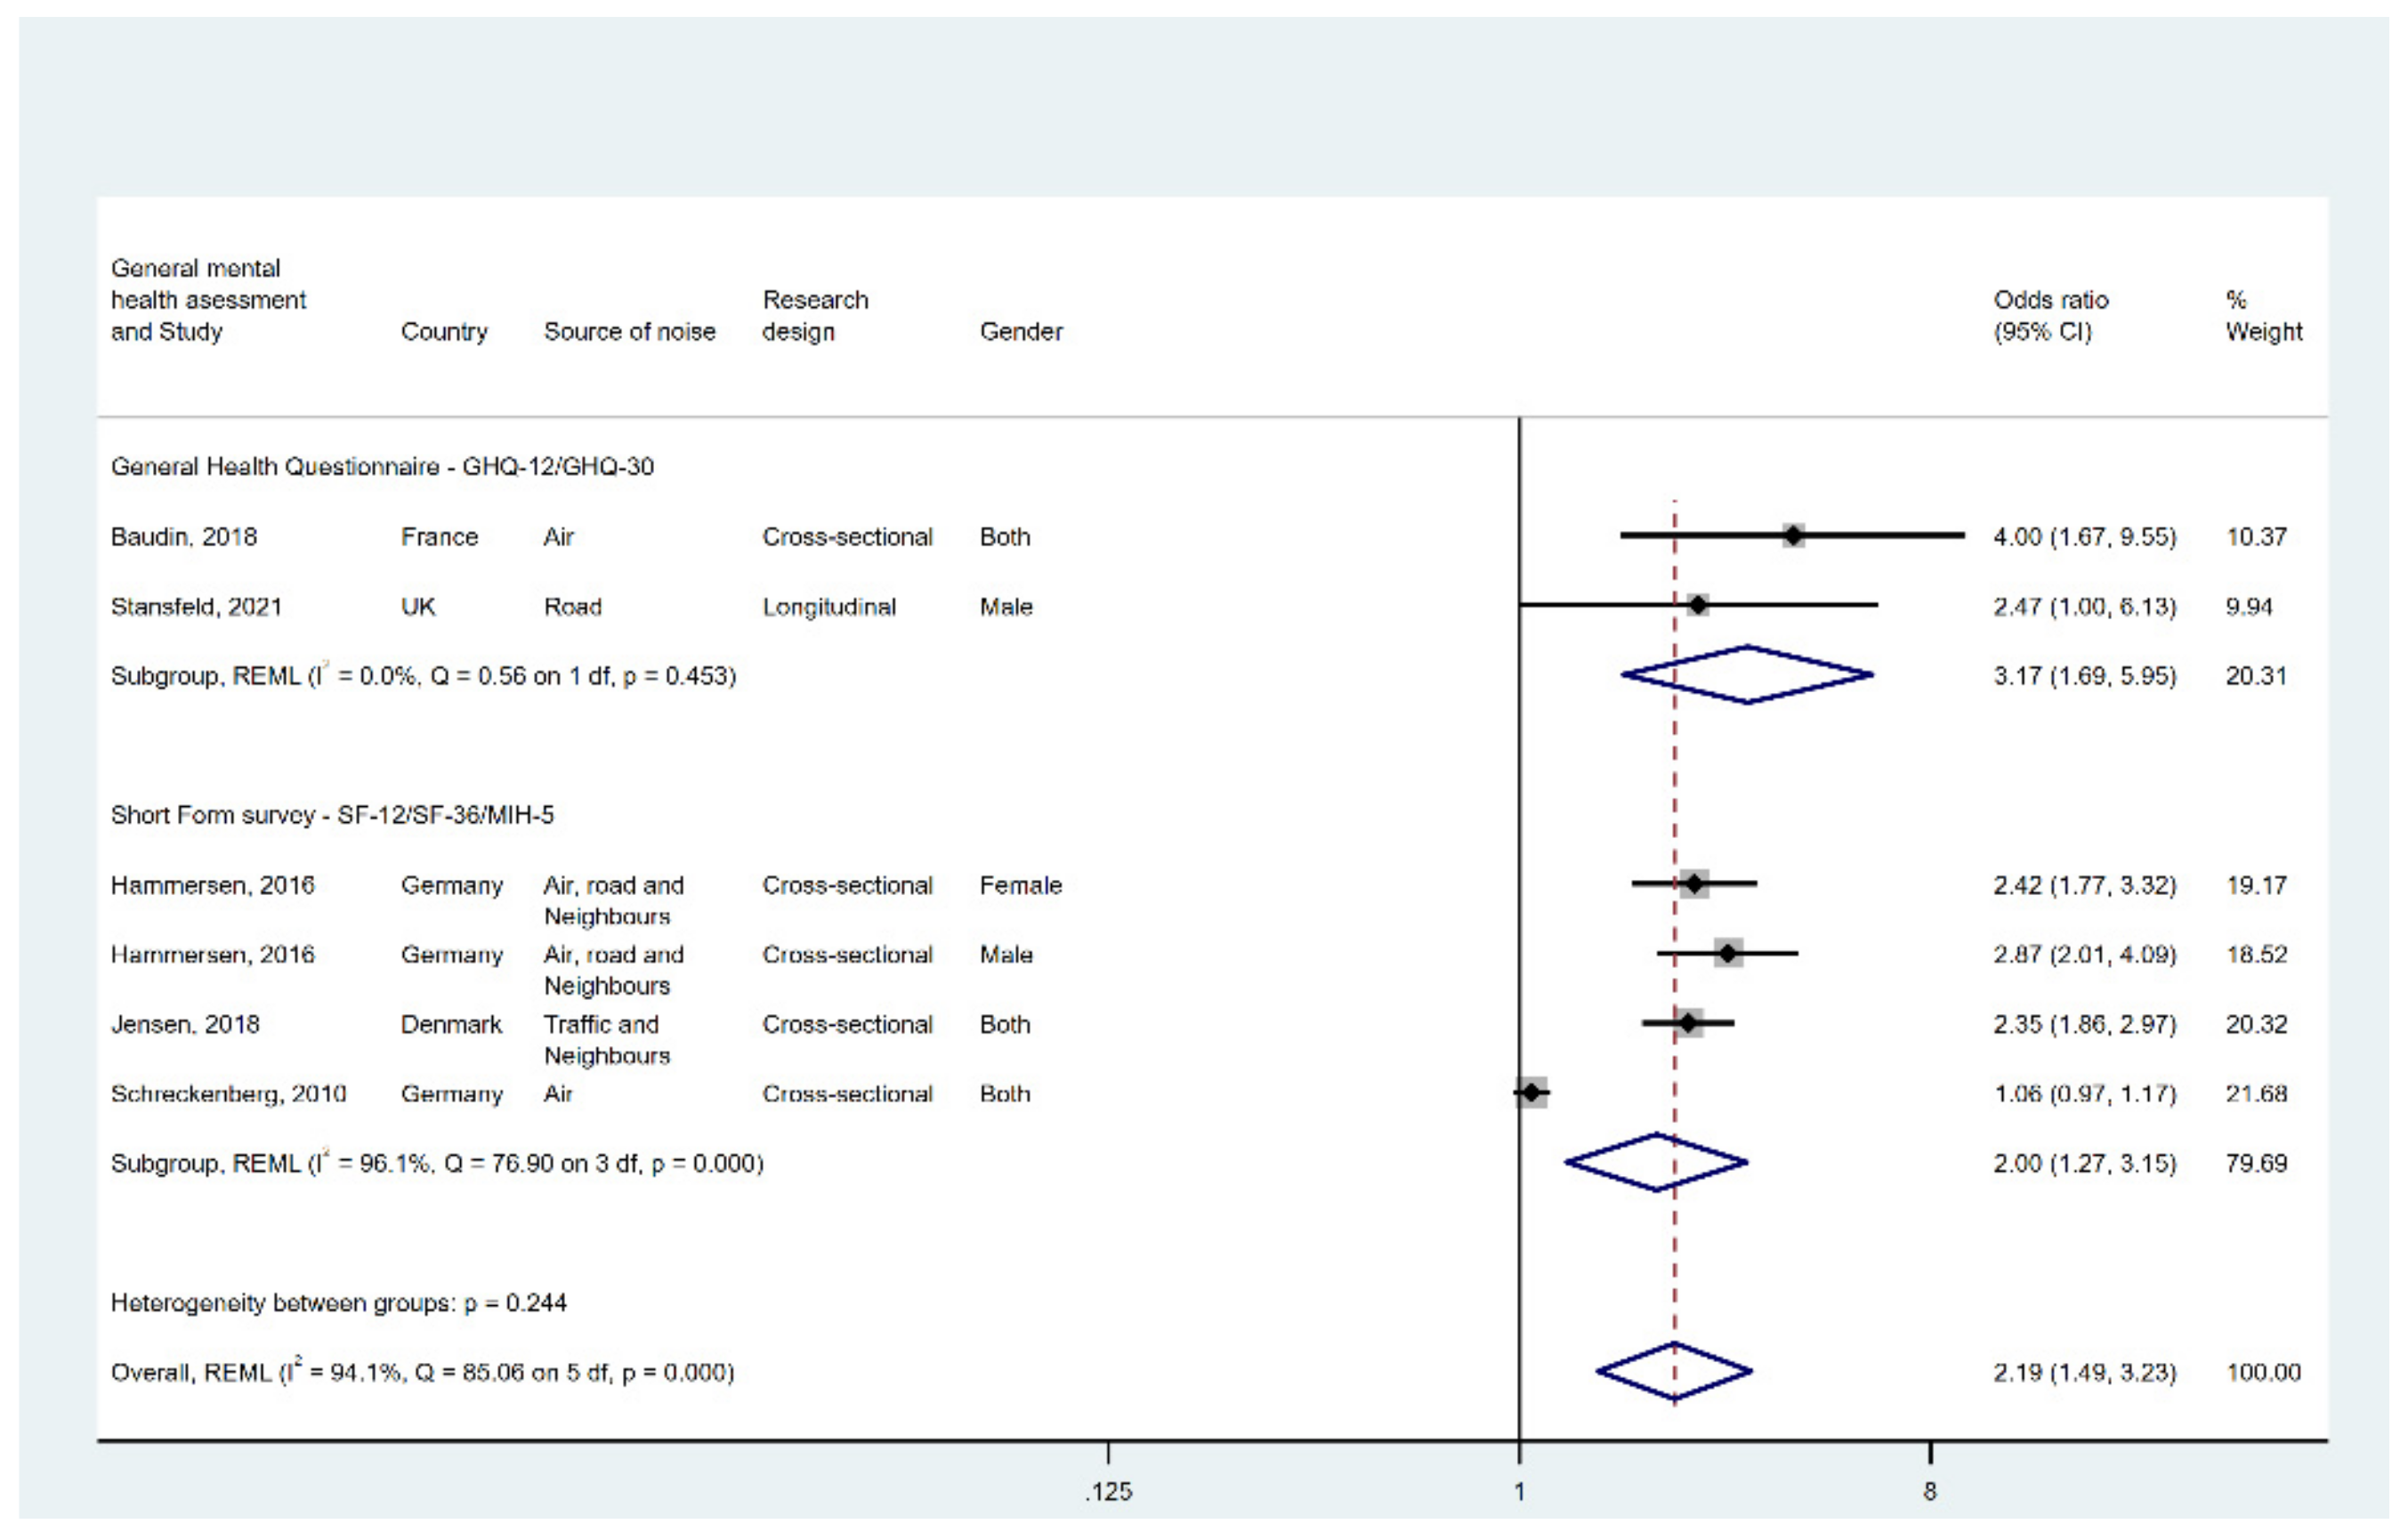
3.2.3. General Mental Health
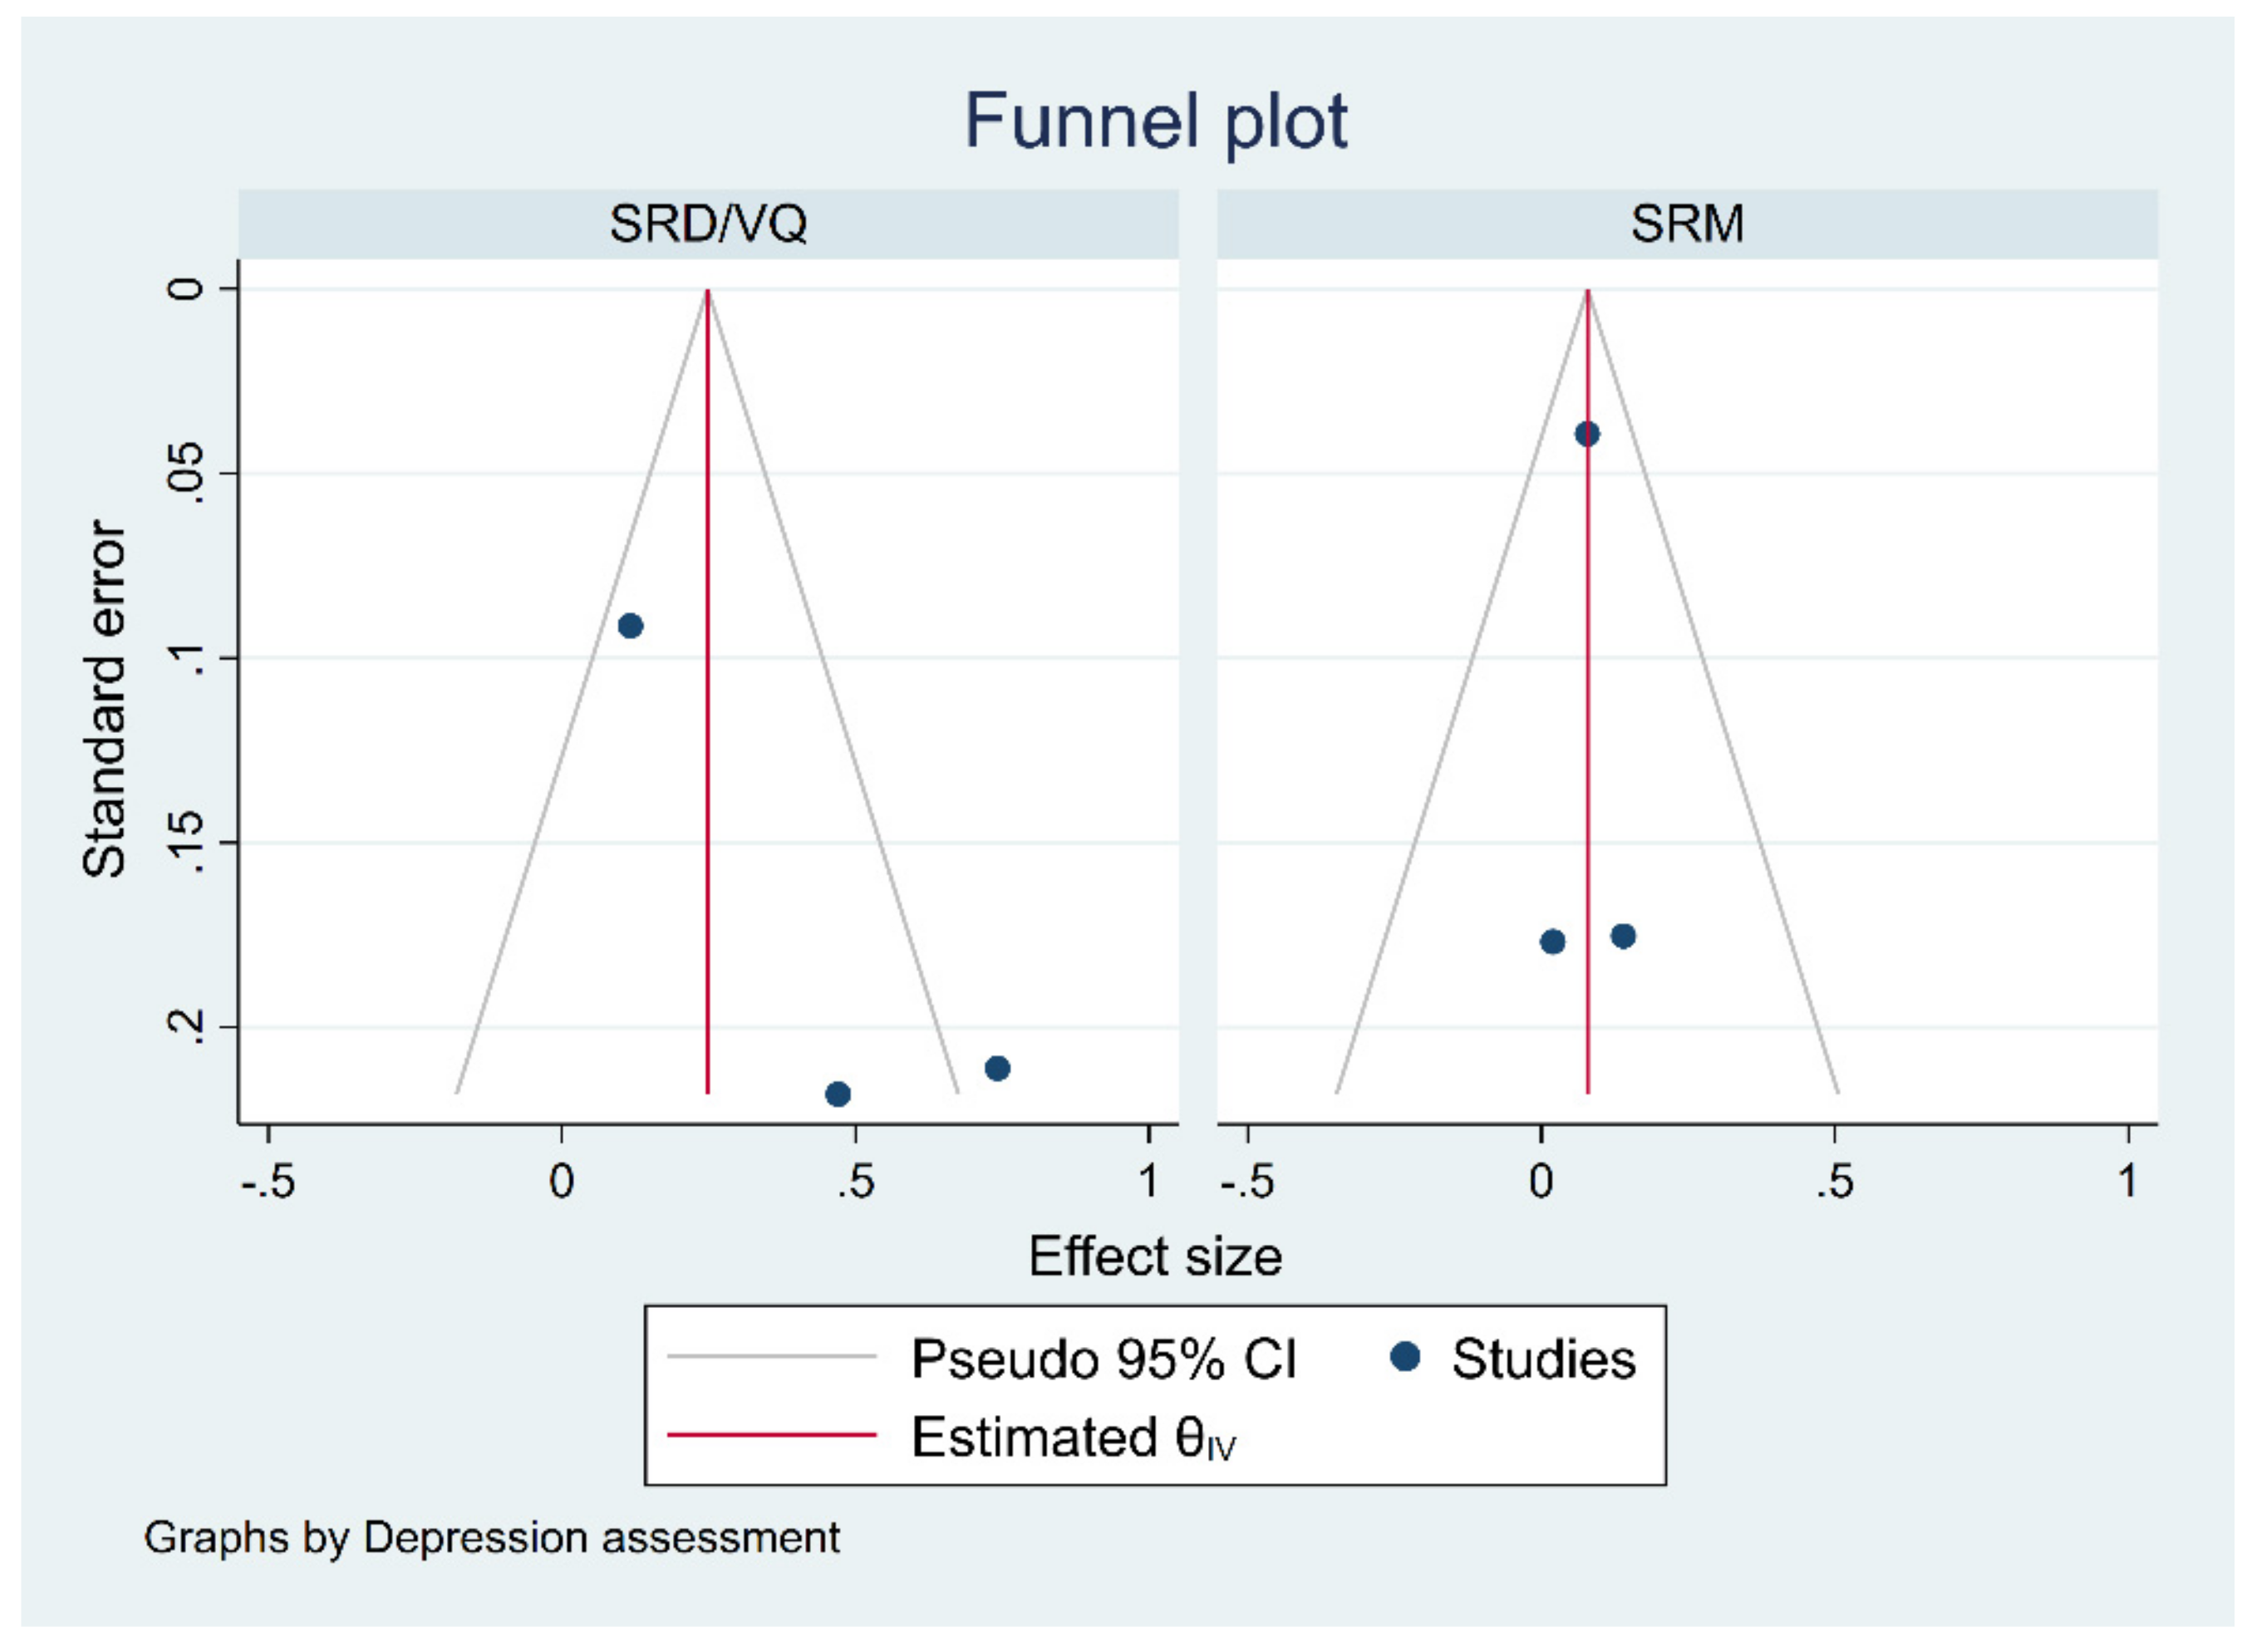
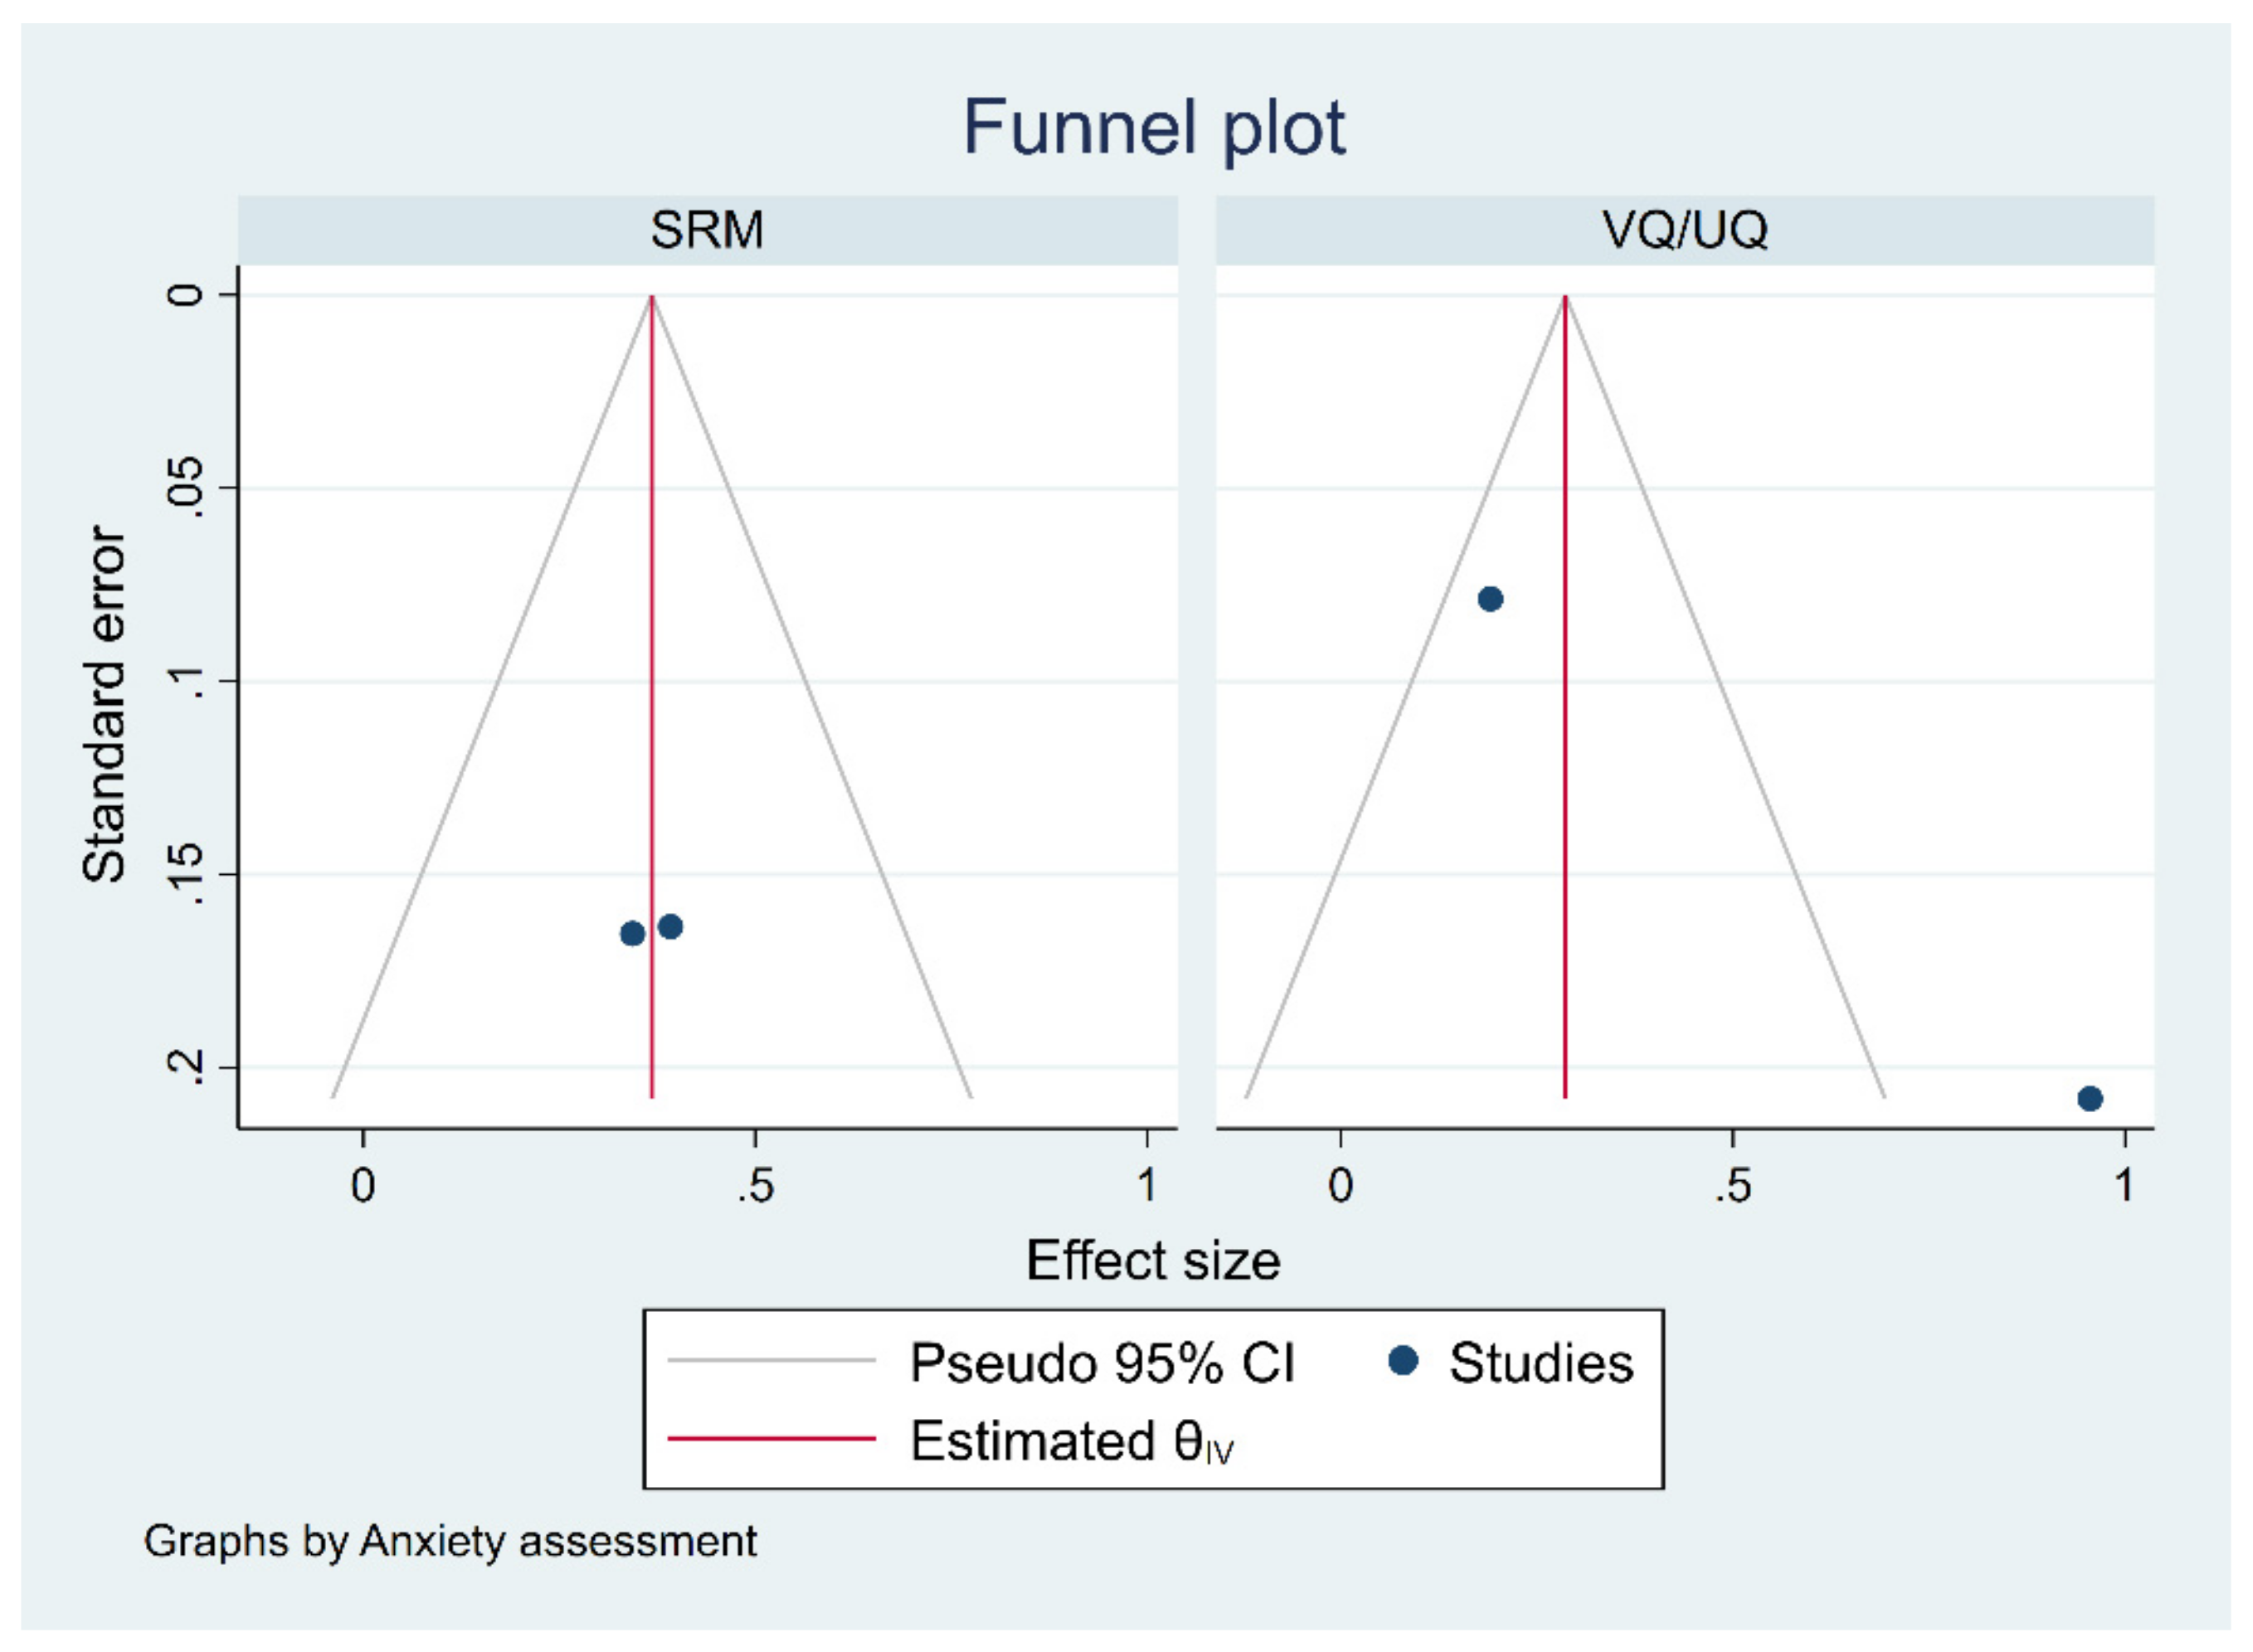
3.3. Publication Bias
3.4. Quality of Evidence
4. Discussion
5. Conclusions
Author Contributions
Funding
Institutional Review Board Statement
Informed Consent Statement
Data Availability Statement
Acknowledgments
Conflicts of Interest
Appendix A

| Conference | Search Terms Used | Link |
|---|---|---|
| Internoise 2000 to 2020 (held annually) | ‘mental health’ and ‘annoyance’. | https://www.ingentaconnect.com/content/ince/incecp#:~:text=The%20INTER%2DNOISE%20and%20NOISE,at%20the%20congress%20or%20conference (accessed on 23 June 2021) |
| International Commission on Biological Effects of Noise (ICBEN) 2000 to 2021 (held every 3 years) | ‘mental health’ and ‘annoyance’. | http://www.icben.org/Proceedings.html (accessed on 23 June 2021) |
| International Congresses on Acoustics (ICA) 2001–2019 (held every 3 years) | ‘mental health’ and ‘annoyance’. | https://www.icacommission.org/proceedg.html (accessed on 23 June 2021) |
| International Institute of Acoustics and Vibration (IIAV) 2005–2021 (held annually) | ‘mental health’ and ‘annoyance’. | http://www.proceedings.com/6995.html (accessed on 23 June 2021) |
| Database | Terms | Period Filter |
|---|---|---|
| Web of science | TS = ((“annoyance” OR “noise annoyance”) AND (“aircraft noise” OR “airport noise” OR “construction noise” OR “environmental noise” OR “hospital noise” OR “residential noise” OR “metro noise” OR “neighbourhood noise” OR “railway noise” OR “road traffic noise” OR “school noise” OR “traffic noise” OR “train noise” OR “transportation noise” OR “truck noise” OR “wind farm noise” OR “wind turbine noise” OR “wind turbine sound”) AND (“perceived well-being” OR “quality of life” OR “depression” OR “anxiety” OR “mental health” OR “mental well-being” OR “anxiety” OR “psychological symptom” OR “emotional disorder” OR “cortisol”)) | 3 January 2000–2022 |
| PubMed | (“annoyance” OR “noise annoyance”) AND (“aircraft noise” OR “airport noise” OR “construction noise” OR “environmental noise” OR “hospital noise” OR “residential noise” OR “metro noise” OR “neighbourhood noise” OR “railway noise” OR “road traffic noise” OR “school noise” OR “traffic noise” OR “train noise” OR “transportation noise” OR “truck noise” OR “wind farm noise” OR “wind turbine noise” OR “wind turbine sound”) AND (“perceived well-being” OR “quality of life” OR “depression” OR “anxiety” OR “mental health” OR “mental well-being” OR “anxiety” OR “psychological symptom” OR “emotional disorder” OR “cortisol”) | 4 January 2000–2022 |
| Scopus | KEY ((“annoyance” Or “noise annoyance”) AND (“air-craft noise” OR “airport noise” OR “construction noise” OR “environmental noise” OR “hospital noise” OR “residential noise” OR “metro noise” OR “neighbourhood noise” OR “railway noise” OR “road traffic noise” OR “school noise” OR “traffic noise” OR “train noise” OR “transportation noise” OR “truck noise” OR “wind farm noise” OR “wind turbine noise” OR “wind turbine sound”) AND (“perceived well-being” OR “quality of life” OR “depression” OR “anxiety” OR “mental health” OR “mental well-being” OR “anxiety” OR “psycho-logical symptom” OR “emotional disorder” OR “cortisol”)) AND PUBYEAR AFT 2000 | 3 January 2000–2022 |
| PsycINFO | (“annoyance” OR “noise annoyance”) AND (“aircraft noise” OR “airport noise” OR “construction noise” OR “environmental noise” OR “hospital noise” OR “residential noise” OR “metro noise” OR “neighbourhood noise” OR “railway noise” OR “road traffic noise” OR “school noise” OR “traffic noise” OR “train noise” OR “transportation noise” OR “truck noise” OR “wind farm noise” OR “wind turbine noise” OR “wind turbine sound”) AND (“perceived well-being” OR “quality of life” OR “depression” OR “anxiety” OR “mental health” OR “mental well-being” OR “anxiety” OR “psychological symptom” OR “emotional disorder” OR “cortisol”) | 3 January 2000–2022 |
| Domain | Judgement of Risk of Bias |
|---|---|
| Noise annoyance assessment leading to information bias | Low: Papers that defined highly annoyed participants using the top 3 points (8, 9 and 10) of the 11-point numeric noise annoyance scale ( OR the upper two steps (“Very” and “Extremely”) of the verbal 5-point response scale ) OR the same 5-point verbal scale but weights “Very” by 0.4 and “Extremely” in full ) High: Studies that did not define high noise annoyance OR High annoyance was defined in an approach that is different from Schultz and ICBEN definitions. |
| Bias due to confounding | Low: Papers that defined highly annoyed participants using the top three points on an 11-point scale OR upper 2 points in the 5-point scale. High: Studies that did not define high noise annoyance OR High annoyance was defined in an approach that is different from Schultz and ICBEN definitions. |
| Bias due to selection of participants | Low: The participants were drawn from an administrative dataset that contains data on the entire population. OR Randomly selected from the general population AND the response rate exceeded 60%. High: Participants selected from a non-probability sampling method OR The sample size is very small (≤200) OR The response rate is lower than 60%. |
| Health outcome assessment leading to information bias i | Depression, anxiety disorder, and general mental health were the three primary domains. Mental health problems were quantified using clinically diagnosed psychiatric disorders, psychotropic medication use, and self-reported mental health instruments such as the PHQ-9 (depression), GAD 2 (anxiety), SF-12/36/MIH-5 (general mental well-being), and GHQ 12/30 (general mental health). Low: Studies had (i) clearly demonstrated classification of the mental disease if used self-reported diagnosis, OR (ii) clearly demonstrated substance prescribed if used medication intake, OR (iii) used validated mental health screening tool and cut-off values if screening instruments were used. High: Studies that used a non-validated questionnaire OR Studies that used a non-validated cut-off to dichotomise outcome. |
| Heath outcome assessment leading to information bias ii | We considered the bias to be Low If the data were from generic health study OR Pollution-themed studies that do not directly suggests noise is the main interest. OR The primary objective of these studies was to determine the association between noise pollution and health, but the blinding process was maintained. |
| Study | Title | Country |
|---|---|---|
| Baudin, 2018 [15] | Aircraft noise and psychological ill-health: the results of a cross-sectional study in France | France |
| Baudin, 2021 [45] | The role of aircraft noise annoyance and noise sensitivity in the association between aircraft noise levels and medication use: results of a pooled analysis from seven European countries | UK, Germany, Netherlands, Sweden, Italy, Greece, France |
| Beutel, 2016 [43] | Noise annoyance is associated with depression and anxiety in the general population-the contribution of aircraft noise | Germany |
| Beutel, 2020 [40] | Noise annoyance predicts symptoms of depression, anxiety, and sleep disturbance 5 years later. Findings from the Gutenberg Health Study | Germany |
| Eze, 2020 [29] | Incidence of depression in relation to transportation noise exposure and noise annoyance in the SAPALDIA study | Switzerland |
| Floud, 2011 [44] | Medication use in relation to noise from aircraft and road traffic in six European countries: results of the HYENA study | UK, Germany, Netherland, Sweden, Italy, Greece |
| Hammersen, 2016 [14] | Environmental noise annoyance and mental health in adults: findings from the cross-sectional German health update (GEDA) study 2012 | Germany |
| Jensen, 2018 [41] | Neighbour and traffic noise annoyance: a nationwide study of associated mental health and perceived stress | Denmark |
| Jensen, 2019 [47] | Neighbour noise annoyance is associated with various mental and physical health symptoms: results from a nationwide study among individuals living in multi-storey housing | Denmark |
| Maschke, 2007 [46] | Health effects of annoyance induced by neighbour noise | France, Germany, Slovakia, Hungary, Portugal, Italy, Switzerland, Latvia |
| Okokon, 2018 [42] | Traffic noise, noise annoyance and psychotropic medication use | FInland |
| Schreckenberg, 2010 [31] | Aircraft noise and quality of life around Frankfurt airport | Germany |
| Stansfeld, 2021 [39] | Road traffic noise, noise sensitivity, noise annoyance, psychological and physical health, and mortality | UK |
| Depression | Anxiety Disorder | General Mental Health | |||
|---|---|---|---|---|---|
| SRM | SRD/VQ | SRM | VQ/UQ | ||
| Starting rating | Low | Low | Low | Low | Low |
| Risk of bias | Serious (2/3 high risk) | Moderate (1/4 high risk) | Serious (3/3 high risk) | Moderate (1/3 high risk) | Moderate (2/5 high risk) |
| Inconsistency | Low | Serious | Low | Serious | Serious |
| Indirectness | None | None | None | None | None |
| Imprecision | None | None | None | None | None |
| Publication bias | None | Serious | None | Serious | Serious |
| Strength of association | Small | Small | Small | Small | Large |
| Exposure-response gradient | None | None | None | None | None |
| Possible confounding | No serious bias | No serious bias | No serious bias | No serious bias | No serious bias |
| Overall | Very low | Very Low | Very low | Very Low | Very low |
| Study | Research Design | Country | Participants | Maximum Sample Size Included in Analyses | Response Rate | Noise Source | High Noise Annoyance Definition | Mental Health Outcomes and Caseness Definition | Confounder | Used Ors | Actual Noise Levels Included in the Model | Note |
|---|---|---|---|---|---|---|---|---|---|---|---|---|
| Baudin, 2018 | Cross-sectional | France | Residents living near airports; ≥18 | 1244 | Approximately 60% (not reported exactly) | Aircraft | Verbal 5-point; HA undefined; “Extremely” annoyed to proxy . | General mental health: GHQ-12 scores ≥ 3 | Gender, age, country of birth, occupational activity, education, marital status, smoking habit, alcohol consumption, number of work-related stress and major stressful life events, household monthly income, sleep duration. | OR = 4.00% CI [1.67–9.55] | Yes; per 10 dB Lden; range unclear. | |
| Baudin, 2021 | Cross-sectional | UK, Germany, Netherlands, Sweden, Italy, Greece, France | Residents living near airports; age ≥ 18 | 5867 (combined studies) | Unclear | Aircraft | Depression and anxiety disorder; antidepressant and anxiolytic drug use | Gender, age, body mass index (BMI), alcohol consumption, smoking habits, physical activity, education level, and country, an interaction term between country and each of the three factors of interest (noise level, noise annoyance and noise sensitivity). | Depression: OR = 1.02 95% CI [0.72–1.44]; Anxiety: OR = 1.48 95% CI (1.08–2.05) | No | Annoyed by aircraft noise at night | |
| Beutel, 2016 | Cross-sectional | Germany | Population based; age 35–74 | 14,635 | 60.3% | Road traffic, aircraft, railways, industrial, neighbourhood, overall noise; day and night | Verbal 5-point; HA undefined; “Extremely” annoyed to . | Depression and anxiety disorder; PHQ-9 scores ≥ 10 and GAD 2 scores ≥ 3 | Sex, age, and socioeconomic status | Depression: OR = 1.97 95% CI [1.62–2.39]; Anxiety: OR = 2.14 95% CI [1.71–2.67] | No | OR reported separately for annoyance levels; those reported here are for ppts reporting “extreme annoyance” |
| Beutel, 2020 | Longitudinal | Germany | Population based; age 35–74 | 14,732 | Approximately 65% completed both baseline and follow-up (not reported exactly) | Road traffic, aircraft, railways, industrial, neighbourhood, overall noise; day and night | Depression and anxiety disorder; PHQ-9 scores ≥ 10 and GAD 2 scores ≥ 3 | Sex, age, socioeconomic status, employment status, and work shift pattern | Depression: RR = 1.06 95% CI [0.97–1.16]; Anxiety: RR = 1.10 95% CI [1.02–1.19] | No | Most conservative estimates selected. Depression: baseline overall noise annoyance at daytime estimate; anxiety: follow-up overall noise annoyance at nighttime estimate. | |
| Eze, 2020 | Switzerland | Population based; age 29–73 | 4581 | Unclear | Road, railways, and aircraft | Numeric 11-point scale; HA undefined | Depression; physician diagnosis, intake of antidepressant medication or having a SF-36 score < 50 | Age (years), sex (male/female), educational attainment (≤9 years compulsory education/10–13 years corresponding to secondary education or apprenticeship/>13 years corresponding to tertiary education), area and neighborhood socio-economic position. | OR = 1.04 95% CI [1.00–1.11] | No | Most conservative estimates selected | |
| Floud, 2011 | Cross-sectional | UK, Germany, Netherland, Sweden, Italy, Greece | Residents living near airports; age 45–70 | 4642 | Unclear | Aircraft | Depression and anxiety disorder; antidepressant and anxiolytic drug use | Gender, age, and body mass index (BMI), alcohol intake, level of physical activity, educational level, smoking. | Depression: OR = 1.00 95% CI [0.67–1.50]; Anxiety: OR = 1.74 95% CI [1.16–2.61] | No | Annoyed by aircraft noise at night was used. | |
| Hammersen, 2016 | Cross-sectional | Germany | Population based; age 18–99 | 19,294 | 22.1% | Road/air traffic and neighbours | General mental health; MHI-5 scores ≤ 52 | Age, socioeconomic status (SES), and urbanisation grade, (school/vocational education, occupational status, and net equivalent household income used for SES), social support, self-reported chronic disease. | Female: OR = 2.42 95% CI [1.77–3.32]; Male: OR = 2.87 CI [2.01–4.09] | No | ||
| Jensen, 2018 | Cross-sectional | Denmark | Residents living in multistorey houses; age ≥ 16 | 7090 | 61% (2010 survey) and 57% (2013 survey) | Neighbour and traffic | Verbal 3-point; HA undefined; “Very” annoyed to proxy . | General mental health; SF-12 scores ≤ 10th percentile (or score of 32.78) | Sex, age, education, marital status, degree of urbanisation, and the Physical Component Summary (PCS) score from SF-12 | OR = 2.35 95% CI [1.86–2.97] | No | |
| Jensen, 2019 | Cross-sectional | Denmark | Residents living in multi-storey housing; age ≥ 16 | 3893 | 56% | Noise from neighbours | Verbal 3-point; HA undefined; “Very” annoyed to proxy . | Depression and anxiety; unvalidated questionnaire (Self-reported) | Age, sex, marital status, degree of urbanisation, highest level of completed education, ethnic background, and owner/tenant status | Depression: OR = 2.10 95% CI [1.39–3.18]; Anxiety: OR = 2.60 95% CI [1.73–3.91] | No | |
| Maschke, 2007 | Cross-sectional | France, Germany, Slovakia, Hungary, Portugal, Italy, Switzerlan, Latvia | Population based; age 18–59 | 8539 | Unclear | Neighbourhood | Verbal 5-points. Unclear how to define . | Depression; self-reported disease and doctor diagnosed disease | Age, gender, city, traffic noise annoyance, socio-economic-state, consumption of alcohol, smoking behaviour, sports activity, body mass index, satisfaction with residential areas, green areas, The perception of: dampness in dwelling, air quality in dwelling, temperature and heating in winter, daylight in dwelling. | OR = 1.60 95% CI [1.04–2.45] | No | |
| Okokon, 2018 | Cross-sectional | FInland | Population based; age ≥ 25 | 7321 | 47% (2015 survey) and 45% (2016 survey) | Road | Verbal 5-point; top 3 answers grouped as | Depression and anxiety disorder; antidepressant and anxiolytic drug use | Age, sex, marital status, employment status and household income level (average yearly income before taxes), alcohol consumption, current smoking status, weekly frequency of leisure-time physical activity, and pet ownership | Depression: OR = 1.15 95% CI [0.82–1.63]; Anxiety: OR = 1.41 95% CI [1.02–1.95] | No | |
| Schreckenberg, 2010 | Cross-sectional | Germany | Residents living near airports; aged 16 and above | 2312 | 61% | Aircraft | Numeric 11-point and verbal 5-point questionnaires used; unclear how to define | General mental health; SF-12 scores < median SF-36 scores < median; unclear the exact cut-off values | Railway and road traffic sound level, age, gender, socio-economic status, home ownership, residential satisfaction, usual window position in the sleeping room at night, number of hours away from home. | OR = 1.06 95% CI [0.97–1.17] | Yes; LAeq,16 h (categorical: <40, 40–45, 45–50, 50–55, 55–60, ≥60) | Most conservative estimates selected (SF-12) |
| Stansfeld, 2021 | Longitudinal | UK | Male population based; age 45–59 | 2398 | 89.82% at phase 3 and 70.93% at phase 4 | Road | Nonstandard verbal 5-point; top 2 answers grouped as . | General mental health; 4/5 on the GHQ scale | Age, social class, marital status, employment status, smoking status, BMI, alcohol consumption, physical activity at leisure, and noise at work | OR = 2.47 95% CI [1.00–6.13] | No |
Appendix B


References
- Rehm, J.; Shield, K.D. Global Burden of Disease and the Impact of Mental and Addictive Disorders. Curr. Psychiatry Rep. 2019, 21, 10. [Google Scholar] [CrossRef] [PubMed]
- Guski, R.; Schreckenberg, D.; Schuemer, R. WHO Environmental Noise Guidelines for the European Region: A Systematic Review on Environmental Noise and Annoyance. Int. J. Environ. Res. Public Health 2017, 14, 1539. [Google Scholar] [CrossRef] [PubMed]
- McEwen, B.S. Protective and Damaging Effects of Stress Mediators. N. Engl. J. Med. 1998, 338, 171–179. [Google Scholar] [CrossRef] [PubMed]
- Spencer, R.L.; Deak, T. A users guide to HPA axis research. Physiol. Behav. 2017, 178, 43–65. [Google Scholar] [CrossRef]
- World Health Organization. Environmental Noise Guidelines for the European Region. WHO Regional Office for Europe: Copenhagen, Denmark, 2018; Available online: https://www.euro.who.int/en/publications/abstracts/environmental-noise-guidelines-for-the-european-region-2018 (accessed on 29 November 2021).
- European Commission. Noise in Europe. 2021. Available online: https://www.gov.uk/government/publications/noise-action-plans-large-urban-areas-roads-and-railways-2019 (accessed on 29 November 2021).
- Department for Environment Food and Rural Affairs. Noise Action Plan: Agglomerations (Urban Areas). 2019. Available online: https://assets.publishing.service.gov.uk/government/uploads/system/uploads/attachment_data/file/813663/noise-action-plan-2019-agglomerations.pdf (accessed on 29 November 2021).
- Department for Environment Food and Rural Affairs. Noise Action Plan: Railways. 2019. Available online: https://assets.publishing.service.gov.uk/government/uploads/system/uploads/attachment_data/file/813664/noise-action-plan-2019-railways.pdf (accessed on 29 November 2021).
- Department for Environment Food and Rural Affairs. Noise Action Plan: Roads. 2019. Available online: https://assets.publishing.service.gov.uk/government/uploads/system/uploads/attachment_data/file/813666/noise-action-plan-2019-roads.pdf (accessed on 29 November 2021).
- Clark, C.; Crumpler, C.; Notley, H. Evidence for Environmental Noise Effects on Health for the United Kingdom Policy Context: A Systematic Review of the Effects of Environmental Noise on Mental Health, Wellbeing, Quality of Life, Cancer, Dementia, Birth, Reproductive Outcomes, and Cognition. Int. J. Environ. Res. Public Health 2020, 17, 393. [Google Scholar] [CrossRef]
- Clark, C.; Paunovic, K. WHO Environmental Noise Guidelines for the European Region: A Systematic Review on Environmental Noise and Quality of Life, Wellbeing and Mental Health. Int. J. Environ. Res. Public Health 2018, 15, 2400. [Google Scholar] [CrossRef]
- Hegewald, J.; Schubert, M.; Freiberg, A.; Starke, K.R.; Augustin, F.; Riedel-Heller, S.G.; Zeeb, H.; Seidler, A. Traffic Noise and Mental Health: A Systematic Review and Meta-Analysis. Int. J. Environ. Res. Public Health 2020, 17, 6175. [Google Scholar] [CrossRef]
- Schmidt, J.H.; Klokker, M. Health Effects Related to Wind Turbine Noise Exposure: A Systematic Review. PLoS ONE 2014, 9, e114183. [Google Scholar] [CrossRef]
- Hammersen, F.; Niemann, H.; Hoebel, J. Environmental Noise Annoyance and Mental Health in Adults: Findings from the Cross-Sectional German Health Update (GEDA) Study 2012. Int. J. Environ. Res. Public Health 2016, 13, 954. [Google Scholar] [CrossRef]
- Baudin, C.; Lefèvre, M.; Champelovier, P.; Lambert, J.; Laumon, B.; Evrard, A.-S. Aircraft Noise and Psychological Ill-Health: The Results of a Cross-Sectional Study in France. Int. J. Environ. Res. Public Health 2018, 15, 1642. [Google Scholar] [CrossRef]
- Waye, K.P.; van Kempen, E. Non-auditory effects of noise: An overview of the state of the science of the 2017–2020 period. In Proceedings of the International Commission on Biological Effects of Noise, Stockholm, Sweden, 14–17 June 2021. [Google Scholar]
- Clark, C.; Gjestland, T.; Lavia, L.; Notley, H.; Michaud, D.; Morinaga, M. Revising ISO/TS 15666—The noise annoyance standard. In Proceedings of the International Commission on Biological Effects of Noise, Stockholm, Sweden, 14–17 June 2021. [Google Scholar]
- World Health Organization. Depression and Other Common Mental Disorders: Global Health Estimates; World Health Organization: Geneva, Switzerland, 2017. [Google Scholar]
- Moher, D.; Liberati, A.; Tetzlaff, J.; Altman, D.G.; PRISMA Group. Preferred reporting items for systematic reviews and meta-analyses: The PRISMA statement. PLoS Med. 2009, 6, e1000097. [Google Scholar] [CrossRef]
- Page, M.J.; McKenzie, J.E.; Bossuyt, P.M.; Boutron, I.; Hoffmann, T.C.; Mulrow, C.D.; Shamseer, L.; Tetzlaff, J.M.; Akl, E.A.; Brennan, S.E. The PRISMA 2020 statement: An updated guideline for reporting systematic reviews. BMJ 2021, 372, n71. [Google Scholar] [CrossRef]
- Van Kempen, E.; Casas, M.; Pershagen, G.; Foraster, M. Cardiovascular and Metabolic Effects of Environmental Noise: Systematic Evidence Review in the Framework of the Development of the WHO Environmental Noise Guidelines for the European Region. National Institute for Public Health and the Environment, The Netherlands. 2017. Available online: https://rivm.openrepository.com/handle/10029/620941 (accessed on 29 November 2021).
- Héroux, M.; Verbeek, J. Methodology for Systematic Evidence Reviews for WHO Environmental Noise Guidelines for the European Region; World Health Organization: Copenhagen, Denmark, 2018. [Google Scholar]
- Lan, Y.; Roberts, H.; Kwan, M.-P.; Helbich, M. Transportation noise exposure and anxiety: A systematic review and meta-analysis. Environ. Res. 2020, 191, 110118. [Google Scholar] [CrossRef]
- Mucci, N.; Traversini, V.; Lorini, C.; De Sio, S.; Galea, R.P.; Bonaccorsi, G.; Arcangeli, G. Urban noise and psychological distress: A systematic review. Int. J. Environ. Res. Public Health 2020, 17, 6621. [Google Scholar] [CrossRef]
- Dzhambov, A.M.; Lercher, P. Road Traffic Noise Exposure and Depression/Anxiety: An Updated Systematic Review and Meta-Analysis. Int. J. Environ. Res. Public Health 2019, 16, 4134. [Google Scholar] [CrossRef]
- Schultz, T.J. Synthesis of social surveys on noise annoyance. J. Acoust. Soc. Am. 1978, 64, 377–405. [Google Scholar] [CrossRef]
- Morinaga, M.; Nguyen, T.; Yokoshima, S.; Shimoyama, K.; Morihara, T.; Yano, T. The Effect of an Alternative Definition of “Percent Highly Annoyed” on the Exposure—Response Relationship: Comparison of Noise Annoyance Responses Measured by ICBEN 5-Point Verbal and 11-Point Numerical Scales. Int. J. Environ. Res. Public Health 2021, 18, 6258. [Google Scholar] [CrossRef]
- Fields, J.; DE Jong, R.; Gjestland, T.; Flindell, I.; Job, R.; Kurra, S.; Lercher, P.; Vallet, M.; Yano, T.; Guski, R.; et al. Standardized general-purpose noise reaction questions for community noise surveys: Research and a recommendation. J. Sound Vib. 2001, 242, 641–679. [Google Scholar] [CrossRef]
- Eze, I.C.; Foraster, M.; Schaffner, E.; Vienneau, D.; Pieren, R.; Imboden, M.; Wunderli, J.-M.; Cajochen, C.; Brink, M.; Röösli, M.; et al. Incidence of depression in relation to transportation noise exposure and noise annoyance in the SAPALDIA study. Environ. Int. 2020, 144, 10601. [Google Scholar] [CrossRef]
- VanderWeele, T.J.; Ding, P. Sensitivity Analysis in Observational Research: Introducing the E-Value. Ann. Intern. Med. 2017, 167, 268–274. [Google Scholar] [CrossRef]
- Schreckenberg, D.; Meis, M.; Kahl, C.; Peschel, C.; Eikmann, T. Aircraft noise and quality of life around frankfurt airport. Int. J. Environ. Res. Public Health 2010, 7, 3382–3405. [Google Scholar] [CrossRef]
- McGuinness, L.A.; Higgins, J.P. Risk-of-bias VISualization (robvis): An R package and Shiny web app for visualizing risk-of-bias assessments. Res. Synth. Methods 2021, 12, 55–61. [Google Scholar] [CrossRef] [PubMed]
- Chen, D.-G.D.; Peace, K.E. Applied Meta-Analysis with R; CRC Press: Boca Raton, FL, USA, 2013. [Google Scholar]
- Borenstein, M.; Hedges, L.V.; Higgins, J.P.T.; Rothstein, H.R. Introduction to Meta-Analysis, 1st ed.; John Wiley & Sons, Ltd.: Oxford, UK, 2011. [Google Scholar]
- Harris, R.J.; Deeks, J.J.; Altman, D.G.; Bradburn, M.J.; Harbord, R.M.; Sterne, J.A.C. Metan: Fixed- and Random-Effects Meta-Analysis. Stata J. Promot. Commun. Stat. Stata 2008, 8, 3–28. [Google Scholar] [CrossRef]
- StataCorp. Stata Statistical Software: Release 17; StataCorp LLC.: College Station, TX, USA, 2021. [Google Scholar]
- Hoeymans, N.; A Garssen, A.; Westert, G.P.; Verhaak, P.F.M. Measuring mental health of the Dutch population: A comparison of the GHQ-12 and the MHI-5. Health Qual. Life Outcomes 2004, 2, 23. [Google Scholar] [CrossRef][Green Version]
- Guyatt, G.H.; Oxman, A.D.; Vist, G.E.; Kunz, R.; Falck-Ytter, Y.; Alonso-Coello, P.; Schünemann, H.J. GRADE: An emerging consensus on rating quality of evidence and strength of recommendations. BMJ 2008, 336, 924–926. [Google Scholar]
- Stansfeld, S.; Clark, C.; Smuk, M.; Gallacher, J.; Babisch, W. Road traffic noise, noise sensitivity, noise annoyance, psychological and physical health and mortality. Environ. Health 2021, 20, 32. [Google Scholar] [CrossRef] [PubMed]
- Beutel, M.E.; Brähler, E.; Ernst, M.; Klein, E.; Reiner, I.; Wiltink, J.; Michal, M.; Wild, P.S.; Schulz, A.; Münzel, T.; et al. Noise annoyance predicts symptoms of depression, anxiety and sleep disturbance 5 years later. Findings from the Gutenberg Health Study. Eur. J. Public Health 2020, 30, 487–492. [Google Scholar] [CrossRef]
- Jensen, H.A.R.; Rasmussen, B.; Ekholm, O. Neighbour and traffic noise annoyance: A nationwide study of associated mental health and perceived stress. Eur. J. Public Health 2018, 28, 1050–1055. [Google Scholar] [CrossRef]
- Okokon, E.O.; Yli-Tuomi, T.; Turunen, A.W.; Tiittanen, P.; Juutilainen, J.; Lanki, T. Traffic noise, noise annoyance and psychotropic medication use. Environ. Int. 2018, 119, 287–294. [Google Scholar] [CrossRef] [PubMed]
- Beutel, M.E.; Jünger, C.; Klein, E.M.; Wild, P.; Lackner, K.; Blettner, M.; Binder, H.; Michal, M.; Wiltink, J.; Brähler, E.; et al. Noise Annoyance Is Associated with Depression and Anxiety in the General Population- The Contribution of Aircraft Noise. PLoS ONE 2016, 11, e0155357. [Google Scholar] [CrossRef]
- Floud, S.; Vigna-Taglianti, F.; Hansell, A.; Blangiardo, M.; Houthuijs, D.; Breugelmans, O.; Cadum, E.; Babisch, W.; Selander, J.; Pershagen, G.; et al. Medication use in relation to noise from aircraft and road traffic in six European countries: Results of the HYENA study. Occup. Environ. Med. 2010, 68, 518–524. [Google Scholar] [CrossRef]
- Baudin, C.; Lefèvre, M.; Babisch, W.; Cadum, E.; Champelovier, P.; Dimakopoulou, K.; Houthuijs, D.; Lambert, J.; Laumon, B.; Pershagen, G.; et al. The role of aircraft noise annoyance and noise sensitivity in the association between aircraft noise levels and medication use: Results of a pooled-analysis from seven European countries. BMC Public Health 2021, 21, 1–15. [Google Scholar] [CrossRef]
- Maschke, C.; Niemann, H. Health effects of annoyance induced by neighbour noise. Noise Control Eng. J. 2007, 55, 348. [Google Scholar] [CrossRef]
- Jensen, H.A.R.; Rasmussen, B.; Ekholm, O. Neighbour noise annoyance is associated with various mental and physical health symptoms: Results from a nationwide study among individuals living in multi-storey housing. BMC Public Health 2019, 19, 1508. [Google Scholar] [CrossRef]
- Klompmaker, J.O.; Hoek, G.; Bloemsma, L.D.; Wijga, A.H.; van den Brink, C.; Brunekreef, B.; Lebret, E.; Gehring, U.; Janssen, N.A. Associations of combined exposures to surrounding green, air pollution and traffic noise on mental health. Environ. Int. 2019, 129, 525–537. [Google Scholar] [CrossRef]
- Baudin, C.; Lefèvre, M.; Selander, J.; Babisch, W.; Cadum, E.; Carlier, M.-C.; Champelovier, P.; Dimakopoulou, K.; Huithuijs, D.; Lambert, J.; et al. Saliva cortisol in relation to aircraft noise exposure: Pooled-analysis results from seven European countries. Environ. Health 2019, 18, 102. [Google Scholar] [CrossRef]
- Walker, E.F.; Trotman, H.D.; Pearce, B.D.; Addington, J.; Cadenhead, K.S.; Cornblatt, B.A.; Heinssen, R.; Mathalon, D.; Perkins, D.O.; Seidman, L.J.; et al. Cortisol Levels and Risk for Psychosis: Initial Findings from the North American Prodrome Longitudinal Study. Biol. Psychiatry 2013, 74, 410–417. [Google Scholar] [CrossRef]
- Dratva, J.; Zemp, E.; Dietrich, D.F.; Bridevaux, P.-O.; Rochat, T.; Schindler, C.; Gerbase, M.W. Impact of road traffic noise annoyance on health-related quality of life: Results from a population-based study. Qual. Life Res. 2010, 19, 37–46. [Google Scholar] [CrossRef]
- Schreckenberg, D.; Benz, S.; Belke, C.; Möhler, U.; Guski, R. The relationship between aircraft sound levels, noise annoyance and mental well-being: An analysis of moderated mediation. In Proceedings of the International Commission on Biological Effects of Noise, Zurich, Switzerland, 18–22 June 2017; pp. 1–13. [Google Scholar]
- Babisch, W.; Pershagen, G.; Selander, J.; Houthuijs, D.; Breugelmans, O.; Cadum, E.; Vigna-Taglianti, F.; Katsouyanni, K.; Haralabidis, A.S.; Dimakopoulou, K. Noise annoyance—A modifier of the association between noise level and cardiovascular health? Sci. Total Environ. 2013, 452, 50–57. [Google Scholar] [CrossRef]
- BBaudin, C.; Lefèvre, M.; Babisch, W.; Cadum, E.; Champelovier, P.; Dimakopoulou, K.; Houthuijs, D.; Lambert, J.; Laumon, B.; Pershagen, G.; et al. The role of aircraft noise annoyance and noise sensitivity in the association between aircraft noise levels and hypertension risk: Results of a pooled analysis from seven European countries. Environ. Res. 2020, 191, 110179. [Google Scholar] [CrossRef]
- Van Kamp, I.; van Kempen, E.; Baliatsas, C.; Houthuijs, D. Mental health as context rather than health outcome of noise: Competing hypotheses regarding the role of sensitivity, perceived soundscapes and restoration. In Proceedings of the International Congress on Noise Control Engineering, Innsbruck, Austria, 15–18 September 2013; pp. 3804–3811. [Google Scholar]
- Kim, R. Burden of Disease from Environmental Noise; WHO Regional Office for Europe, European Centre for Environment and Health: Bonn, Germany, 2011. [Google Scholar]
- Salvador-Oliván, J.A.; Marco-Cuenca, G.; Arquero-Avilés, R. Errors in search strategies used in systematic reviews and their effects on information retrieval. J. Med. Libr. Assoc. 2019, 107, 210–221. [Google Scholar] [CrossRef] [PubMed]
- Lefèvre, M.; Chaumond, A.; Champelovier, P.; Allemand, L.G.; Lambert, J.; Laumon, B.; Evrard, A.-S. Understanding the relationship between air traffic noise exposure and annoyance in populations living near airports in France. Environ. Int. 2020, 144, 106058. [Google Scholar] [CrossRef] [PubMed]


| Category | Inclusion | Exclusion |
|---|---|---|
| Population | We considered studies that examined the
| |
| Exposure | We restricted noise sources to environmental or neighbourhood noise from road, rail, aircraft, commercial, industrial, wind turbine, and construction activities. To assess noise annoyance, questionnaires were limited to
| We excluded studies examining occupational noise exposure or noise perception. |
| Confounders | No inclusion confounder criteria were used, following methods used for the systematic reviews underpinning the 2018 WHO Noise Guidelines for the European Region [5]. | |
| Outcomes | We considered studies that assessed mental health outcomes using objective or self-reported measures, such as diagnosis of disease or prescription of drugs. We also included studies that implemented mental health screening tools but dichotomised the outcomes as cases or non-cases. | We excluded studies that used mental health screening tools but did not dichotomise the outcomes. |
| Study types |
|
Publisher’s Note: MDPI stays neutral with regard to jurisdictional claims in published maps and institutional affiliations. |
© 2022 by the authors. Licensee MDPI, Basel, Switzerland. This article is an open access article distributed under the terms and conditions of the Creative Commons Attribution (CC BY) license (https://creativecommons.org/licenses/by/4.0/).
Share and Cite
Gong, X.; Fenech, B.; Blackmore, C.; Chen, Y.; Rodgers, G.; Gulliver, J.; Hansell, A.L. Association between Noise Annoyance and Mental Health Outcomes: A Systematic Review and Meta-Analysis. Int. J. Environ. Res. Public Health 2022, 19, 2696. https://doi.org/10.3390/ijerph19052696
Gong X, Fenech B, Blackmore C, Chen Y, Rodgers G, Gulliver J, Hansell AL. Association between Noise Annoyance and Mental Health Outcomes: A Systematic Review and Meta-Analysis. International Journal of Environmental Research and Public Health. 2022; 19(5):2696. https://doi.org/10.3390/ijerph19052696
Chicago/Turabian StyleGong, Xiangpu, Benjamin Fenech, Claire Blackmore, Yingxin Chen, Georgia Rodgers, John Gulliver, and Anna L. Hansell. 2022. "Association between Noise Annoyance and Mental Health Outcomes: A Systematic Review and Meta-Analysis" International Journal of Environmental Research and Public Health 19, no. 5: 2696. https://doi.org/10.3390/ijerph19052696
APA StyleGong, X., Fenech, B., Blackmore, C., Chen, Y., Rodgers, G., Gulliver, J., & Hansell, A. L. (2022). Association between Noise Annoyance and Mental Health Outcomes: A Systematic Review and Meta-Analysis. International Journal of Environmental Research and Public Health, 19(5), 2696. https://doi.org/10.3390/ijerph19052696