
Toxic Psychosocial Stress, Resiliency Resources and Time to Dementia Diagnosis in a Nationally Representative Sample of Older Americans in the Health and Retirement Study from 2006–2016


Abstract
1. Introduction
2. Materials and Methods
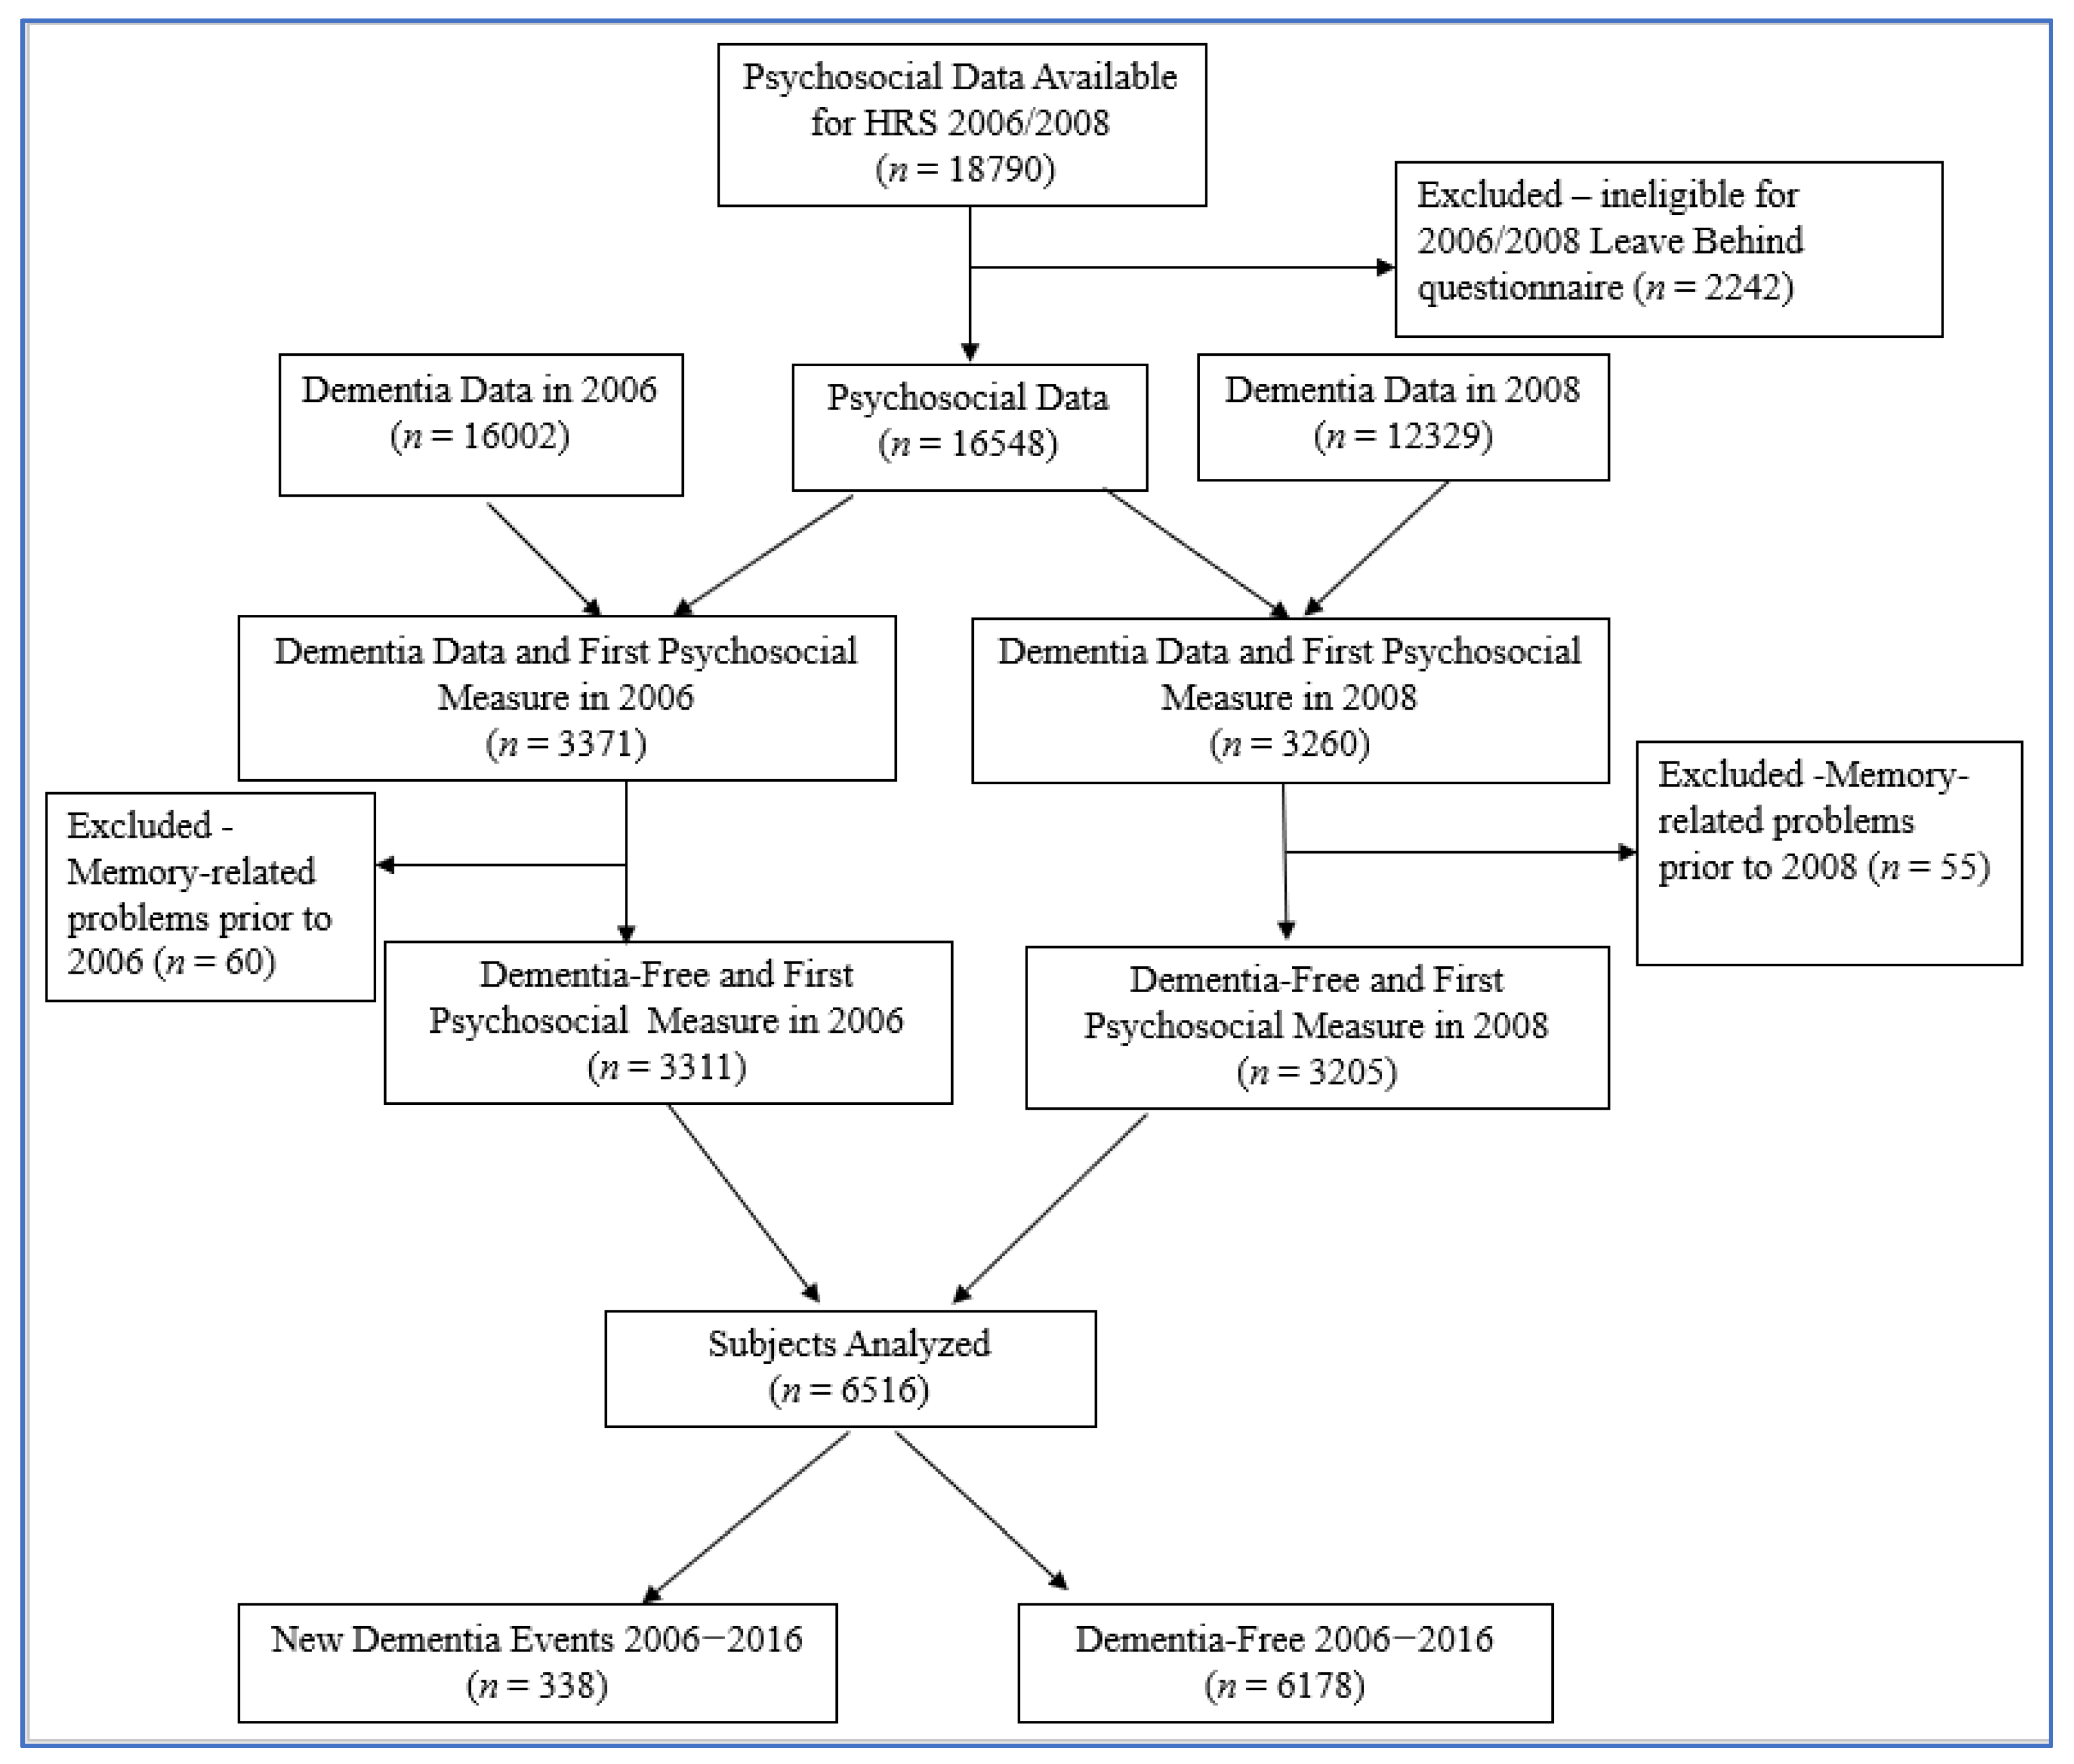
2.1. Study Population
Inclusion and Exclusion Criteria
2.2. Measures
2.2.1. Primary Determinants: Psychosocial Factors
2.2.2. Other Measures
2.2.3. Outcome: Assessment of Dementia
2.3. Statistical Analyses
3. Results
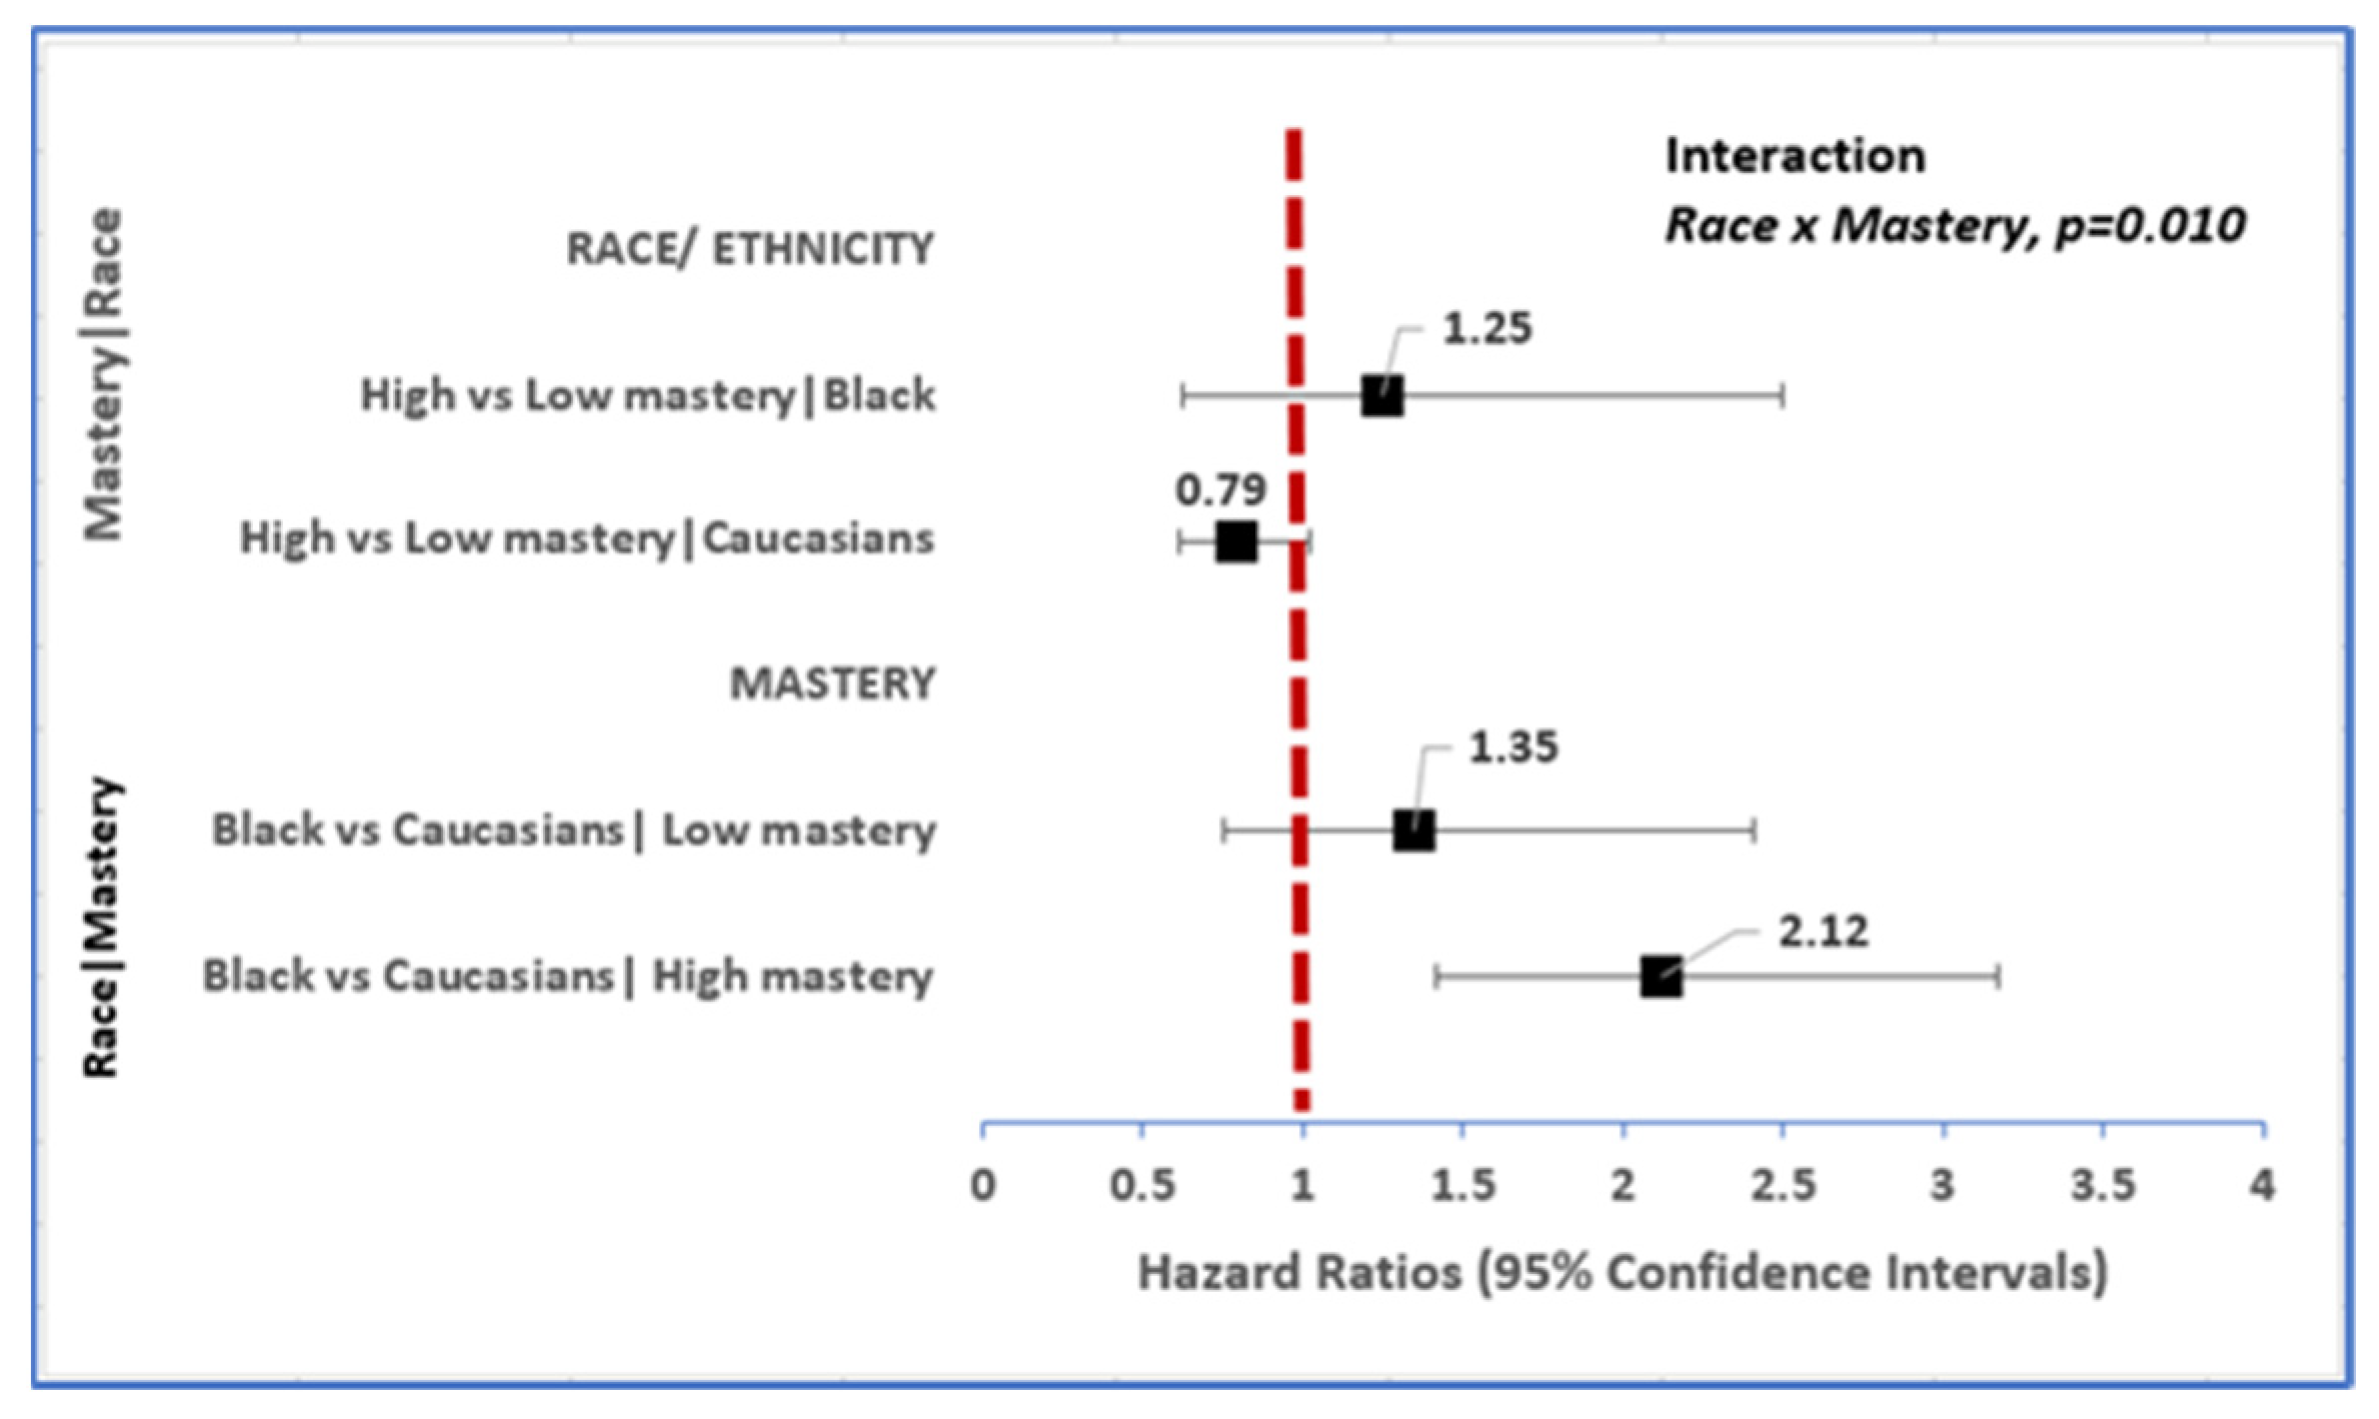
3.1. Race Is Associated with Incident Dementia, and Disparities Persist According to Level of Mastery
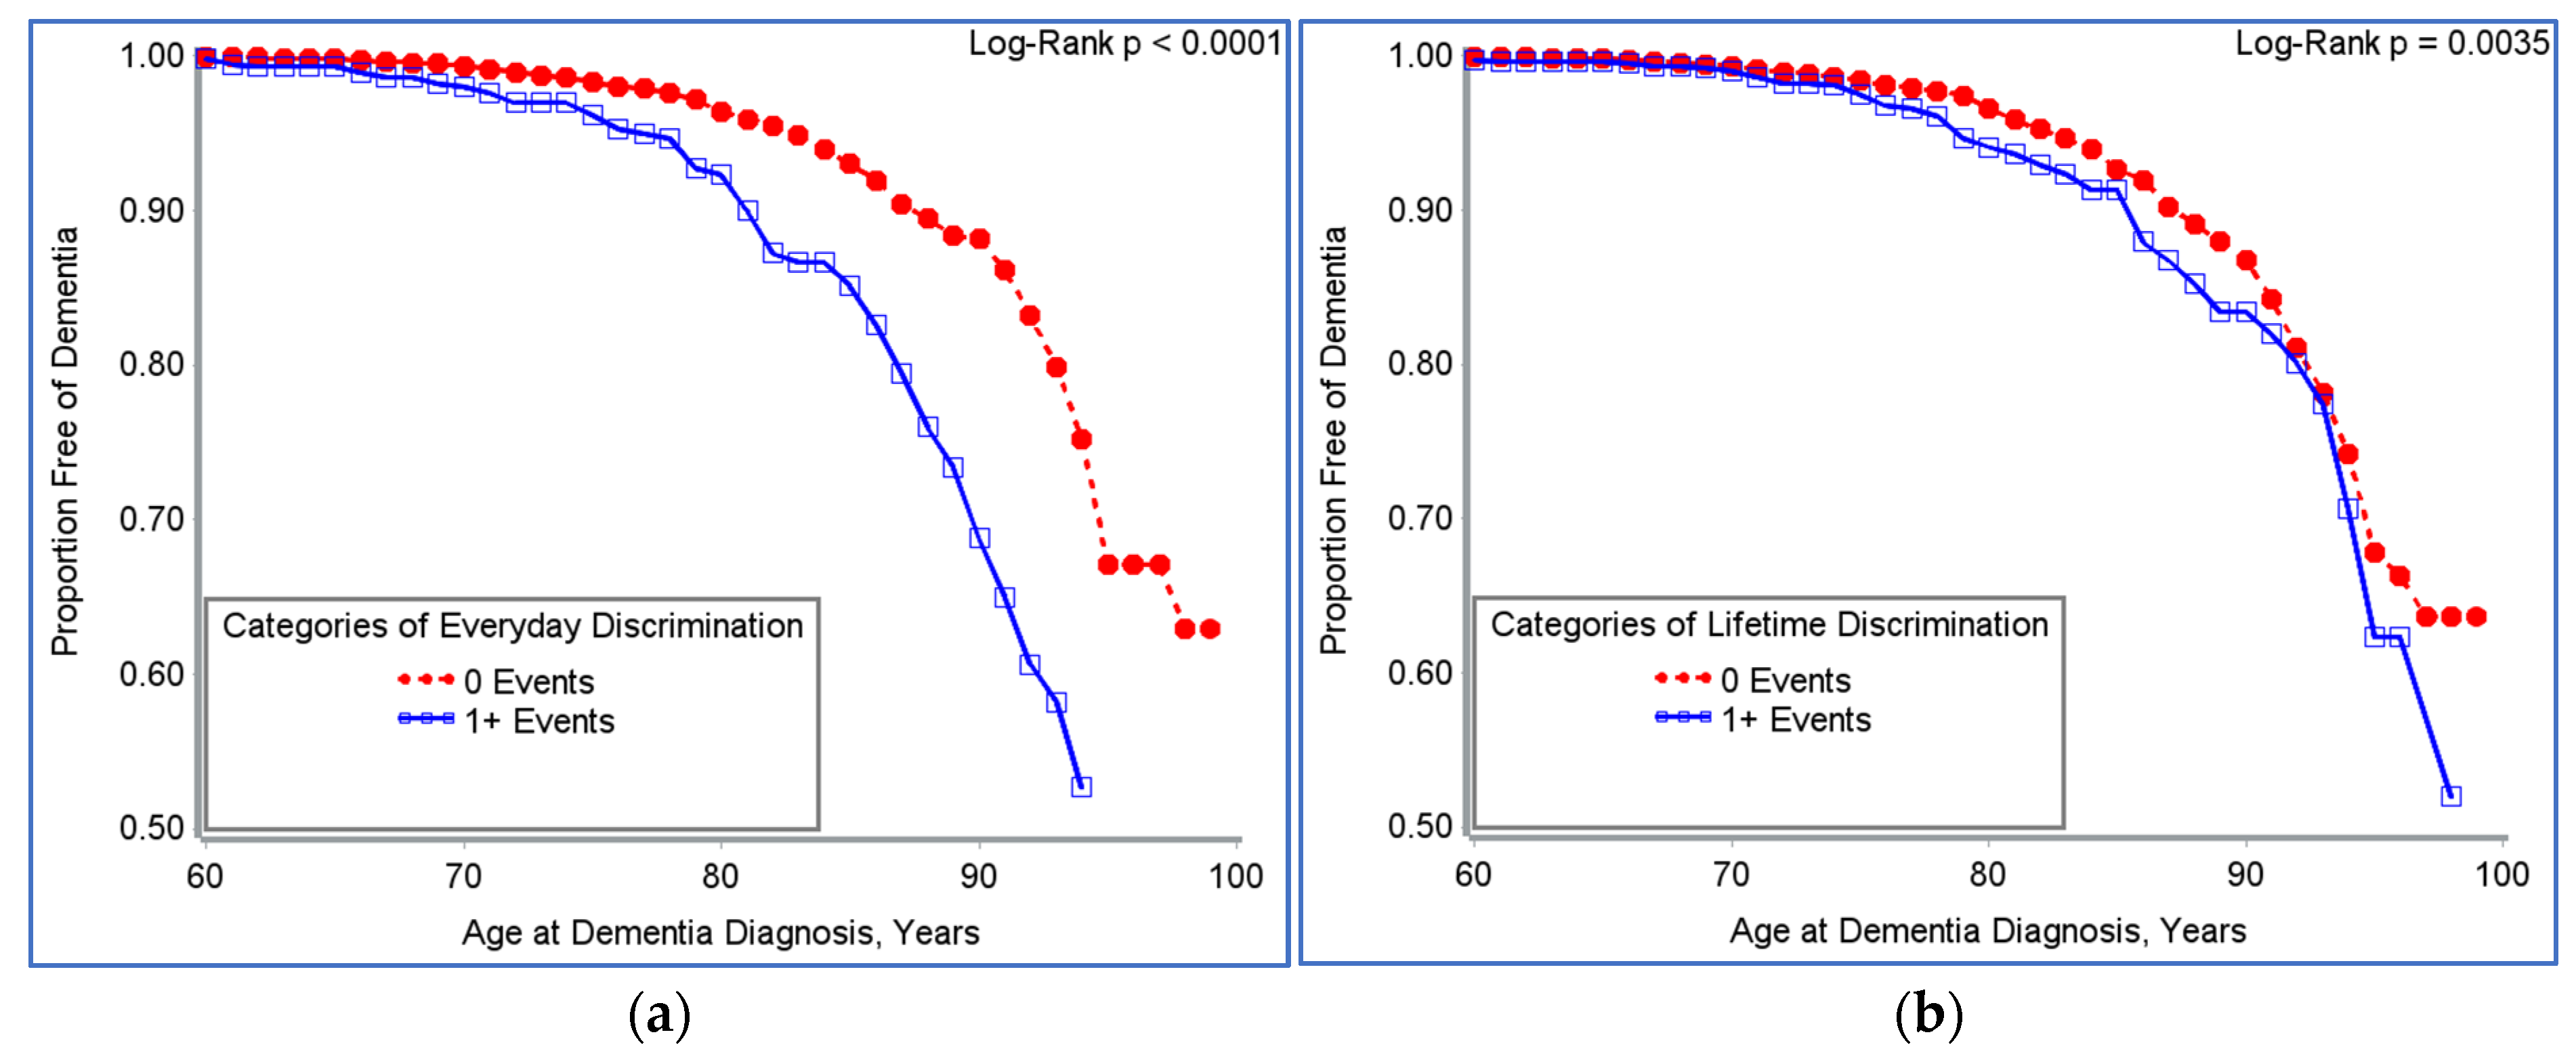
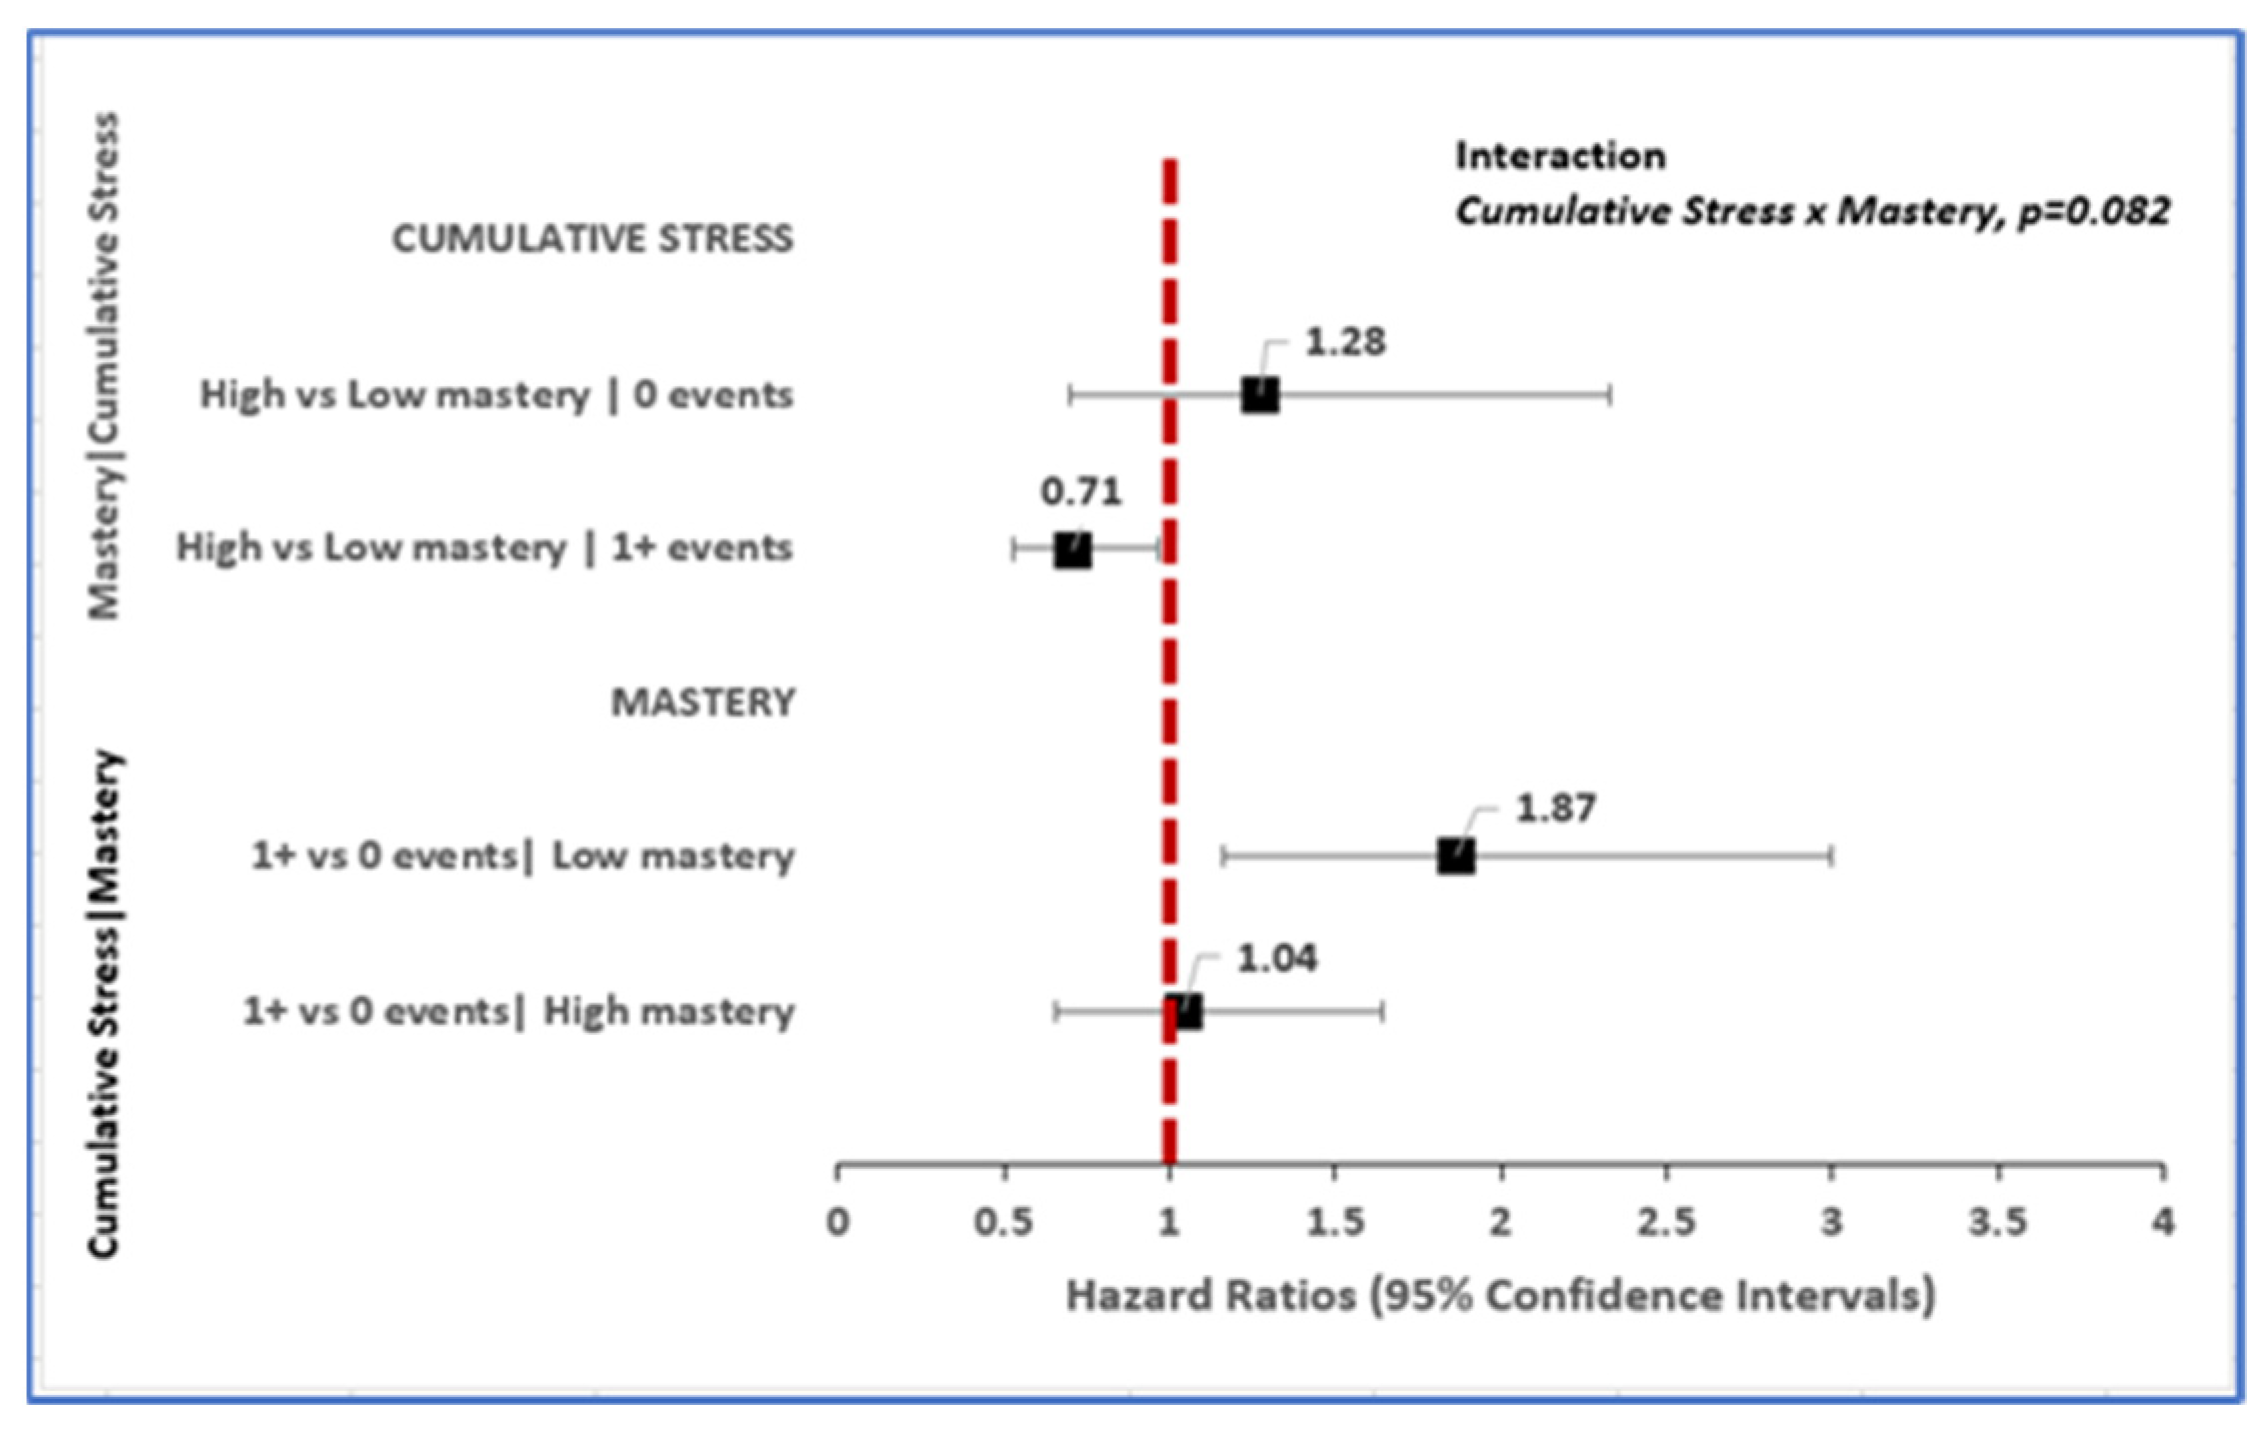
3.2. Toxic Stress Is Associated with Incident Dementia; Relationship Varies by Level of Mastery
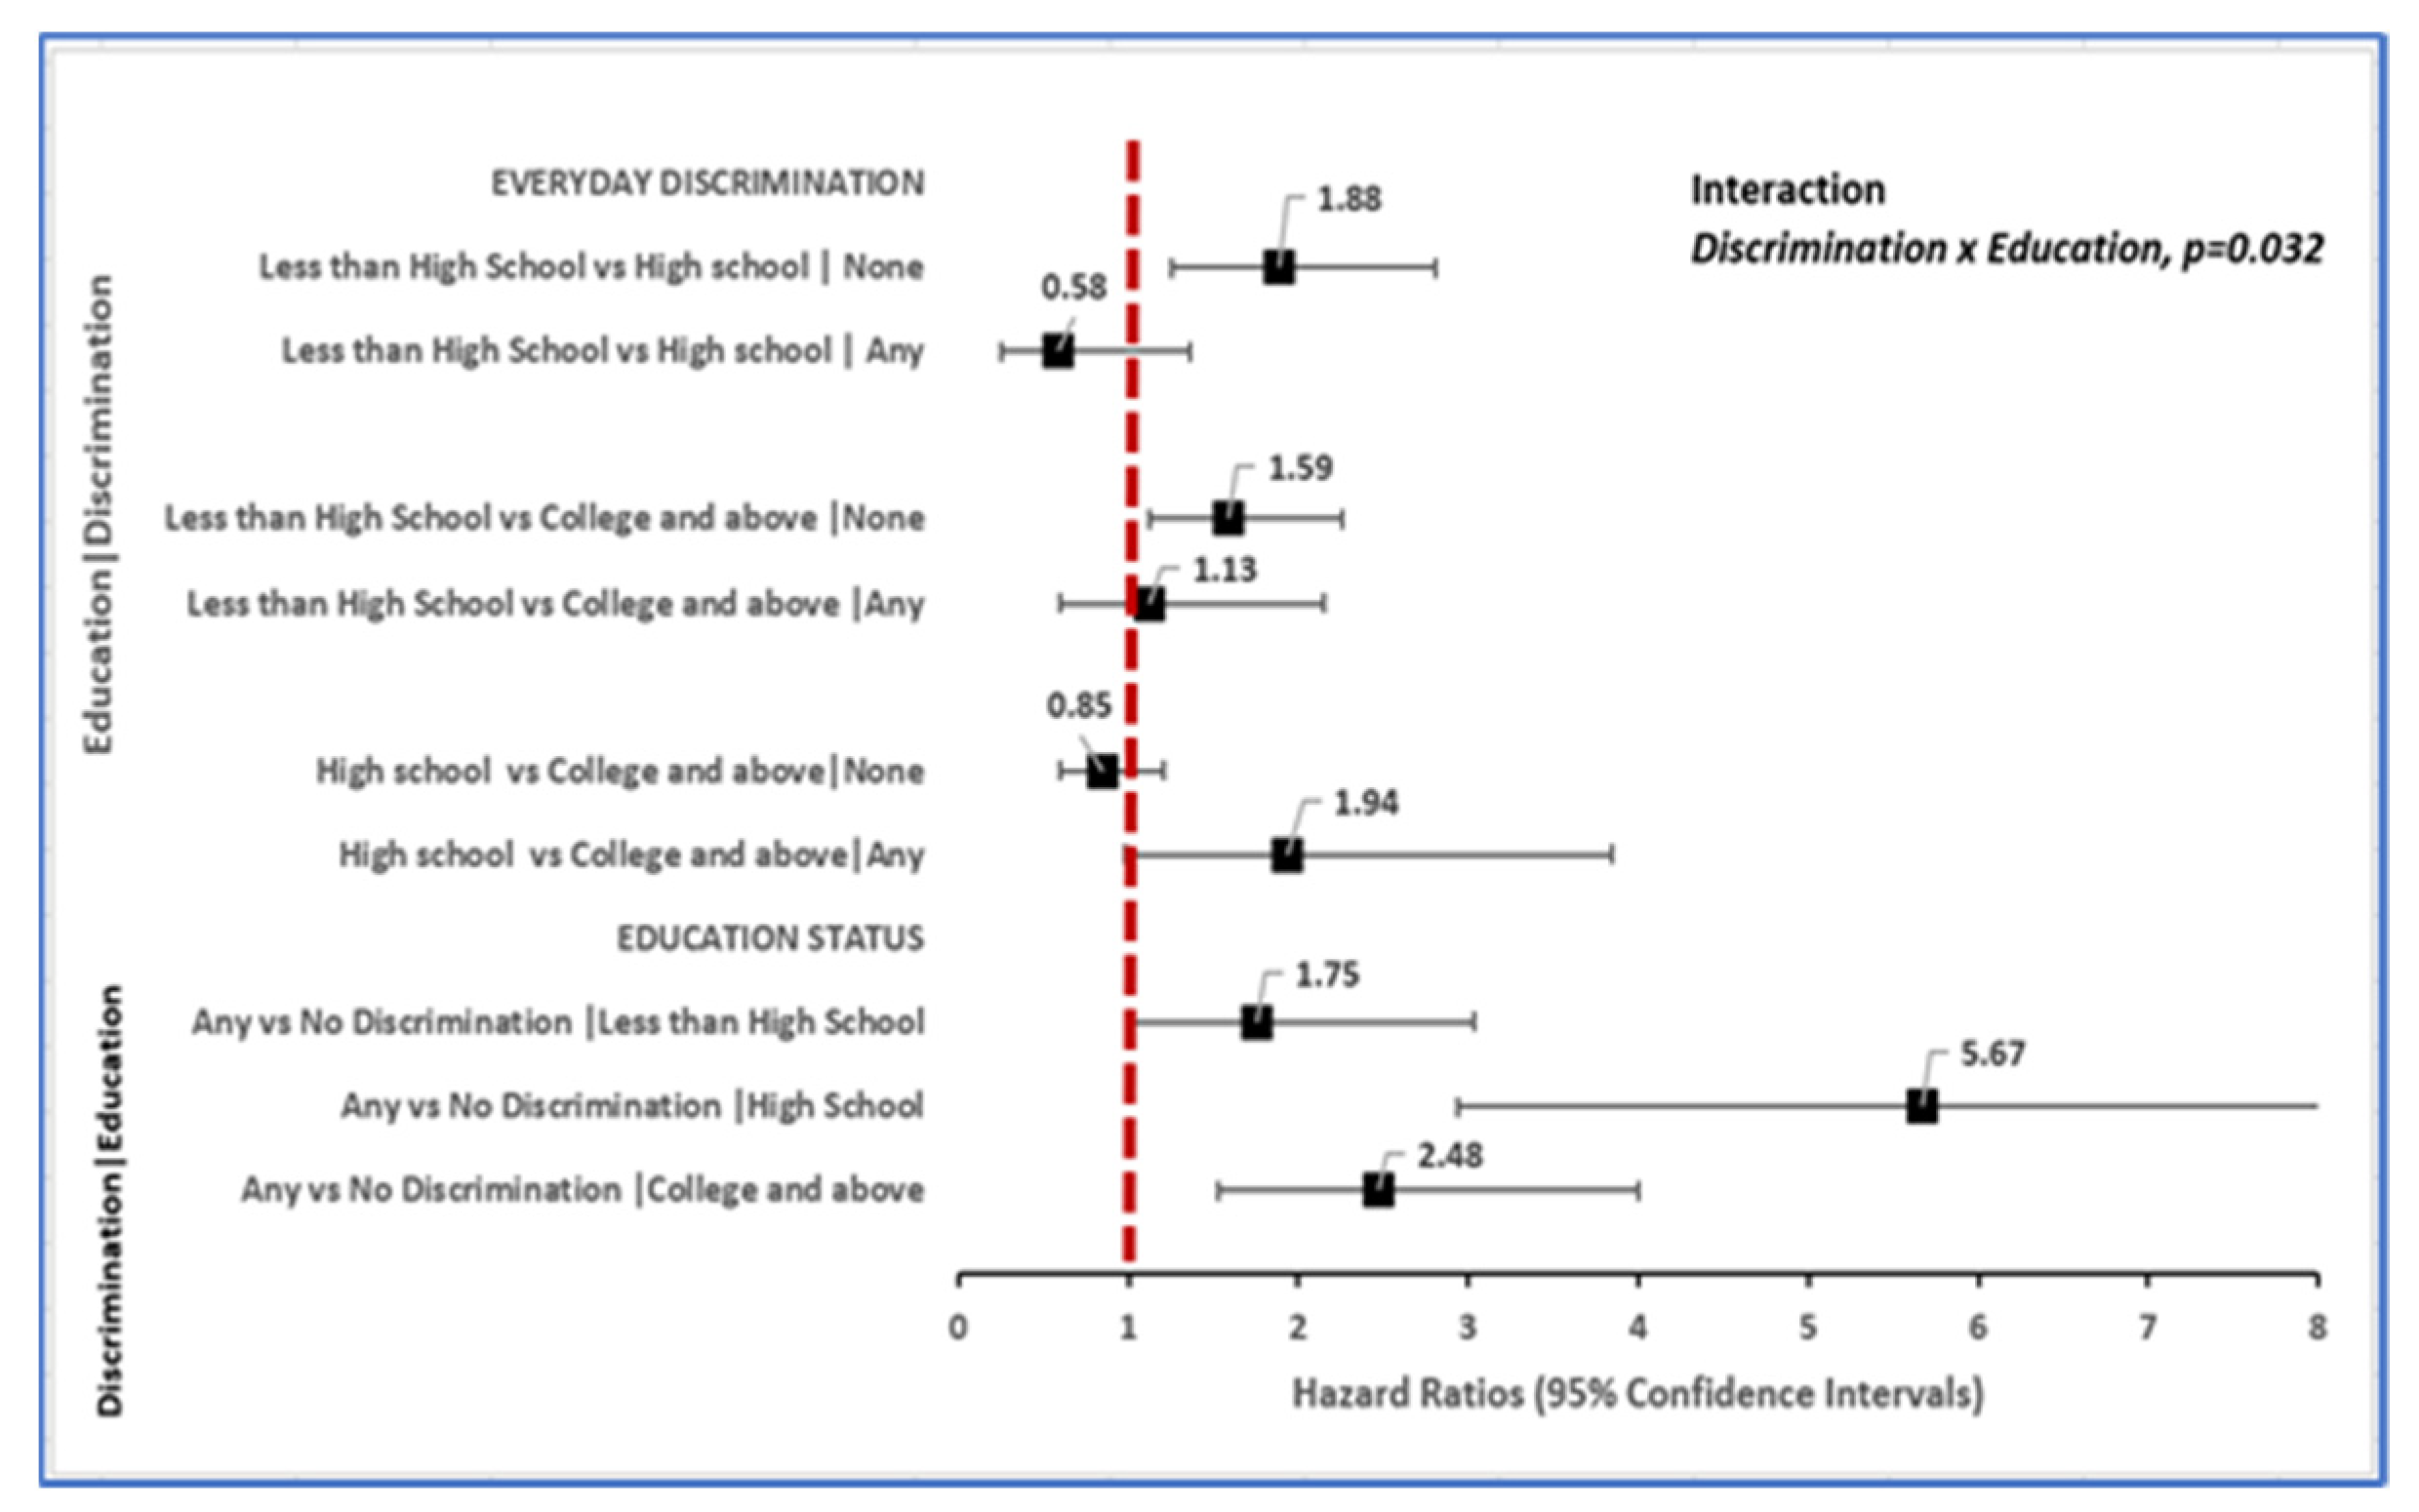
3.3. Toxic Stress Is Associated with Incident Dementia: Relationship Varies by Level of Education
3.4. Other Factors Associated with Incident Dementia
4. Discussion
5. Conclusions
Supplementary Materials
Author Contributions
Funding
Institutional Review Board Statement
Informed Consent Statement
Data Availability Statement
Acknowledgments
Conflicts of Interest
References
- WHO. The Top 10 Causes of Death; World Health Organization: Geneva, Switzerland, 2020.
- James, B.D.; Leurgans, S.E.; Hebert, L.E.; Scherr, P.A.; Yaffe, K.; Bennett, D.A. Contribution of Alzheimer disease to mortality in the United States. Neurology 2014, 82, 1045–1050. [Google Scholar] [CrossRef] [PubMed]
- Gale, S.A.; Acar, D.; Daffner, K.R. Dementia. Am. J. Med. 2018, 131, 1161–1169. [Google Scholar] [CrossRef] [PubMed]
- Matthews, K.A.; Xu, W.; Gaglioti, A.H.; Holt, J.B.; Croft, J.B.; Mack, D.; McGuire, L.C. Racial and ethnic estimates of Alzheimer′s disease and related dementias in the United States (2015–2060) in adults aged ≥ 65 years. Alzheimer′s Dement. 2019, 15, 17–24. [Google Scholar] [CrossRef] [PubMed]
- Gallo, J.J.; Schoen, R.; Jones, R. Cognitive impairment and syndromal depression in estimates of active life expectancy: The 13-year follow-up of the Baltimore Epidemiologic Catchment Area sample. Acta Psychiatr. Scand. 2000, 101, 265–273. [Google Scholar] [CrossRef]
- Portrait, F.; Lindeboom, M.; Deeg, D. Life expectancies in specific health states: Results from a joint model of health status and mortality of older persons. Demography 2001, 38, 525–536. [Google Scholar] [CrossRef]
- Agüero-Torres, H.; Fratiglioni, L.; Guo, Z.; Viitanen, M.; Winblad, B.; Penke, L.; Rafnsson, S.B.; Starr, J.M. Mortality from dementia in advanced age: A 5-year follow-up study of incident dementia cases. J. Clin. Epidemiol. 1999, 52, 737–743. [Google Scholar] [CrossRef]
- Helmer, C.; Joly, P.; Letenneur, L.; Commenges, D.; Dartigues, J.-F. Mortality with Dementia: Results from a French Prospective Community-based Cohort. Am. J. Epidemiol. 2001, 154, 642–648. [Google Scholar] [CrossRef]
- Deary, I.J.; Corley, J.; Gow, A.J.; Harris, S.E.; Houlihan, L.M.; Marioni, R.E.; Penke, L.; Rafnsson, S.B.; Starr, J.M. Age-associated cognitive decline. Br. Med. Bull. 2009, 92, 135–152. [Google Scholar] [CrossRef]
- Hurd, M.D.; Martorell, P.; Delavande, A.; Mullen, K.J.; Langa, K.M. Monetary costs of dementia in the United States. N. Engl. J. Med. 2013, 368, 1326–1334. [Google Scholar] [CrossRef]
- Toseland, R.W.; McCallion, P.; Gerber, T.; Banks, S. Predictors of health and human services use by persons with dementia and their family caregivers. Soc. Sci. Med. 2002, 55, 1255–1266. [Google Scholar] [CrossRef]
- Magariños, A.M.; McEwen, B.S.; Flügge, G.; Fuchs, E. Chronic psychosocial stress causes apical dendritic atrophy of hippocampal CA3 pyramidal neurons in subordinate tree shrews. J. Neurosci. 1996, 16, 3534–3540. [Google Scholar] [CrossRef] [PubMed]
- Fuchs, E.; Czéh, B.; Kole, M.H.; Michaelis, T.; Lucassen, P.J. Alterations of neuroplasticity in depression: The hippocampus and beyond. Eur. Neuropsychopharmacol. J. Eur. Coll. Neuropsychopharmacol. 2004, 14 (Suppl. 5), S481–S490. [Google Scholar] [CrossRef] [PubMed]
- Brunson, K.L.; Kramár, E.; Lin, B.; Chen, Y.; Colgin, L.L.; Yanagihara, T.K.; Baram, T.Z. Mechanisms of late-onset cognitive decline after early-life stress. J. Neurosci. 2005, 25, 9328–9338. [Google Scholar] [CrossRef] [PubMed]
- Heim, C.; Nemeroff, C.B. The role of childhood trauma in the neurobiology of mood and anxiety disorders: Preclinical and clinical studies. Biol. Psychiatry 2001, 49, 1023–1039. [Google Scholar] [CrossRef]
- Hammen, C. Stress and depression. Annu. Rev. Clin. Psychol. 2005, 1, 293–319. [Google Scholar] [CrossRef]
- Hedges, D.W.; Woon, F.L. Early-life stress and cognitive outcome. Psychopharmacology 2010, 214, 121–130. [Google Scholar] [CrossRef]
- Epel, E.S. Psychological and metabolic stress: A recipe for accelerated cellular aging? Hormones 2009, 8, 7–22. [Google Scholar] [CrossRef]
- Nkwata, A.K.; Song, X.; Zhang, M.; Ezeamama, A.E. Correction to: Change in quality of life over eight years in a nationally representative sample of US adults with heart disease and type 2 diabetes: Minority race and toxic stress as key social determinants. BMC Public Health 2020, 20, 684. [Google Scholar] [CrossRef]
- Truelsen, T.; Nielsen, N.; Boysen, G.; Grønbæk, M. Self-reported stress and risk of stroke: The Copenhagen City Heart Study. Stroke 2003, 34, 856–862. [Google Scholar] [CrossRef]
- Everson, S.A.; Lynch, J.W.; Kaplan, G.A.; Lakka, T.; Sivenius, J.; Salonen, J.T. Stress-Induced Blood Pressure Reactivity and Incident Stroke in Middle-Aged Men. Stroke 2001, 32, 1263–1270. [Google Scholar] [CrossRef]
- Aggarwal, N.T.; Clark, C.J.; Beck, T.L.; de Leon, C.F.M.; DeCarli, C.; Evans, D.A.; Everson-Rose, S. Perceived Stress Is Associated with Subclinical Cerebrovascular Disease in Older Adults. Am. J. Geriatr. Psychiatry 2013, 22, 53–62. [Google Scholar] [CrossRef]
- Smith, B.E.; Miles, T.P.; Elkins, J.; Barkin, J.L.; Ebell, M.H.; E Ezeamama, A. The Impact of Stressful Life Events on the Incidence of Type 2 Diabetes in U.S. Adults From the Health and Retirement Study. J. Gerontol. Ser. B Psychol. Sci. Soc. Sci. 2018, 75, 640–649. [Google Scholar] [CrossRef]
- Bonanno, G.A.; Diminich, E. Annual Research Review: Positive adjustment to adversity - trajectories of minimal-impact resilience and emergent resilience. J. Child Psychol. Psychiatry 2012, 54, 378–401. [Google Scholar] [CrossRef]
- Bonanno, G.A.; Westphal, M.; Mancini, A.D. Resilience to loss and potential trauma. Annu. Rev. Clin. Psychol. 2011, 7, 511–535. [Google Scholar] [CrossRef] [PubMed]
- Cheng, C.; Lau, B.H.P.; Chan, M.-P.S. Coping flexibility and psychological adjustment to stressful life changes: A meta-analytic review. Psychol. Bull. 2014, 140, 1582–1607. [Google Scholar] [CrossRef]
- Franke, H.A. Toxic Stress: Effects, Prevention and Treatment. Children 2014, 1, 390–402. [Google Scholar] [CrossRef] [PubMed]
- Masten, A.S. Resilience in children threatened by extreme adversity: Frameworks for research, practice, and translational synergy. Dev. Psychopathol. 2011, 23, 493–506. [Google Scholar] [CrossRef]
- McEwen, B.S. Stress, adaptation, and disease: Allostasis and allostatic load. Ann. N. Y. Acad. Sci. 1998, 840, 33–44. [Google Scholar] [CrossRef]
- Juster, F.T.; Richard, M.S. An Overview of the Health and Retirement Study. J. Hum. Resour. 1995, 30, S7–S56. [Google Scholar] [CrossRef]
- Jacqui, S.; Lindsay, H.R.; Gwenith, G.F.; Amanda, S.; David, W. HRS Psychosocial and Lifestyle Questionnaire 2006–2016; Survey Research Center, Institute for Social Research, University of Michigan: Ann Arbor, MI, USA, 2017. [Google Scholar]
- Nkwata, A.K.; Zhang, M.; Song, X.; Giordani, B.; Ezeamama, A.E. The Relationship of Race, Psychosocial Stress and Resiliency Indicators to Neurocognitive Impairment among Older Americans Enrolled in the Health and Retirement Survey: A Cross-Sectional Study. Int. J. Environ. Res. Public Health 2021, 18, 1358. [Google Scholar] [CrossRef]
- Ezeamama, A.E.; Elkins, J.; Simpson, C.; Smith, S.L.; Allegra, J.C.; Miles, T.P. Indicators of resilience and healthcare outcomes: Findings from the 2010 health and retirement survey. Qual. Life Res. 2016, 25, 1007–1015. [Google Scholar] [CrossRef]
- Aiken, L.S.; West, S.G. Multiple Regression: Testing and Interpreting Interactions; Sage: Newbury Park, CA, USA, 1991. [Google Scholar]
- Greenland, S.J.E. Commentary: Interactions in Epidemiology: Relevance, Identification, and Estimation. Epidemiology 2009, 20, 14–17. [Google Scholar] [CrossRef]
- Steven, G.H.; Connor, J. Technical Description of the Health and Retirement Study Sample Design; Institute for Social Research, University of Michigan: Ann Arbor, MI, USA, 1995. [Google Scholar]
- Simons, R.L.; Lei, M.-K.; Klopack, E.; Beach, S.R.; Gibbons, F.X.; Philibert, R.A. The effects of social adversity, discrimination, and health risk behaviors on the accelerated aging of African Americans: Further support for the weathering hypothesis. Soc. Sci. Med. 2020, 282, 113169. [Google Scholar] [CrossRef]
- Phelan, J.C.; Link, B.; Tehranifar, P. Social Conditions as Fundamental Causes of Health Inequalities: Theory, Evidence, and Policy Implications. J. Health Soc. Behav. 2010, 51, S28–S40. [Google Scholar] [CrossRef]
- Gurland, B.J.; E Wilder, D.; Lantigua, R.; Stern, Y.; Chen, J.; Killeffer, E.H.; Mayeux, R. Rates of dementia in three ethnoracial groups. Int. J. Geriatr. Psychiatry 1999, 14, 481–493. [Google Scholar] [CrossRef]
- Poon, L.W.; Woodard, J.L.; Stephen Miller, L.; Green, R.; Gearing, M.; Davey, A.; Arnold, J.; Martin, P.; Siegler, I.C.; Nahapetyan, L.; et al. Understanding dementia prevalence among centenarians. J. Gerontol. Ser. A Biol. Sci. Med. Sci. 2012, 67, 358–365. [Google Scholar] [CrossRef] [PubMed]
- Barnes, L.L.; Bennett, D.A. Alzheimer’s Disease In African Americans: Risk Factors And Challenges For The Future. Health Aff. 2014, 33, 580–586. [Google Scholar] [CrossRef]
- Mehta, K.M.; Yeo, G.W. Systematic review of dementia prevalence and incidence in United States race/ethnic populations. Alzheimer′s Dement. 2016, 13, 72–83. [Google Scholar] [CrossRef] [PubMed]
- Atkinson, H.H.; Cesari, M.; Kritchevsky, S.B.; Penninx, B.W.; Fried, L.P.; Guralnik, J.M.; Williamson, J.D. Predictors of combined cognitive and physical decline. J. Am. Geriatr. Soc. 2005, 53, 1197–1202. [Google Scholar] [CrossRef]
- Karlamangla, A.S.; Miller-Martinez, D.; Aneshensel, C.S.; Seeman, T.E.; Wight, R.G.; Chodosh, J. Trajectories of Cognitive Function in Late Life in the United States: Demographic and Socioeconomic Predictors. Am. J. Epidemiol. 2009, 170, 331–342. [Google Scholar] [CrossRef] [PubMed]
- Masel, M.C.; Peek, M.K. Ethnic Differences in Cognitive Function Over Time. Ann. Epidemiol. 2009, 19, 778–783. [Google Scholar] [CrossRef] [PubMed]
- Vasquez, E.; Anda, B.; Joan, M.B.; Benjamin, A.S. Racial/Ethnic Differences in Trajectories of Cognitive Function in Older Adults: Role of Education, Smoking, and Physical Activity. J. Aging Health 2016, 28, 1382–1402. [Google Scholar] [CrossRef] [PubMed]
- Castora-Binkley, M.; Peronto, C.L.; Edwards, J.D.; Small, B.J. A longitudinal analysis of the influence of race on cognitive performance. J. Gerontol. Ser. B Psychol. Sci. Soc. Sci. 2015, 70, 512–518. [Google Scholar] [CrossRef] [PubMed]
- Lee, H.B.; Richardson, A.K.; Black, B.S.; Shore, A.D.; Kasper, J.D.; Rabins, P.V. Race and cognitive decline among community-dwelling elders with mild cognitive impairment: Findings from the Memory and Medical Care Study. Aging Ment. Health 2011, 16, 372–377. [Google Scholar] [CrossRef][Green Version]
- Beutel, M.E.; Tibubos, A.N.; Klein, E.M.; Schmutzer, G.; Reiner, I.; Kocalevent, R.D.; Brähler, E. Childhood adversities and distress—The role of resilience in a representative sample. PLoS ONE 2017, 12, e0173826. [Google Scholar] [CrossRef]
- Alley, D.; Suthers, K.; Crimmins, E. Education and cognitive decline in older Americans: Results from the AHEAD sample. Res. Aging 2007, 29, 73–94. [Google Scholar] [CrossRef]
- Batterham, P.J.; Mackinnon, A.J.; Christensen, H. The effect of education on the onset and rate of terminal decline. Psychol. Aging 2011, 26, 339–350. [Google Scholar] [CrossRef]
- Lièvre, A.; Alley, D.; Crimmins, E.M. Educational Differentials in Life Expectancy With Cognitive Impairment Among the Elderly in the United States. J. Aging Health 2008, 20, 456–477. [Google Scholar] [CrossRef]
- Williams, D.R.; Mohammed, S.A. Discrimination and racial disparities in health: Evidence and needed research. J. Behav. Med. 2008, 32, 20–47. [Google Scholar] [CrossRef]
- Williams, D.R.; Yan, Y.; Jackson, J.S.; Anderson, N.B. Racial Differences in Physical and Mental Health: Socio-economic Status, Stress and Discrimination. J. Health Psychol. 1997, 2, 335–351. [Google Scholar] [CrossRef]
- Howard, J.T.; Sparks, P.J. The Role of Education in Explaining Racial/Ethnic Allostatic Load Differentials in the United States. Biodemogr. Soc. Biol. 2015, 61, 18–39. [Google Scholar] [CrossRef] [PubMed]
- Meyer, J.D. Race-based job discrimination, disparities in job control, and their joint effects on health. Am. J. Ind. Med. 2014, 57, 587–595. [Google Scholar] [CrossRef] [PubMed]
- Malat, J.; Mayorga-Gallo, S.; Williams, D.R. The effects of whiteness on the health of whites in the USA. Soc. Sci. Med. 2018, 199, 148–156. [Google Scholar] [CrossRef]
- Marmot, M.; Friel, S.; Bell, R.; Houweling, T.A.J.; Taylor, S.; On behalf of the Commission on Social Determinants of Health. Closing the gap in a generation: Health equity through action on the social determinants of health. Lancet 2008, 372, 1661–1669. [Google Scholar] [CrossRef]


| Characteristic | All (N = 6516) | White/Caucasian (N = 5440) | Black/African American (N = 844) | Other (N = 232) | |
|---|---|---|---|---|---|
| Dimensions of Toxic Stress | N (%) | N (%) | N (%) | N (%) | p-Value |
| Cumulative stress a | |||||
| Median (IQR) | 2.0 (1.0, 3.0) | 2.0 (1.0, 3.0) | 1.0 (1.0, 3.0) | 1.0 (1.0, 3.0) | |
| 0 events | 1358 (22.0) | 1143 (21.9) | 167 (22.2) | 48 (23.1) | 0.9104 |
| 1+ events | 4817 (78.0) | 4073 (78.1) | 584 (77.8) | 160 (76.9) | |
| Life course stress | |||||
| Median (IQR) | 1.0 (0.0, 2.0) | 1.0 (1.0, 2.0) | 1.0 (0.0, 2.0) | 1.0 (0.0, 2.0) | |
| 0 events | 1547 (25.0) | 1299 (24.8) | 193 (25.6) | 55 (26.4) | 0.7962 |
| 1+ events | 4642 (75.0) | 3929 (75.2) | 560 (74.4) | 153 (73.6) | |
| Recent Stress | |||||
| Median (IQR) | 0.0 (0.0, 0.0) | 0.0 (0.0, 0.0) | 0.0 (0.0, 0.0) | 0.0 (0.0, 0.0) | |
| 0 events | 5084 (81.8) | 4320 (82.3) | 598 (78.8) | 166 (78.7) | 0.0292 |
| 1+ events | 1132 (18.2) | 926 (17.7) | 161 (21.2) | 45 (21.3) | |
| Everyday Discrimination | |||||
| Median (IQR) | 1.0 (0.0, 1.0) | 0.0 (0.0, 0.0) | 0.0 (0.0, 0.0) | 0.0 (0.0, 0.0) | |
| 0 events | 5722 (90.7) | 4888 (92.2) | 649 (82.0) | 185 (85.3) | <0.0001 |
| 1+ events | 590 (9.3) | 416 (7.8) | 142 (18.0) | 32 (14.7) | |
| Lifetime Discrimination | |||||
| Median (IQR) | 0.0 (0.0, 1.0) | 0.0 (0.0, 1.0) | 0.0 (0.0, 1.0) | 0.0 (0.0, 1.0) | |
| 0 events | 4397 (70.8) | 3802 (72.6) | 445 (58.8) | 150 (71.1) | <0.0001 |
| 1+ events | 1810 (29.2) | 1437 (27.4) | 312 (41.2) | 61 (28.9) | |
| Chronic work-Discrimination b | |||||
| Median (IQR) | 0.0 (0.0, 0.0) | 0.0 (0.0, 0.0) | 0.0 (0.0, 0.0) | 0.0 (0.0, 0.0) | |
| 0 events | 2852 (91.5) | 2390 (92.3) | 356 (87.7) | 106 (85.5) | 0.0004 |
| 1+ events | 266 (8.5) | 198 (7.7) | 50 (12.3) | 18 (14.5) | |
| Chronic stress | |||||
| Median (IQR) | 3.0 (3.0, 4.0) | 3.0 (3.0, 4.0) | 3.0 (3.0, 4.0) | 3.0 (2.0, 4.0) | |
| Low | 4122 (70.6) | 3519 (71.5) | 473 (66.6) | 130 (64.4) | 0.0039 |
| High | 1712 (29.4) | 1403 (28.5) | 237 (33.4) | 72 (35.6) | |
| Perceived constraints | |||||
| Median (IQR) | 2.0 (1.0, 3.0) | 2.0 (1.0, 3.0) | 2.0 (1.0, 3.0) | 2.0 (1.0, 4.0) | |
| Low | 4214 (66.9) | 3561 (67.3) | 534 (67.5) | 119 (55.6) | 0.0016 |
| High | 2081 (33.1) | 1729 (32.7) | 257 (32.5) | 95 (44.4) | |
| Measures of resilience | |||||
| Personal mastery | |||||
| Median (IQR) | 5.0 (4.0, 6.0) | 5.0 (4.0, 6.0) | 5.0 (4.0, 6.0) | 5.0 (4.0, 6.0) | |
| Low | 2189 (34.7) | 1850 (34.9) | 273 (34.5) | 66 (30.7) | 0.4374 |
| High | 4113 (65.3) | 3446 (65.1) | 518 (65.5) | 149 (69.3) | |
| Control over health | |||||
| Median (IQR) | 8.0 (6.0, 9.0) | 8.0 (6.0 9.0) | 8.0 (6.0, 9.0) | 8.0 (7.0, 9.0) | |
| Low | 2795 (44.8) | 2381 (45.4) | 336 (43.1) | 78 (36.8) | 0.0281 |
| High | 3444 (55.2) | 2866 (54.6) | 444 (56.9) | 134 (63.2) | |
| Control over finances | |||||
| Median (IQR) | 8.0 (6.0, 10.0) | 8.0 (6.0, 10.0) | 8.0 (6.0, 10.0) | 9.0 (7.0, 10.0) | |
| Low | 2207 (35.2) | 1878 (35.6) | 263 (33.4) | 66 (31.0) | 0.2085 |
| High | 4064 (64.8) | 3393 (64.4) | 524 (66.6) | 147 (69.0) | |
| Control over social life | |||||
| Median (IQR) | 8.0 (7.0, 10.0) | 8.0 (7.0, 10.0) | 9.0 (7.0, 10.0) | 9.0 (7.0, 10.0) | |
| Low | 1899 (30.4) | 1630 (31.0) | 207 (26.9) | 62 (29.2) | 0.0637 |
| High | 4342 (69.6) | 3629 (69.0) | 563 (73.1) | 150 (70.8) | |
| Positive Social Support (PSS) | |||||
| PSS: spouses/partners | |||||
| Median (IQR) | 4.0 (3.0, 4.0) | 4.0 (3.0, 4.0) | 3.0 (3.0, 4.0) | 3.0 (3.0, 4.0) | |
| Low | 1882 (42.1) | 1569 (40.6) | 230 (51.8) | 83 (51.2) | <0.0001 |
| High | 2587 (57.9) | 2294 (59.4) | 214 (48.2) | 79 (48.8) | |
| PSS: children | |||||
| Median (IQR) | 3.0 (3.0, 4.0) | 3.0 (3.0, 4.0) | 4.0 (3.0, 4.0) | 3.5 (3.0, 4.0) | |
| Low | 2979 (50.6) | 2559 (51.7) | 320 (43.1) | 100 (50.3) | <0.0001 |
| High | 2910 (49.4) | 2388 (48.3) | 423 (56.9) | 99 (49.7) | |
| PSS: Other family members | |||||
| Median (IQR) | 3.0 (2.0, 4.0) | 3.0 (2.0, 4.0) | 3.0 (3.0, 4.0) | 3.0 (2.0, 4.0) | |
| Low | 4268 (70.0) | 3666 (71.8) | 454 (58.3) | 148 (70.5) | <0.0001 |
| High | 1827 (30.0) | 1441 (28.2) | 324 (41.7) | 62 (29.5) | |
| PSS: Friends | |||||
| Median (IQR) | 3.0 (3.0, 4.0) | 3.0 (3.0, 4.0) | 3.0 (3.0, 4.0) | 3.0 (2.0, 4.0) | |
| Low | 4172 (68.8) | 3539 (69.3) | 484 (64.6) | 149 (71.6) | 0.0391 |
| High | 1889 (31.2) | 1565 (30.7) | 265 (35.4) | 59 (28.4) | |
| PSS: all relationship groups | |||||
| Median (IQR) | 8.0 (7.0, 10.0) | 8.0 (7.0, 10.0) | 8.0 (7.0, 9.0) | 8.0 (7.0, 9.0) | |
| Low | 3502 (55.3) | 2897 (54.4) | 474 (59.6) | 131 (60.4) | 0.0076 |
| High | 2835 (44.7) | 2427 (45.6) | 322 (40.4) | 86 (39.6) | |
| Negative Social Support (NSS) | |||||
| NSS: spouses/partners | |||||
| Median (IQR) | 2.0 (2.0, 2.0) | 2.0 (2.0, 2.0) | 2.0 (2.0, 3.0) | 2.0 (1.0, 3.0) | |
| Low | 3377 (75.7) | 2948 (76.4) | 319 (72.3) | 110 (68.7) | 0.0196 |
| High | 1084 (24.3) | 912 (23.6) | 122 (27.7) | 50 (31.3) | |
| NSS: children | |||||
| Median (IQR) | 2.0 (1.0, 2.0) | 2.0 (1.0, 2.0) | 2.0 (1.0, 2.0) | 2.0 (1.0, 2.0) | |
| Low | 2503 (42.3) | 2162 (43.5) | 260 (34.8) | 81 (40.1) | <0.0001 |
| High | 3416 (57.7) | 2808 (56.5) | 487 (65.2) | 121 (59.9) | |
| NSS: other family members | |||||
| Median (IQR) | 1.0 (1.0, 2.0) | 1.0 (1.0, 2.0) | 1.0 (1.0, 2.0) | 2.0 (1.0, 2.0) | |
| Low | 3459 (56.8) | 3015 (59.1) | 346 (44.5) | 98 (46.9) | <0.0001 |
| High | 2631 (43.2) | 2088 (40.9) | 432 (55.5) | 111 (53.1) | |
| NSS: friends | |||||
| Median (IQR) | 1.0 (1.0, 2.0) | 1.0 (1.0, 2.0) | 1.0 (1.0, 2.0) | 1.0 (1.0, 2.0) | |
| Low | 3900 (64.4) | 3369 (66.1) | 409 (54.5) | 122 (58.6) | <0.0001 |
| High | 2158 (35.6) | 1731 (33.9) | 341 (45.5) | 86 (41.4) | |
| NSS: all relationship groups | |||||
| Median (IQR) | 5.0 (4.0, 7.0) | 5.0 (4.0, 6.0) | 5.0 (4.0, 7.0) | 5.0 (4.0, 7.0) | |
| Low | 3612 (57.0) | 3065 (57.6) | 436 (54.8) | 111 (51.1) | 0.0711 |
| High | 2727 (43.0) | 2261 (42.4) | 360 (45.2) | 106 (48.9) | |
| Onset of Dementia | 0.0959 | ||||
| No | 6178 (94.8) | 5172 (95.1) | 788 (93.4) | 218 (94.0) | |
| Yes | 338 (5.2) | 268 (4.9) | 56 (6.6) | 14 (6.0) |
| Characteristic | n/N | Unadjusted HR (95% CI) | p-Value | Adjusted HR c (95% CI) | p-Value |
|---|---|---|---|---|---|
| Race | |||||
| Black (AA) vs. Caucasian | 56/844 | 1.86 (1.39, 2.48) | <0.0001 | 1.70 (1.20, 2.40) | 0.0033 |
| Other vs. Caucasian | 14/232 | 1.79 (0.96, 3.37) | 0.0674 | 1.41 (0.61, 3.24) | 0.4155 |
| Toxic stress (TS) measures | |||||
| Cumulative stress d | |||||
| Continuous measure | 298/6106 | 1.17 (1.09, 1.30) | 0.0003 | 1.14 (1.04, 1.24) | 0.0071 |
| Baseline cumulative stress | |||||
| 0 events | 55/1358 | 1.00 | 1.00 | ||
| 1+ events | 243/4817 | 1.43 (1.04, 1.98) | 0.029 | 1.37 (0.97, 1.94) | 0.0739 |
| Change in stress (increase vs. no change) | 52/1292 | 1.18 (0.85, 1.63) | 0.3192 | 1.25 (0.88, 1.78) | 0.2137 |
| Life course stress | |||||
| Continuous measure | 299/6120 | 1.18 (1.07, 1.29) | 0.0011 | 1.13 (1.03, 1.24) | 0.0133 |
| Baseline life course stress | |||||
| 0 events | 58/1547 | 1.00 | 1.00 | ||
| 1+ events | 241/4401 | 1.47 (1.10, 1.96) | 0.0097 | 1.42 (1.05, 1.92) | 0.0244 |
| Change in stress (increase vs. no change) | 51/1143 | 1. 30 (0.92, 1.84) | 0.1324 | 1.40 (0.97, 2.02) | 0.0744 |
| Recent stress | |||||
| Continuous measure | 301/6147 | 1.28 (1.01, 1.64) | 0.0427 | 1.25 (0.97, 1.62) | 0.0891 |
| Baseline recent stress | |||||
| 0 events | 254/5084 | 1.00 | 1.00 | ||
| 1+ events | 47/1132 | 1.49 (1.03, 2.16) | 0.0389 | 1.39 (0.95, 2.03) | 0.0854 |
| Change in stress (increase vs. no change) | 19/613 | 1.01 (0.60, 1.70) | 0.9718 | 1.01 (0.56, 1.80) | 0.9842 |
| Everyday discrimination | |||||
| Continuous measure | 310/6241 | 1.66 (1.45, 1.89) | <0.0001 | 1.60 (1.37, 1.87) | <0.0001 |
| Baseline everyday discrimination | |||||
| 0 events | 242/5722 | 1.00 | 1.00 | ||
| 1+ events | 68/590 | 2.84 (2.03, 3.96) | <0.0001 | 2.74 (1.89, 3.98) | <0.0001 |
| Change in stress (increase vs. no change) | 10/148 | 2.23 (1.11, 4.49) | 0.0257 | 2.65 (1.32, 5.29) | 0.0069 |
| Lifetime discrimination | |||||
| Continuous measure | 300/6138 | 1.23 (1.04, 1.44) | 0.0134 | 1.20 (1.00, 1.44) | 0.0556 |
| Baseline lifetime discrimination | |||||
| 0 events | 209/4397 | 1.00 | 1.00 | ||
| 1+ events | 91/1810 | 1.40 (1.07, 1.83) | 0.0161 | 1.33 (0.98, 1.81) | 0.0695 |
| Change in stress (increase vs. no change) | 17/475 | 1.49 (0.87, 2.55) | 0.1425 | 1.56 (0.86, 2.85) | 0.1399 |
| Chronic work discrimination | |||||
| Continuous measure | 95/3060 | 1.13 (0.76, 1.68) | 0.5388 | 0.81 (0.41, 1.60) | 0.542 |
| Baseline work discrimination | |||||
| 0 events | 84/2852 | 1.00 | 1.00 | ||
| 1+ events | 11/266 | 1.42 (0.73, 2.78) | 0.2969 | 0.92 (0.34, 2.52) | 0.8704 |
| Perceived constraints | |||||
| Continuous measure | 310/6224 | 1.24 (1.13, 1.36) | <0.0001 | 1.22 (1.10, 1.35) | 0.0002 |
| Baseline perceived constraints | |||||
| Low constraints | 151/4214 | 1.00 | 1.00 | ||
| High constraints | 159/2081 | 1.61 (1.21, 2.13) | 0.0016 | 1.61 (1.19, 2.18) | 0.0024 |
| Change in stress (increase vs. no change) | 47/1084 | 1.45 (0.98, 2.14) | 0.0633 | 1.71 (1.13, 2.58) | 0.0115 |
| Ongoing chronic stressors | |||||
| Continuous measure | 227/5765 | 1.35 (1.16, 1.58) | 0.0002 | 1.31 (1.11, 1.56) | 0.0021 |
| Baseline chronic stress | |||||
| Low chronic stress | 140/4122 | 1.00 | 1.00 | ||
| High chronic stress | 87/1712 | 2.04 (1.50, 2.79) | <0.0001 | 1.99 (1.37, 2.88) | 0.0005 |
| Change in stress (increase vs. no change) | 32/859 | 1.34 (0.86, 2.10) | 0.1911 | 1.60 (1.02, 2.52) | 0.0428 |
| Resilience-promoting factors (RPF) | |||||
| Personal mastery | |||||
| Continuous measure | 310/6231 | 0.87 (0.78, 0.97) | 0.0117 | 0.86 (0.77, 0.97) | 0.0119 |
| Baseline personal mastery | |||||
| Low mastery | 152/2189 | 1.00 | 1.00 | ||
| High mastery | 158/4113 | 0.80 (0.63, 1.02) | 0.0723 | 0.78 (0.59, 1.02) | 0.0659 |
| Change in measure (decrease vs. no change) | 45/1064 | 1.12 (0.79, 1.56) | 0.533 | 1.13 (0.81, 1.57) | 0.3464 |
| Positive social support (PSS) domains | |||||
| PSS from spouses/partners | |||||
| Continuous measure | 211/4403 | 0.92 (0.71, 1.19) | 0.5164 | 0.98 (0.76, 1.28) | 0.9069 |
| Baseline PSS (spouse/partner) | |||||
| Low PSS | 94/1882 | 1.00 | 1.00 | ||
| High PSS | 117/2587 | 0.94 (0.67, 1.31) | 0.7023 | 1.05 (0.73, 1.50) | 0.791 |
| Change in measure (decrease vs. no change) | 15/394 | 1.08 (0.60, 1.93) | 0.7954 | 1.11 (0.60, 2.05) | 0.7408 |
| PSS from children | |||||
| Continuous measure | 291/5820 | 0.77 (0.62, 0.94) | 0.0134 | 0.78 (0.63, 0.97) | 0.0276 |
| Baseline PSS (Children) | |||||
| Low PSS | 138/2979 | 1.00 | 1.00 | ||
| High PSS | 153/2910 | 0.76 (0.60, 0.95) | 0.0182 | 0.76 (0.61, 0.96) | 0.0193 |
| Change in measure (decrease vs. no change) | 34/804 | 1.13 (0.74, 1.71) | 0.565 | 1.26 (0.84, 1.88) | 0.2559 |
| PSS from other family members | |||||
| Continuous measure | 295/6024 | 1.03 (0.90, 1.19) | 0.6656 | 1.00 (0.86, 1.17) | 0.9528 |
| Baseline PSS (family) | |||||
| Low PSS | 201/4268 | 1.00 | 1.00 | ||
| High PSS | 94/1827 | 0.89 (0.66, 1.18) | 0.398 | 0.82 (0.60, 1.13) | 0.2219 |
| Change in measure (decrease vs. no change) | 38/947 | 1.13 (0.73, 1.78) | 0.5732 | 1.24 (0.76, 2.02) | 0.3851 |
| PSS from friends | |||||
| Continuous measure | 292/5994 | 0.99 (0.82, 1.20) | 0.9427 | 1.04 (0.85, 1.27) | 0.6909 |
| Baseline PSS (friends) | |||||
| Low PSS | 206/4172 | 1.00 | 1.00 | ||
| High PSS | 86/1889 | 0.99 (0.73, 1.33) | 0.989 | 1.04 (0.75, 1.45) | 0.8085 |
| Change in measure (decrease vs. no change) | 28/824 | 0.95 (0.56, 1.63) | 0.8593 | 0.99 (0.56, 1.73) | 0.9611 |
| PSS from all relationship groups | |||||
| Continuous measure | 314/6265 | 1.05 (0.99, 1.11) | 0.1288 | 1.03 (0.97, 1.09) | 0.3369 |
| Baseline PSS (all groups) | |||||
| Low PSS | 172/3502 | 1.00 | 1.00 | ||
| High PSS | 142/2835 | 1.21 (0.93, 1.55) | 0.1456 | 1.04 (0.78, 1.39) | 0.7726 |
| Change in measure (decrease vs. no change) | 57/1311 | 1.40 (0.95, 2.06) | 0.0902 | 1.40 (0.92, 2.13) | 0.1106 |
| Negative social support (NSS) domains | |||||
| NSS from spouses/partners | |||||
| Continuous measure | 209/4395 | 1.13 (0.91, 1.40) | 0.2722 | 1.07 (0.84, 1.36) | 0.5814 |
| Baseline NSS (spouse/partner) | |||||
| Low NSS | 156/3377 | 1.00 | 1.00 | ||
| High NSS | 53/1084 | 1.17 (0.83, 1.65) | 0.3627 | 1.12 (0.72, 1.74) | 0.6077 |
| Change in measure (increase vs. no change) | 23/528 | 1.72 (0.95, 3.12) | 0.0731 | 1.83 (0.91, 3.68) | 0.087 |
| NSS from children | |||||
| Continuous measure | 293/5850 | 1.41 (1.16, 1.72) | 0.001 | 1.35 (1.08, 1.69) | 0.0102 |
| Baseline NSS (children) | |||||
| Low NSS | 102/2503 | 1.00 | 1.00 | ||
| High NSS | 191/3416 | 1.77 (1.27, 2.46) | 0.0011 | 1.68 (1.16, 2.45) | 0.0069 |
| Change in measure (increase vs. no change) | 25/772 | 1.06 (0.65, 1.73) | 0.8272 | 1.12 (0.66, 1.90) | 0.6626 |
| NSS from other family members | |||||
| Continuous measure | 293/6019 | 1.52 (1.24, 1.86) | 0.0001 | 1.43 (1.14, 1.80) | 0.0028 |
| Baseline NSS (family) | |||||
| Low NSS | 156/3459 | 1.00 | 1.00 | ||
| High NSS | 137/2361 | 1.82 (1.37, 2.42) | <0.0001 | 1.77 (1.29, 2.44) | 0.0007 |
| Change in measure (increase vs. no change) | 42/876 | 1.40 (0.93, 2.10) | 0.1038 | 1.50 (0.99, 2.26) | 0.0563 |
| NSS from friends | |||||
| Continuous measure | 292/5991 | 1.43 (1.12, 1.82) | 0.0051 | 1.33 (1.03, 1.70) | 0.0268 |
| Baseline NSS (friends) | |||||
| Low NSS | 171/3900 | 1.00 | 1.00 | ||
| High NSS | 121/2158 | 1.54 (1.13, 2.10) | 0.0074 | 1.58 (1.14, 2.21) | 0.0073 |
| Change in measure (increase vs. no change) | 34/693 | 1.70 (1.00, 2.89) | 0.0495 | 1.85 (1.12, 3.05) | 0.0171 |
| NSS from all relationship groups | |||||
| Continuous measure | 314/6267 | 1.18 (1.11, 1.26) | <0.0001 | 1.14 (1.06, 1.23) | 0.0004 |
| Baseline NSS (all groups) | |||||
| Low NSS | 172/3612 | 1.00 | 1.00 | ||
| High NSS | 142/2727 | 1.73 (1.34, 2.24) | <0.0001 | 1.68 (1.22, 2.33) | 0.0022 |
| Change in measure (increase vs. no change) | 75/1695 | 1.29 (0.93, 1.80) | 0.1269 | 1.48 (1.03, 2.11) | 0.0321 |
| Control of social life | |||||
| Continuous measure | 306/6172 | 0.86 (0.83, 0.88) | <0.0001 | 0.86 (0.83, 0.89) | <0.0001 |
| Baseline control of social life | |||||
| Low control | 162/1899 | 1.00 | 1.00 | ||
| High control | 144/4342 | 0.43 (0.35, 0.54) | <0.0001 | 0.43 (0.34, 0.54) | <0.0001 |
| Change in measure (decrease vs. no change) | 44/1308 | 0.97 (0.68, 1.40) | 0.8718 | 1.29 (0.86, 1.95) | 0.2156 |
| Control of health | |||||
| Continuous measure | 306/6169 | 0.90 (0.85, 0.95) | 0.0001 | 0.90 (0.85, 0.96) | 0.0014 |
| Baseline control of health | |||||
| Low control | 172/2795 | 1.00 | 1.00 | ||
| High control | 134/3444 | 0.69 (0.52, 0.90) | 0.0074 | 0.71 (0.52, 0.96) | 0.0286 |
| Change in measure (decrease vs. no change) | 46/1364 | 0.91 (0.63, 1.30) | 0.5881 | 0.99 (0.67, 1.45) | 0.9555 |
| Control of finances | |||||
| Continuous measure | 2309/6201 | 0.89 (0.85, 0.93) | <0.0001 | 0.90 (0.86, 0.94) | <0.0001 |
| Baseline control of finances | |||||
| Low control | 143/2207 | 1.00 | 1.00 | ||
| High control | 166/4064 | 0.53 (0.41, 0.69) | <0.0001 | 0.55 (0.42, 0.73) | <0.0001 |
| Change in measure (increase vs. no change) | 59/1724 | 0.87 (0.65, 1.17) | 0.348 | 1.06 (0.77, 1.47) | 0.7022 |
Publisher’s Note: MDPI stays neutral with regard to jurisdictional claims in published maps and institutional affiliations. |
© 2022 by the authors. Licensee MDPI, Basel, Switzerland. This article is an open access article distributed under the terms and conditions of the Creative Commons Attribution (CC BY) license (https://creativecommons.org/licenses/by/4.0/).
Share and Cite
Nkwata, A.K.; Zhang, M.; Song, X.; Giordani, B.; Ezeamama, A.E. Toxic Psychosocial Stress, Resiliency Resources and Time to Dementia Diagnosis in a Nationally Representative Sample of Older Americans in the Health and Retirement Study from 2006–2016. Int. J. Environ. Res. Public Health 2022, 19, 2419. https://doi.org/10.3390/ijerph19042419
Nkwata AK, Zhang M, Song X, Giordani B, Ezeamama AE. Toxic Psychosocial Stress, Resiliency Resources and Time to Dementia Diagnosis in a Nationally Representative Sample of Older Americans in the Health and Retirement Study from 2006–2016. International Journal of Environmental Research and Public Health. 2022; 19(4):2419. https://doi.org/10.3390/ijerph19042419
Chicago/Turabian StyleNkwata, Allan K., Ming Zhang, Xiao Song, Bruno Giordani, and Amara E. Ezeamama. 2022. "Toxic Psychosocial Stress, Resiliency Resources and Time to Dementia Diagnosis in a Nationally Representative Sample of Older Americans in the Health and Retirement Study from 2006–2016" International Journal of Environmental Research and Public Health 19, no. 4: 2419. https://doi.org/10.3390/ijerph19042419
APA StyleNkwata, A. K., Zhang, M., Song, X., Giordani, B., & Ezeamama, A. E. (2022). Toxic Psychosocial Stress, Resiliency Resources and Time to Dementia Diagnosis in a Nationally Representative Sample of Older Americans in the Health and Retirement Study from 2006–2016. International Journal of Environmental Research and Public Health, 19(4), 2419. https://doi.org/10.3390/ijerph19042419