
Financing Constraints, Carbon Emissions and High-Quality Urban Development—Empirical Evidence from 290 Cities in China


Abstract
:1. Introduction
2. Mechanism Analysis
2.1. The Effect of Financing Constraints on the High-Quality Urban Development
2.2. The Effect of Financing Constraints on High-Quality Urban Development through Carbon Emissions
3. Study Design
3.1. Measurement Model Setting
3.2. Variable Measurement and Data Description
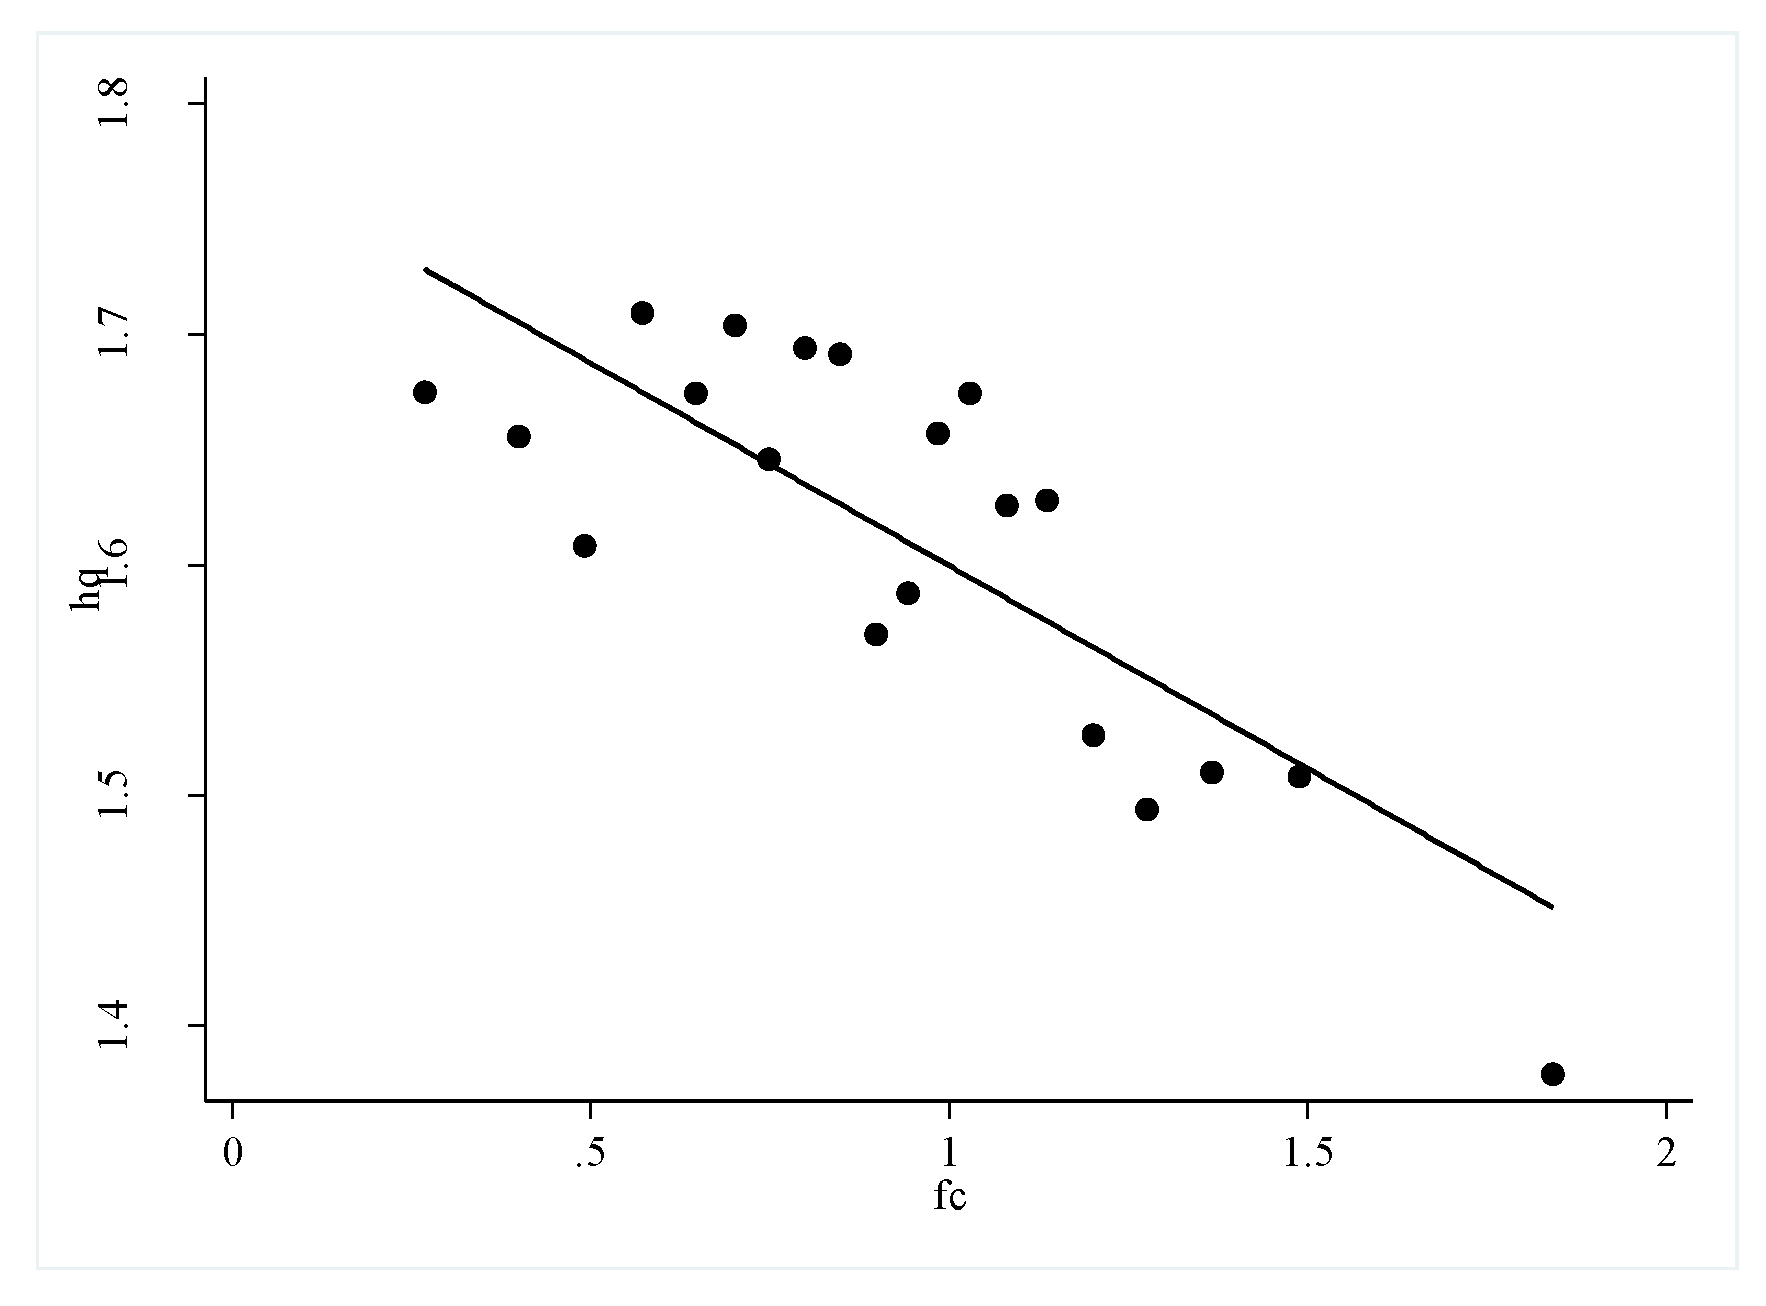
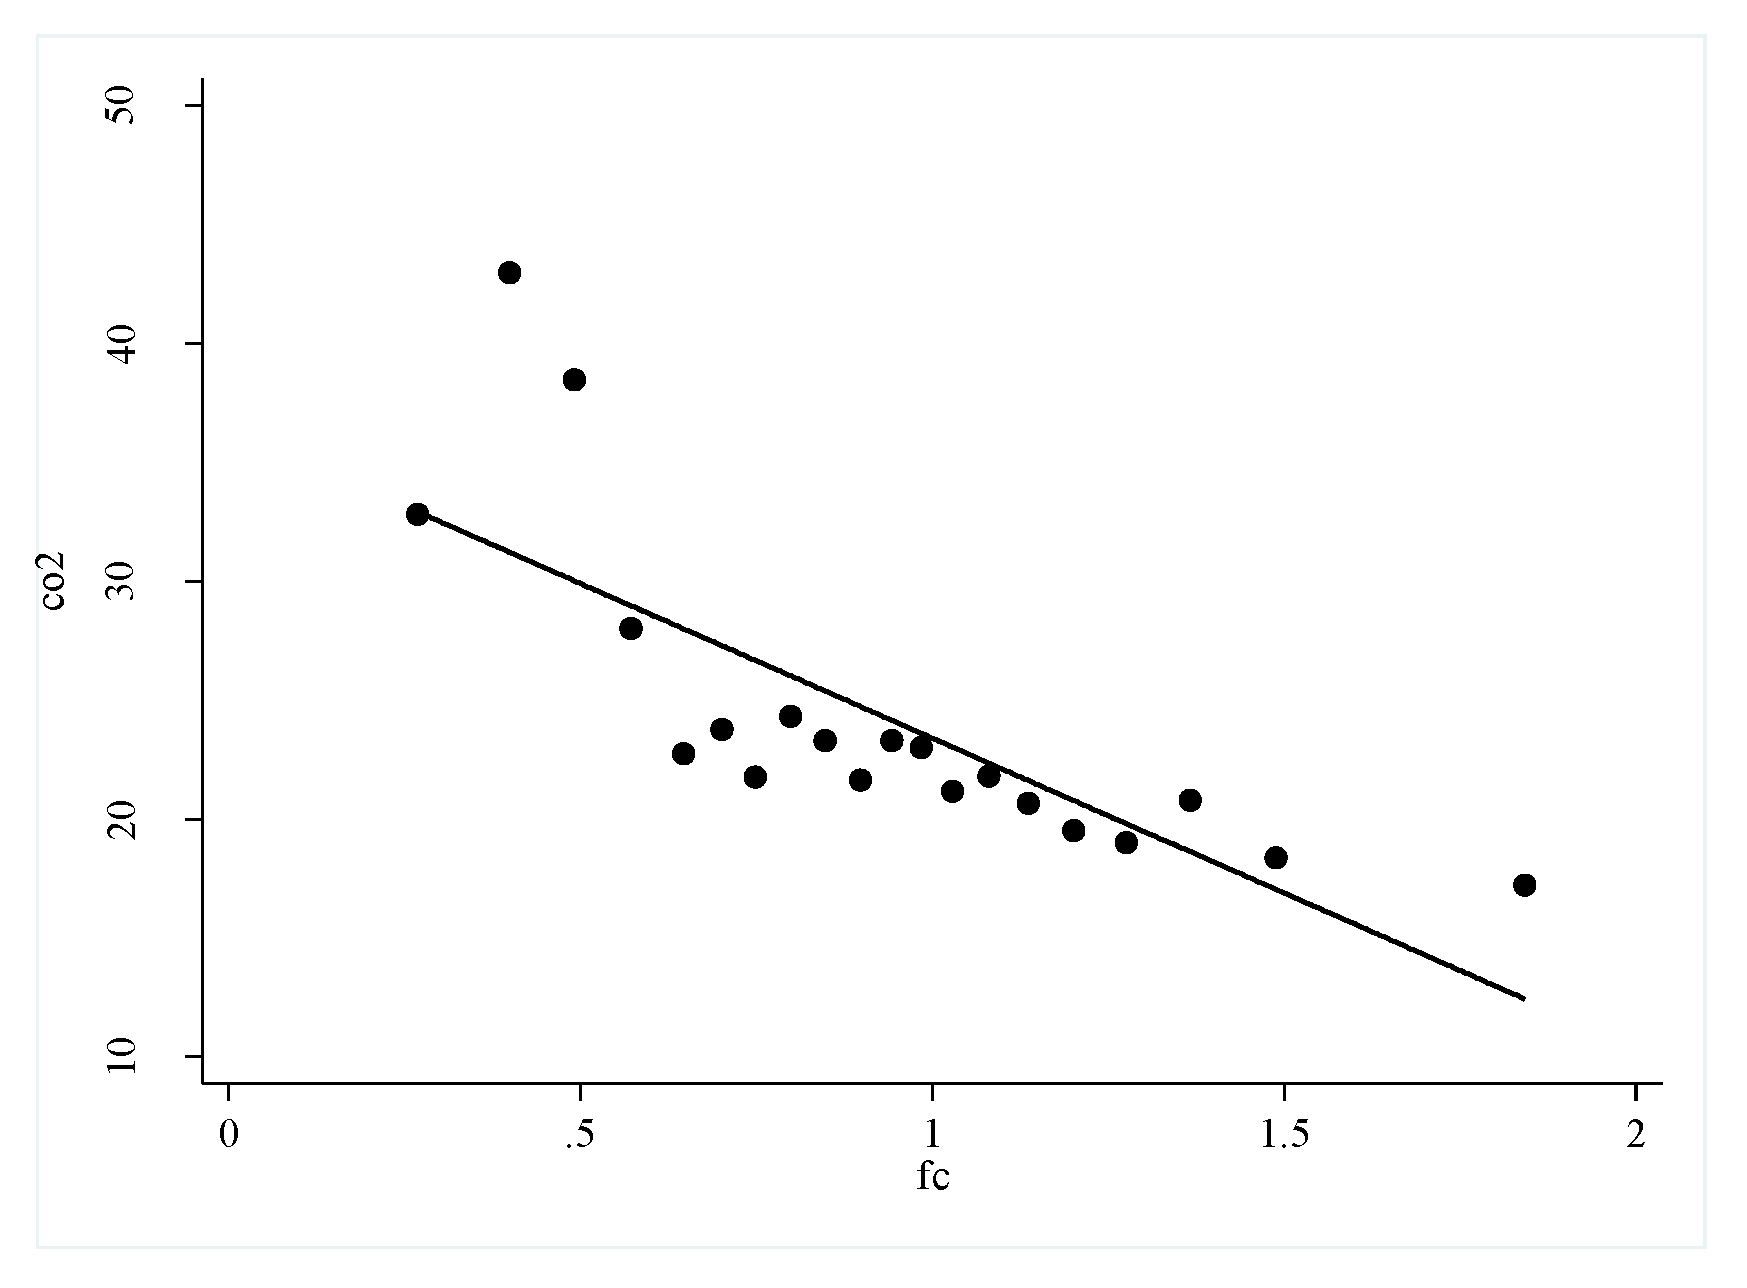
3.3. Analysis of the Basic Facts
4. Test of Financing Constraints, Carbon Emissions, and High-Quality Urban Development
4.1. Direct Effect of Financing Constraints on High-Quality Urban Development
4.2. Mediation Effect Test of Financing Constraints Affect the High-Quality Development of Cities through Carbon Emissions
4.3. Test of the Heterogeneity of Financing Constraints Affecting High-Quality Urban Development
4.3.1. Heterogeneity Effect of Different Quantile Financing Constraints on High-Quality Urban Development
4.3.2. Heterogeneity Effect of Financing Constraints at Different Stages on High-Quality Urban Development
5. Discussion
6. Conclusions
Author Contributions
Funding
Institutional Review Board Statement
Informed Consent Statement
Data Availability Statement
Conflicts of Interest
References
- Sognnaes, I.; Gambhir, A.; van de Ven, D.-J.; Nikas, A.; Anger-Kraavi, A.; Bui, H.; Campagnolo, L.; Delpiazzo, E.; Doukas, H.; Giarola, S.; et al. A multi-model analysis of long-term emissions and warming implications of current mitigation efforts. Nat. Clim. Chang. 2021, 11, 1055–1062. [Google Scholar] [CrossRef]
- Yang, J.; Hao, Y.; Feng, C. A race between economic growth and carbon emissions: What play important roles towards global low-carbon development? Energy Econ. 2021, 100, 105327. [Google Scholar] [CrossRef]
- He, W.; Zhang, B. A comparative analysis of Chinese provincial carbon dioxide emissions allowances allocation schemes in 2030: An egalitarian perspective. Sci. Total Environ. 2020, 765, 142705. [Google Scholar] [CrossRef] [PubMed]
- Liu, X.; Wang, S.; Wu, P.; Feng, K.; Hubacek, K.; Li, X.; Sun, L. Impacts of Urban Expansion on Terrestrial Carbon Storage in China. Environ. Sci. Technol. 2019, 53, 6834–6844. [Google Scholar] [CrossRef] [PubMed]
- Cull, R.; Li, W.; Sun, B.; Xu, L.C. Government connections and financial constraints: Evidence from a large representative sample of Chinese firms. J. Corp. Financ. 2015, 32, 271–294. [Google Scholar] [CrossRef] [Green Version]
- Zheng, H.Y.; Song, M.L.; Shen, Z.Y. The evolution of renewable energy and its impact on carbon reduction in China. Energy 2021, 237, 121639. [Google Scholar] [CrossRef]
- Cui, H.; Wang, R.; Wang, H. An evolutionary analysis of green finance sustainability based on multi-agent game. J. Clean. Prod. 2020, 269, 121799. [Google Scholar] [CrossRef]
- Falcone, P.M. Environmental regulation and green investments: The role of green finance. Int. J. Green Econ. 2020, 14, 159–173. [Google Scholar] [CrossRef]
- Falcone, P.M. Green investment strategies and bank-firm relationship: A firm-level analysis. Econ. Bull. 2018, 38, 2225–2239. [Google Scholar]
- Gatti, R.; Love, I. Does access to credit improve productivity? Evidence from Bulgaria. Econ. Transit. 2008, 16, 445–465. [Google Scholar] [CrossRef]
- Xu, D.Y. From manufacturing to retail: An anatomy of Chinese footwear firms. In Proceedings of the Society for Economic Dynamics 2014 Meeting Papers, Toronto, ON, Canada, 26–28 June 2014. [Google Scholar]
- Dhawan, R. Firm size and productivity differential: Theory and evidence from a panel of US firms. J. Econ. Behav. Organ. 2004, 44, 269–293. [Google Scholar] [CrossRef]
- Chen, Z.; Du, J.; Li, D.; Ouyang, R. Does foreign institutional ownership increase return volatility? Evidence from China. J. Bank. Financ. 2013, 37, 660–669. [Google Scholar] [CrossRef]
- Silva, F.; Carreira, C. Do financial constraints threat the innovation process? Evidence from portuguese firms. Econ. Innov. New Technol. 2012, 21, 701–736. [Google Scholar] [CrossRef] [Green Version]
- Aghion, P.; Dechezleprêtre, A.; Hemous, D.; Martin, R.; Van Reenen, J. Carbon taxes, path dependency and directed technical change: Evidence from the Auto Industry. J. Political Econ. 2016, 124, 1–51. [Google Scholar] [CrossRef] [Green Version]
- Brown, J.R.; Fazzari, S.M.; Petersen, B.C. Financing innovation and growth: Cash flow, external equity, and the 1990s R&D boom. J. Financ. 2009, 64, 151–185. [Google Scholar]
- Hovakimian, G. Financial constraints and investment efficiency: Internal capital allocation across the business cycle. J. Financ. Intermediat. 2011, 20, 264–283. [Google Scholar] [CrossRef]
- Ozturk, I.; Bilgili, F. Economic growth and biomass consumption nexus: Dynamic panel analysis for Sub-Sahara African countries. Appl. Energy 2015, 137, 110–116. [Google Scholar] [CrossRef]
- Ajmi, A.N.; Inglesi-Lotz, R. Biomass energy consumption and economic growth nexus in OECD countries: A panel analysis. Renew. Energy 2020, 162, 1649–1654. [Google Scholar] [CrossRef]
- Ocal, O.; Aslan, A. Renewable energy consumption-economic growth nexus in Turkey. Renew. Sustain. Energy Rev. 2013, 28, 494–499. [Google Scholar] [CrossRef]
- Bhattacharya, M.; Paramati, S.R.; Ozturk, I.; Bhattacharya, S. The effect of renewable energy consumption on economic growth: Evidence from top 38 countries. Appl. Energy 2016, 162, 733–741. [Google Scholar] [CrossRef]
- Menegaki, A.N. Growth and renewable energy in Europe: A random effect model with evidence for neutrality hypothesis. Energy Econ. 2011, 33, 257–263. [Google Scholar] [CrossRef]
- Bulut, U.; Muratoglu, G. Renewable energy in Turkey: Great potential, low but increasing utilization, and an empirical analysis on renewable energy-growth nexus. Energy Policy 2018, 123, 240–250. [Google Scholar] [CrossRef]
- Teng, L.; Ma, D.G. Can Digital Finance help to promote high-quality development? Stat. Res. 2020, 37, 80–92. [Google Scholar]
- Ayyagari, M.; Demirguc-Kunt, A.; Maksimovic, V. How important are financing constraints? The role of finance in the business environment. Policy Res. Work. Pap. Ser. 2006, 22, 483–516. [Google Scholar] [CrossRef]
- Love, I. Financial Development and financing constraints: International evidence from the structural investment model. Rev. Financ. Stud. 2003, 16, 765–791. [Google Scholar] [CrossRef] [Green Version]
- Sena, V. The determinants of firms’ performance: Can finance constraints improve technical efficiency? Eur. J. Oper. Res. 2006, 172, 311–325. [Google Scholar] [CrossRef]
- Maietta, O.W.; Sena, V. Financial constraints and technical efficiency: Some empirical evidence for Italian producers’ cooperatives. Ann. Public Coop. Econ. 2010, 81, 21–38. [Google Scholar] [CrossRef]
- Holmstrom, B. Agency costs and innovation. J. Econ. Behav. Organ. 1989, 12, 305–327. [Google Scholar] [CrossRef] [Green Version]
- Efthyvoulou, G.; Vahter, P. Financial constraints, innovation performance and sectoral disaggregation. Manch. Sch. 2016, 84, 125–158. [Google Scholar] [CrossRef] [Green Version]
- Guariglia, A.; Liu, P. To what extent do financing constraints affect Chinese firms’ innovation activities. Int. Rev. Financ. Anal. 2014, 36, 223–240. [Google Scholar] [CrossRef]
- Zhang, D.Y.; Du, W.C.; Zhuge, L.Q.; Tong, Z.; Freeman, R.B. Do financial constraints curb firms’ efforts to control pollution? Evidence from Chinese manufacturing firms. J. Clean. Prod. 2019, 215, 1052–1058. [Google Scholar] [CrossRef]
- Sadorsky, P. The impact of financial development on energy consumption in emerging economies. Energy Policy 2010, 38, 2528–2535. [Google Scholar] [CrossRef]
- Zhang, Y.J. The impact of financial development on carbon emissions: An empirical analysis in China. Energy Policy 2011, 39, 2197–2203. [Google Scholar] [CrossRef]
- Henderson, C. Are Chinese cities too small? Rev. Econ. Stud. 2006, 73, 549–576. [Google Scholar]
- Millimet, H. Pollution Abatement costs and foreign direct investment inflows to U.S. states: A nonparametric reassessment. Rev. Econ. Stat. 2007, 89, 178–183. [Google Scholar]
- Greenstone, M.; Hanna, R. Environmental regulations, air and water pollution, and infant mortality in India? Am. Econ. Rev. 2014, 104, 3038–3072. [Google Scholar] [CrossRef] [Green Version]
- Chang, T.; Zivin, J.G.; Gross, T.; Neidell, M. Particulate pollution and the productivity of pear packers. Am. Econ. J. Econ. Policy 2016, 8, 141–169. [Google Scholar] [CrossRef] [Green Version]
- Grossman, G.M.; Krueger, A.B. Environmental impacts of a North American free trade agreement. Natl. Bur. Econ. Res. 1992, 8, 223–250. [Google Scholar]
- Baron, R.M.; Kenny, D.A. The moderator-mediator variable distinction in social psychological research: Conceptual, strategic, and statistical considerations. J. Personal. Soc. Psychol. 1986, 51, 1173–1182. [Google Scholar] [CrossRef]
- Wen, Z.L.; Ye, B.J. Analyses of mediating effects: The development of methods and models. Adv. Psychol. Sci. 2014, 22, 731–745. [Google Scholar] [CrossRef]
- Preacher, K.J.; Hayes, A.F. SPSS and SAS procedures for estimating indirect effects in simple mediation models. Behav. Res. Methods Instrum. Comput. 2004, 36, 717–731. [Google Scholar] [CrossRef] [Green Version]
- Petersen, M.A. Estimating standard errors in finance panel data sets: Comparing approaches. Rev. Financ. Stud. 2009, 22, 435–480. [Google Scholar] [CrossRef] [Green Version]
- Huang, S.J.; Xiao, H.J.; Wang, X. On the high-quality development of state-owned enterprises. China Ind. Econ. 2018, 2018, 19–41. [Google Scholar]
- Liu, Z.B.; Ling, Y.H. Structural transformation, total factor productivity and high-quality development. Manag. World 2020, 36, 15–29. [Google Scholar]
- Wang, J.C.; Zhang, Q.Q.; Li, Q.Q. R&D investment and total factor productivity: An empirical study of the listed companies in the coastal regions of China. J. Coast. Res. 2020, 106, 13–16. [Google Scholar]
- Yu, Y.Z.; Yang, X.Z.; Zhang, S.H. Research on the characteristics of time and space conversion of China’s economy from high-speed growth to high-quality development. J. Quant. Tech. Econ. 2019, 36, 3–21. [Google Scholar]
- Fazzari, S.M.; Hubbard, R.G.; Petersen, B.C. Financing constraints and corporate investment. Brook. Pap. Econ. Act. 1988, 1988, 141–206. [Google Scholar] [CrossRef] [Green Version]
- Yu, J.W. Optimal financial conditions and economic development: International experience and Chinese case. Econ. Res. J. 2013, 48, 106–119. [Google Scholar]
- Liu, J.F.; Li, W.; Wang, S.B. Research on the measurement of financial repression level and the characteristics of spatial-temporal dynamic evolution in China. Sci. Geogr. Sin. 2019, 39, 1102–1110. [Google Scholar]
- Lin, B.Q.; Liu, X.Y. Carbon emissions in China’s urbanization stage: Influencing factors and emission reduction strategies. Econ. Res. J. 2010, 45, 66–78. [Google Scholar]
- Mehdi, T.; Shadi, S. Financial repression, economic growth and development. Int. J. Financ. Account. Econ. Stud. 2011, 1, 73–85. [Google Scholar]
- McKinnon, R.I. Money and Capital in Economic Development; Brookings Institution Press: Washington, DC, USA, 1973. [Google Scholar]
- Chen, J.; Cheng, S.; Song, M. Decomposing Inequality in Energy-related CO2 Emissions by Source and Source Increment: The Roles of Production and Residential Consumption. Energy Policy 2017, 107, 698–710. [Google Scholar] [CrossRef]
- Bhattacharya, M.; Churchill, S.A.; Paramati, S.R. The dynamic impact of renewable energy and institutions on economic output and CO2 emissions across regions. Renew. Energy 2017, 111, 51–57. [Google Scholar] [CrossRef]
- Xu, S.; He, X.Y.; Zhong, K. The belt and road initiative and Chinese firms’ Financial Constraints. China Ind. Econ. 2019, 2019, 155–173. [Google Scholar]
- Fan, F.; Zhang, X.R. Transformation effect of resource-based cities based on PSM-DID model: An empirical analysis from China. Environ. Impact Assess. Rev. 2021, 91, 911–912. [Google Scholar] [CrossRef]
- Fan, F.; Zhang, K.K.; Dai, S.Z. Decoupling analysis and rebound effect between China’s urban innovation capability and resource consumption. Technol. Anal. Strateg. Manag. 2021, 33, 1979204. [Google Scholar] [CrossRef]

| Variables | Definitions | Symbols | Measurement Methods |
|---|---|---|---|
| Dependent Variable | High-quality urban development | hq | The logarithm value of total factor productivity measured by OLS |
| Independent Variable | financing constraints | fc | financing constraints was used as the proxy variable |
| Mediator Variable | carbon emissions | co2 | Ci = ΣαiβiEi |
| Control Variables | economic development level | gdp | The logarithm value of GDP |
| The degree of openness | fdi | The proportion of the actual foreign investment in GDP | |
| Industrial structure | sec | The added value of the secondary industry accounts for GDP | |
| Infrastructure construction | infra | The proportion of total passenger traffic in the total population at the end of the year | |
| Population agglomeration | popu | The ratio of the total population to the administrative area at the end of the year | |
| Information level | infor | The proportion of post and telecommunications business income in GDP | |
| Fixed-asset investment | cap | The logarithm of the total fixed-asset investment | |
| Time effect | year | Virtual variable of the year | |
| Regional effect | city | Virtual variable of the region |
| Variables | hq | fc | co2 | gdp | fdi | sec | infra | popu | infor | cap |
|---|---|---|---|---|---|---|---|---|---|---|
| Mean | 1.596 | 0.946 | 24.9 | 10.17 | 0.0204 | 48.84 | 22.22 | −3.484 | 0.0278 | 15.48 |
| Std. deviation | 0.786 | 0.382 | 20.28 | 0.773 | 0.021 | 10.78 | 22.57 | 0.871 | 0.0165 | 1.137 |
| Minimum | 0.108 | 0.198 | 1.672 | 8.039 | 0.000119 | 21 | 3.052 | −6.012 | 0.00658 | 12.27 |
| Maximum | 2.917 | 2.141 | 103.4 | 11.81 | 0.15 | 78.7 | 144 | −2.006 | 0.0975 | 17.85 |
| The 10th quantile | 0.468 | 0.454 | 6.434 | 9.133 | 0.00196 | 35.5 | 7.318 | −4.756 | 0.0128 | 13.93 |
| The 25th quantile | 0.928 | 0.683 | 10.55 | 9.629 | 0.00573 | 42 | 10.62 | −4.006 | 0.0172 | 14.66 |
| The 50th quantile | 1.666 | 0.932 | 18.63 | 10.21 | 0.0132 | 49.2 | 15.53 | −3.357 | 0.0235 | 15.55 |
| The 75th quantile | 2.266 | 1.183 | 33.03 | 10.73 | 0.0279 | 55.6 | 23.97 | −2.771 | 0.0329 | 16.29 |
| The 90th quantile | 2.611 | 1.434 | 53.91 | 11.16 | 0.0481 | 61.8 | 41.86 | −2.5 | 0.048 | 16.93 |
| Observations | 4060 | 3967 | 4060 | 3935 | 3498 | 3718 | 3144 | 4011 | 3943 | 3719 |
| Model | (1) | (2) | (3) | (4) |
|---|---|---|---|---|
| Method | POLS | FE | SYS-GMM | DIF-GMM |
| Variable | hq | hq | hq | hq |
| L.hq | 0.3804 *** | 0.4434 *** | ||
| (0.0013) | (0.0006) | |||
| fc | −0.2066 *** | −0.4761 *** | −1.1918 *** | −0.8428 *** |
| (0.0360) | (0.0583) | (0.0151) | (0.0083) | |
| gdp | −0.2311 *** | −0.1472 * | −0.5490 *** | −0.4216 *** |
| (0.0344) | (0.0809) | (0.0175) | (0.0092) | |
| fdi | 2.8507 *** | 0.7007 | 2.0302 *** | −1.7307 *** |
| (0.6142) | (0.8038) | (0.2228) | (0.2057) | |
| sec | 0.0070 *** | 0.0199 *** | 0.0581 *** | 0.0289 *** |
| (0.0015) | (0.0028) | (0.0011) | (0.0005) | |
| infra | 0.0027 *** | 0.0059 *** | 0.0060 *** | 0.0029 *** |
| (0.0007) | (0.0011) | (0.0002) | (0.0002) | |
| popu | 0.0400 ** | −0.6053 ** | 0.1281 | 0.3311 *** |
| (0.0182) | (0.2973) | (0.1312) | (0.0068) | |
| infor | −0.9138 | −1.6706 | −1.1627 *** | −8.9904 *** |
| (0.8607) | (1.1349) | (0.3449) | (0.1393) | |
| cap | −0.1386 *** | −0.3603 *** | −0.3198 *** | −0.2579 *** |
| (0.0208) | (0.0525) | (0.0095) | (0.0066) | |
| _cons | 5.7464 *** | 5.6976 *** | 9.7953 *** | 9.6649 *** |
| (0.2512) | (1.1239) | (0.5034) | (0.0402) | |
| year | NO | YES | YES | YES |
| city | NO | YES | YES | YES |
| N | 2993 | 2989 | 2397 | 2993 |
| R−sq | 0.127 | 0.221 |
| Method | POLS | FE | ||||
|---|---|---|---|---|---|---|
| Model | (1) | (2) | (3) | (4) | (5) | (6) |
| Variable | hq | co2 | hq | hq | co2 | hq |
| fc | −0.2066 *** | −6.8262 *** | −0.1552 *** | −0.4761 *** | −1.9145 ** | −0.4725 *** |
| (0.0360) | (0.6436) | (0.0364) | (0.0583) | (0.7937) | (0.0583) | |
| co2 | 0.0075 *** | 0.0019 | ||||
| (0.0010) | (0.0020) | |||||
| gdp | −0.2311 *** | −2.0095 ** | −0.2160 *** | −0.1472 * | 10.8209 *** | −0.1674 ** |
| (0.0344) | (0.6152) | (0.0342) | (0.0809) | (1.2652) | (0.0832) | |
| fdi | 2.8507 *** | 22.7341 ** | 2.6794 *** | 0.7007 | −47.3798 ** | 0.7894 |
| (0.6142) | (10.9705) | (0.6091) | (0.8038) | (17.8602) | (0.8117) | |
| sec | 0.0070 *** | 0.0291 | 0.0068 *** | 0.0199 *** | −0.3290 *** | 0.0205 *** |
| (0.0015) | (0.0271) | (0.0015) | (0.0028) | (0.0478) | (0.0030) | |
| infra | 0.0027 *** | −0.0445 *** | 0.0030 *** | 0.0059 *** | 0.0167 | 0.0059 *** |
| (0.0007) | (0.0131) | (0.0007) | (0.0011) | (0.0144) | (0.0011) | |
| popu | 0.0400 ** | −0.1696 | 0.0413 ** | −0.6053 ** | 16.4634 ** | −0.6362 ** |
| (0.0182) | (0.3255) | (0.0181) | (0.2973) | (7.8915) | (0.2932) | |
| infor | −0.9138 | 35.7221 ** | −1.1829 | −1.6706 | 15.0590 | −1.6988 |
| (0.8607) | (15.3728) | (0.8537) | (1.1349) | (9.4413) | (1.1362) | |
| cap | −0.1386 *** | 13.3845 *** | −0.2394 *** | −0.3603 *** | 0.2813 | −0.3609 *** |
| (0.0208) | (0.3718) | (0.0247) | (0.0525) | (0.7348) | (0.0527) | |
| _cons | 5.7464 *** | −156.0570 *** | 6.9220 *** | 5.6976 *** | −13.6841 | 5.7232 *** |
| (0.2512) | (4.4869) | (0.2951) | (1.1239) | (31.0651) | (1.1158) | |
| year | NO | NO | NO | YES | YES | YES |
| city | NO | NO | NO | YES | YES | YES |
| N | 2993 | 2993 | 2993 | 2989 | 2989 | 2989 |
| R−sq | 0.127 | 0.580 | 0.143 | 0.221 | 0.942 | 0.221 |
| Model | (1) | (2) | (3) | (4) | (5) |
|---|---|---|---|---|---|
| Content | Above Q10 | Above Q25 | Above Q50 | Above Q75 | Above Q90 |
| Variable | hq | hq | hq | hq | hq |
| fc | −0.4530 *** | −0.4714 *** | −0.5511 *** | −0.5936 ** | −0.6986 |
| (0.0586) | (0.0665) | (0.0981) | (0.1834) | (0.4345) | |
| gdp | −0.0868 | 0.0320 | 0.2183 | 0.4574 * | 1.3778 ** |
| (0.0843) | (0.1032) | (0.1572) | (0.2591) | (0.4381) | |
| fdi | 1.2248 | 1.4842 | 1.6551 | 1.1656 | −2.0634 |
| (0.8772) | (1.1260) | (1.8049) | (3.2049) | (8.5657) | |
| sec | 0.0180 *** | 0.0165 *** | 0.0086 * | 0.0032 | 0.0053 |
| (0.0031) | (0.0037) | (0.0051) | (0.0092) | (0.0176) | |
| infra | 0.0051 *** | 0.0051 ** | 0.0064 ** | 0.0039 | 0.0032 |
| (0.0012) | (0.0016) | (0.0025) | (0.0034) | (0.0042) | |
| popu | −0.2423 | −0.3974 | −0.2802 | −0.2179 | −2.8257 * |
| (0.3458) | (0.3961) | (0.5993) | (0.9718) | (1.4845) | |
| infor | −1.8307 | −2.5235 * | −3.8291 ** | −4.1727 * | −3.5177 |
| (1.2442) | (1.2872) | (1.5741) | (2.5081) | (4.5081) | |
| cap | −0.3933 *** | −0.4492 *** | −0.4891 *** | −0.5349 ** | −0.8732 ** |
| (0.0556) | (0.0674) | (0.1045) | (0.1672) | (0.2736) | |
| _cons | 6.9083 *** | 6.1454 *** | 5.9085 ** | 4.8974 | −7.9714 |
| (1.3227) | (1.5329) | (2.3257) | (3.8367) | (6.1503) | |
| year | YES | YES | YES | YES | YES |
| city | YES | YES | YES | YES | YES |
| N | 2715 | 2309 | 1643 | 875 | 339 |
| R−sq | 0.211 | 0.201 | 0.166 | 0.146 | 0.194 |
| Model | (1) | (2) | (3) | (4) |
|---|---|---|---|---|
| Content | Before 2006 | Before 2010 | Before 2014 | Before 2017 |
| Variable | hq | hq | hq | hq |
| fc | −0.3357 ** | −0.7370 *** | −0.7263 *** | −0.4761 *** |
| (0.1554) | (0.0907) | (0.0668) | (0.0583) | |
| gdp | 0.7758 *** | −1.1014 *** | 0.0398 | −0.1472 * |
| (0.1689) | (0.1414) | (0.0919) | (0.0809) | |
| fdi | −3.6527 ** | −0.2396 | 0.7133 | 0.7007 |
| (1.2678) | (1.2370) | (0.9078) | (0.8038) | |
| sec | 0.0167 ** | −0.0020 | 0.0130 *** | 0.0199 *** |
| (0.0053) | (0.0051) | (0.0035) | (0.0028) | |
| infra | 0.0037 | 0.0011 | 0.0028 ** | 0.0059 *** |
| (0.0081) | (0.0025) | (0.0012) | (0.0011) | |
| popu | 1.3183 ** | −1.7745 ** | −0.8033 ** | −0.6053 ** |
| (0.4371) | (0.6670) | (0.3650) | (0.2973) | |
| infor | 6.9119 *** | 1.9234 | −1.3614 | −1.6706 |
| (1.4454) | (1.2649) | (1.1890) | (1.1349) | |
| cap | −0.1042 | 0.1241 | −0.3512 *** | −0.3603 *** |
| (0.1046) | (0.0821) | (0.0597) | (0.0525) | |
| _cons | 0.3496 | 4.9031 * | 3.7068 ** | 5.6976 *** |
| (1.9784) | (2.6238) | (1.3814) | (1.1239) | |
| year | YES | YES | YES | YES |
| city | YES | YES | YES | YES |
| N | 810 | 1898 | 2722 | 2989 |
| R−sq | 0.336 | 0.372 | 0.163 | 0.221 |
Publisher’s Note: MDPI stays neutral with regard to jurisdictional claims in published maps and institutional affiliations. |
© 2022 by the authors. Licensee MDPI, Basel, Switzerland. This article is an open access article distributed under the terms and conditions of the Creative Commons Attribution (CC BY) license (https://creativecommons.org/licenses/by/4.0/).
Share and Cite
Wang, S.; Liu, J.; Qin, X. Financing Constraints, Carbon Emissions and High-Quality Urban Development—Empirical Evidence from 290 Cities in China. Int. J. Environ. Res. Public Health 2022, 19, 2386. https://doi.org/10.3390/ijerph19042386
Wang S, Liu J, Qin X. Financing Constraints, Carbon Emissions and High-Quality Urban Development—Empirical Evidence from 290 Cities in China. International Journal of Environmental Research and Public Health. 2022; 19(4):2386. https://doi.org/10.3390/ijerph19042386
Chicago/Turabian StyleWang, Shaobo, Junfeng Liu, and Xionghe Qin. 2022. "Financing Constraints, Carbon Emissions and High-Quality Urban Development—Empirical Evidence from 290 Cities in China" International Journal of Environmental Research and Public Health 19, no. 4: 2386. https://doi.org/10.3390/ijerph19042386
APA StyleWang, S., Liu, J., & Qin, X. (2022). Financing Constraints, Carbon Emissions and High-Quality Urban Development—Empirical Evidence from 290 Cities in China. International Journal of Environmental Research and Public Health, 19(4), 2386. https://doi.org/10.3390/ijerph19042386