Article

Spatial-Temporal Evolution of Health Impact and Economic Loss upon Exposure to PM2.5 in China

School of Management, China University of Mining and Technology (Beijing), Beijing 100083, China
*
Author to whom correspondence should be addressed.
Int. J. Environ. Res. Public Health 2022, 19(4), 1922; https://doi.org/10.3390/ijerph19041922
Submission received: 13 January 2022 / Revised: 4 February 2022 / Accepted: 8 February 2022 / Published: 9 February 2022

Abstract

:
Exposure to PM2.5 can seriously endanger public health. Policies for controlling PM2.5 need to consider health hazards under different circumstances. Unlike most studies on the concentration, distribution, and influencing factors of PM2.5, the present study focuses on the impact of PM2.5 on human health. We analysed the spatial-temporal evolution of health impact and economic loss caused by PM2.5 exposure using the log-linear exposure-response function and benefit transfer method. The results indicate that the number of people affected by PM2.5 pollution fluctuated and began to decline after reaching a peak in 2014, benefiting from the Air Pollution Prevention and Control Action Plan. Regarding the total economic loss, the temporal pattern continued to rise until 2014 and then declined, with an annual mean of 86,886.94 million USD, accounting for 1.71% of China’s GDP. For the spatial pattern, the health impact and economic loss show a strong spatial correlation and remarkable polarisation phenomena, with high values in East China, North China, Central China, and South China, but low values in Southwest China, Northwest China, and Northeast China. The spatial-temporal characterisation of PM2.5 health hazards is visualised and analysed accordingly, which can provide a reference for more comprehensive and effective policy decisions.

1. Introduction

Air pollution is the fourth leading cause of death globally, preceded by poor diet, high blood pressure, and smoking risks [1]. PM2.5 is the primary pollutant in the atmosphere and is defined as particulate matter with an aerodynamic equivalent diameter of less than or equal to 2.5 microns in ambient air, consisting mainly of organic carbon (OC), elemental carbon (EC), nitrate, sulphate, ammonium and sodium salts, etc. Compared with coarser atmospheric particulate matter, PM2.5 has a small particle size, large area, strong activity, is easily accompanied by toxic and harmful substances, and has a long residence time and long transport distance in the atmosphere, thus having a greater impact on atmospheric environmental quality and human health. Furthermore, PM2.5 can directly enter the bronchi and alveoli through breathing, quickly enter the blood circulation and spread throughout the whole body, leading to an increase in morbidity and mortality [2,3,4]. Epidemiological studies have shown that PM2.5 exposure ranks the highest among the environmental risk factors affecting the health of residents [5]. Therefore, effective PM2.5 control strategies are the key to achieving sustainable development goals and urban public health all over the world [6,7,8].
As China is the largest developing country in the world, the PM2.5 produced by urbanisation and industrialisation is a constraint of social welfare [9,10,11]. To alleviate such severe PM2.5 pollution, the State Council issued the Air Pollution Prevention and Control Action Plan in 2013, proposing ten strict air pollution prevention and control actions. China has remarkably improved urban air pollution control. The average annual concentration of PM2.5 in China decreased from 58 µg/m3 in 2013 to 33 µg/m3 in 2020 [5], and the number of deaths caused by PM2.5 dropped significantly during 2013–2017 [12]. However, the PM2.5 pollution in China is still higher than that in developed countries, and severely polluted air with PM2.5 as the primary pollutant frequently occurs in many regions. There are 48 Chinese cities among the 100 cities globally with the most severe air pollution. In addition, among the 400 cities in mainland China, only 53% of the cities have an annual average PM2.5 concentration that meets China’s second level of air quality standard (35 µg/m3), and only 2% of the cities have lower PM2.5 than the standard value (10 µg/m3) set by the World Health Organization (WHO) [13,14].
Studies on PM2.5 can be grouped into two categories. The first comprises the hottest and most numerous, and they mainly start from a macro perspective, focusing on physical cause analysis, meteorological characteristics, concentration measurement, influence factors, control pathways, etc. [15,16,17,18,19]. The second category comprises micro pathological analysis from a medical perspective and exposure risk analysis from a health statistics perspective [20,21,22,23]. The present study focuses on the PM2.5 health hazards to urban residents from an exposure risk perspective. Regarding health hazard assessment, Bu et al. [24] demonstrated that 4.58 million deaths and 142.52 million disability-adjusted life years were caused by PM2.5 exposure globally in 2017, and the increasing pollution will increase the burden on the health of older people and low-income groups. Long-term exposure to environments polluted by PM2.5 has increased the global disease burden and is an obstacle to economic prosperity [25]. For China’s PM2.5 impact assessment, Maji et al. [26] pointed out that the health cost of diseases caused by PM2.5 and PM10 pollution in 190 cities in China was approximately 304,122 million USD from 2014–2015, accounting for 2.94% of GDP. Xie et al. [27] demonstrated that the GDP loss caused by PM2.5 pollution in China will reach 2%, and the health expenditure will reach 25.2 billion USD by 2030 without implementing appropriate control strategies for PM2.5. Yue et al. [12] found that if China adopts more stringent air quality targets and reaches a PM2.5 concentration of 10 µg/m3, the number of deaths from PM2.5 will drop by 43.3%.
In addition to the above national-level studies, most studies on the health impact and economic loss of PM2.5 pollution in China have focused on specific cities, regions, or industry sectors [21,28,29,30,31]. For example, Li et al. [32] predicted the PM2.5 emission caused by energy consumption in Beijing in the future, and calculated the resultant health impact and economic loss. Chen et al. [29] focused on the public health effect and its economic loss upon exposure to PM2.5 generated by coal consumption in 2015; precisely, the impact of PM2.5 was estimated from the perspective of the industry, and an attempt was made to put forward a total coal consumption control scheme. Wang et al. [33] improved the traditional PM2.5-related health loss assessment model and estimated the health-related economic loss of Beijing-Tianjin-Shijiazhuang in 2017 and 2018 based on this improved model.
The majority of the extant studies cannot fully reflect the overall situation and regional differences in human health and socioeconomic impact of PM2.5 pollution in China, and lack temporal and spatial distribution analysis. Some studies have tried to make up for the deficiency of the analyses of the temporal and spatial distribution, but due to the PM2.5 data not being available from ground monitoring stations until December 2013, there is a lack of long-term dynamic evolution analysis. For example, Guan et al. [34] emphasised the distribution and temporal differences of health loss in 338 cities in China, but the time range of the study was only limited to 2015–2017. Similarly, Maji et al. [35] only analysed the spatial distribution differences of health loss in 338 cities in China in 2016. It is worth noting that apart from the annual differences, due to the differences in PM2.5 concentration and human activities in each season or even month, the health impact changes significantly in different seasons and months. Yang et al. [36] emphasised the significant difference in PM2.5-related health impact and economic loss in summer and winter, pointing out that the existing research about the seasonal and monthly changes on the health impact of PM2.5 is insufficient.
Given the background, this study aims to assess the health impact and economic loss caused by PM2.5 pollution and depict their spatial-temporal evolution in 30 provinces of China from 2005–2017. The first contribution of this study is to identify the time-dynamic evolution in a long sequence based on satellite remote sensing data, which is superior to the ground detection statistics started in December 2013, and there are no problems of insufficient monitoring points and artificial fraud. The second contribution is that a more accurate assessment using the log-linear exposure-response function and benefit transfer method, the dynamic evolution analysis of the kernel density, and uncertainty analysis for different baselines are analysed. The third contribution of this study is to analyse and visualise regional differences and the seasonal and monthly differences for different endpoints on the health impact and economic loss of PM2.5 exposure. The combination of spatial and temporal analysis offers a profound revelation of the distribution difference and evolution of health impact and economic loss at the provincial level during different development periods of China. Altogether, we focus on the differences between the country as a whole and on the 30 provinces to propose more effective environmental protection in terms of regional coordination and to provide empirical data to support the prevention and control of PM2.5 at the national level. The results are helpful for the formulation of PM2.5 management and public health policies in line with China’s national conditions and geospatial characteristics.
The remainder of this paper is organised as follows. The second part comprises the methods and data sources, wherein the methods of health impact assessment and health economic loss calculation are introduced, and the corresponding data sources are explained. The third part describes the results, which show the spatial-temporal evolution and seasonal differences of the health impact and economic loss, and the dynamic evolution of kernel density. The fourth part comprises the conclusion and policy implications.
The research framework can be summarised as in Figure 1.

2. Methods and Data Sources

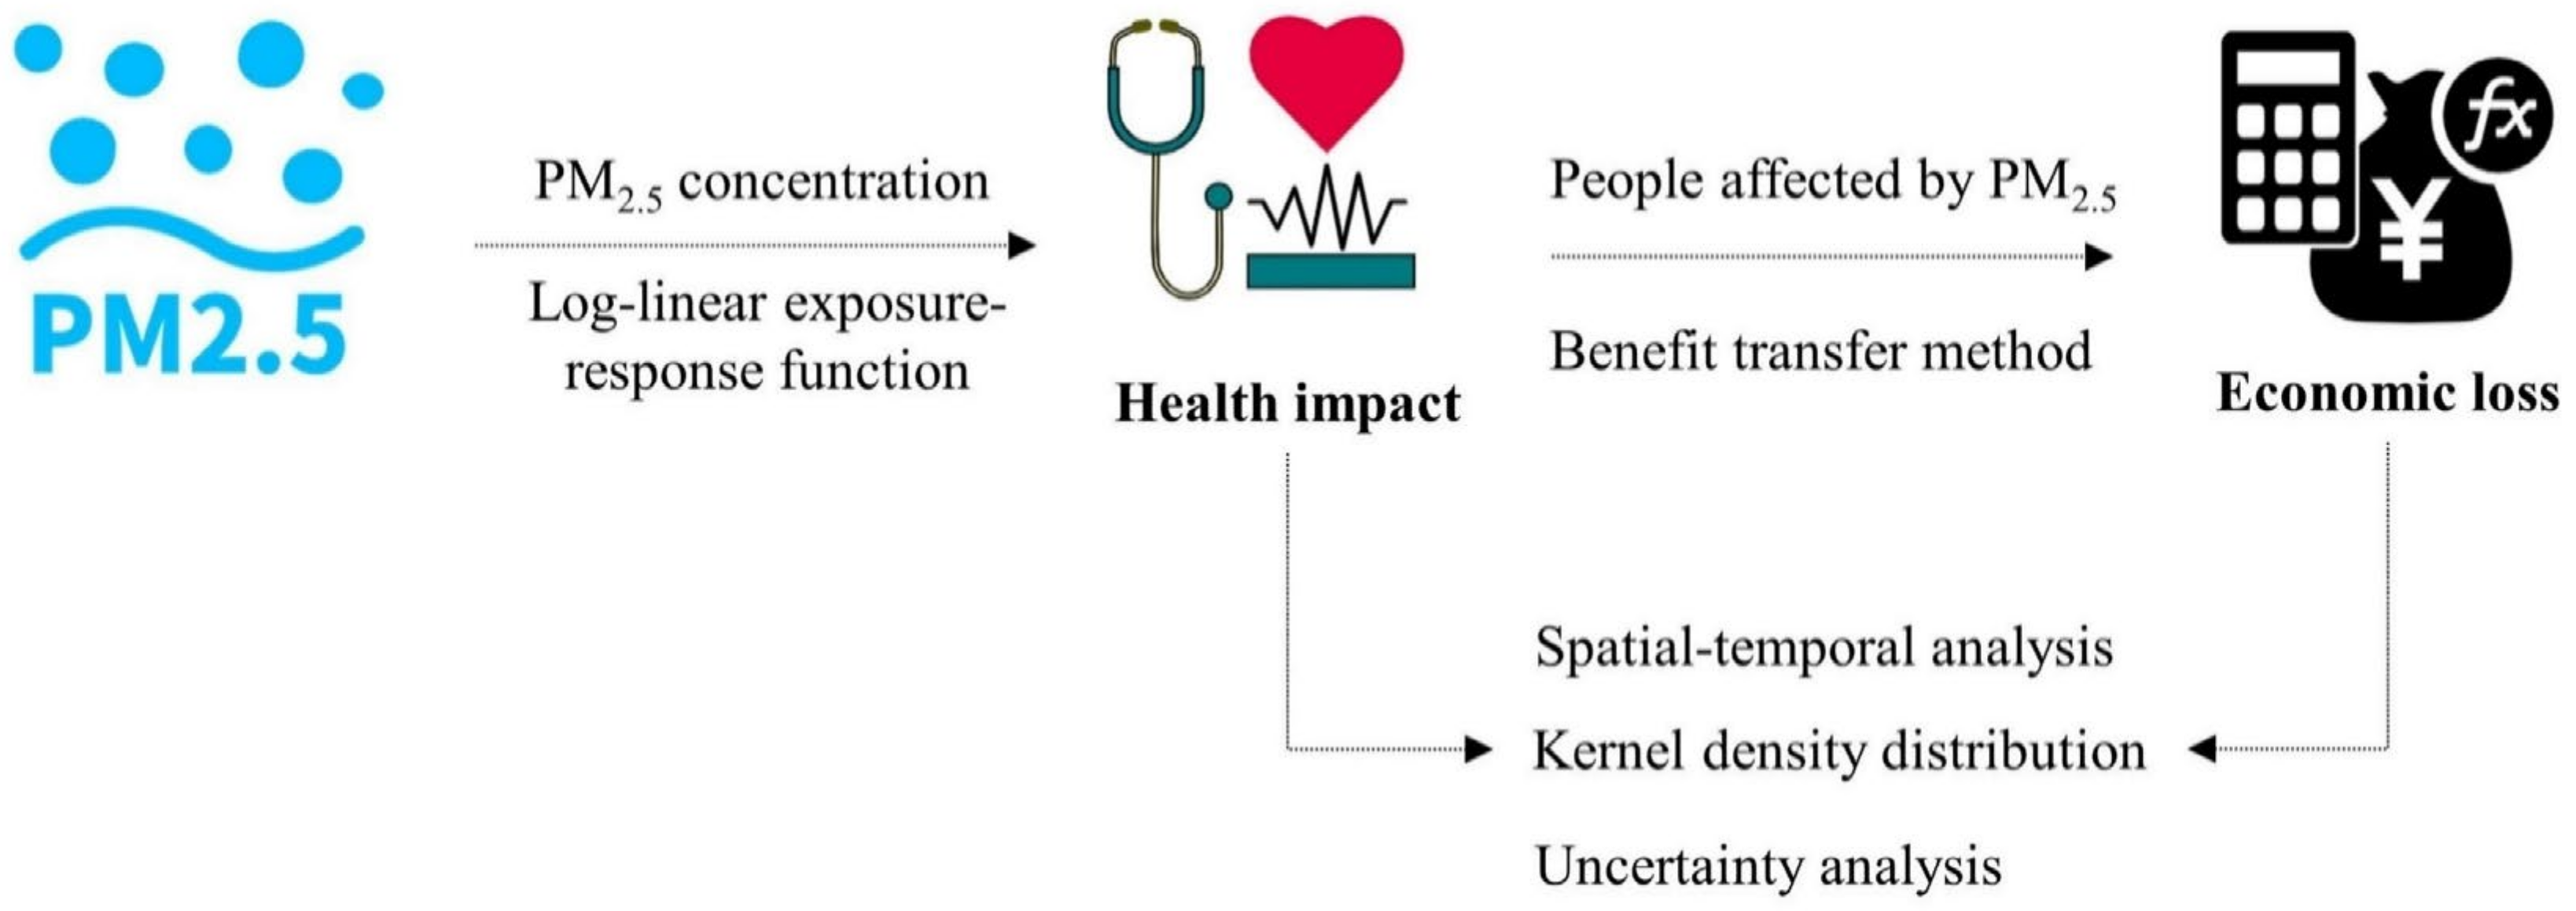
2.1. Health Impact Assessment

In this study, we used the relative risk based on epidemiology to estimate the long-term health impact caused by exposure to PM2.5; specifically, the number of deaths or illnesses. According to the disease classification of ICD-10 [37], and as per Yin et al. [38], we divided the health endpoints into all-cause mortality, respiratory mortality, cardiovascular mortality, lung cancer mortality, respiratory hospital admission, cardiovascular hospital admission, chronic bronchitis, acute bronchitis, and asthma attacks; these were classified as mortality, hospital admission, and outpatient service. The harm of PM2.5 to the human body is omnidirectional, especially in respiratory, cardiovascular, and lung disease. Referring to Chen et al. [39] and Guo et al. [40], for every 10 µg/m3 increase in the mean concentration of PM2.5, the all-cause mortality, respiratory mortality, cardiovascular mortality, and lung cancer mortality increased by 0.25%, 0.48%, 0.25%, and 2.48%, respectively. Therefore, this study focuses on respiratory mortality, cardiovascular mortality, and lung cancer mortality among the all-cause mortality caused by PM2.5.
The exposure-response function reveals the relationship between changes in the PM2.5 concentration and health impact. In previous studies, three exposure-response functions were used: integrated exposure risk function (IER), log-linear function (LL), and nonlinear power law function (NLP) [35]. The LL is more suitable for the health impact assessment in high-particulate-matter pollution areas [41], and has been widely used in previous studies [21,26,33,38]. The relative risk based on the log-linear exposure-response function can be expressed as Equation (1):
R R s , i = exp [ β s ( C i C 0 ) ]
where s is the health endpoint, i is the province, R R s , i is the relative risk of PM2.5 exposure, β s is the exposure-response coefficient based on Chinese epidemiology, that is, the impact of 1 µg/m3 PM2.5 concentration increment on the incidence of the s health endpoint; C i is the annual average daily PM2.5 concentration in the i province; C 0 is the threshold of PM2.5 concentration, wherein the PM2.5 concentration below this threshold is assumed to have no impact on health.
The health impact of PM2.5 exposure can be calculated by Equation (2) [35]:
H I s , i = [ ( R R s , i 1 ) / R R s , i ] × B s × E P i
where H I s , i is the number of deaths or illnesses, and it is used to characterise the health impact. B s is the baseline incidence of the s health endpoint, and E P i is the number of people exposed to PM2.5 in the i province, expressed by the permanent population at the end of the year.
The exposure-response coefficient β (µg/m3) and baseline incidence B of each health endpoint are presented in Table 1 and Table 2, respectively.

2.2. Economic Loss Estimation

The health impact of PM2.5 exposure was monetised to assess its economic loss. As the yearly health costs of different health endpoints in different provinces are unavailable, the benefit transfer method (BTM) is used to evaluate the economic loss of each health endpoint in 30 provinces by year (Equation (3)) [35,48,49].
H C s , i ( t ) = H C s , k × G i , k G k α × ( 1 + % Δ P i + % Δ G i ) α
where s is the health endpoint ( s = 1 , , 9 ), i is the province ( i = 1 , , 30 ), t is the year, k is the base year (2005), H C s , i ( t ) is the adjusted unit economic loss, and H C s , k is the per unit economic loss of the s health endpoint in China in the base year. The unit economic losses of each health endpoint in the base year are presented in Table 3. G i , k is the per capita GDP calculated by the purchasing power parity (PPP); % Δ P i is the percentage increase or decrease in the consumer price index of the i province from k year to t year; % Δ G i is the percentage increase or decrease in the per capita GDP of the i province from k year to t year; and α is the income elasticity of the economic loss, which is 0.8, as recommended by the OECD [50].
The total economic loss E C s , i ( t ) of the s health endpoint in i province in the t year can be calculated by Equation (4).
E C s , i ( t ) = H C s , i ( t ) × H I s , i ( t )
where H C s , i ( t ) is the adjusted unit economic loss of the s health endpoint in the i province; and H I s , i ( t ) is the number of deaths or illnesses of the s health endpoint in the i province calculated by Equation (2).

2.3. Data Sources

We used the data of 30 province-level regions in China from 2005 to 2017 as the research sample. Due to some indicator data not being available, we did not study Hong Kong, Macao, Taiwan, and Tibet. The 30 provinces and their eastern, central, and western divisions are as follows: the eastern regions include Beijing, Tianjin, Hebei, Liaoning, Shanghai, Jiangsu, Zhejiang, Fujian, Shandong, Guangdong, and Hainan; the central regions include Shanxi, Jilin, Heilongjiang, Anhui, Jiangxi, Henan, Hubei, and Hunan; and the western regions include Inner Mongolia, Guangxi, Chongqing, Sichuan, Guizhou, Yunnan, Shaanxi, Gansu, Qinghai, Ningxia, and Xinjiang. The PM2.5 data were obtained from the NASA Earth Observation raster data from the Socioeconomic Data and Applications Centre (SEDAC) of Columbia University in the United States. ArcGIS was used to parse the remote sensing data into comparable data in regional units. We adopted the standard value of 10 µg/m3 as the baseline concentration for PM2.5 [53]. The permanent population at the end of the year, GDP, and consumer price index were obtained from the China Statistical Yearbook 2006–2018 [54].

3. Results

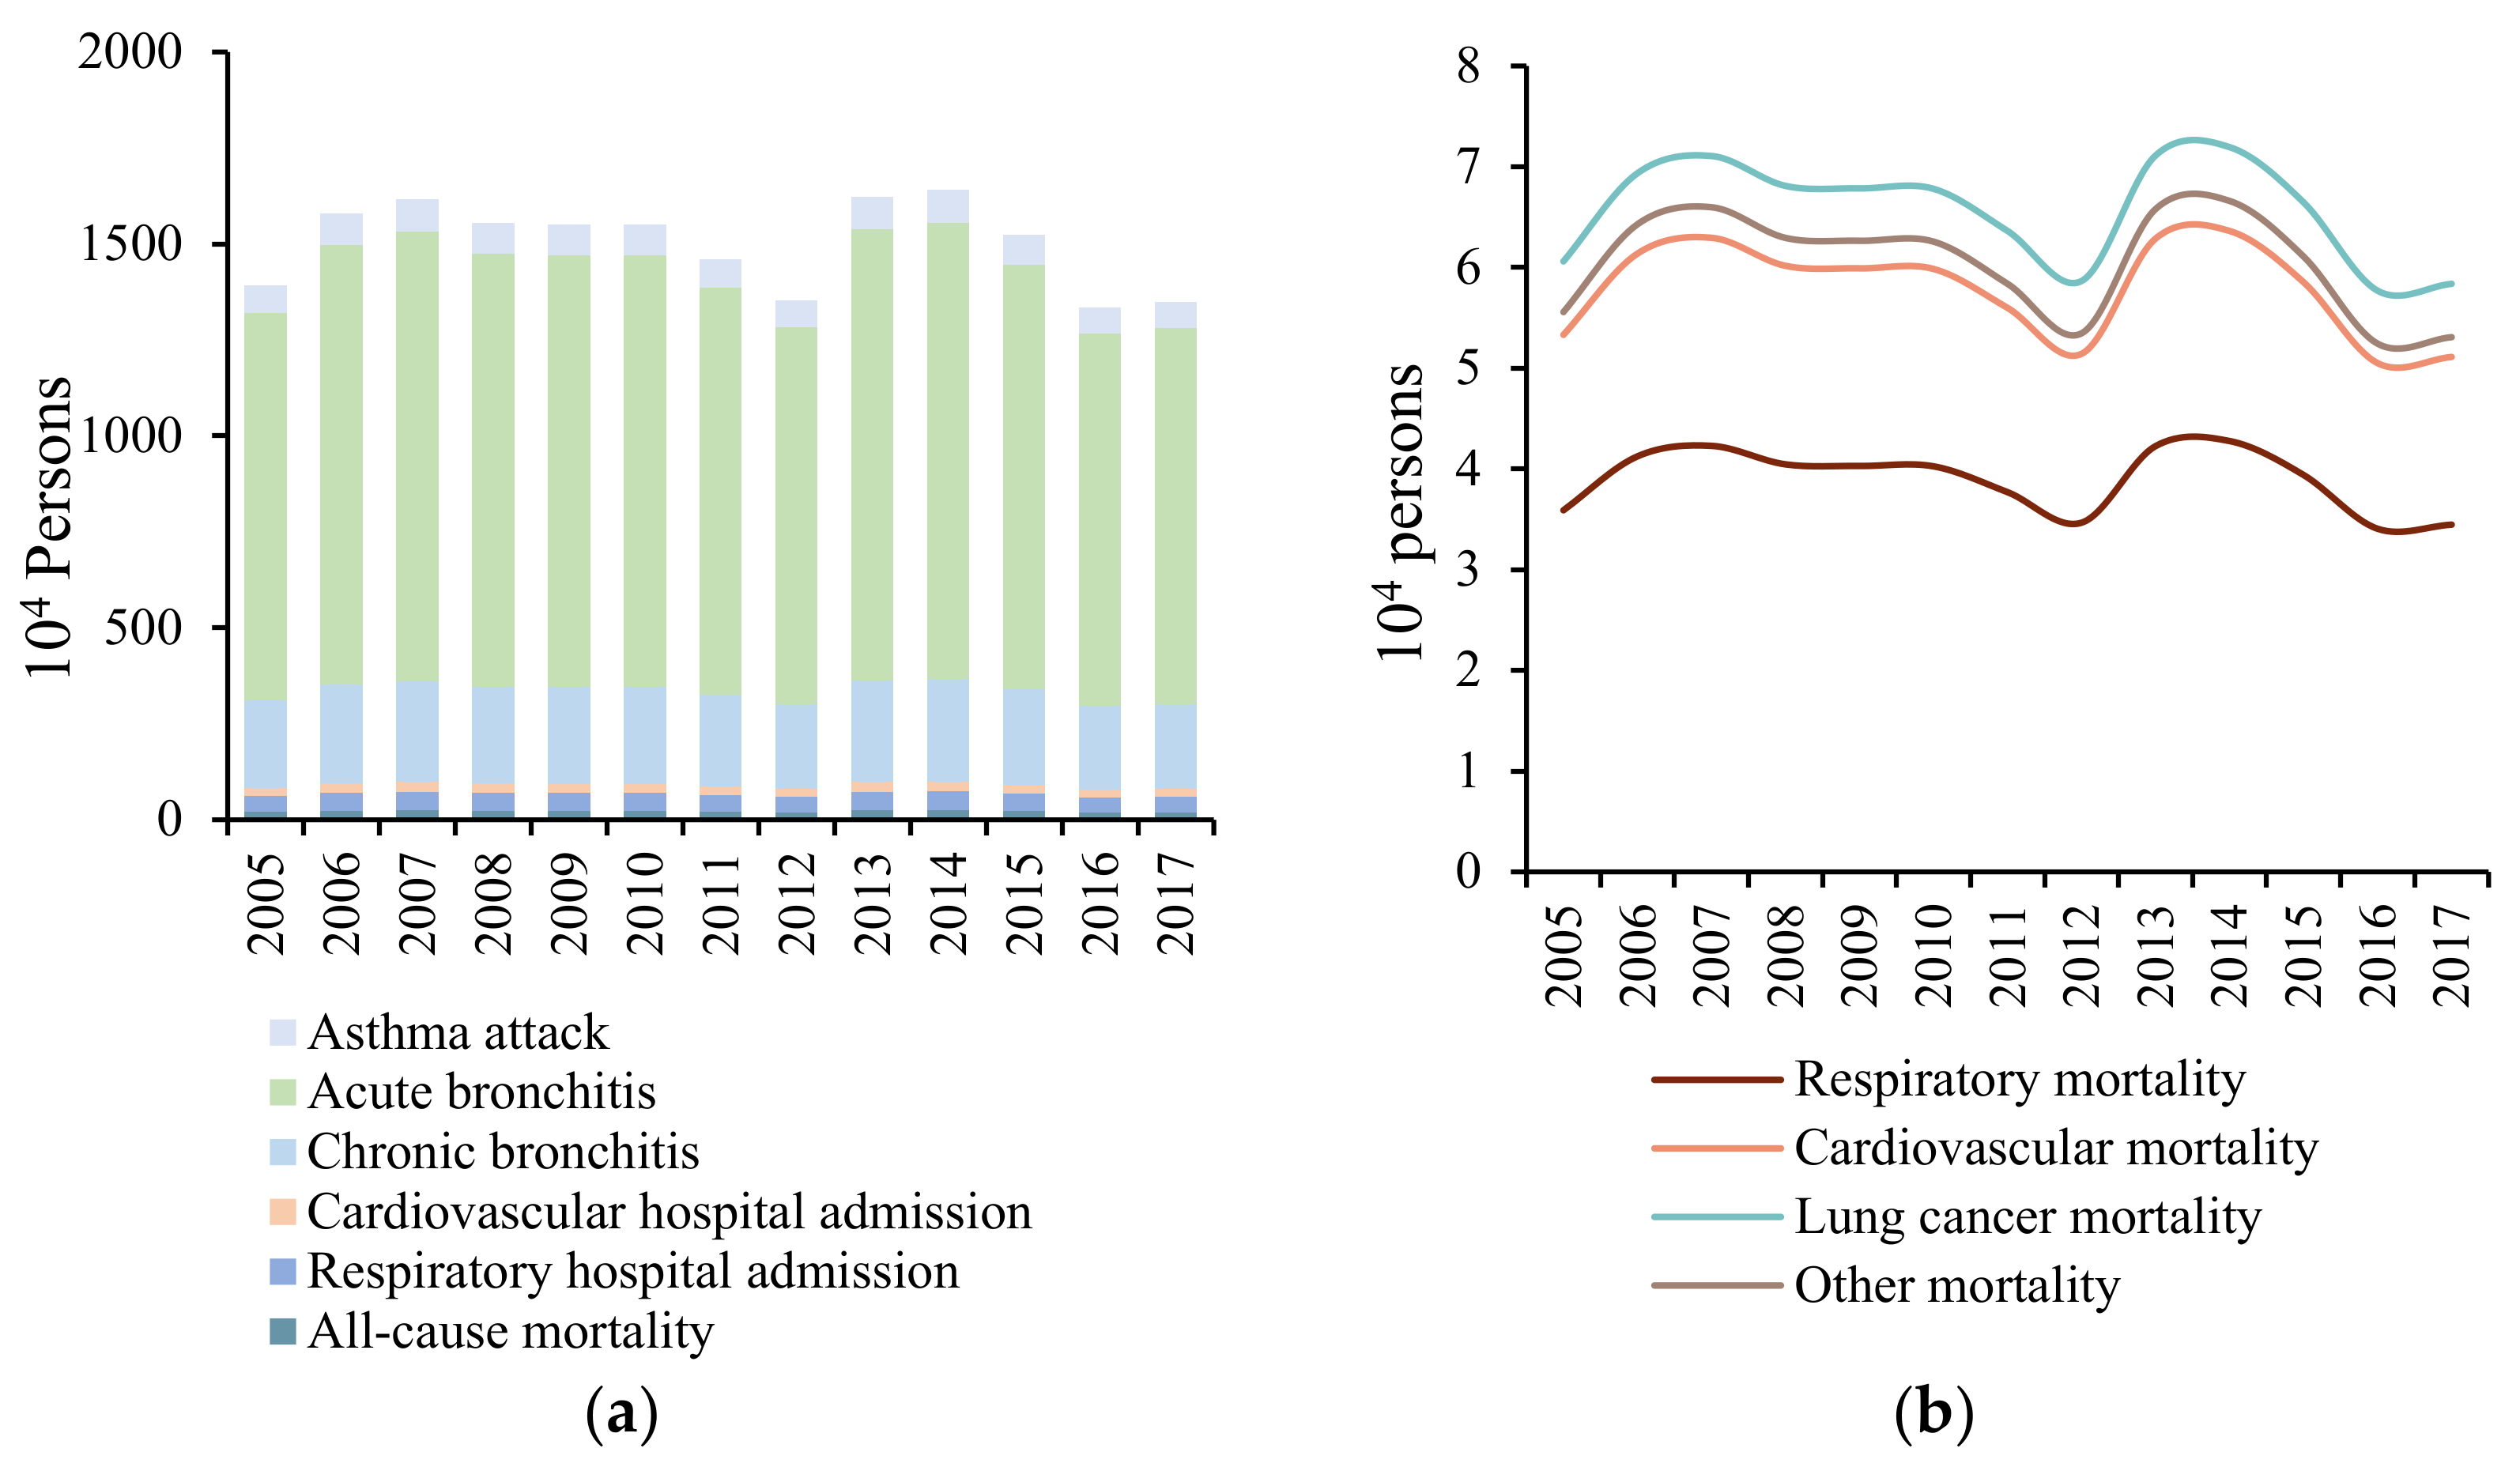
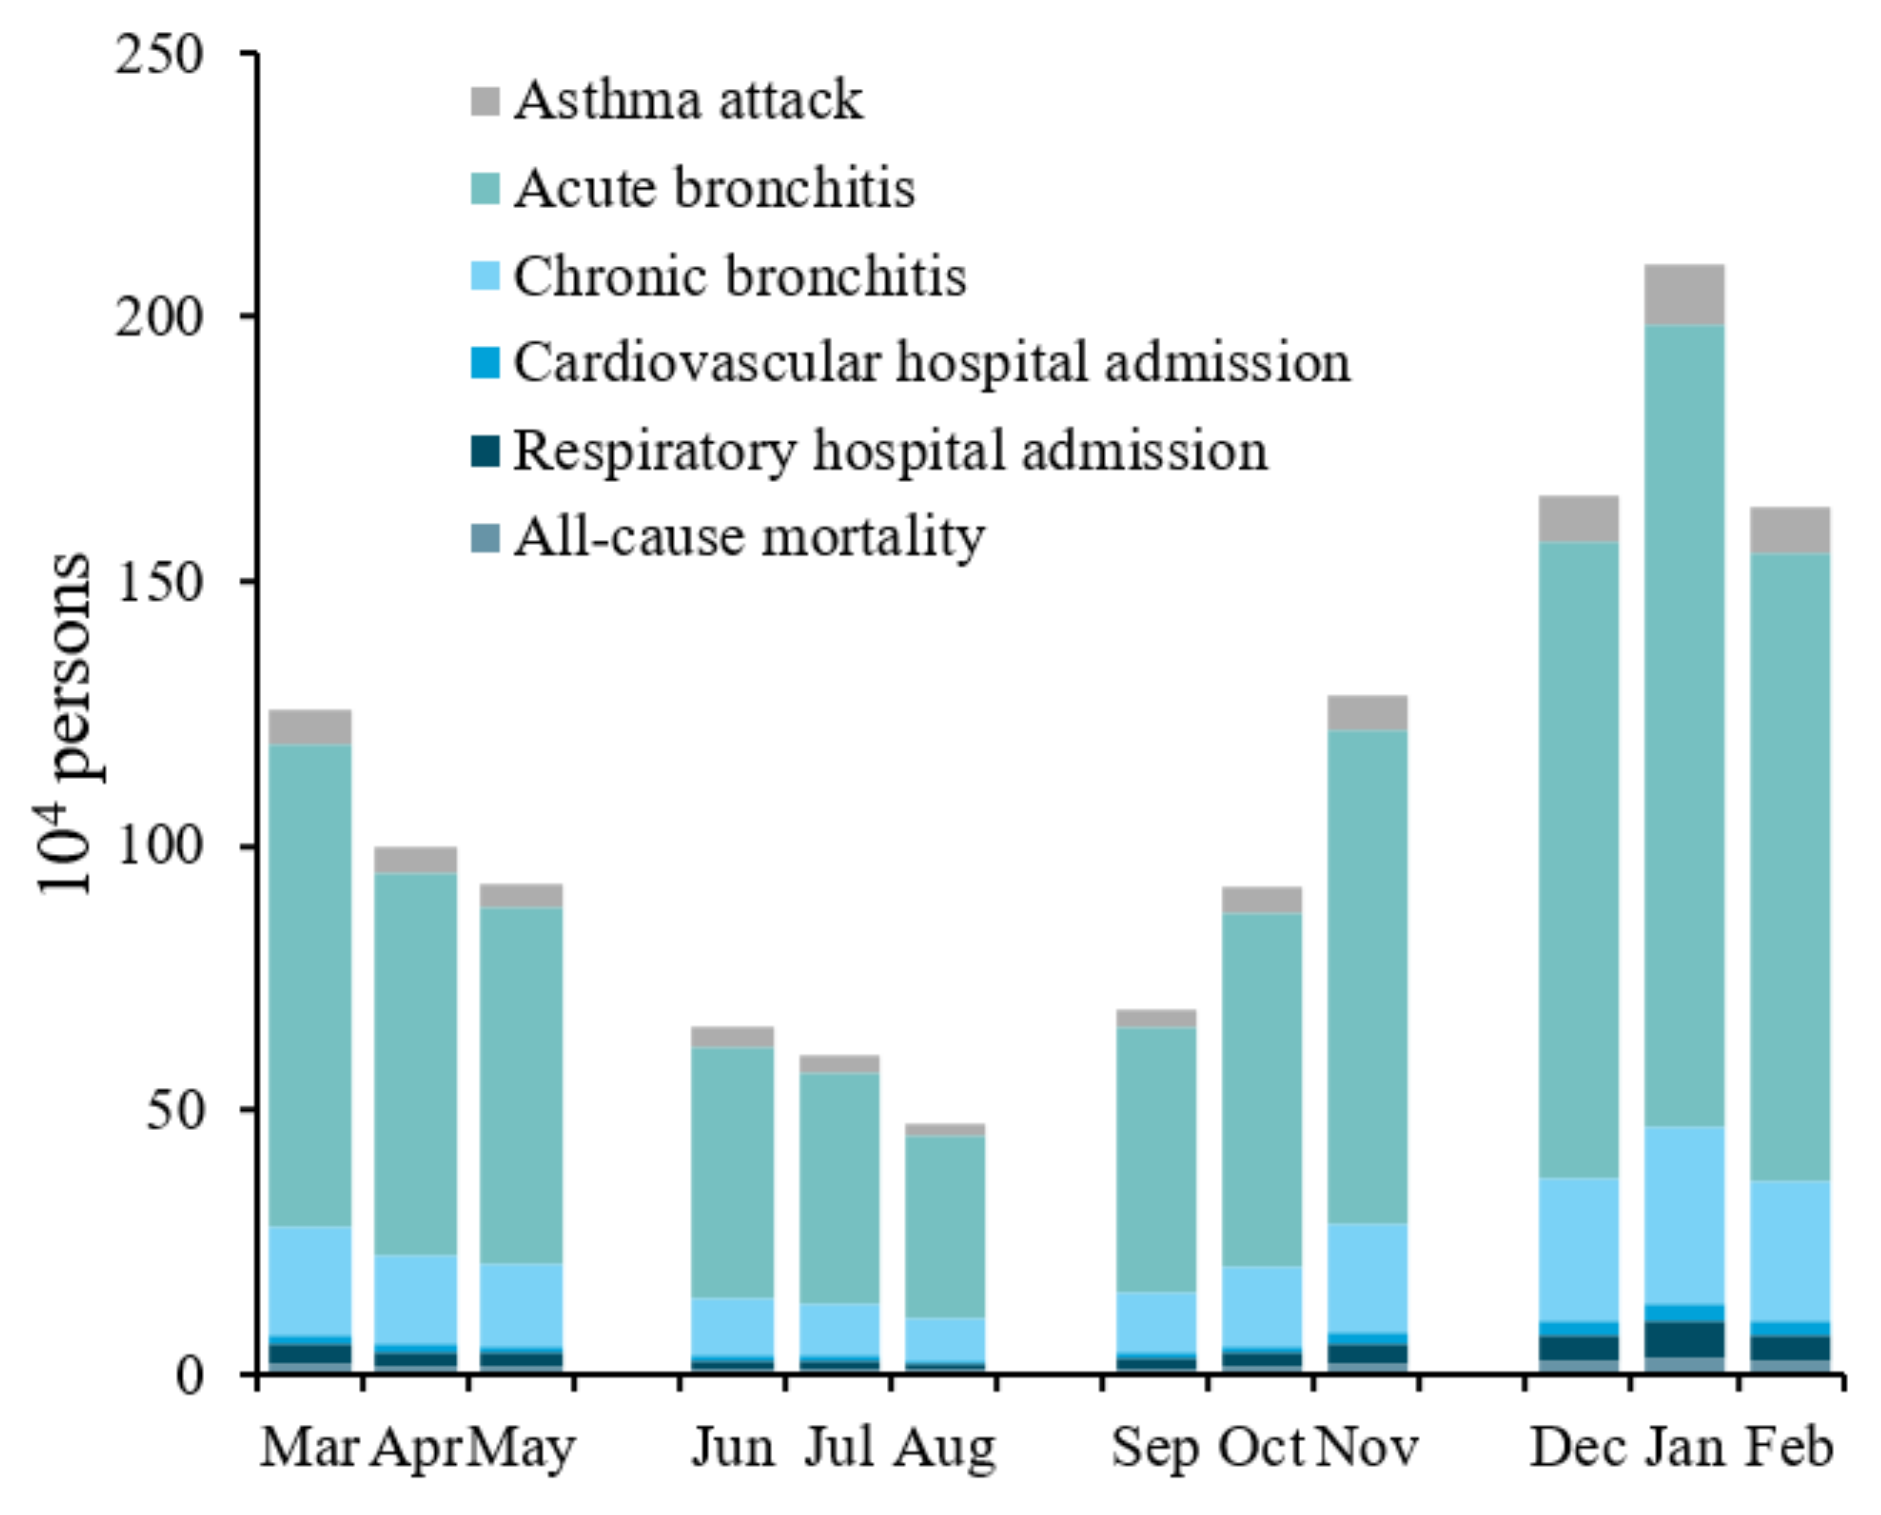
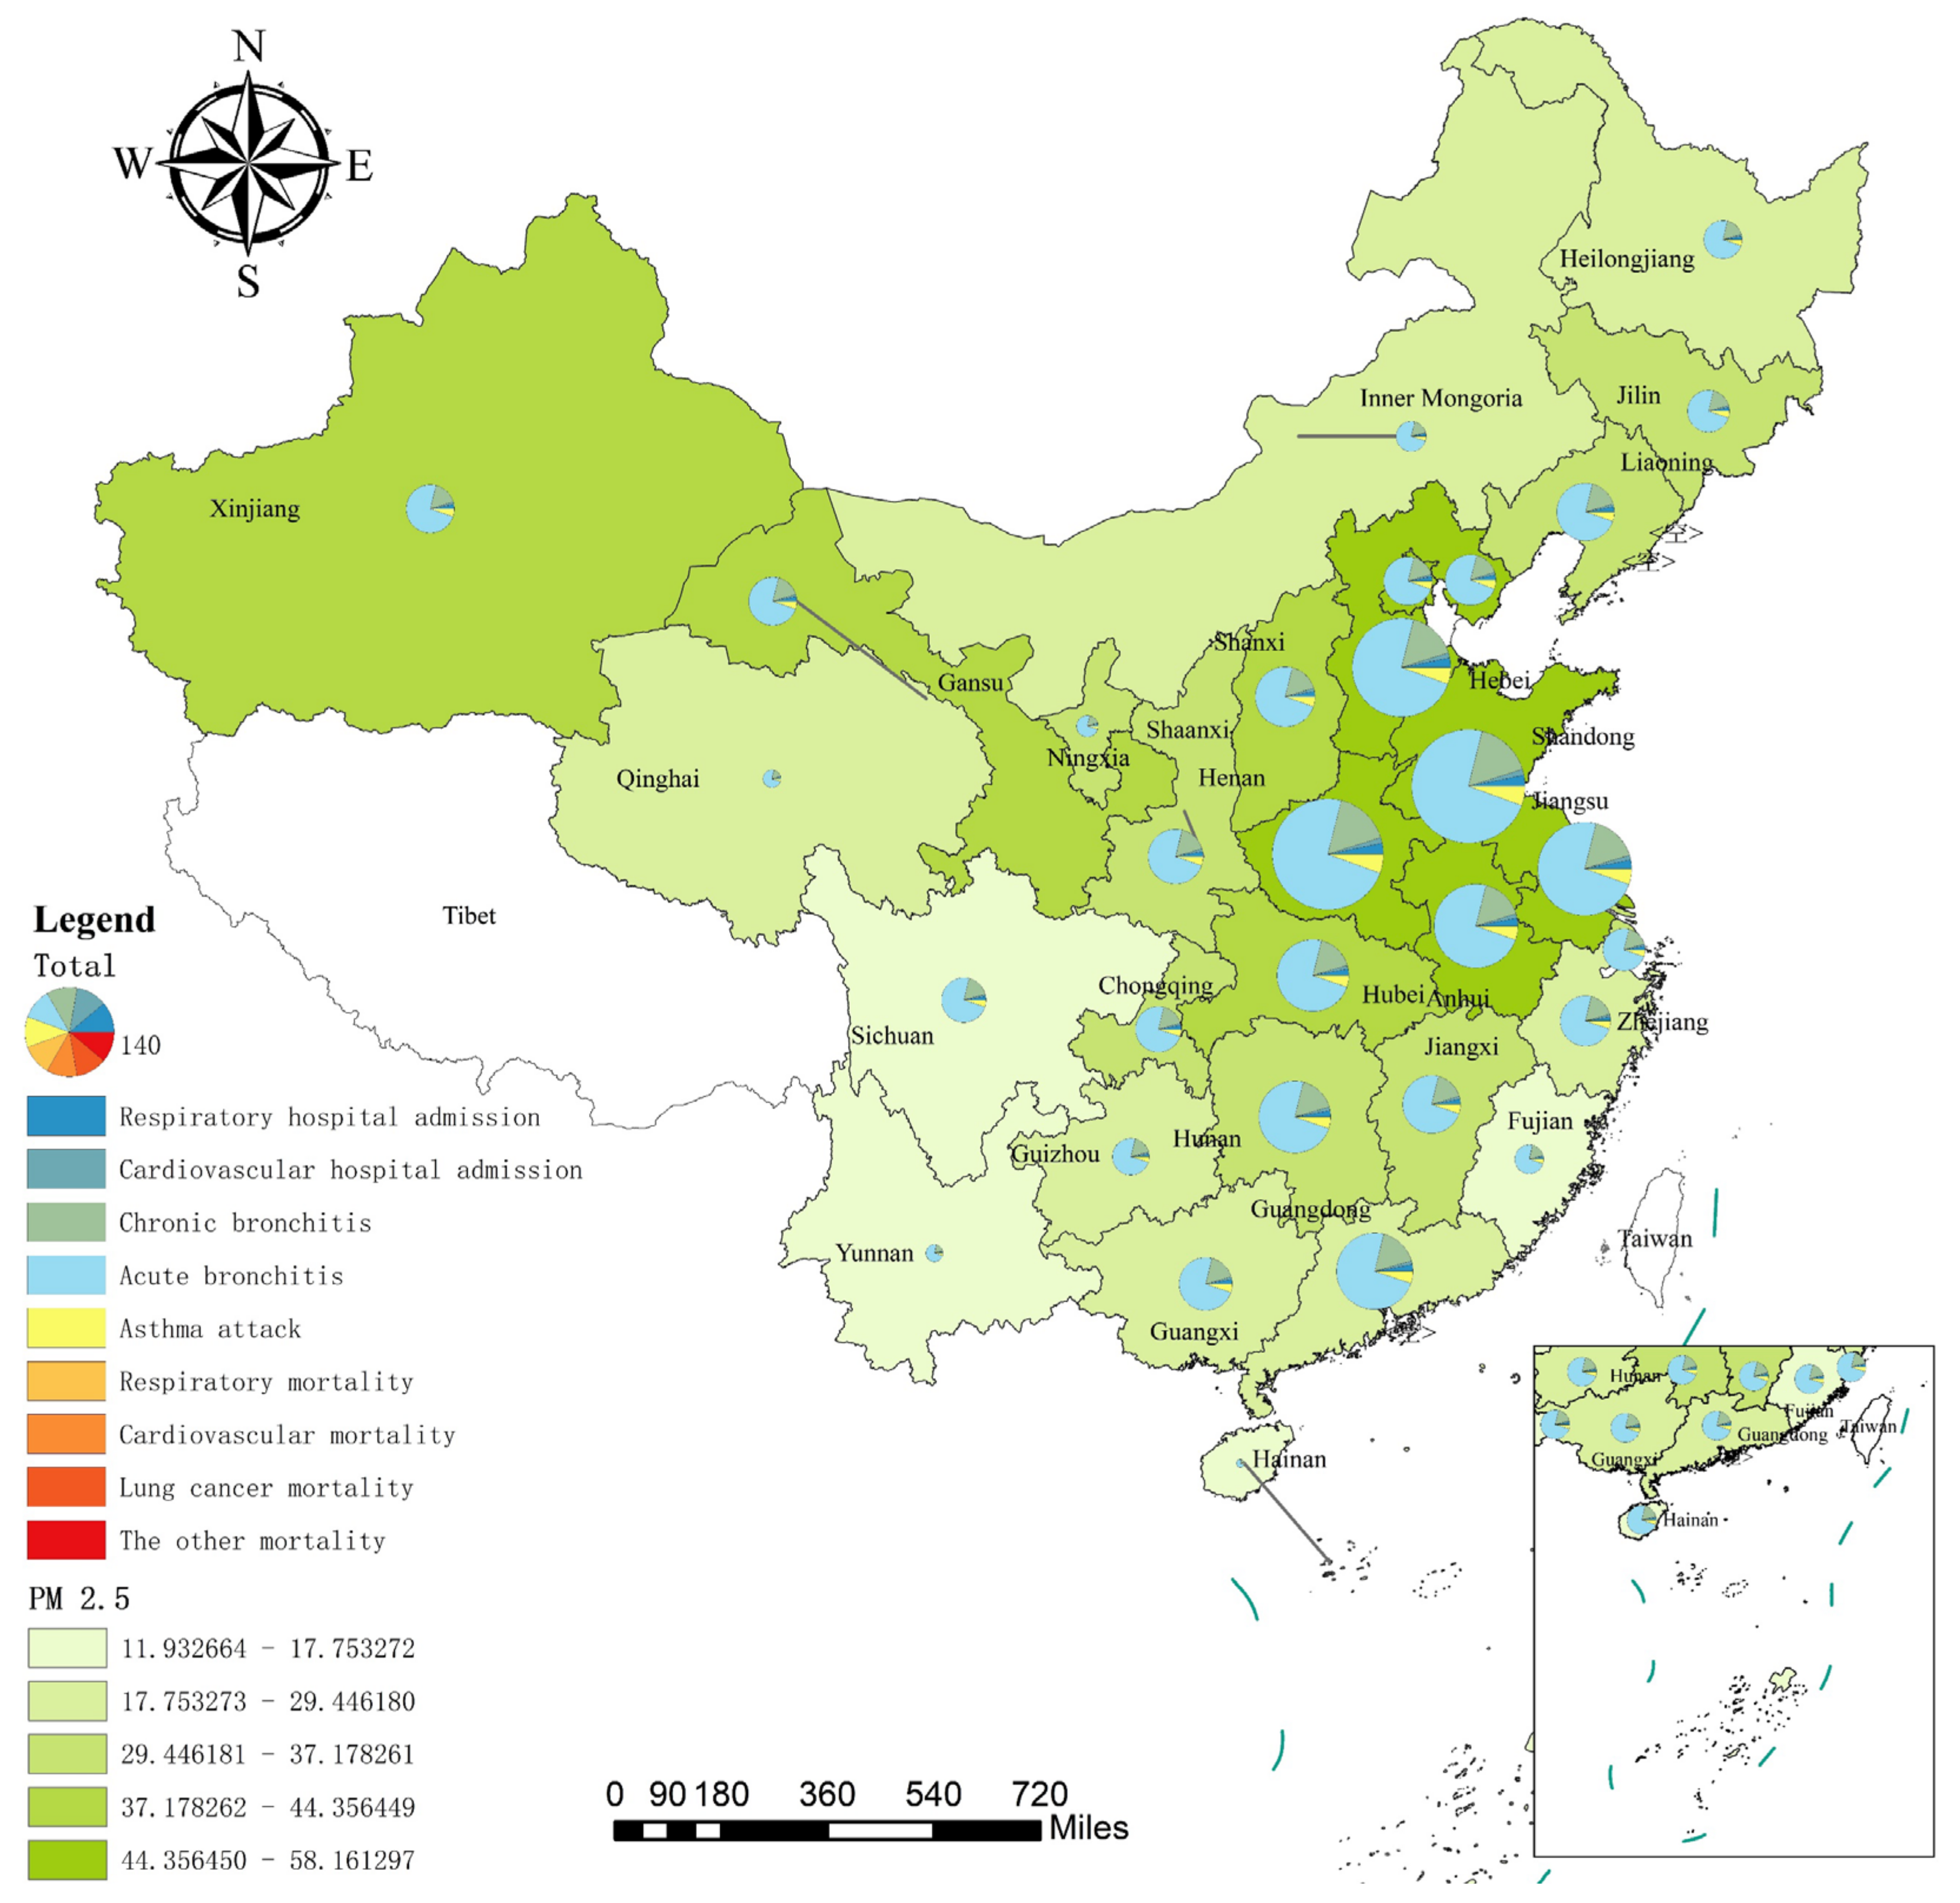
3.1. Evaluating Health Impact

Based on the log-linear exposure-response function, the health impact of PM2.5 exposure was calculated, and the results are shown in Figure 2a. For the temporal pattern, the total health impact of PM2.5 exposure fluctuates continuously, rising from 13.92 million in 2005 to a peak of 16.17 million in 2007. Subsequently, it shows a steady downward trend, reaching a minimum of 13.54 million in 2012, and increases sharply in 2013. In 2014, a maximum of 16.41 million was estimated, which gradually decreased to 13.50 million in 2017, with an annual average of 15.03 million. The sharp increase in the value of health impact in 2013 occurred due to the increased PM2.5 concentration caused by the high-intensity haze pollution in China. The total health impact continued to decline from 2014–2017. Thus, the State Council issued the Air Pollution Prevention and Control Action Plan in 2013, which has achieved positive results in haze control. From the perspective of different health endpoints, the number of outpatients far exceeds that of deaths and hospitalisations, among which the number of patients with acute bronchitis is the largest, accounting for 73% of the total health impact, followed by chronic bronchitis, accounting for 16%; the prevalence of asthma attacks is lower than that of the former two. The number of hospitalisations for respiratory and cardiovascular diseases does not account for a high proportion of the total health impact (less than 5% combined), but both are higher than the all-cause mortality.
Although the all-cause mortality of PM2.5 exposure accounted for the lowest proportion of the total health impact (approximately 1.5%) and the annual average death toll was 0.2227 million, the impact of mortality was much higher than that of the hospital admission and outpatient service. Therefore, the disease-specific mortality was further analysed (Figure 2b). Specifically, lung cancer mortality accounted for the majority of the all-cause mortality (more than 29%), followed by the cardiovascular and respiratory mortalities, accounting for nearly 26% and 17%, respectively. Yin et al. [38] calculated that lung cancer mortality, cardiovascular mortality, and respiratory mortality accounted for 32%, 25%, and 15% of the all-cause mortality, respectively, which is roughly consistent with the above results.
The health impact of PM2.5 exposure not only shows significant annual differences but also has distinct seasonal and monthly variations within the year. Figure 3 shows the health impact for each health endpoint by month due to PM2.5 exposure in 2017. The seasons were divided as follows: spring from March to May, summer from June to August, autumn from September to November, and winter from December to February. Overall, the health impact of PM2.5 exposure showed a U-shaped curve from spring to winter, and gradually decreased in winter, spring, autumn, and summer (in descending order of magnitude). In specific cases, the health impact in winter is 5.4062 million, about 3.12 times that in summer, and 3.19 million in spring, slightly higher than that in autumn. The health impact is the highest in winter, which may be due to the high PM2.5 concentration caused by the increase in heating coal and meteorological conditions that are unfavourable to the diffusion of air pollutants [55]. Yang et al. [36] estimated that the amount of mortality or morbidity caused by PM2.5 pollution in 28 Chinese cities during the winters of 2013–2016 was about three times that in the summer, which is consistent with the above results. The monthly cases of health impact were the highest in January, reaching 2.10 million, and the lowest in August at 0.47 million.
Figure 4 shows the spatial distribution of the health impact due to PM2.5 exposure at different health endpoints by province in 2017. The PM2.5 quintile map at the bottom of Figure 4 shows that the PM2.5 concentration of each province has obvious spatial distribution characteristics. The PM2.5 concentration in East and North China was the highest, followed by Central and South China, and the lowest was observed in Southwest China, Northwest China, and Northeast China. The distribution of PM2.5 concentration is consistent with the conclusion of Li and Ye [56]. Firstly, East China and North China are densely populated, and the traffic and industrial pollution along with the rapid economic development led to an increase in PM2.5 concentration in these regions. For example, the annual average PM2.5 concentration is above 45 µg/m3 in the Tianjin, Henan, Hebei, Shandong, Anhui, Jiangsu, Beijing, and Shanxi provinces. Secondly, there are relatively few heavy-polluting industries in Central and South China, and their PM2.5 concentration is lower than that in East and North China. For example, the Hubei province in Central China has an annual average daily PM2.5 concentration of 40.64 µg/m3. Moreover, South China is located on the west coast of the Pacific Ocean. The clean and humid sea breeze brought by the southeast winds in summer and the warm current from Japan cause the atmospheric pollutants emitted by economic and development activities in this region to be diluted; thus, the PM2.5 concentration in this region is not high [57,58]. Thirdly, the economic foundation of Southwest China and Northwest China is weak, and the pollution emission due to the social and economic activities of these regions with low population density is not far beyond the self-purification and repair capacity of the atmospheric environment. Moreover, the southwest and northwest regions are mostly deserts and plateaus, and the northwest winds from Siberia in winter promote air mobility in these regions, resulting in a low PM2.5 concentration. For example, the PM2.5 concentration in Inner Mongolia, Yunnan, and Guizhou are low, but the PM2.5 concentration in Gansu and Xinjiang (about 43 µg/m3) in the northwest is higher than that in the surrounding areas. The concentration of PM2.5 in Northeast China is also relatively low. For example, the annual average concentration of PM2.5 in Heilongjiang is 22.68 µg/m3.
The overall spatial distribution pattern of the health impact upon exposure to PM2.5 is as follows: that in East China, North China, Central China, and South China is higher, while that in Southwest China, Northwest China, and Northeast China is lower. Provinces with high PM2.5 concentrations in East China, North China, and Central China have a relatively high health impact caused by PM2.5. For example, Shandong had an average annual PM2.5 concentration of 57.89 µg/m3 in 2017, and the total health impact reached 1.66 million, ranking first in China, followed by Henan at 1.60 million. Although the annual average concentration of PM2.5 in South China is not high, Guangdong in South China is densely populated, with a mortality and morbidity of 0.76 million, ranking sixth in China. The total health impact is relatively low in Southwest, Northwest, and Northeast China, such as Ningxia, Jilin, Qinghai, Yunnan, Heilongjiang, Guizhou, and Inner Mongolia, which benefit from the low PM2.5 concentration and the low total population in these regions. From the perspective of different health endpoints, the all-cause mortality in Hebei, Jiangsu, Anhui, Shandong, Henan, and Guangdong exceeded 10,000, which is higher than the total health impact in Hainan (8400). Thus, exposure to high PM2.5 concentrations has caused severe mortality losses in such traditionally polluting industry-intensive provinces.

3.2. Estimating Economic Loss

For the temporal pattern, the economic loss caused by PM2.5 exposure shows an upward trend, with fluctuations from 2005–2017 (Figure 5a). The total economic loss has increased from 43,775.81 million USD in 2005 to 86,041.52 million USD in 2011 with a declining growth rate. In 2012, a slight decrease occurred, but it surged at a growth rate of 29.89% in 2013, going past 100 billion USD. It rose to a peak of 119,684.29 million USD in 2014, decreased slightly in 2015 and 2016, and increased subsequently in 2017 to 112,668.02 million USD. The average annual value of the total economic loss is 86,886.94 million USD, accounting for 1.71% of the GDP of China.
The economic loss of each health endpoint differs from the health impact. Specifically, the economic loss of the all-cause mortality accounts for approximately 62% of the total economic loss, but the proportion of all-cause mortality in the total health impact is below 1.5%. The economic loss of chronic bronchitis accounts for approximately 36% of all cases, followed by all-cause mortality. Although acute bronchitis accounts for the highest proportion of the total health impact (about 72%), its economic loss accounts for only 0.2% of the total. Therefore, on the one hand, preventing the impact of acute bronchitis with high rates of incidence on large crowds is necessary; on the other hand, reducing the economic loss caused by mortality and chronic bronchitis due to PM2.5 is also required.
The economic loss of disease-specific mortality due to PM2.5 exposure is shown in Figure 5b. The total economic loss of all-cause mortality has increased since 2005, reaching a maximum of 74,560.80 million USD in 2014. It declined after 2014 and reached 69,409.91 million USD in 2017. The average annual economic loss caused by all-cause mortality is 53,899.77 million USD. Among them, the economic loss due to lung cancer mortality is the highest at 15,883.78 million USD, followed by cardiovascular mortality at 13,993.43 million USD, and respiratory mortality at 9417.80 million USD. The sum of these accounts for about 73% of the total economic loss. During the study period, the economic loss caused by mortality showed a fluctuating upward trend, implying that PM2.5 pollution not only affects the safety and health of residents, but also results in social and economic losses due to premature death.
The changes in economic losses during the year are shown in Figure 6. On the whole, the health-related economic loss in each month from spring to winter shows a U-shaped curve. The trend of this curve is consistent with that of the monthly health impact curve. The economic loss was the lowest in August (approximately 3863.18 million USD), and highest in January (about 18,333.49 million USD). Notably, the economic loss in January was 4.75 times that in August, and 3.42 and 3.73 times that in June and July, respectively. This monthly difference mainly occurs due to the difference in PM2.5 concentration, which further proves the significant impact that PM2.5 concentration has on economic loss. In terms of the health endpoints, all-cause mortality and chronic bronchitis are the most important sources of economic loss, and the sum of the economic losses caused by them is more than 98% every month.
The spatial distribution of the economic losses of different health endpoints in each province is shown in Figure 7. Overall, the economic losses are high in East, North, Central, and South China, and low in Southwest, Northwest, and Northeast China. Specifically, the economic loss by PM2.5 exposure is relatively significant in Shandong, Jiangsu, and Anhui in East China, Hebei and Tianjin in North China, Henan, Hubei, and Hunan in Central China, and Guangdong in South China. However, the economic loss is relatively small in Sichuan, Guizhou, and Yunnan in Southwest China, Gansu, Qinghai, Ningxia, and Xinjiang in Northwest China, and Heilongjiang and Jilin in Northeast China.
The total economic loss in six heavily polluted provinces of Shandong, Jiangsu, Henan, Hebei, Guangdong, and Tianjin is 61,338.97 million USD, which is more than half of the national total economic loss of 112,668.00 million USD. This implies that the PM2.5 pollution caused by the economic development in these provinces has seriously endangered the health of residents and has generated substantial economic losses. In comparison, Guangdong ranks first in the GDP and population in the country, but its economic loss caused by PM2.5 pollution is significantly lower than that of Shandong, Jiangsu, Henan, and Hebei. Simultaneously, it can be seen that Shandong suffered the highest economic loss, amounting to 16,061.91 million USD, accounting for 2.14% of the regional GDP, while Hainan suffered the lowest economic loss, amounting to 52.23 million USD, accounting for 0.13% of the regional GDP. Interestingly, the economic losses of all-cause mortality and chronic bronchitis of Shandong are 10,231.29 million USD and 5542.05 million USD, respectively. Both of these exceed the sum of economic losses of Gansu, Inner Mongolia, Fujian, Guizhou, Ningxia, Qinghai, Yunnan, and Hainan, and are 100 times more than that of Hainan. This further confirms that lung cancer mortality, respiratory mortality, cardiovascular mortality, and chronic bronchitis due to PM2.5 are the main sources of health and economic loss in each province.

3.3. Dynamic Evolution Analysis of the Kernel Density

Figure 8a shows the kernel density distribution curve of the health impact in 30 provinces in 2005, 2008, 2011, 2014, and 2017. In general, the distribution of the total health impact shows an obvious ‘multi-peak’ distribution in each period, indicating that there are significant differences in the total health impact of PM2.5 exposure in each province. We specifically divided the ‘multi-peak’ into the ‘main peak’, ‘second peak’, and ‘third peak’, implying low, medium, and high levels of health impact, respectively. During 2005–2014, the height of the ‘main peak’ of the health impact distribution curve continued to rise and shifted slightly to the right, indicating that the provinces with a low level of health impact increased, along with their health impact values. The ‘second peak’ gradually formed over time; the ‘third peak’ also showed a clear trend to the right, indicating an increase in the value of health impact in provinces with a high level of health impact. Overall, during 2005–2014, the value of health impact in most provinces showed an upward trend. In 2017, the height of the ‘main peak’ of the health impact distribution curve increased and shifted to the left, indicating that the provinces with a low level of health impact increased, and the value of health impact in these provinces decreased. The ‘second peak’ shifted to the right, but its peak value decreased; the ‘third peak’ shifted to the left, and the peak value increased, indicating that the provinces with a high level of health impact increased, but their health impact values decreased. Overall, the health impact in most provinces showed a downward trend during 2014–2017, with a notable polarisation phenomenon.
Figure 8b shows the kernel density distribution of economic losses in the 30 provinces. In general, the distribution of total economic loss shows a ‘double-peak’ distribution in each period. We divided the ‘double-peak’ into the ‘main peak’ and ‘second peak’, representing low and high levels of economic loss, respectively. During 2005–2014, the height of the ‘main peak’ of the economic loss distribution curve continued to decline and shifted slightly to the right, indicating that the provinces with a low level of economic loss decreased, and the value of economic loss in these provinces increased. The ‘second peak’ was constantly shifting to the right, indicating that the provinces with a high level of economic loss increased. Overall, the economic losses in most provinces increased from 2005–2014. Compared with 2014, the height of the ‘main peak’ of the economic loss distribution curve increased in 2017, indicating that the provinces with a low level of economic loss increased. The ‘second peak’ shifted to the left, indicating that the provinces with a high level of economic loss decreased. Overall, the economic losses of most provinces showed a downward trend in 2017.

3.4. Uncertainty Analysis

The difference in the PM2.5 baseline concentration will impact the estimation of health impact and economic loss due to PM2.5 exposure [57]. An amount of 10 µg/m3 was selected as the PM2.5 baseline concentration above. However, Quah and Boon [59] reported that there was no threshold value for haze particles on human health, and exposure to extremely low concentrations of PM2.5 would also damage human health. Therefore, we selected 0 µg/m3 as another baseline concentration and compared the corresponding results with previous studies. The comparison results of health impact and economic loss under different PM2.5 baseline concentrations during 2005–2017 are presented in Table 4 and Table 5, respectively. The reduction in the baseline concentration improves the estimation results of the health impact and economic loss. Compared with the baseline concentration of 10 µg/m3, the estimated health impact upon exposure to PM2.5 increased by approximately 28%, and the economic loss increased by approximately 30% when the reference concentration was 0 µg/m3. However, the proportion of economic loss in the GDP increased with a decrease in the baseline concentration. When the baseline concentration was 0 µg/m3, the proportion of economic loss in the GDP decreased from 2.72% in 2005 to 1.82% in 2017; when the baseline concentration was 10 µg/m3, the proportion of economic loss decreased from 2.07% in 2005 to 1.34% in 2017. The proportion of economic loss in the GDP increased by 0.51% annually when the baseline concentration dropped from 10 µg/m3 to 0 µg/m3.

4. Conclusions and Policy Implications

Accurately measuring the impact of PM2.5 on human health is key to more efficient pollution control and sustainable development. In this study, taking 30 provinces from 2005–2017 in China as examples, the health damage and economic loss of PM2.5 were measured, and its spatial and temporal evolution were analysed emphatically. The results show that an average of 15.03 million people were affected by PM2.5 each year, and the average annual economic loss was 86,886.94 million USD, accounting for 1.71% of the GDP. In terms of time trend, the health impact upon exposure to PM2.5 increased initially, then fluctuated to 2014 and peaked. The decline in health impact and economic loss after 2014 was due to the remarkable achievements of the Air Pollution Prevention and Control Action Plan implemented after 2013. At each health endpoint, the number of patients with acute bronchitis and chronic bronchitis accounted for 88%, and approximately 36% of the total economic loss. The all-cause mortality accounted for 1.5%; however, the economic loss accounted for 62%. Among them, lung cancer, cardiovascular disease, and respiratory disease are the main types of mortality due to PM2.5 exposure. Seasonally, the health impact and economic loss of PM2.5 exposure showed a U-shaped curve from spring to winter, which was in descending order: winter, spring, autumn, and summer; the health impact in winter was more than three times that in summer. Regarding the spatial distribution, East, North, Central, and South China are greatly affected by PM2.5, while Southwest, Northwest, and Northeast China are relatively weak; the spatial distribution showed a strong spatial correlation and significant polarisation phenomenon. Furthermore, after adjusting the baseline concentration from 10 to 0, the estimated health impact upon exposure to PM2.5 increased by approximately 28%, and the economic loss increased by approximately 30%.
The above conclusions highlight some critical policy implications. First, the decline in the health impact and economic loss after 2014 proves that more attention should be given to the positive impact of policy constraints on the prevention and control of air pollutants, and substantial support must be provided for top-level design to improve ecological performance and public welfare in the future. For example, increasing the use of natural gas, reducing vehicle quantity, and developing the tertiary industry can effectively mitigate the PM2.5 concentration. Second, given that the health impact and economic loss in winter is about 3.12 times and 3.29 times that in summer, and the monthly cases of health impact were the highest in January, effective measures must be taken to alleviate the problem of the rising PM2.5 concentration in winter especially in January, such as reducing coal consumption, and adopting more environmentally friendly and low-energy-consumption heating methods. Third, the health hazards of PM2.5 exposure had different characteristics in different provinces, also showing a high spatial correlation and significant polarisation phenomenon. Therefore, the implementation of regional joint prevention and control policy by taking provincial features into consideration are to be considered as important methods to effectively reduce the health damage caused by PM2.5. Finally, it is essential to improve the public knowledge and risk perception about PM2.5. On the one hand, this can prompt the public to pay more attention to pollution prevention for high-risk diseases due to PM2.5 exposure. On the other hand, the strengthening of public awareness is conducive to the implementation of environmental regulation policies for government [58,60], such as raising the prices of some types of energy and the environmental tax.
There are some directions for further research in the assessment of the health impact and economic loss by PM2.5 exposure. We only selected nine representative health endpoints strongly correlated with the health impact and did not consider other health endpoints such as obesity, diabetes, behaviour disorder, or the influence of genetic factors. In future research, more abundant health endpoints can be considered; not only that, other pollutants can also be included in the research system. For example, the impact of O3 pollution on public health is gaining more and more attention [61,62], and our following research will focus on investigating the synergistic impact of PM2.5 and O3 on human health to provide a reference for environmental governance and decision-making.

Author Contributions

Conceptualisation, X.S. and R.Z.; data curation, X.S. and G.W.; funding acquisition, R.Z.; investigation, X.S., R.Z. and G.W.; methodology, X.S., R.Z. and G.W.; resources, R.Z.; software, X.S. and G.W.; visualisation, X.S.; writing—original draft, G.W.; writing—review and editing, X.S. and R.Z. All authors have read and agreed to the published version of the manuscript.

Funding

This work was supported by the Major Science and Technology Projects in Shanxi Province (No. 20181102017), and the Fundamental Research Funds for the Central Universities (No. 2021YJSGL11).

Institutional Review Board Statement

Not applicable.

Informed Consent Statement

Not applicable.

Acknowledgments

We thank the editor and anonymous reviewers for their efforts to enhance this article.

Conflicts of Interest

The authors declare no conflict of interest.

References

  1. Health Effects Institute. State of Global Air 2020: A Special Report on Globle Exposure to Air Pollution and Its Health Impacts; Health Effects Institute: Boston, MA, USA, 2020. [Google Scholar]
  2. Mazidi, M.; Speakman, J.R. Ambient particulate air pollution (PM2.5) is associated with the ratio of type 2 diabetes to obesity. Sci. Rep. 2017, 7, 9144. [Google Scholar] [CrossRef] [PubMed] [Green Version]
  3. Silva, R.A.; West, J.J.; Lamarque, J.; Shindell, D.T.; Collins, W.J.; Faluvegi, G.; Folberth, G.A.; Horowitz, L.W.; Nagashima, T.; Naik, V.; et al. Future global mortality from changes in air pollution attributable to climate change. Nat. Clim. Chang. 2017, 7, 647–651. [Google Scholar] [CrossRef] [PubMed] [Green Version]
  4. McDuffie, E.E.; Martin, R.V.; Spadaro, J.V.; Burnett, R.; Smith, S.J.; O’Rourke, P.; Hammer, M.S.; van Donkelaar, A.; Bindle, L.; Shah, V.; et al. Source sector and fuel contributions to ambient PM2.5 and attributable mortality across multiple spatial scales. Nat. Commun. 2021, 12, 3594. [Google Scholar] [CrossRef]
  5. Liu, M.; Saari, R.K.; Zhou, G.; Li, J.; Han, L.; Liu, X. Recent trends in premature mortality and health disparities attributable to ambient PM2.5 exposure in China: 2005–2017. Environ. Pollut. 2021, 279, 116882. [Google Scholar] [CrossRef] [PubMed]
  6. Ou, Y.; West, J.J.; Smith, S.J.; Nolte, C.G.; Loughlin, D.H. Air pollution control strategies directly limiting national health damages in the US. Nat. Commun. 2020, 11, 957. [Google Scholar] [CrossRef] [Green Version]
  7. Sokoty, L.; Rimaz, S.; Hassanlouei, B.; Kermani, M.; Janani, L. Short-term effects of air pollutants on hospitalization rate in patients with cardiovascular disease: A case-crossover study. Environ. Sci. Pollut. Res. 2021, 28, 26124–26131. [Google Scholar] [CrossRef]
  8. Wang, Q.; Liu, C.; Hou, Y.; Xin, F.; Mao, Z.; Xue, X. Study of the spatio-temporal variation of environmental sustainability at national and provincial levels in China. Sci. Total Environ. 2022, 807, 150830. [Google Scholar] [CrossRef]
  9. Jin, G.; Bingmei, G.; Xialing, S.; Jinli, X.; Baiyun, Y. Communication barrier, spillover effect and industrial-technological innovation. Sustainability 2019, 11, 4841. [Google Scholar]
  10. Yang, J.; Song, D.; Fang, D.; Wu, F. Drivers of consumption-based PM2.5 emission of Beijing: A structural decomposition analysis. J. Clean. Prod. 2019, 219, 734–742. [Google Scholar] [CrossRef]
  11. Creutzig, F.; Niamir, L.; Bai, X.; Callaghan, M.; Cullen, J.; Diaz-Jose, J.; Figueroa, M.; Grubler, A.; Lamb, W.F.; Leip, A.; et al. Demand-side solutions to climate change mitigation consistent with high levels of well-being. Nat. Clim. Chang. 2021, 12, 36–46. [Google Scholar] [CrossRef]
  12. Yue, H.; He, C.; Huang, Q.; Yin, D.; Bryan, B.A. Stronger policy required to substantially reduce deaths from PM2.5 pollution in China. Nat. Commun. 2020, 11, 1462. [Google Scholar] [CrossRef] [PubMed] [Green Version]
  13. He, P.; Liang, J.; Qiu, Y.; Li, Q.; Xing, B. Increase in domestic electricity consumption from particulate air pollution. Nat. Energy 2020, 5, 985–995. [Google Scholar] [CrossRef]
  14. Hong, C.; Zhang, Q.; Zhang, Y.; Davis, S.J.; Zhang, X.; Tong, D.; Guan, D.; Liu, Z.; He, K. Weakening aerosol direct radiative effects mitigate climate penalty on Chinese air quality. Nat. Clim. Chang. 2020, 10, 845–850. [Google Scholar] [CrossRef]
  15. Sun, X.; Zhang, R.; Wang, G.; Guo, J.; Liu, Z. Factor decomposition, reduction potential, and rebound effect of energy consumption related PM2.5 in China. J. Clean. Prod. 2021, 322, 129088. [Google Scholar] [CrossRef]
  16. Lin, X.; Du, Z.; Liu, Y.; Hao, Y. The short-term association of ambient fine particulate air pollution with hypertension clinic visits: A multi-community study in Guangzhou, China. Sci. Total Environ. 2021, 774, 145707. [Google Scholar] [CrossRef] [PubMed]
  17. Han, C.; Xu, R.; Gao, C.X.; Yu, W.; Zhang, Y.; Han, K.; Yu, P.; Guo, Y.; Li, S. Socioeconomic disparity in the association between long-term exposure to PM2.5 and mortality in 2640 Chinese counties. Environ. Int. 2021, 146, 106241. [Google Scholar] [CrossRef]
  18. Wang, J.; Xu, X.; Wang, S.; He, S.; He, P. Heterogeneous effects of COVID-19 lockdown measures on air quality in Northern China. Appl. Energy 2021, 282, 116179. [Google Scholar] [CrossRef]
  19. Chen, J.; Gao, M.; Li, D.; Li, L.; Song, M.; Xie, Q. Changes in PM2.5 emissions in China: An extended chain and nested refined laspeyres index decomposition analysis. J. Clean. Prod. 2021, 294, 126248. [Google Scholar] [CrossRef]
  20. Czwojdzińska, M.; Terpińska, M.; Kuźniarski, A.; Płaczkowska, S.; Piwowar, A. Exposure to PM2.5 and PM10 and COVID-19 infection rates and mortality: A one-year observational study in Poland. Biomed. J. 2021, in press. [Google Scholar] [CrossRef]
  21. Luo, G.; Zhang, L.; Hu, X.; Qiu, R. Quantifying public health benefits of PM2.5 reduction and spatial distribution analysis in China. Sci. Total Environ. 2020, 719, 137445. [Google Scholar] [CrossRef]
  22. Thiankhaw, K.; Chattipakorn, N.; Chattipakorn, S.C. PM2.5 exposure in association with AD-related neuropathology and cognitive outcomes. Environ. Pollut. 2022, 292, 118320. [Google Scholar] [CrossRef]
  23. Zhu, N.; Ji, X.; Geng, X.; Yue, H.; Li, G.; Sang, N. Maternal PM2.5 exposure and abnormal placental nutrient transport. Ecotoxicol. Environ. Saf. 2021, 207, 111281. [Google Scholar] [CrossRef] [PubMed]
  24. Bu, X.; Xie, Z.; Liu, J.; Wei, L.; Wang, X.; Chen, M.; Ren, H. Global PM2.5-attributable health burden from 1990 to 2017: Estimates from the global burden of disease study 2017. Environ. Res. 2021, 197, 111123. [Google Scholar] [CrossRef] [PubMed]
  25. Yang, X.; Zhang, T.; Zhang, Y.; Chen, H.; Sang, S. Global burden of COPD attributable to ambient PM2.5 in 204 countries and territories, 1990 to 2019: A systematic analysis for the Global Burden of Disease Study 2019. Sci. Total Environ. 2021, 796, 148819. [Google Scholar] [CrossRef] [PubMed]
  26. Maji, K.J.; Arora, M.; Dikshit, A.K. Burden of disease attributed to ambient PM2.5 and exposure in 190 cities in China. Environ. Sci. Pollut. Res. 2017, 24, 11559–11572. [Google Scholar] [CrossRef] [PubMed]
  27. Xie, Y.; Dai, H.; Dong, H.; Hanaoka, T.; Masui, T. Economic impacts from PM2.5 pollution-related health effects in China: A provincial-level analysis. Environ. Sci. Technol. 2016, 50, 4836–4843. [Google Scholar] [CrossRef] [PubMed]
  28. Liu, Q.; Zhang, Z.; Shao, C.; Zhao, R.; Guan, Y.; Chen, C. Spatio-temporal variation and driving factors analysis of PM2.5 health risks in Chinese cities. Ecol. Indic. 2021, 129, 107937. [Google Scholar] [CrossRef]
  29. Chen, H.; Li, L.; Lei, Y.; Wu, S.; Yan, D.; Dong, Z. Public health effect and its economics loss of PM2.5 pollution from coal consumption in China. Sci. Total Environ. 2020, 732, 138973. [Google Scholar] [CrossRef]
  30. Xue, T.; Liu, J.; Zhang, Q.; Geng, G.; Zheng, Y.; Tong, D.; Liu, Z.; Guan, D.; Bo, Y.; Zhu, T.; et al. Rapid improvement of PM2.5 pollution and associated health benefits in China during 2013–2017. Sci. China Earth Sci. 2019, 62, 1847–1856. [Google Scholar] [CrossRef]
  31. Zhang, B.; Wu, B.; Liu, J. PM2.5 pollution-related health effects and willingness to pay for improved air quality: Evidence from China’s prefecture-level cities. J. Clean. Prod. 2020, 273, 122876. [Google Scholar] [CrossRef]
  32. Li, L.; Lei, Y.; Wu, S.; Huang, Z.; Luo, J.; Wang, Y.; Chen, J.; Yan, D. Evaluation of future energy consumption on PM2.5 emissions and public health economic loss in Beijing. J. Clean. Prod. 2018, 187, 1115–1128. [Google Scholar] [CrossRef]
  33. Wang, J.; Zhang, L.; Niu, X.; Liu, Z. Effects of PM2.5 on health and economic loss: Evidence from Beijing-Tianjin-Hebei region of China. J. Clean. Prod. 2020, 257, 120605. [Google Scholar] [CrossRef]
  34. Guan, Y.; Kang, L.; Wang, Y.; Zhang, N.; Ju, M. Health loss attributed to PM2.5 pollution in China’s cities: Economic impact, annual change and reduction potential. J. Clean. Prod. 2019, 217, 284–294. [Google Scholar] [CrossRef]
  35. Maji, K.J.; Ye, W.; Arora, M.; Shiva Nagendra, S.M. PM2.5-related health and economic loss assessment for 338 Chinese cities. Environ. Int. 2018, 121, 392–403. [Google Scholar] [CrossRef] [PubMed]
  36. Yang, S.; Fang, D.; Chen, B. Human health impact and economic effect for PM2.5 exposure in typical cities. Appl. Energ. 2019, 249, 316–325. [Google Scholar] [CrossRef]
  37. ICD-10. International Statistical Classification of Diseases and Related Health Problems 10th Revision. Available online: https://icd.who.int/browse10/2019/en# (accessed on 10 August 2021).
  38. Yin, H.; Pizzol, M.; Xu, L. External costs of PM2.5 pollution in Beijing, China: Uncertainty analysis of multiple health impacts and costs. Environ. Pollut. 2017, 226, 356–369. [Google Scholar] [CrossRef]
  39. Chen, R.; Li, Y.; Ma, Y.; Pan, G.; Zeng, G.; Xu, X.; Chen, B.; Kan, H. Coarse particles and mortality in three Chinese cities: The China Air Pollution and Health Effects Study (CAPES). Sci. Total Environ. 2011, 409, 4934–4938. [Google Scholar] [CrossRef]
  40. Guo, H.; Li, W.; Wu, J. Ambient PM2.5 and annual lung cancer incidence: A nationwide study in 295 Chinese counties. Int. J. Environ. Res. Public Health 2020, 17, 1481. [Google Scholar] [CrossRef] [Green Version]
  41. Lelieveld, J.; Evans, J.S.; Fnais, M.; Giannadaki, D.; Pozzer, A. The contribution of outdoor air pollution sources to premature mortality on a global scale. Nature 2015, 525, 367–371. [Google Scholar] [CrossRef]
  42. Cao, J.; Yang, C.; Li, J.; Chen, R.; Chen, B.; Gu, D.; Kan, H. Association between long-term exposure to outdoor air pollution and mortality in China: A cohort study. J. Hazard. Mater. 2011, 186, 1594–1600. [Google Scholar] [CrossRef]
  43. Huang, Q.; Xu, Q.; Chai, Y. Assessment of PM2.5 pollution and its influence on health and economic benefits based on BenMAP in China. J. Saf. Environ. 2017, 37, 2278–2779. [Google Scholar]
  44. Peng, X.; Xiaoyun, L.; Zhaorong, L.; Tiantian, L.; Yuhua, B. Study of exposure-response relationship of air particulate pollution in China. China Environ. Sci. 2009, 29, 1034–1040. [Google Scholar]
  45. Huang, D.S.; Zhang, S.Q. Health benefit evaluation for PM2.5 pollution control in Beijing-Tianjin-Hebei region of China. China Environ. Sci. 2013, 33, 166–174. [Google Scholar]
  46. Wang, G.; Wu, L.; Chen, J.; Song, Y.; Chen, R. A CGE-based analysis on PM2.5-induced health-related economic effect in Beijing. China Environ. Sci. 2017, 37, 2779–2785. [Google Scholar]
  47. National Health and Family Planning Commission. China Health and Family Planning Statistical Yearbook 2005; Peking Union Medical College Press: Beijing, China, 2005. [Google Scholar]
  48. Giannadaki, D.; Giannakis, E.; Pozzer, A.; Lelieveld, J. Estimating health and economic benefits of reductions in air pollution from agriculture. Sci. Total Environ. 2018, 622–623, 1304–1316. [Google Scholar] [CrossRef]
  49. Lu, X.; Lin, C.; Li, Y.; Yao, T.; Fung, J.C.H.; Lau, A.K.H. Assessment of health burden caused by particulate matter in southern China using high-resolution satellite observation. Environ. Int. 2017, 98, 160–170. [Google Scholar] [CrossRef]
  50. OECD. The Cost of air Pollution: Health Impact of Road Transport. Available online: https://www.oecd-ilibrary.org/content/publication/9789264210448-en (accessed on 10 August 2021).
  51. Guo, X.R.; Cheng, S.Y.; Chen, D.S.; Zhou, Y.; Wang, H.Y. Estimation of economic costs of particulate air pollution from road transport in China. Atmos. Environ. 2010, 44, 3369–3377. [Google Scholar] [CrossRef]
  52. Hammitt, J.K.; Zhou, Y. The economic value of air-pollution-related health risks in China: A contingent valuation study. Environ. Resour. Econ. 2006, 33, 399–423. [Google Scholar] [CrossRef]
  53. World Health Organization. Air Quality Guidelines for Particulate Matter, Ozone, Nitrogen Dioxide and Sulfur Dioxide. Available online: http://apps.who.int/iris/bitstream/10665/69477/1/WHO_SDE_PHE_OEH_06.02_eng.pdf (accessed on 10 August 2021).
  54. National Bureau of Statistics of China. (2006a–2018a); China Statistical Yearbook 2006–2018; China Statistics Press: Beijing, China, 2006–2018.
  55. Wang, Z.; Li, Y.; Chen, T. Spatial-temporal characteristics of PM2.5 in Beijing in 2013. Acta Geogr. Sin. 2015, 70, 110–120. [Google Scholar]
  56. Li, J.; Ye, S. Regional policy synergy and haze governance-empirical evidence from 281 prefecture-level cities in China. Environ. Sci. Pollut. Res. 2021, 28, 10763–10779. [Google Scholar] [CrossRef]
  57. Liu, Y.; Sun, X.; Sun, Y.; Li, C. Evolution of spatial pattern of atmospheric PM2.5 pollution concentration in China from 1998 to 2016: Based on an empirical study of 339 cities. Resour. Environ. Yangtze Basin 2020, 5, 1163–1173. [Google Scholar]
  58. Sun, X.; Zhang, R.; Chen, X.; Li, P.; Guo, J. Impact of nanotechnology patents on green development of China’s building industry. Recent Pat. Nanotechnol. 2020, 14, 141–152. [Google Scholar] [CrossRef] [PubMed]
  59. Quah, E.; Boon, T.L. The economic cost of particulate air pollution on health in Singapore. J. Asian Econ. 2003, 14, 73–90. [Google Scholar] [CrossRef]
  60. Guo, J.; Niu, H.; Xiao, D.; Sun, X.; Fan, L. Urban green-space water-consumption characteristics and its driving factors in China. Ecol. Indic. 2021, 130, 108076. [Google Scholar] [CrossRef]
  61. Huang, J.; Zhu, Y.; Kelly, J.T.; Jang, C.; Wang, S.; Xing, J.; Chiang, P.; Fan, S.; Zhao, X.; Yu, L. Large-scale optimization of multi-pollutant control strategies in the Pearl River Delta region of China using a genetic algorithm in machine learning. Sci. Total Environ. 2020, 722, 137701. [Google Scholar] [CrossRef] [PubMed]
  62. Xie, Y.; Dai, H.; Zhang, Y.; Wu, Y.; Hanaoka, T.; Masui, T. Comparison of health and economic impacts of PM2.5 and ozone pollution in China. Environ. Int. 2019, 130, 104881. [Google Scholar] [CrossRef] [PubMed]
Figure 1. The research framework.
Ijerph 19 01922 g001
Figure 2. Annual changes in the health impact due to PM2.5 exposure. (a) Health impact assessment of PM2.5 exposure in China from 2005–2017. (b) Disease-specific mortality assessment due to PM2.5 exposure in China from 2005–2017.
Ijerph 19 01922 g002
Figure 3. Health impact assessment due to PM2.5 exposure by month in 2017.
Ijerph 19 01922 g003
Figure 4. Spatial distribution of the health impact due to PM2.5 exposure by province in 2017. (Notes: a. The 9 health endpoints and their respective colours are explained in the Legend. The pie chart represents the total health impact, and the green graph at the bottom is the PM2.5 value of each province. b. Owing to the space limitations, the spatial distribution map of other years is not shown; this can be obtained from the corresponding author.).
Ijerph 19 01922 g004
Figure 5. Annual changes in the economic loss by PM2.5 exposure. (a) Estimation of economic loss by PM2.5 exposure in China during 2005–2017. (b) Estimation of the disease-specific mortality economic loss by PM2.5 exposure in China during 2005–2017.
Ijerph 19 01922 g005
Figure 6. Estimation of the economic loss due to PM2.5 exposure by month in 2017.
Ijerph 19 01922 g006
Figure 7. Spatial distribution of economic loss due to PM2.5 exposure by province in 2017. (Notes: a. The 9 health endpoints and their respective colours are explained in the Legend. The pie chart represents the total economic loss, and the green graph at the bottom is the PM2.5 value of each province. b. Owing to the space limitations, the spatial distribution map of other years is not shown; this can be obtained from the corresponding author.).
Ijerph 19 01922 g007
Figure 8. Kernel density analysis of the health impact and economic loss by PM2.5 exposure. (a) Kernel density analysis of the health impact. (b) Kernel density analysis of the economic loss.
Ijerph 19 01922 g008
Table 1. PM2.5 exposure-response coefficient of each health endpoint.
Health Endpoint Exposure - Response   Coefficient   ( β )
(95% CI)
Reference
All-cause mortality0.00090 (0.00000, 0.00180)Cao et al. [42]; Huang et al. [43]; Yin et al. [38]
Respiratory mortality0.00143 (0.00085, 0.00201)Peng et al. [44]; Yin et al. [38]
Cardiovascular mortality0.00053 (0.00015, 0.00090)Peng et al. [44]; Yin et al. [38]
Lung cancer mortality0.00340 (0.00000, 0.00710)Cao et al. [42]; Huang et al. [43]; Yin et al. [38]
Respiratory hospital admission0.00109 (0.00000, 0.00221)Huang and Zhang [45]; Wang et al. [33]; Yang et al. [36]
Cardiovascular hospital admission0.00068 (0.00043, 0.00093)Huang and Zhang [45]; Wang et al. [33]; Yang et al. [36]; Yin et al. [38]
Chronic bronchitis0.01009 (0.00366, 0.01559)Huang and Zhang [45]; Wang et al. [46]; Wang et al. [33]
Acute bronchitis0.00790 (0.00270, 0.01300)Huang and Zhang [45]; Wang et al. [33]; Yin et al. [38]
Asthma attack0.00210 (0.00145, 0.00274)Huang and Zhang [45]; Yang et al. [36]; Yin et al. [38]
Table 2. Baseline incidence of each health endpoint.
Health Endpoint Baseline   Incidence   ( B ) Reference
All-cause mortality0.006136National Health and Family Planning Commission [47]
Respiratory mortality0.000680National Health and Family Planning Commission [47]
Cardiovascular mortality0.002690Yin et al. [38]
Lung cancer mortality0.000497Yin et al. [38]
Respiratory hospital admission0.010200National Health and Family Planning Commission [47]
Cardiovascular hospital admission0.008550Wang et al. [46]
Chronic bronchitis0.006900National Health and Family Planning Commission [47]
Acute bronchitis0.038000Yin et al. [38]
Asthma attack0.009400Yin et al. [38]
Table 3. Unit economic loss of each health endpoint in China in the base year (USD).
Health Endpoint Unit   Economic   Loss   ( H C s , k ) MethodReference
All-cause mortality132,000Adjusted human capital (AHC)Guo et al. [51]; Hammitt and Zhou, [52]; Yin et al. [38]
Respiratory mortality
Cardiovascular mortality
Lung cancer mortality
Respiratory hospital admission792.90Cost of illness (COI)Maji et al. [35]
Cardiovascular hospital admission1600Cost of illness (COI)Yin et al. [38]
Chronic bronchitis7000Adjusted human capital (AHC)Guo et al. [51]; Maji et al. [35]; Yin et al. [38]
Acute bronchitis9Willingness to pay (WTP)Guo et al. [51]; Yin et al. [38]
Asthma attack7Willingness to pay (WTP)Guo et al. [51]; Maji et al. [35]; Yin et al. [38]
Table 4. The comparison of health impact upon exposure to PM2.5 at different baseline concentrations.
YearBaseline Concentration 0 µg/m3Baseline Concentration 10 µg/m3
Health Impact (104 Persons)(95% Confidence Interval)Health Impact (104 Persons)(95% Confidence Interval)
20051800.712(695.872, 2685.142)1392.344(526.008, 2118.382)
20061978.924(771.993, 2926.691)1580.378(602.849, 2383.763)
20072016.671(787.824, 2978.886)1617.336(617.836, 2436.388)
20081962.916(763.791, 2909.477)1555.026(591.624, 2351.009)
20091962.826(763.109, 2911.493)1550.647(589.445, 2346.207)
20101966.307(764.018, 2918.132)1550.397(589.000, 2347.077)
20111885.919(729.167, 2810.957)1461.029(552.2416, 2221.853)
20121789.161(687.764, 2680.348)1353.639(508.623, 2069.571)
20132041.683(795.224, 3023.635)1622.542(617.935, 2450.876)
20142061.576(803.365, 3051.796)1640.878(625.232, 2477.466)
20151956.514(757.594, 2912.364)1524.168(576.990, 2314.685)
20161783.839(684.017, 2678.245)1334.372(500.109, 2044.817)
20171801.503(691.031, 2703.931)1349.800(506.072, 2067.790)
Table 5. The comparison of economic loss upon exposure to PM2.5 at different baseline concentrations.
YearBaseline Concentration 0 µg/m3Baseline Concentration 10 µg/m3
Economic Loss (million USD)(95% Confidence Interval)Proportion in GDPEconomic Loss (million USD)(95% Confidence Interval)Proportion in GDP
200557,522.02(8660.47, 101,210.74)2.72%43,775.81(6573.66, 77,554.43)2.07%
200670,763.42(10,663.94, 124,171.13)2.87%55,618.70(8361.95, 98,241.52)2.26%
200782,384.33(12,416.80, 144,505.27)2.78%65,026.05(9777.93, 114,807.88)2.20%
200889,543.43(13,490.81, 157,239.73)2.47%69,815.93(10,493.16, 123,417.55)1.92%
200996,165.01(14,487.25, 168,908.35)2.33%74,771.21(11,236.75, 132,212.59)1.82%
2010106,659.00(16,067.26, 187,371.65)2.27%82,770.70(12,438.028, 146,384.33)1.76%
2011112,843.20(16,990.46, 198,519.83)2.05%86,041.52(12,921.40, 152,408.87)1.56%
2012115,170.90(17,330.35, 202,960.71)1.85%85,764.00(12,869.78, 152,202.44)1.38%
2013142,425.00(21,460.06, 250,030.15)2.06%111,397.80(16,744.83, 196,863.19)1.61%
2014152,784.00(23,021.99, 268,178.29)2.02%119,684.30(17,991.49, 211,474.72)1.58%
2015151,470.60(22,809.95, 266,359.28)1.90%116,137.40(17,444.45, 205,620.39)1.46%
2016144,049.50(21,669.92, 254,040.29)1.80%106,058.80(15,909.77, 188,372.44)1.33%
2017152,775.30(22,983.47, 269,400.71)1.82%112,668.00(16,902.03, 200,088.18)1.34%
Publisher’s Note: MDPI stays neutral with regard to jurisdictional claims in published maps and institutional affiliations.

