
Impacts of COVID-19 on Air Quality through Traffic Reduction


Abstract
:1. Introduction
2. Materials and Methods
2.1. Data Collection
2.2. Regression Analysis
2.3. Calculation of COVID-19-Attributable Air Quality Change
3. Results
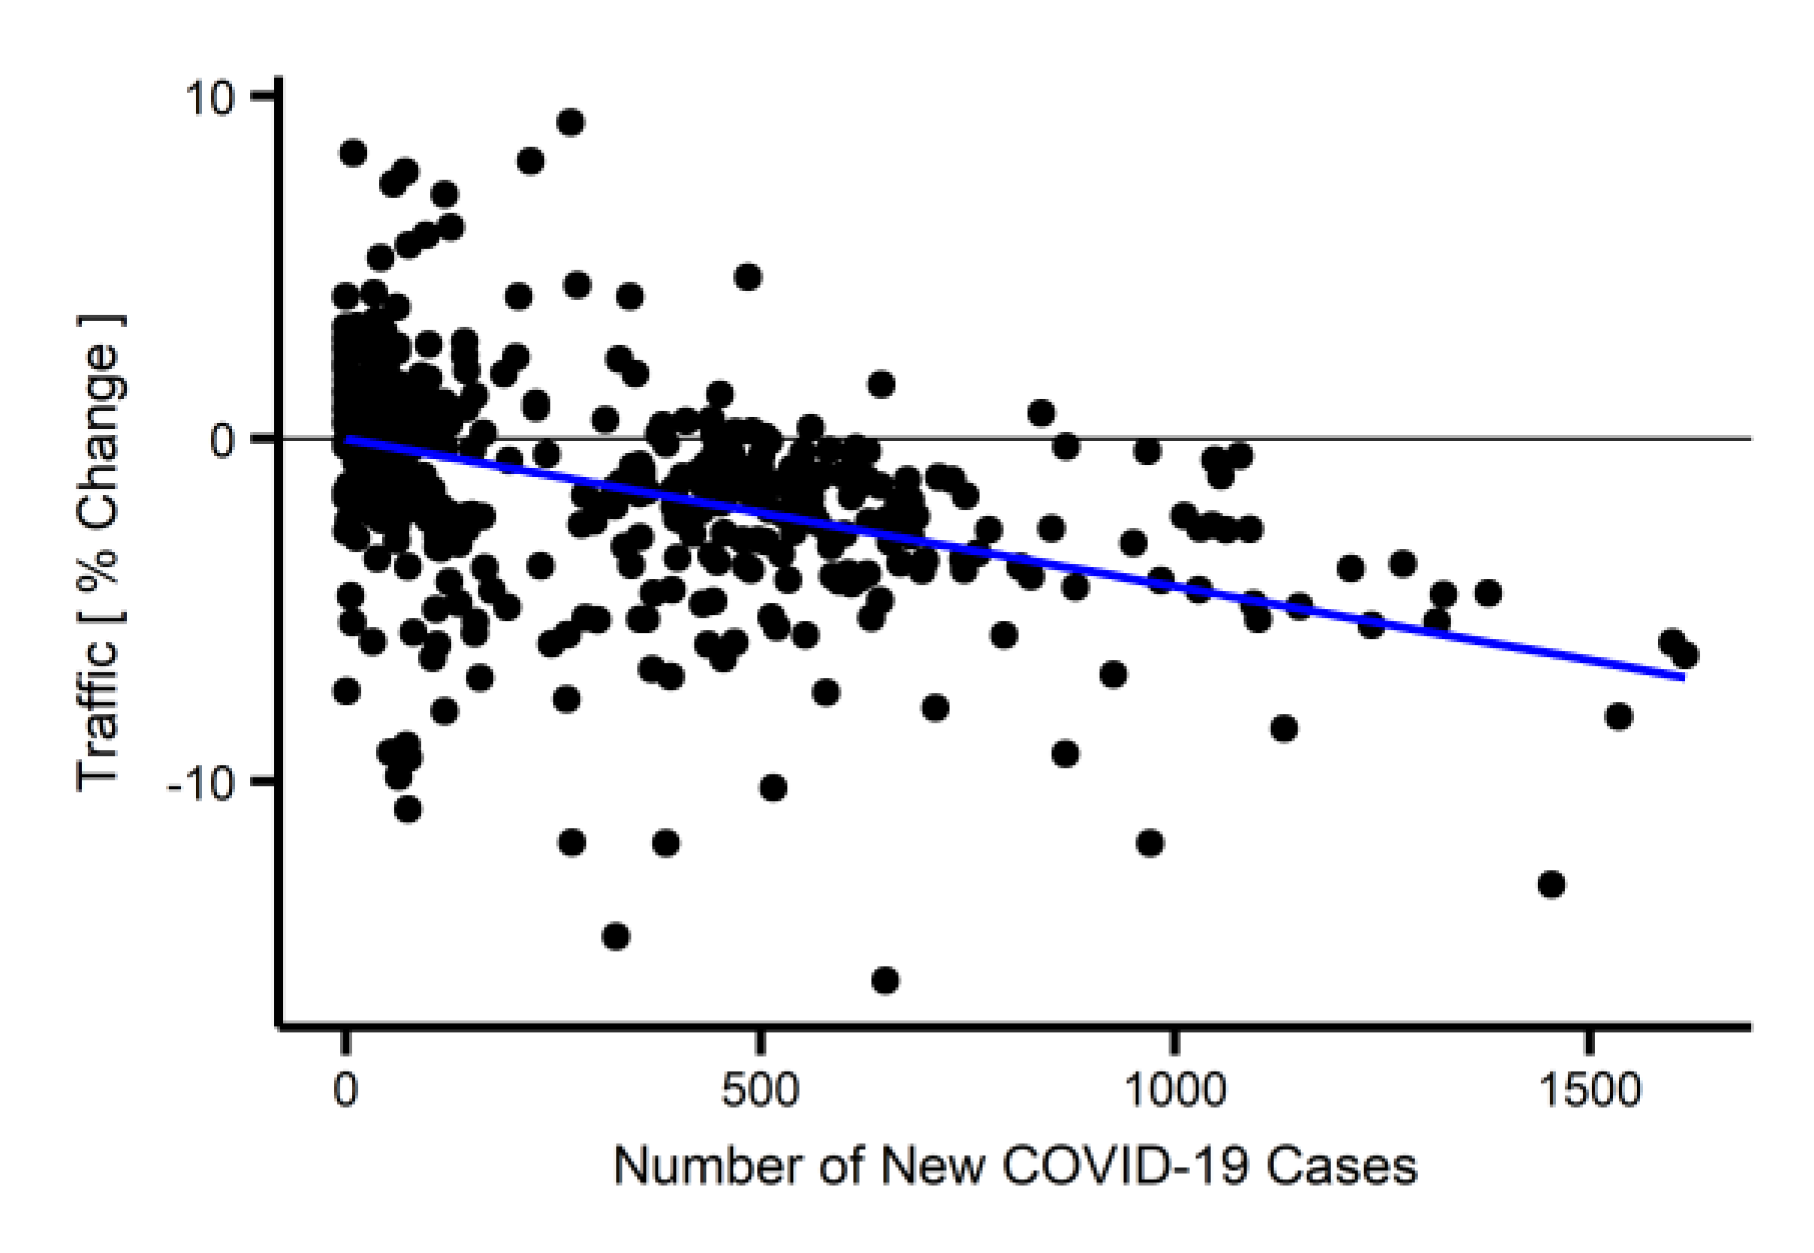
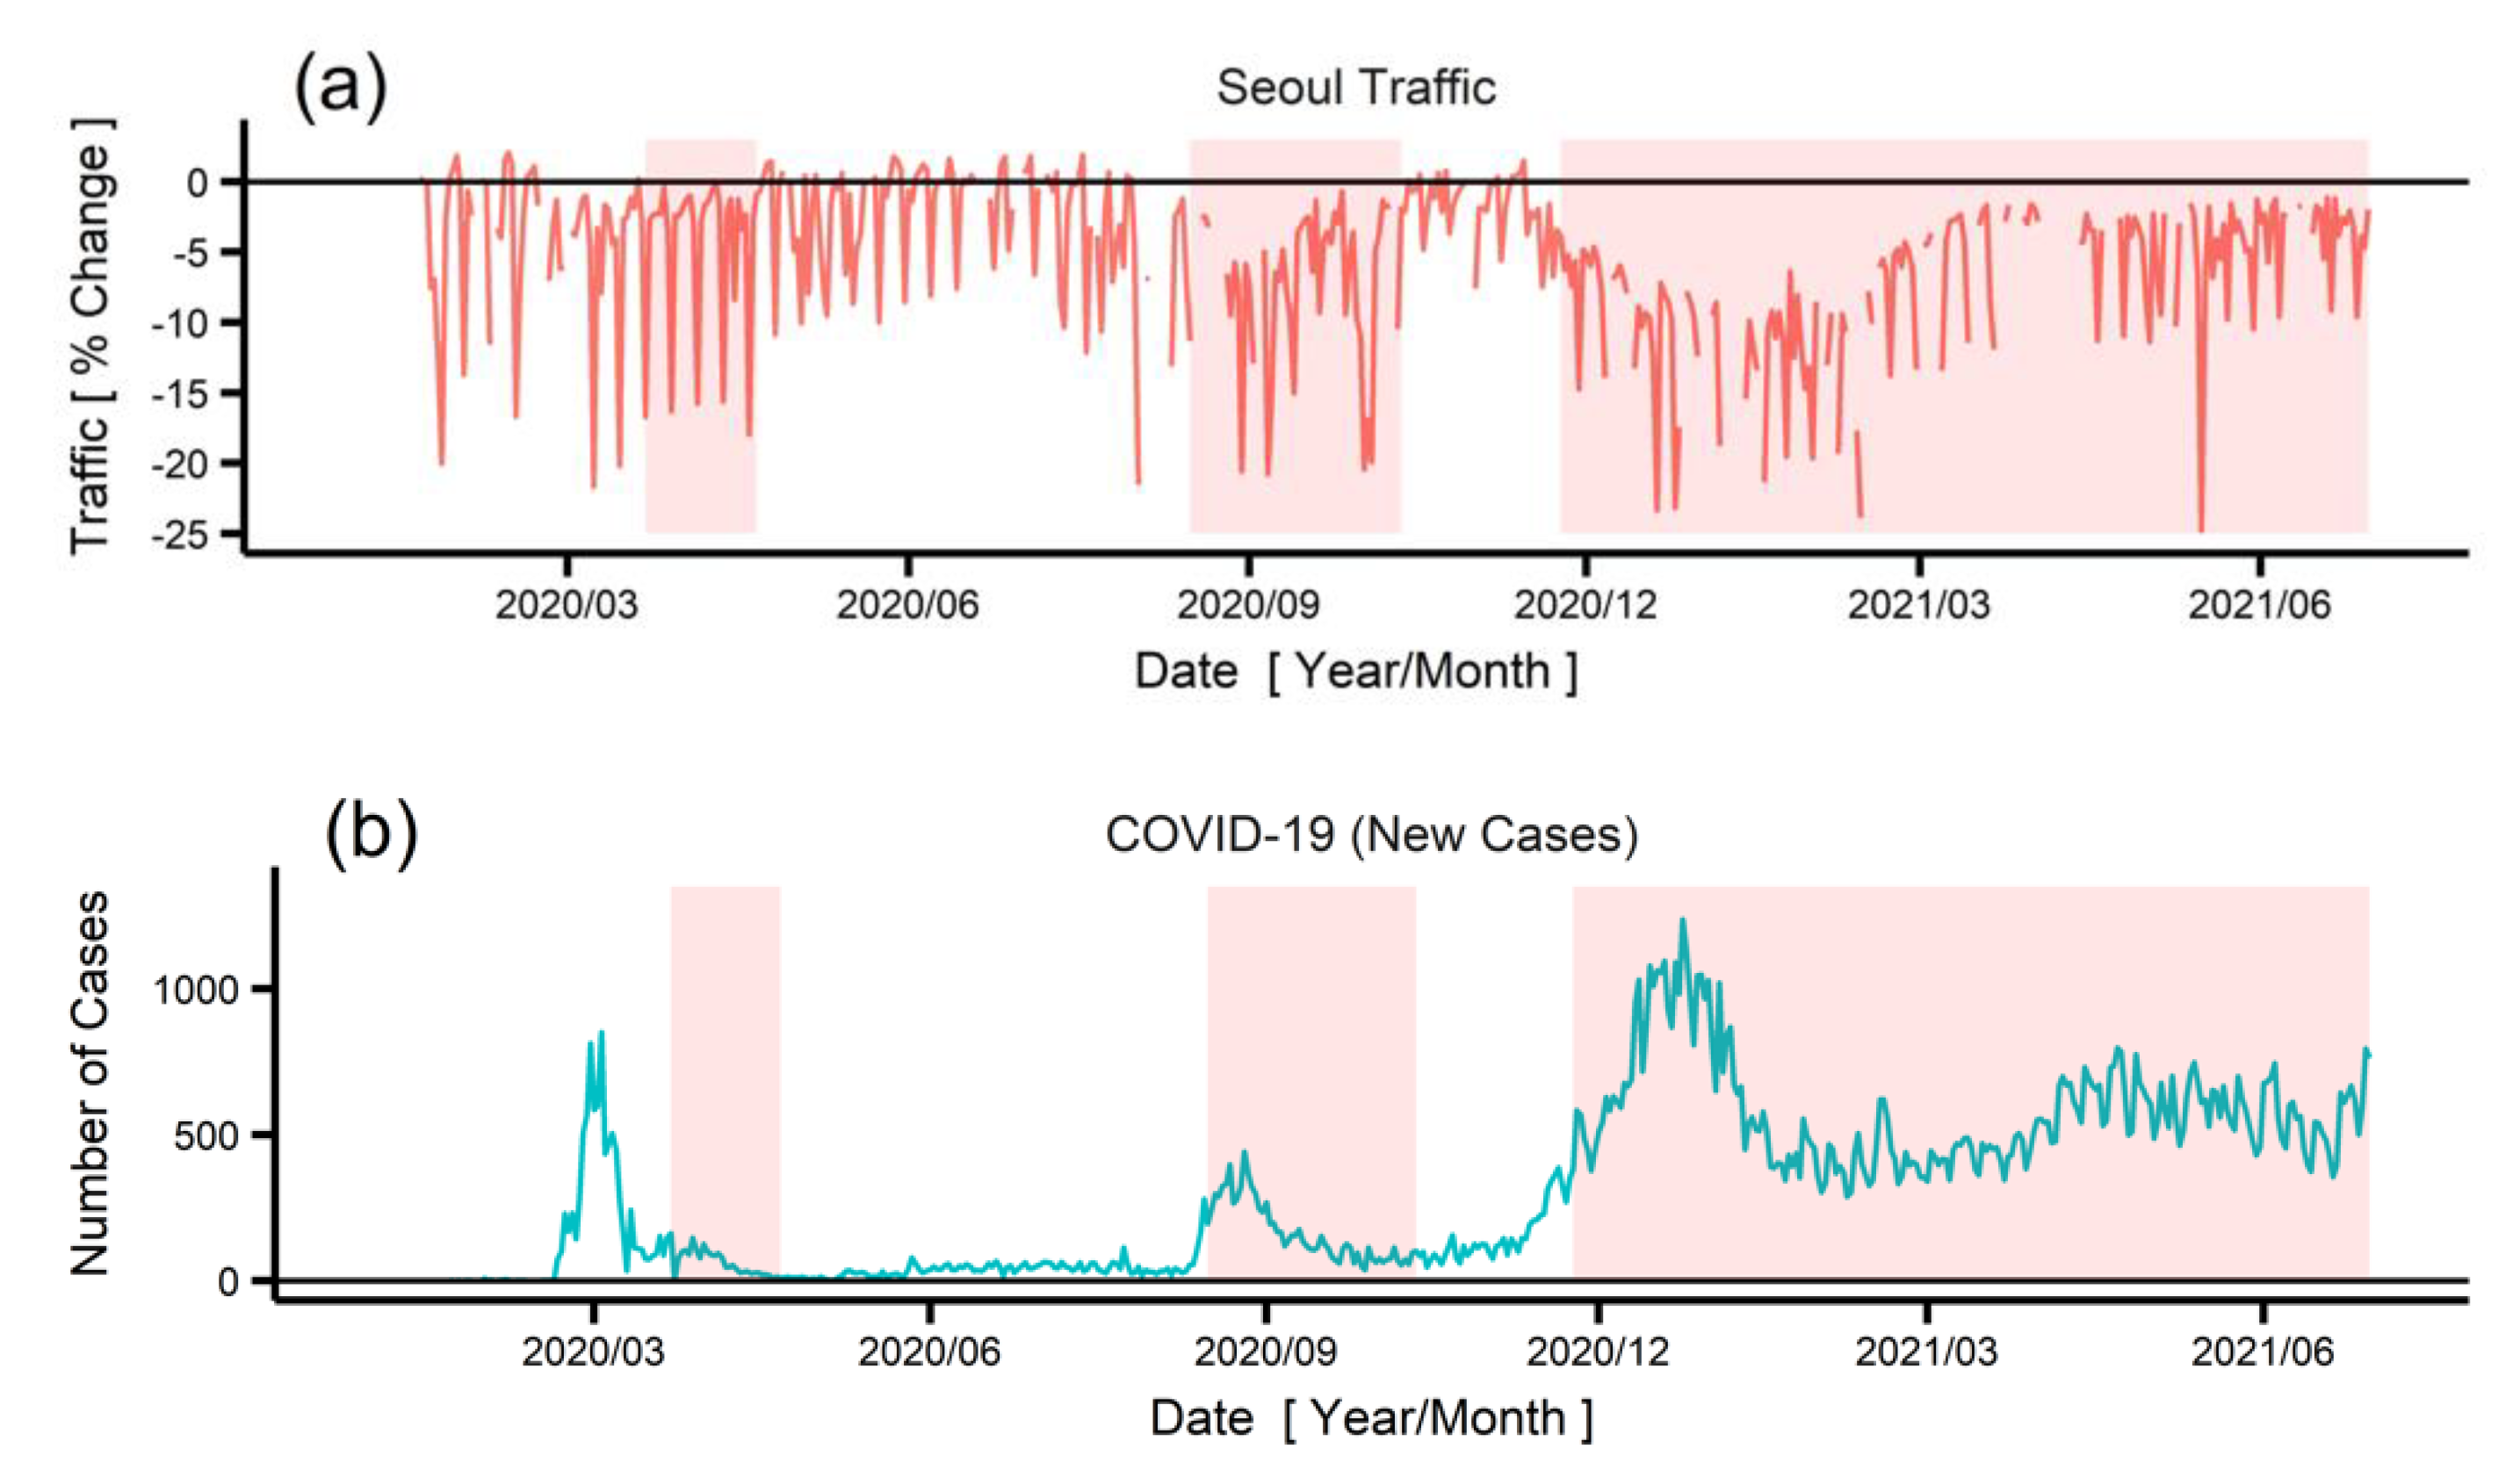
3.1. Association of Traffic with COVID-19
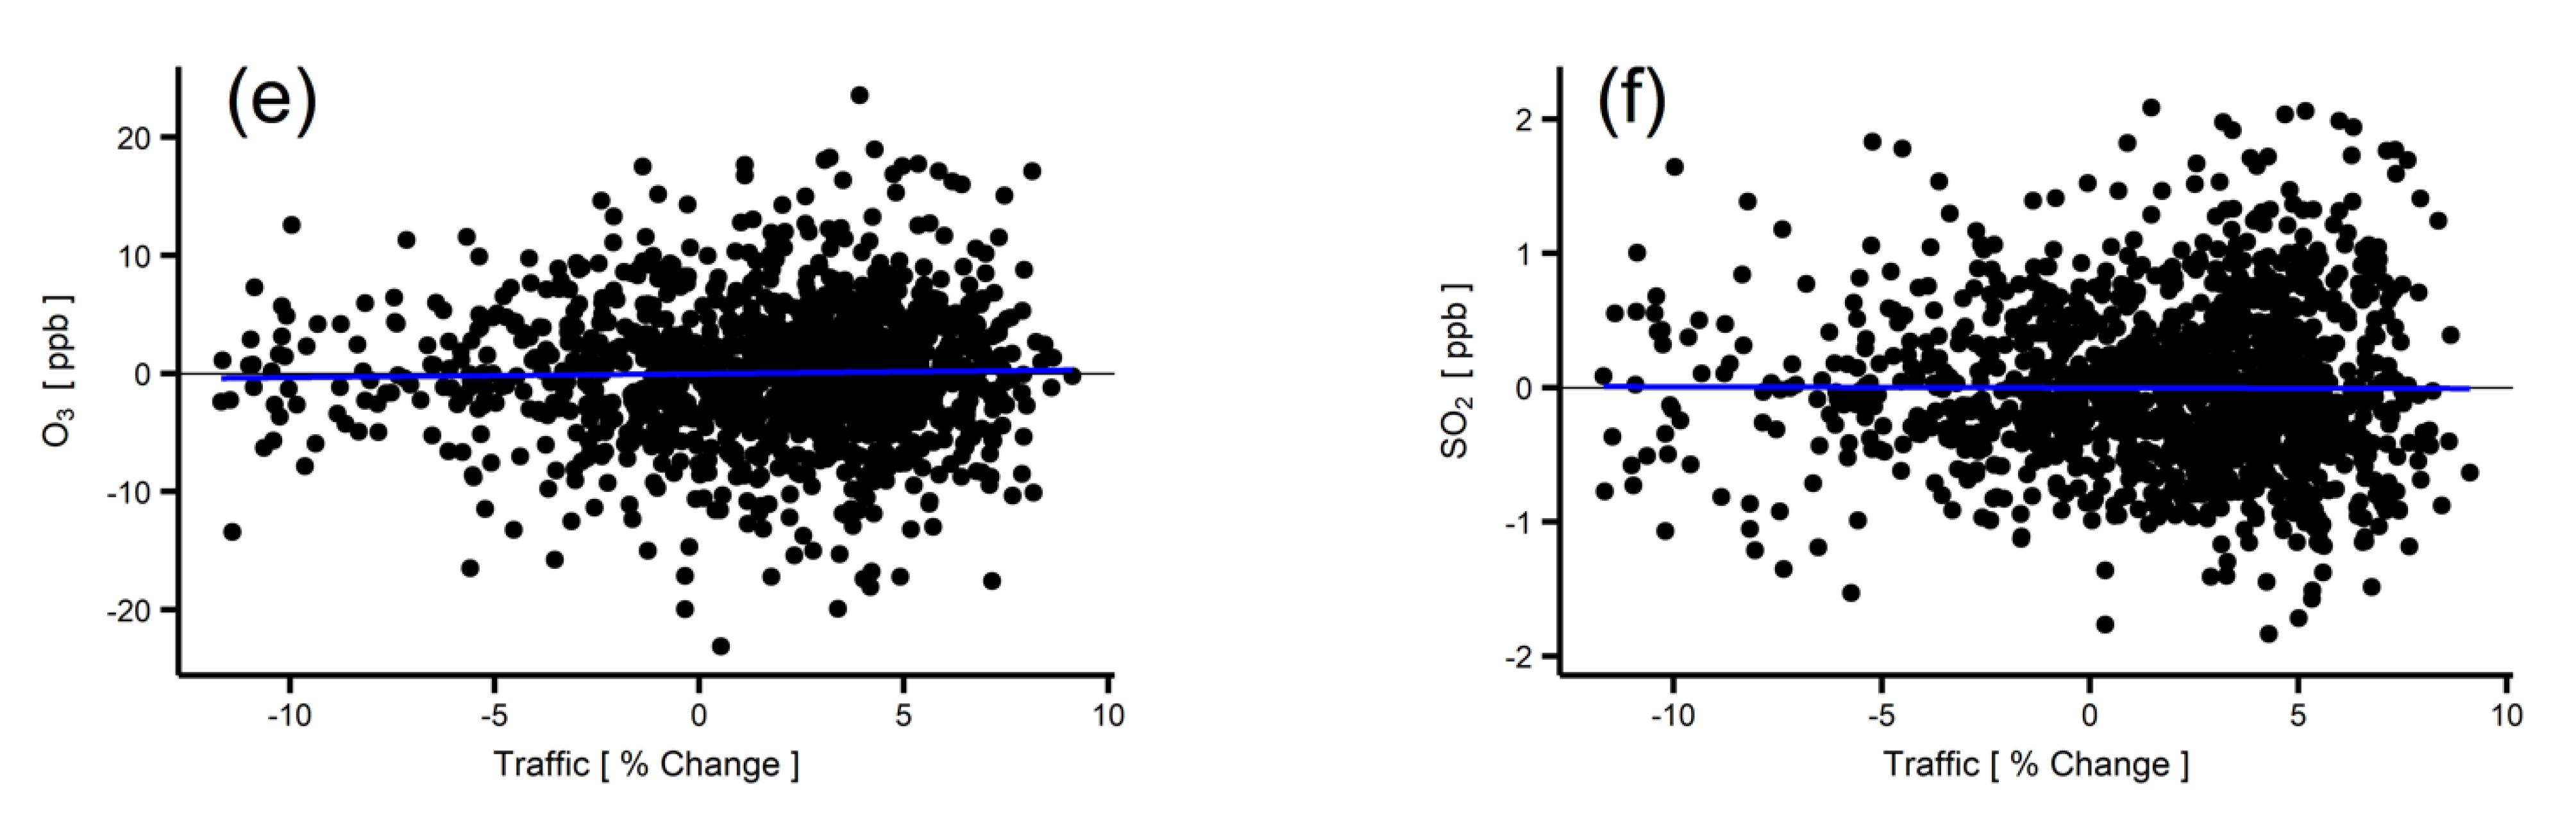
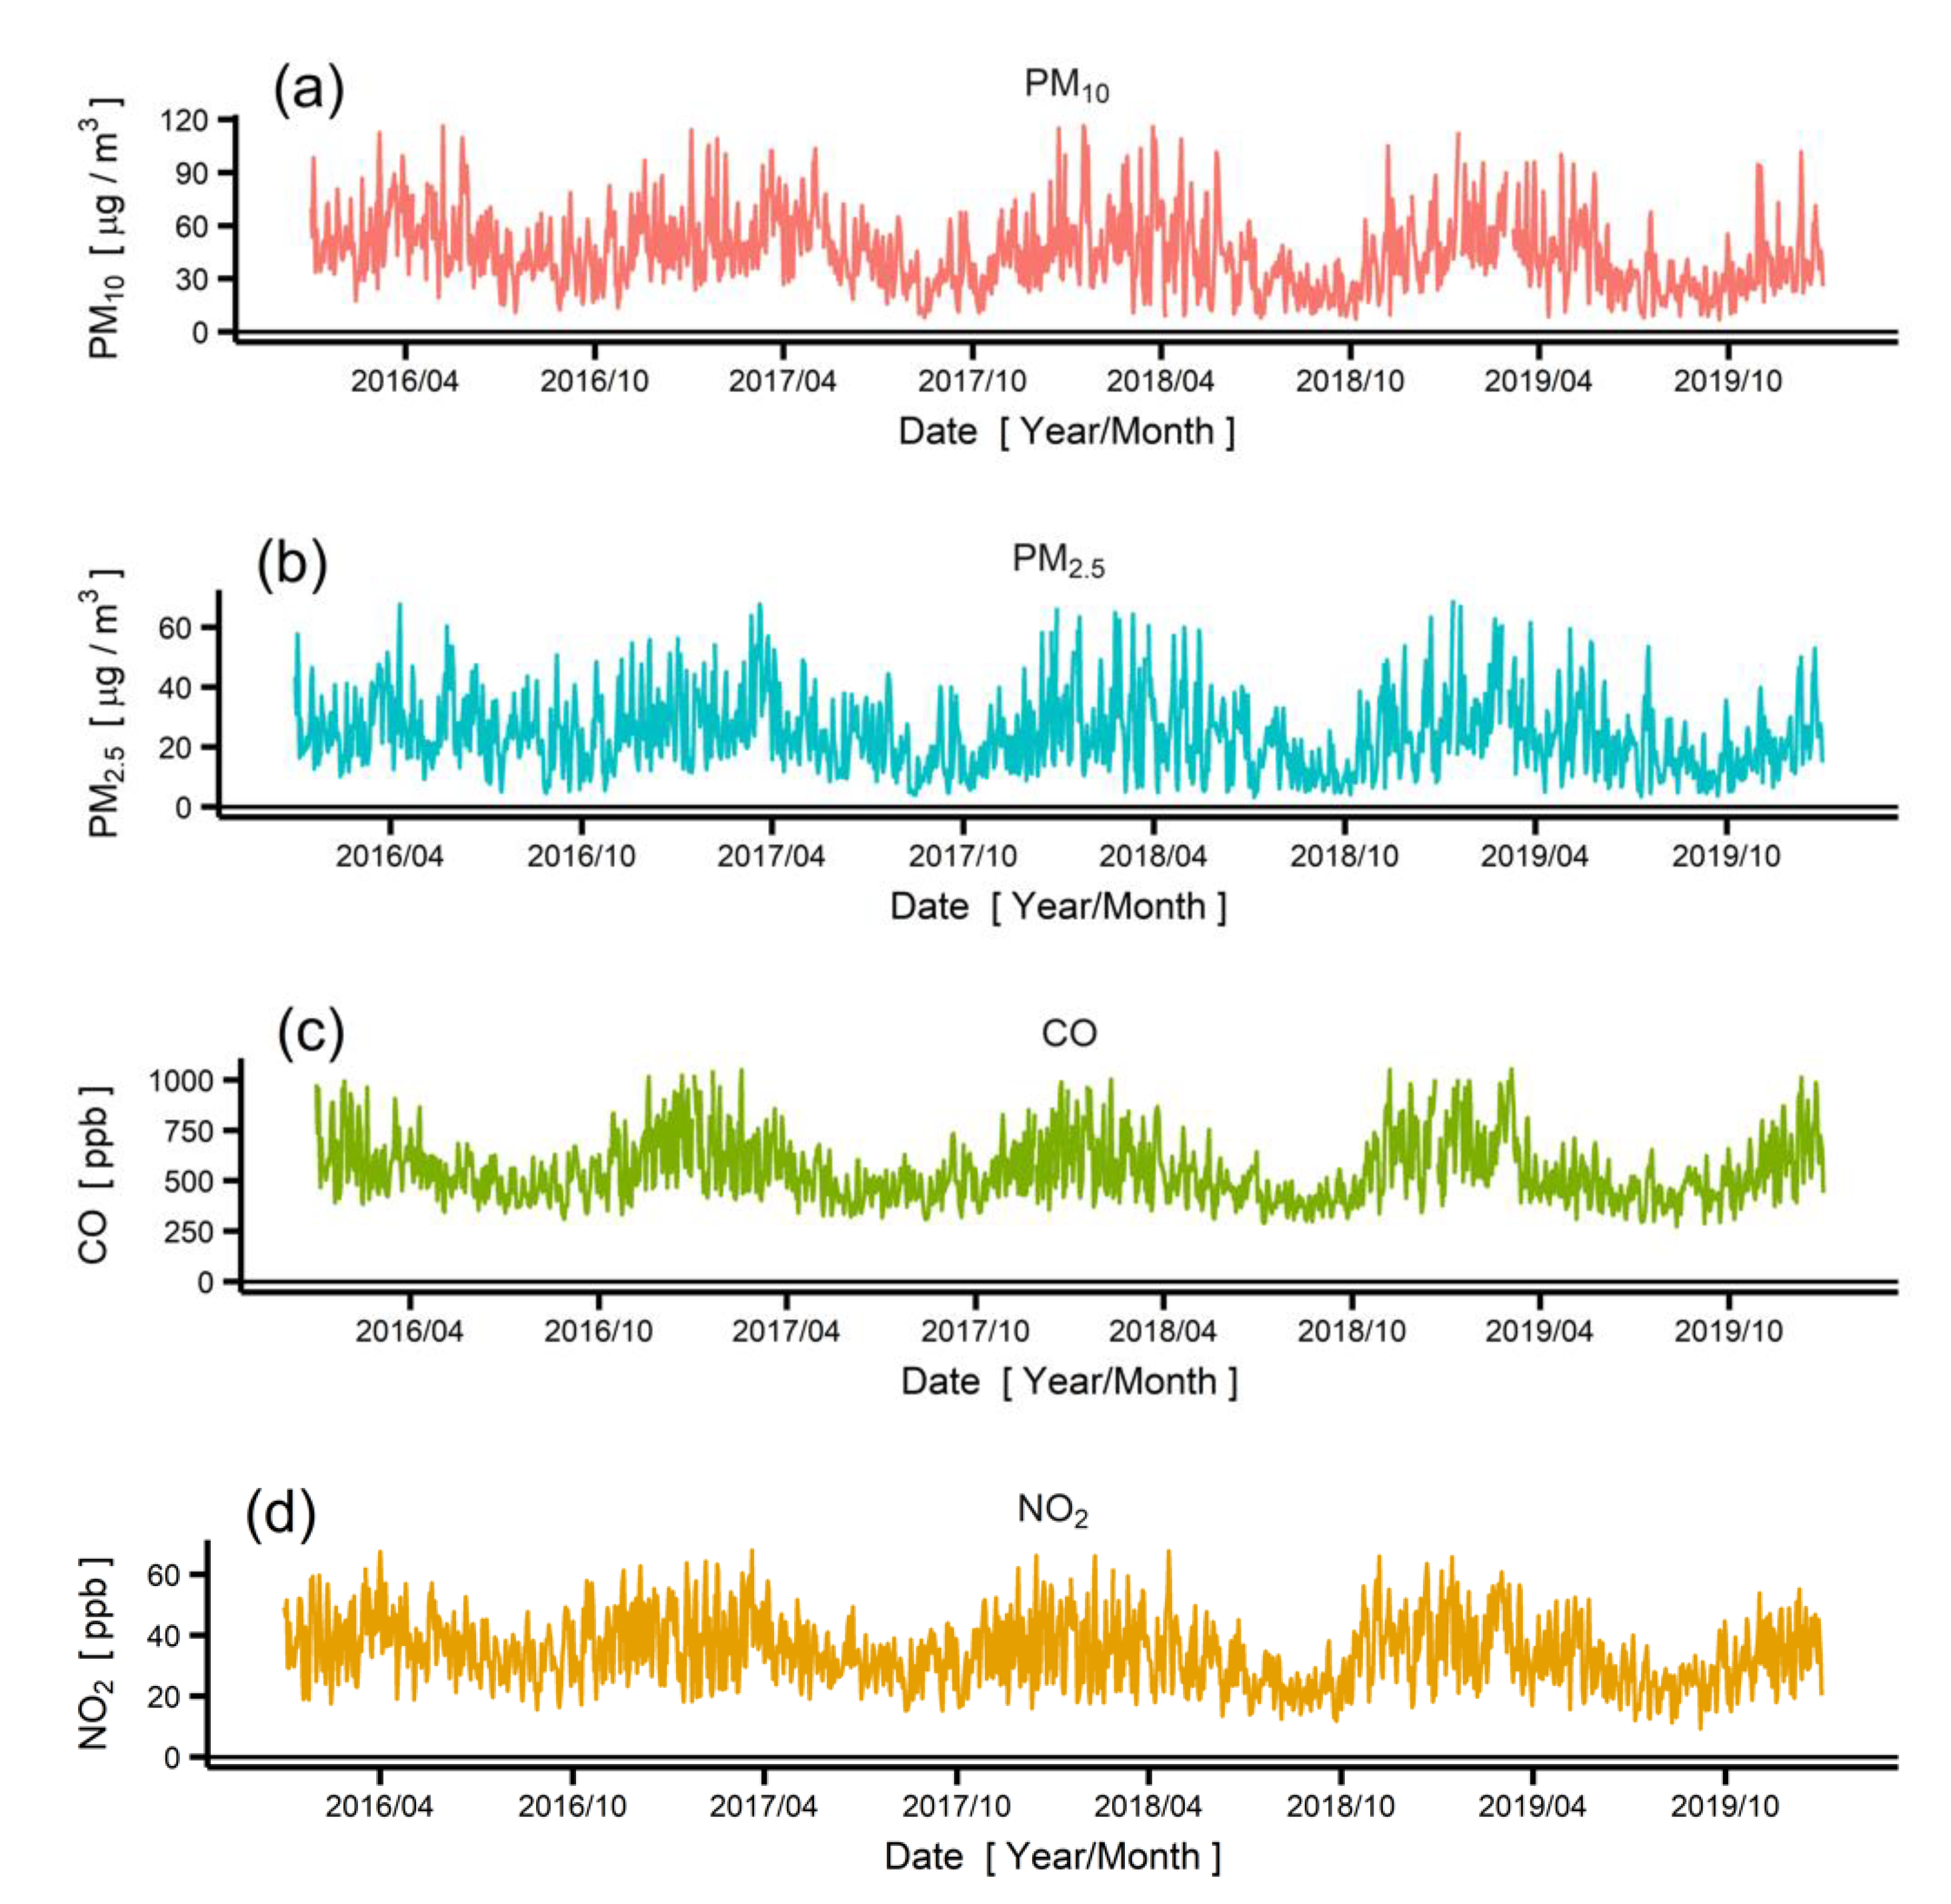
3.2. Association of Air Pollutant Concentrations with Traffic
3.3. COVID-19-Attributable Air Quality Changes via Traffic Reduction
3.4. Projection of Air Pollutant Concentrations in 2020–2021
4. Discussion
5. Conclusions
Supplementary Materials
Author Contributions
Funding
Institutional Review Board Statement
Informed Consent Statement
Data Availability Statement
Conflicts of Interest
References
- World Health Organization. Introduction to COVID-19: Methods for Detection, Prevention, Response and Control. Available online: https://openwho.org/courses/introduction-to-ncov (accessed on 28 September 2021).
- Ali, I.; Alharbi, O.M.L. COVID-19: Disease, Management, Treatment, and Social Impact. Sci. Total Environ. 2020, 728, 138861. [Google Scholar] [CrossRef] [PubMed]
- World Health Organization. WHO, Dirs. General’s Opening Remarks at the Media Briefing on COVID-19. Available online: https://www.who.int/director-general/speeches/detail/who-director-general-s-opening-remarks-at-the-media-briefing-on-covid-19---11-march-2020 (accessed on 28 September 2021).
- World Health Organization. Weekly Epidemiological Update on COVID-19 −29 June 2021. Available online: https://www.who.int/publications/m/item/weekly-epidemiological-update-on-covid-19---29-june-2021 (accessed on 28 September 2021).
- Liu, F.; Wang, M.; Zheng, M. Effects of COVID-19 Lockdown on Global Air Quality and Health. Sci. Total Environ. 2021, 755, 142533. [Google Scholar] [CrossRef] [PubMed]
- Srivastava, S.; Kumar, A.; Bauddh, K.; Gautam, A.S.; Kumar, S. 21-Day Lockdown in India Dramatically Reduced Air Pollution Indices in Lucknow and New Delhi, India. Bull. Environ. Contam. Toxicol. 2020, 105, 9–17. [Google Scholar] [CrossRef] [PubMed]
- Venter, Z.S.; Aunan, K.; Chowdhury, S.; Lelieveld, J. COVID-19 Lockdowns Cause Global Air Pollution Declines. Proc. Natl. Acad. Sci. USA 2020, 117, 18984–18990. [Google Scholar] [CrossRef] [PubMed]
- Chen, L.A.; Chien, L.C.; Li, Y.; Lin, G. Nonuniform Impacts of COVID-19 Lockdown on Air Quality Over the United States. Sci. Total Environ. 2020, 745, 141105. [Google Scholar] [CrossRef] [PubMed]
- Xiang, J.; Austin, E.; Gould, T.; Larson, T.; Shirai, J.; Liu, Y.; Marshall, J.; Seto, E. Impacts of the COVID-19 responses on traffic-related air pollution in a Northwestern US city. Sci. Total Environ. 2020, 747, 141325. [Google Scholar] [CrossRef] [PubMed]
- Nakada, L.Y.K.; Urban, R.C. COVID-19 Pandemic: Impacts on the Air Quality During the Partial Lockdown in São Paulo State, Brazil. Sci. Total Environ. 2020, 730, 139087. [Google Scholar] [CrossRef]
- Baldasano, J.M. COVID-19 Lockdown Effects on Air Quality by NO2 in the Cities of Barcelona and Madrid (Spain). Sci. Total Environ. 2020, 741, 140353. [Google Scholar] [CrossRef]
- De Maria, L.; Caputi, A.; Tafuri, S.; Cannone, E.S.S.; Sponselli, S.; Delfino, M.C.; Pipoli, A.; Bruno, V.; Angiuli, L.; Mucci, N.; et al. Health, Transport and the Environment: The Impacts of the COVID-19 Lockdown on Air Pollution. Front. Public Health 2021, 9, 637540. [Google Scholar] [CrossRef]
- Kerimray, A.; Baimatova, N.; Ibragimova, O.P.; Bukenov, B.; Kenessov, B.; Plotitsyn, P.; Karaca, F. Assessing Air Quality Changes in Large Cities During COVID-19 Lockdowns: The Impacts of Traffic-Free Urban Conditions in Almaty, Kazakhstan. Sci. Total Environ. 2020, 730, 139179. [Google Scholar] [CrossRef]
- Mahato, S.; Pal, S.; Ghosh, K.G. Effect of Lockdown Amid COVID-19 Pandemic on Air Quality of the Megacity Delhi, India. Sci. Total Environ. 2020, 730, 139086. [Google Scholar] [CrossRef]
- He, G.; Pan, Y.; Tanaka, T. The Short-Term Impacts of COVID-19 Lockdown on Urban Air Pollution in China. Nat. Sustain. 2020, 3, 1005–1011. [Google Scholar] [CrossRef]
- Li, L.; Li, Q.; Huang, L.; Wang, Q.; Zhu, A.; Xu, J.; Liu, Z.; Li, H.; Shi, L.; Li, R.; et al. Air Quality Changes During the COVID-19 Lockdown Over the Yangtze River Delta Region: An Insight Into the Impact of Human Activity Pattern Changes on Air Pollution Variation. Sci. Total Environ. 2020, 732, 139282. [Google Scholar] [CrossRef]
- Wu, C.-L.; Wang, H.-W.; Cai, W.-J.; He, H.-D.; Ni, A.N.; Peng, Z.R. Impact of the COVID-19 lockdown on roadside traffic-related air pollution in Shanghai, China. Build Environ. 2021, 194, 107718. [Google Scholar] [CrossRef]
- Ju, M.J.; Oh, J.; Choi, Y.H. Changes in Air Pollution Levels After COVID-19 Outbreak in Korea. Sci. Total Environ. 2021, 750, 141521. [Google Scholar] [CrossRef]
- Kang, Y.H.; You, S.; Bae, M.; Kim, E.; Son, K.; Bae, C.; Kim, Y.; Kim, B.-U.; Kim, H.C.; Kim, S. The impacts of COVID-19, meteorology, and emission control policies on PM2.5 drops in Northeast Asia. Sci. Rep. 2020, 10, 22112. [Google Scholar] [CrossRef]
- Han, B.S.; Park, K.; Kwak, K.H.; Park, S.B.; Jin, H.G.; Moon, S.; Kim, J.W.; Baik, J.J. Air Quality Change in Seoul, South Korea Under COVID-19 Social Distancing: Focusing on PM2.5. Int. J. Environ. Res. Public Health 2020, 17, 6208. [Google Scholar] [CrossRef]
- Seo, J.H.; Jeon, H.W.; Sung, U.J.; Sohn, J.R. Impact of the COVID-19 Outbreak on Air Quality in Korea. Atmosphere 2020, 11, 1137. [Google Scholar] [CrossRef]
- Google LLC. Google COVID-19 Community Mobility Reports. Available online: https://www.google.com/covid19/mobility/ (accessed on 1 September 2021).
- Wood, S.N. mgcv: GAMs and generalized ridge regression for R. R News 2001, 1, 20–25. [Google Scholar]
- Wood, S.N. Generalized Additive Models: An Introduction with R, 2nd ed.; CRC Press: Boca Raton, FL, USA, 2017. [Google Scholar]
- Gasparrini, A.; Guo, Y.; Hashizume, M.; Kinney, P.L.; Petkova, E.P.; Lavigne, E.; Zanobetti, A.; Schwartz, J.D.; Tobias, A.; Leone, M.; et al. Temporal Variation in Heat-Mortality Associations: A Multicountry Study. Environ. Health Perspect. 2015, 123, 1200–1207. [Google Scholar] [CrossRef]
- Gasparrini, A.; Guo, Y.; Hashizume, M.; Lavigne, E.; Tobias, A.; Zanobetti, A.; Schwartz, J.D.; Leone, M.; Michelozzi, P.; Kan, H.; et al. Changes in Susceptibility to Heat During the Summer: A Multicountry Analysis. Am. J. Epidemiol. 2016, 183, 1027–1036. [Google Scholar] [CrossRef] [Green Version]
- Oudin Åström, D.; Åström, C.; Rekker, K.; Indermitte, E.; Orru, H. High Summer Temperatures and Mortality in Estonia. PLoS ONE 2016, 11, e0155045. [Google Scholar] [CrossRef]
- Ma, C.; Yang, J.; Nakayama, S.F.; Iwai-Shimada, M.; Jung, C.R.; Sun, X.L.; Honda, Y. Cold Spells and Cause-Specific Mortality in 47 Japanese Prefectures: A Systematic Evaluation. Environ. Health Perspect. 2021, 129, 67001. [Google Scholar] [CrossRef]


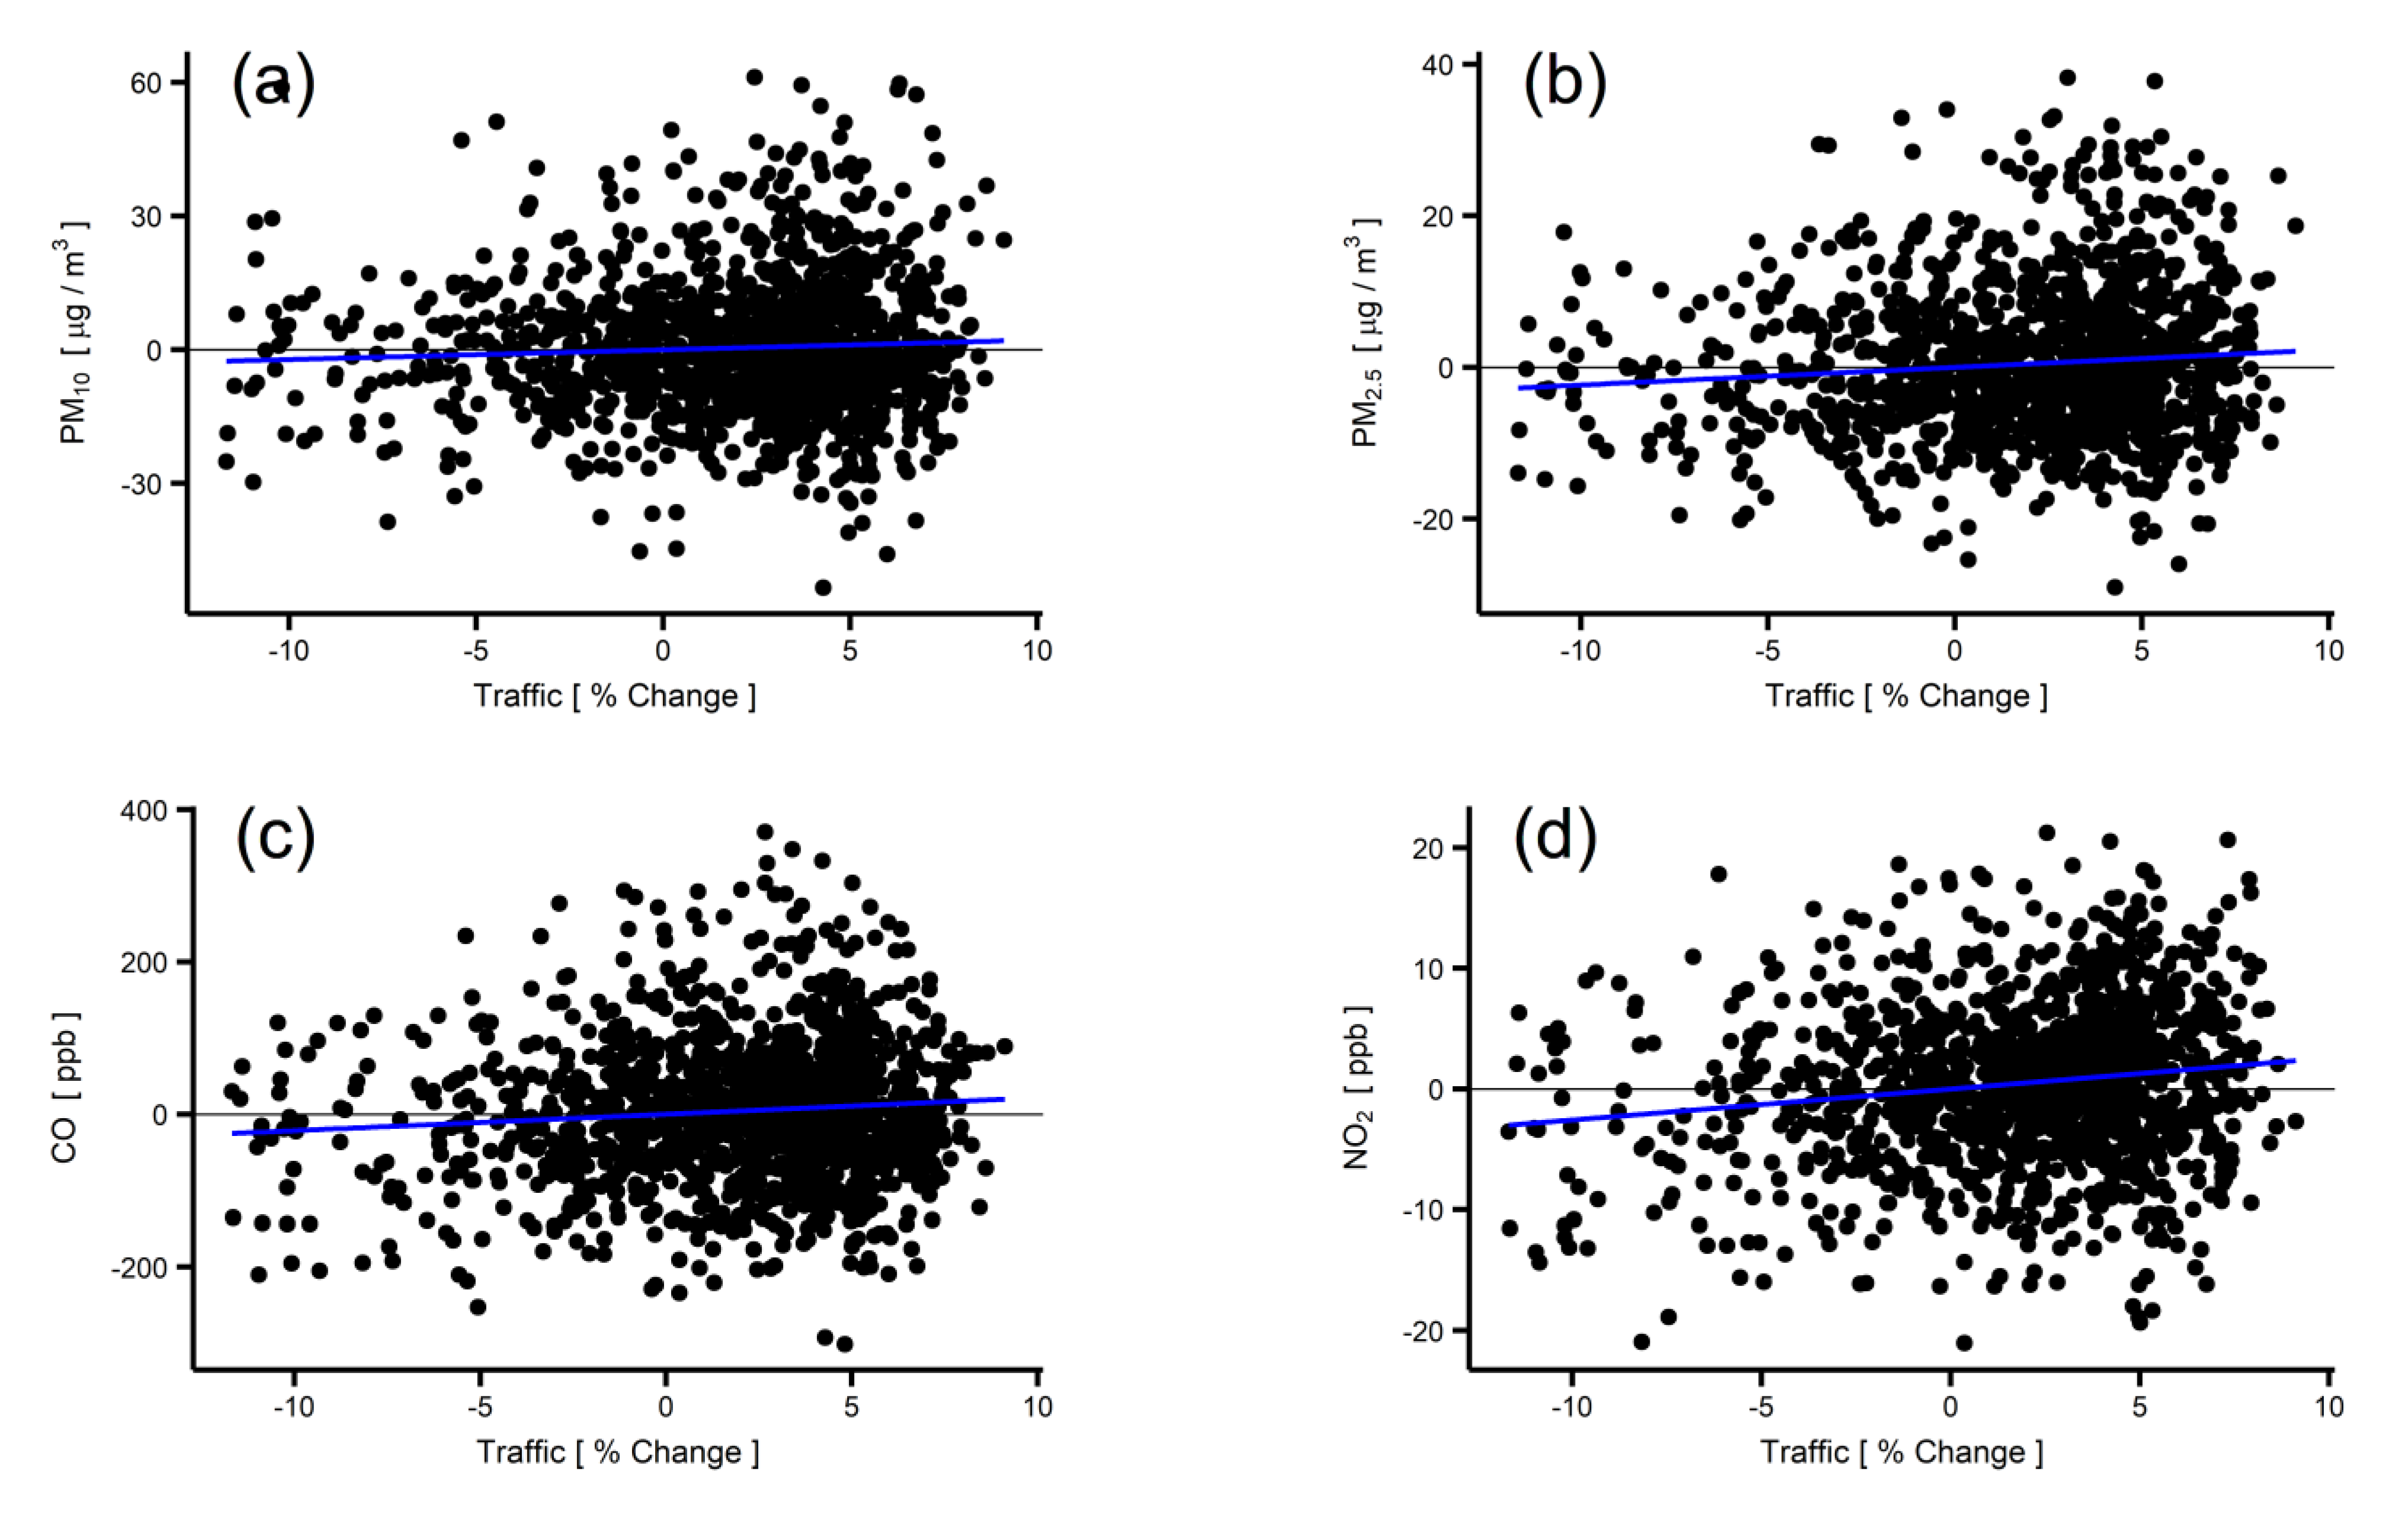
| Pollutant | Coefficient | Mean Concentration | Ratio |
|---|---|---|---|
| PM10 | 0.219 µg/m3/% | 45.5 µg/m3 | 0.48% |
| PM2.5 | 0.233 µg/m3/% | 24.9 µg/m3 | 0.94% |
| CO | 2.161 ppb/% | 553.8 ppb | 0.39% |
| NO2 | 0.257 ppb/% | 34.6 ppb | 0.74% |
| O3 | 0.033 ppb/% | 21.5 ppb | 0.16% |
| SO2 | −0.0007 ppb/% | 4.6 ppb | −0.01% |
| Pollutant | Concentration Change Per COVID-19 Case | Mean Concentration | COVID-19-Attributable Air Quality | |
|---|---|---|---|---|
| CAC | CACF | |||
| PM10 | −0.00094 μg/m3/case | 40.4 μg/m3 | −0.27 μg/m3 | −0.67% |
| PM2.5 | −0.00100 μg/m3/case | 21.8 μg/m3 | −0.29 μg/m3 | −1.33% |
| CO | −0.00931 ppb/case | 501.7 ppb | −2.68 ppb | −0.54% |
| NO2 | −0.00111 ppb/case | 26.6 ppb | −0.32 ppb | −1.20% |
| O3 | −0.00014 ppb/case | 25.3 ppb | −0.04 ppb | −0.16% |
| SO2 | 0.000003 ppb/case | 3.2 ppb | 0.00 ppb | 0.02% |
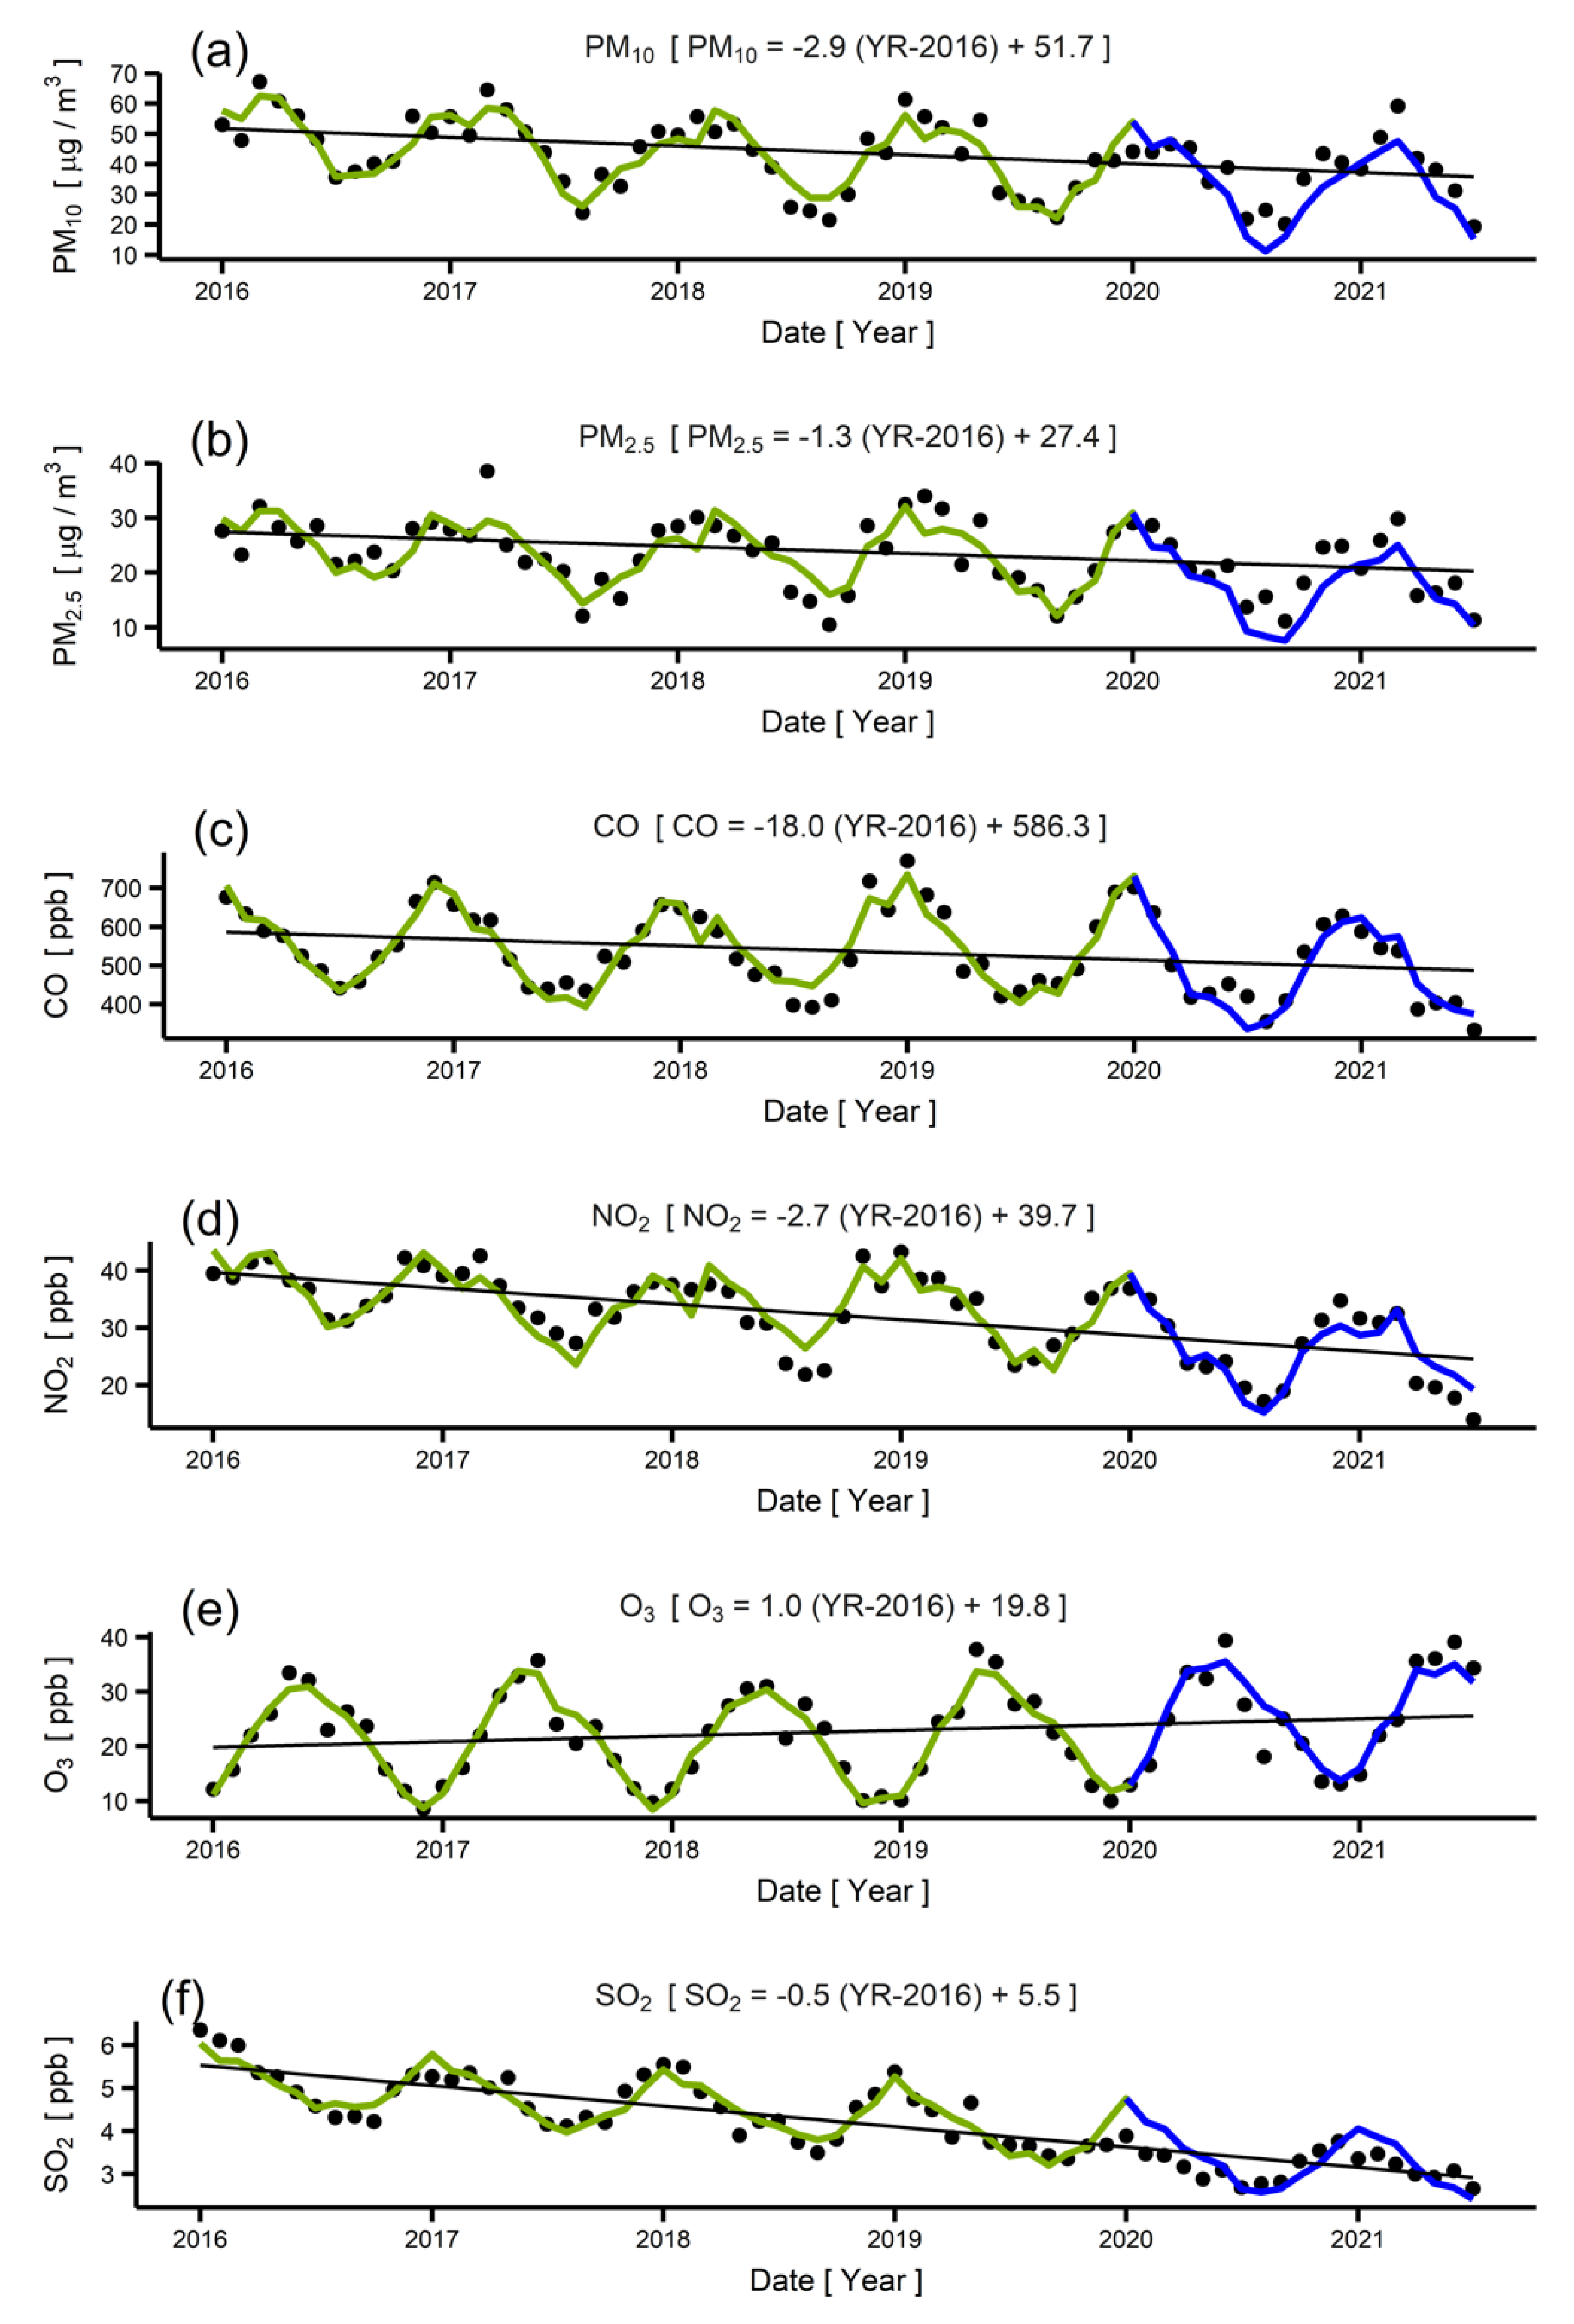
| Type | Pollutant (Unit) | 2016 | 2017 | 2018 | 2019 | 2020 | 2021 |
|---|---|---|---|---|---|---|---|
| Measured | PM10 (µg/m3) | 49.4 | 45.5 | 40.5 | 41.0 | 37.0 | 41.8 |
| PM2.5 (µg/m3) | 25.9 | 23.2 | 22.9 | 23.4 | 21.1 | 20.8 | |
| CO (ppb) | 569.8 | 537.8 | 534.1 | 551.6 | 510.9 | 474.6 | |
| NO2 (ppb) | 37.7 | 35.0 | 32.6 | 32.9 | 27.2 | 25.2 | |
| O3 (ppb) | 21.0 | 21.3 | 20.8 | 22.6 | 23.1 | 28.8 | |
| SO2 (ppb) | 5.2 | 4.8 | 4.4 | 4.0 | 3.3 | 3.2 | |
| Modeled (2016–2019) and predicted (2020–2021) | PM10 (µg/m3) | 49.2 | 44.3 | 42.6 | 39.9 | 33.5 | 36.5 |
| PM2.5 (µg/m3) | 25.7 | 22.9 | 23.9 | 22.4 | 17.8 | 19.1 | |
| CO (ppb) | 569.9 | 526.3 | 553.9 | 539.4 | 493.4 | 496.2 | |
| NO2 (ppb) | 38.0 | 33.3 | 34.6 | 32.1 | 26.3 | 26.6 | |
| O3 (ppb) | 20.9 | 21.6 | 20.4 | 22.7 | 24.5 | 27.8 | |
| SO2 (ppb) | 5.1 | 4.8 | 4.5 | 4.0 | 3.4 | 3.3 | |
| Deviation | PM10 (µg/m3) | −0.4% | −2.7% | 5.2% | −2.7% | −9.5% | −12.7% |
| PM2.5 (µg/m3) | −0.8% | −1.3% | 4.6% | −4.4% | −16.0% | −7.8% | |
| CO (ppb) | 0.0% | −2.1% | 3.7% | −2.2% | −3.4% | 4.5% | |
| NO2 (ppb) | 0.9% | −5.0% | 6.3% | −2.6% | −3.2% | 5.7% | |
| O3 (ppb) | −0.6% | 1.7% | −1.9% | 0.3% | 6.3% | −3.3% | |
| SO2 (ppb) | −0.8% | −1.0% | 0.8% | 0.0% | 5.7% | 5.5% |
Publisher’s Note: MDPI stays neutral with regard to jurisdictional claims in published maps and institutional affiliations. |
© 2022 by the authors. Licensee MDPI, Basel, Switzerland. This article is an open access article distributed under the terms and conditions of the Creative Commons Attribution (CC BY) license (https://creativecommons.org/licenses/by/4.0/).
Share and Cite
Hwang, H.; Lee, J.Y. Impacts of COVID-19 on Air Quality through Traffic Reduction. Int. J. Environ. Res. Public Health 2022, 19, 1718. https://doi.org/10.3390/ijerph19031718
Hwang H, Lee JY. Impacts of COVID-19 on Air Quality through Traffic Reduction. International Journal of Environmental Research and Public Health. 2022; 19(3):1718. https://doi.org/10.3390/ijerph19031718
Chicago/Turabian StyleHwang, Hyemin, and Jae Young Lee. 2022. "Impacts of COVID-19 on Air Quality through Traffic Reduction" International Journal of Environmental Research and Public Health 19, no. 3: 1718. https://doi.org/10.3390/ijerph19031718
APA StyleHwang, H., & Lee, J. Y. (2022). Impacts of COVID-19 on Air Quality through Traffic Reduction. International Journal of Environmental Research and Public Health, 19(3), 1718. https://doi.org/10.3390/ijerph19031718