
Forecasting COVID-19 Case Trends Using SARIMA Models during the Third Wave of COVID-19 in Malaysia

 , , ,
, , ,
Abstract
:1. Introduction
2. Materials and Methods
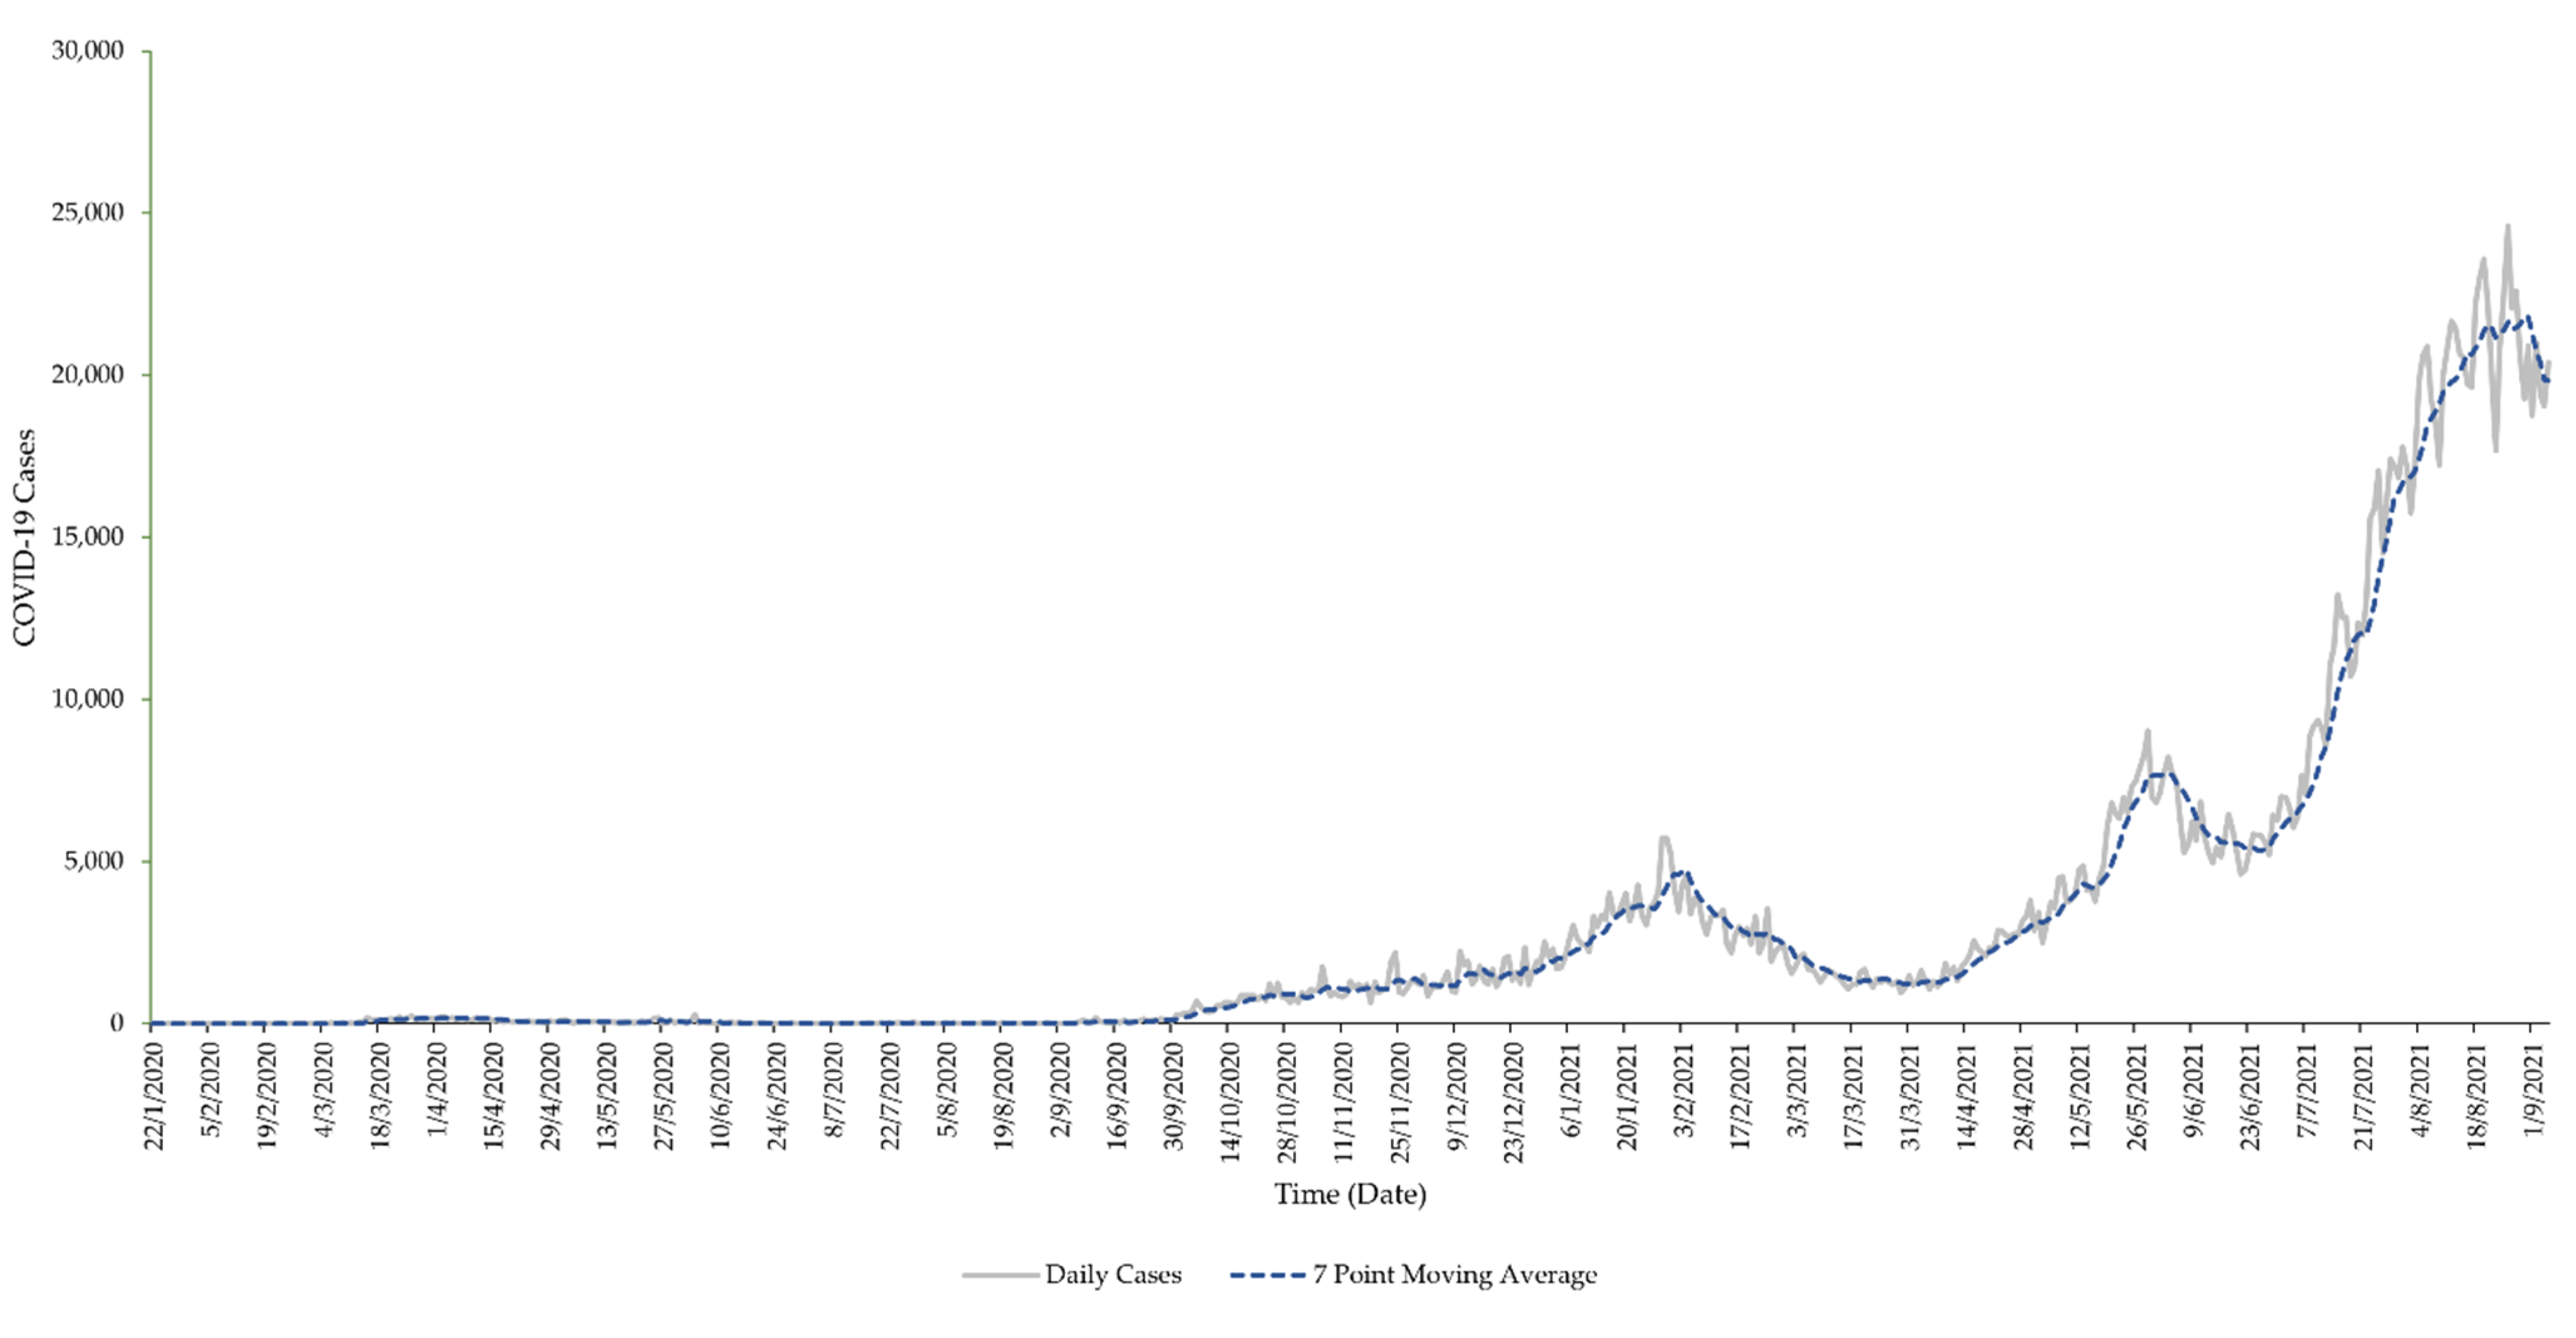
2.1. Data Source
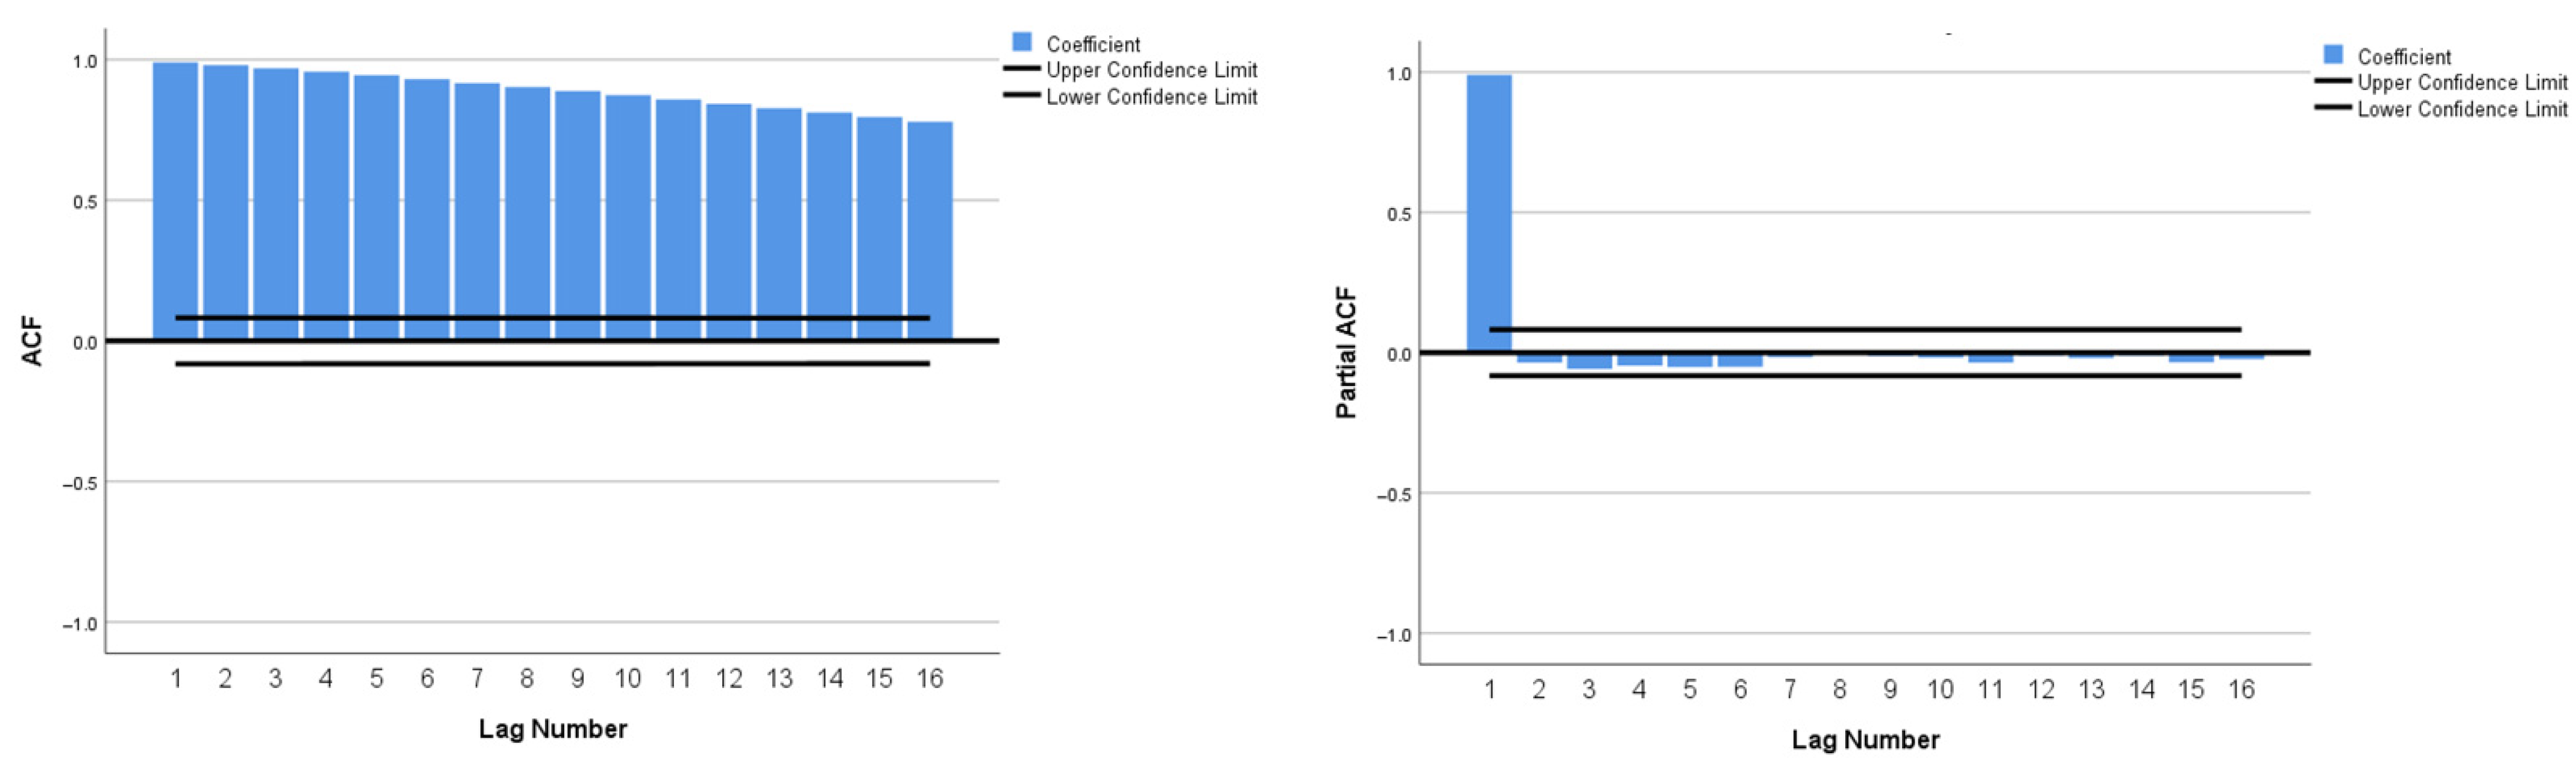
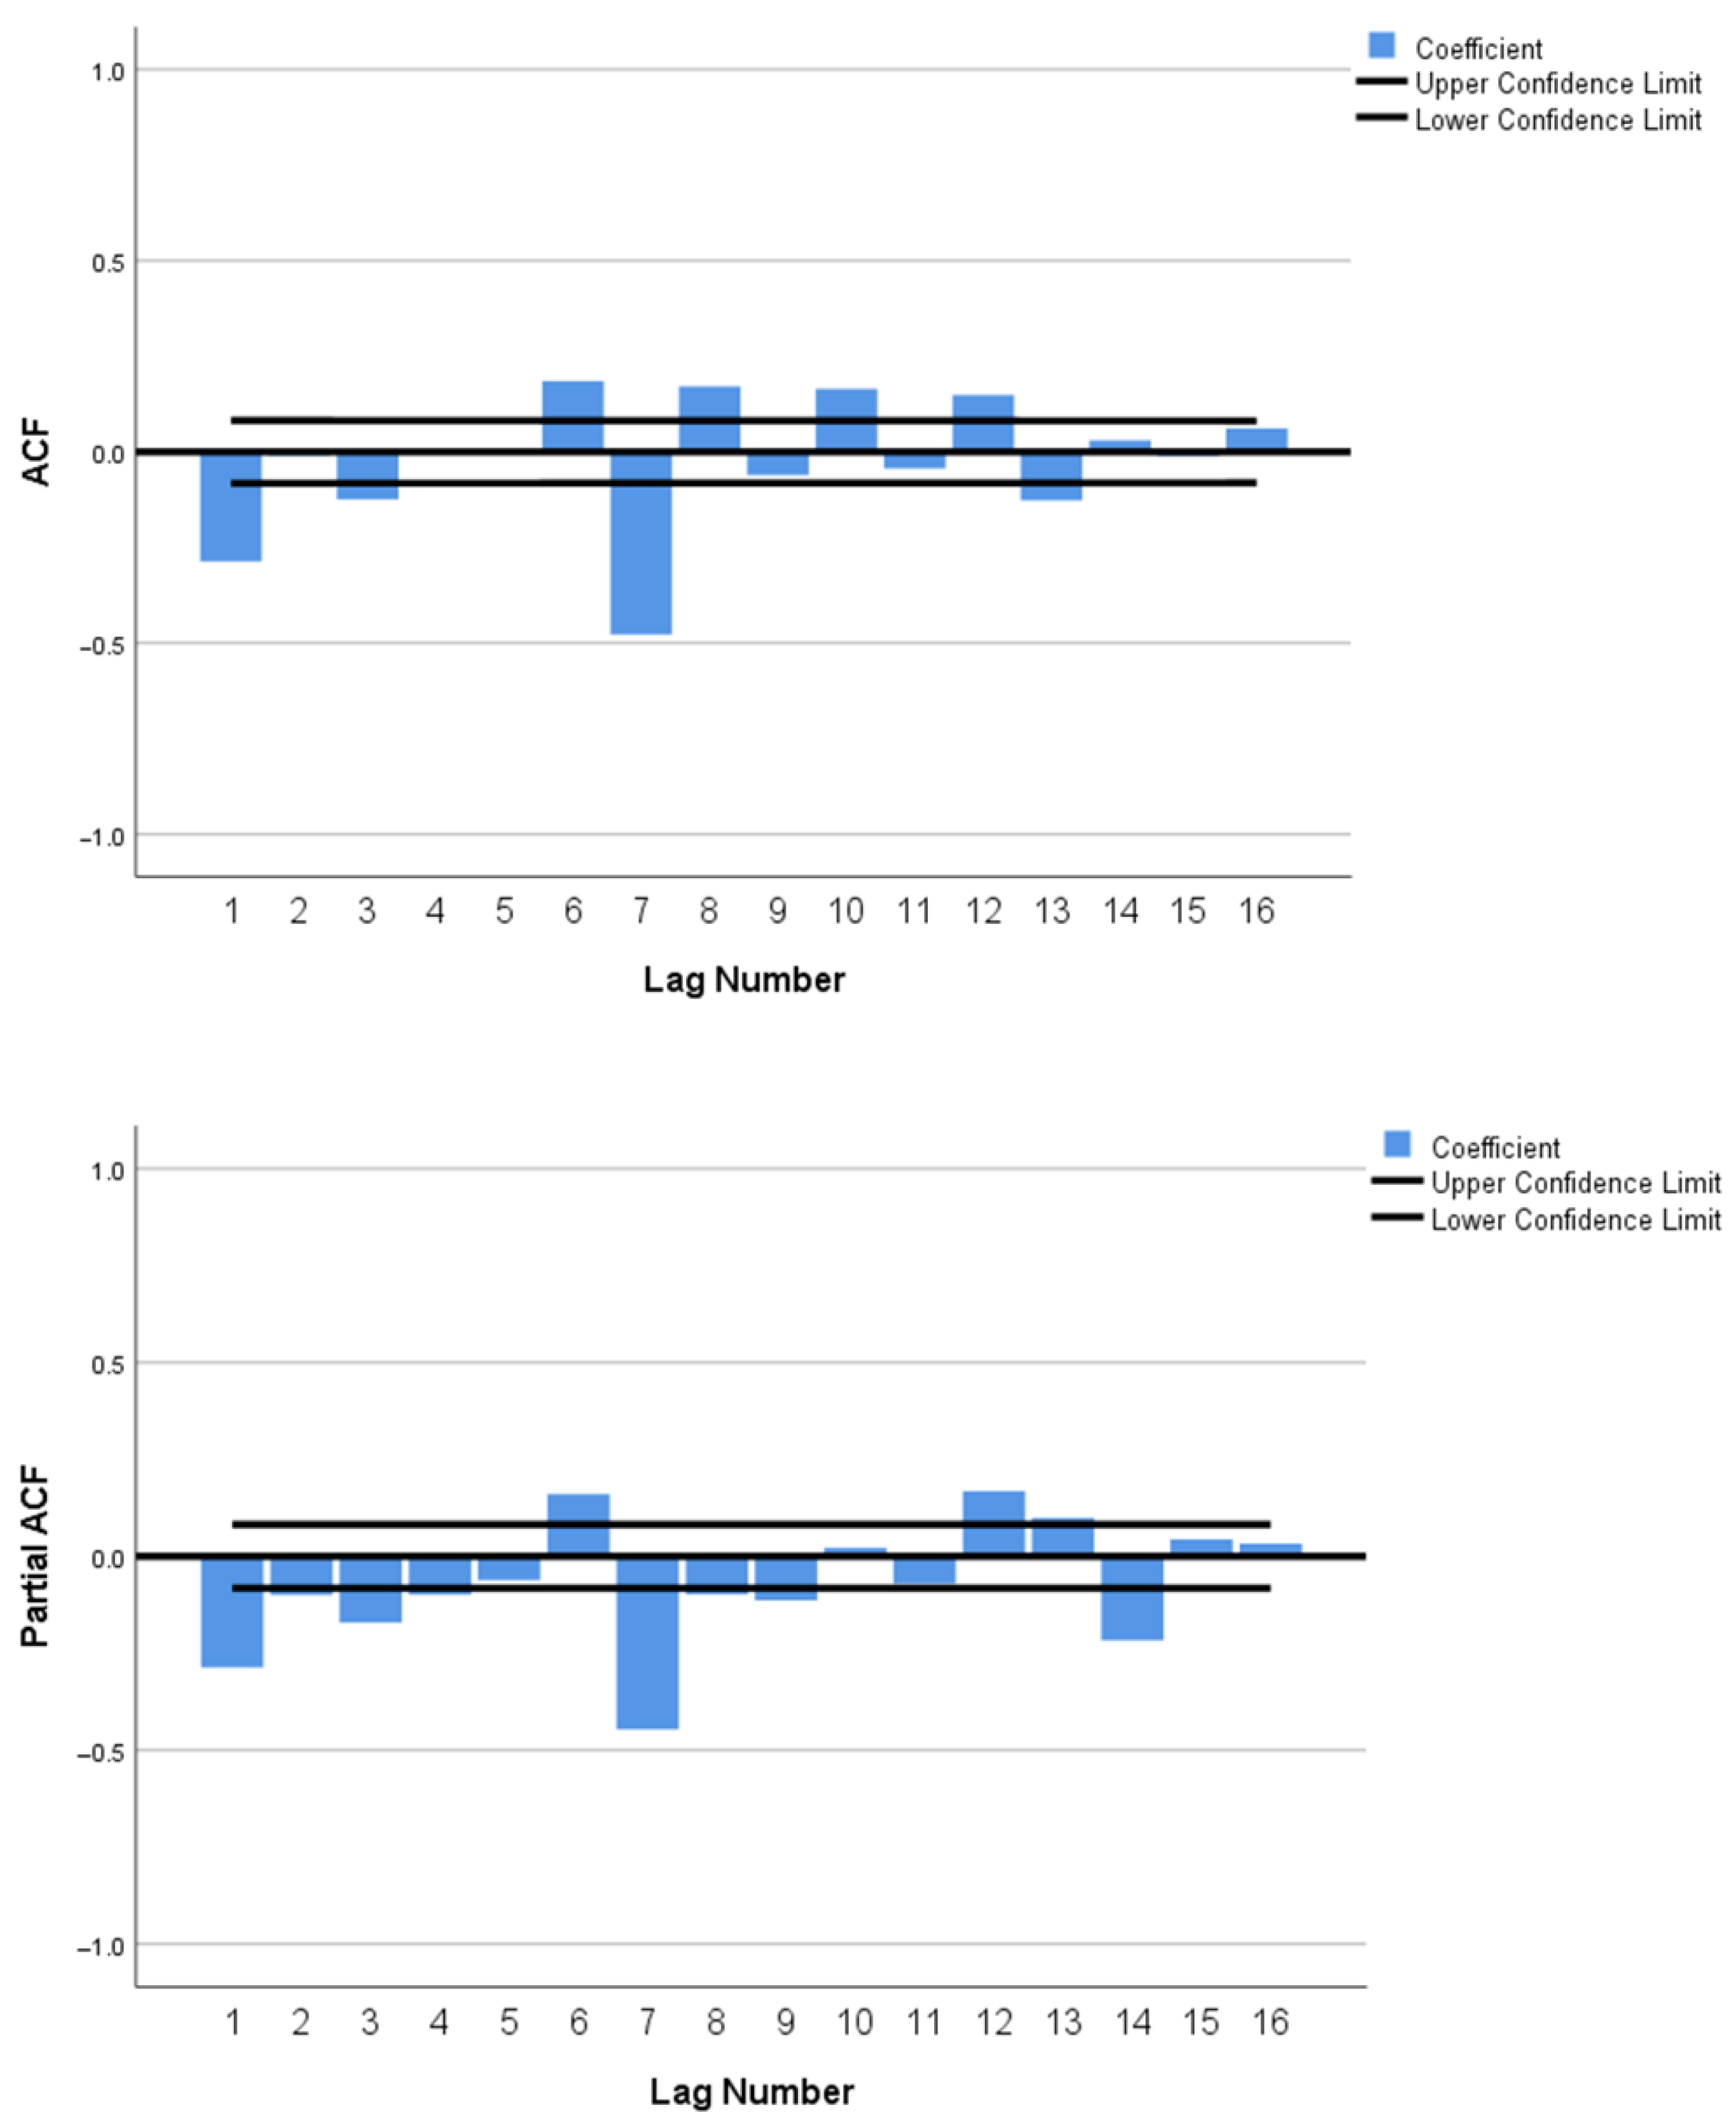
2.2. Data Analysis
2.3. Model Development
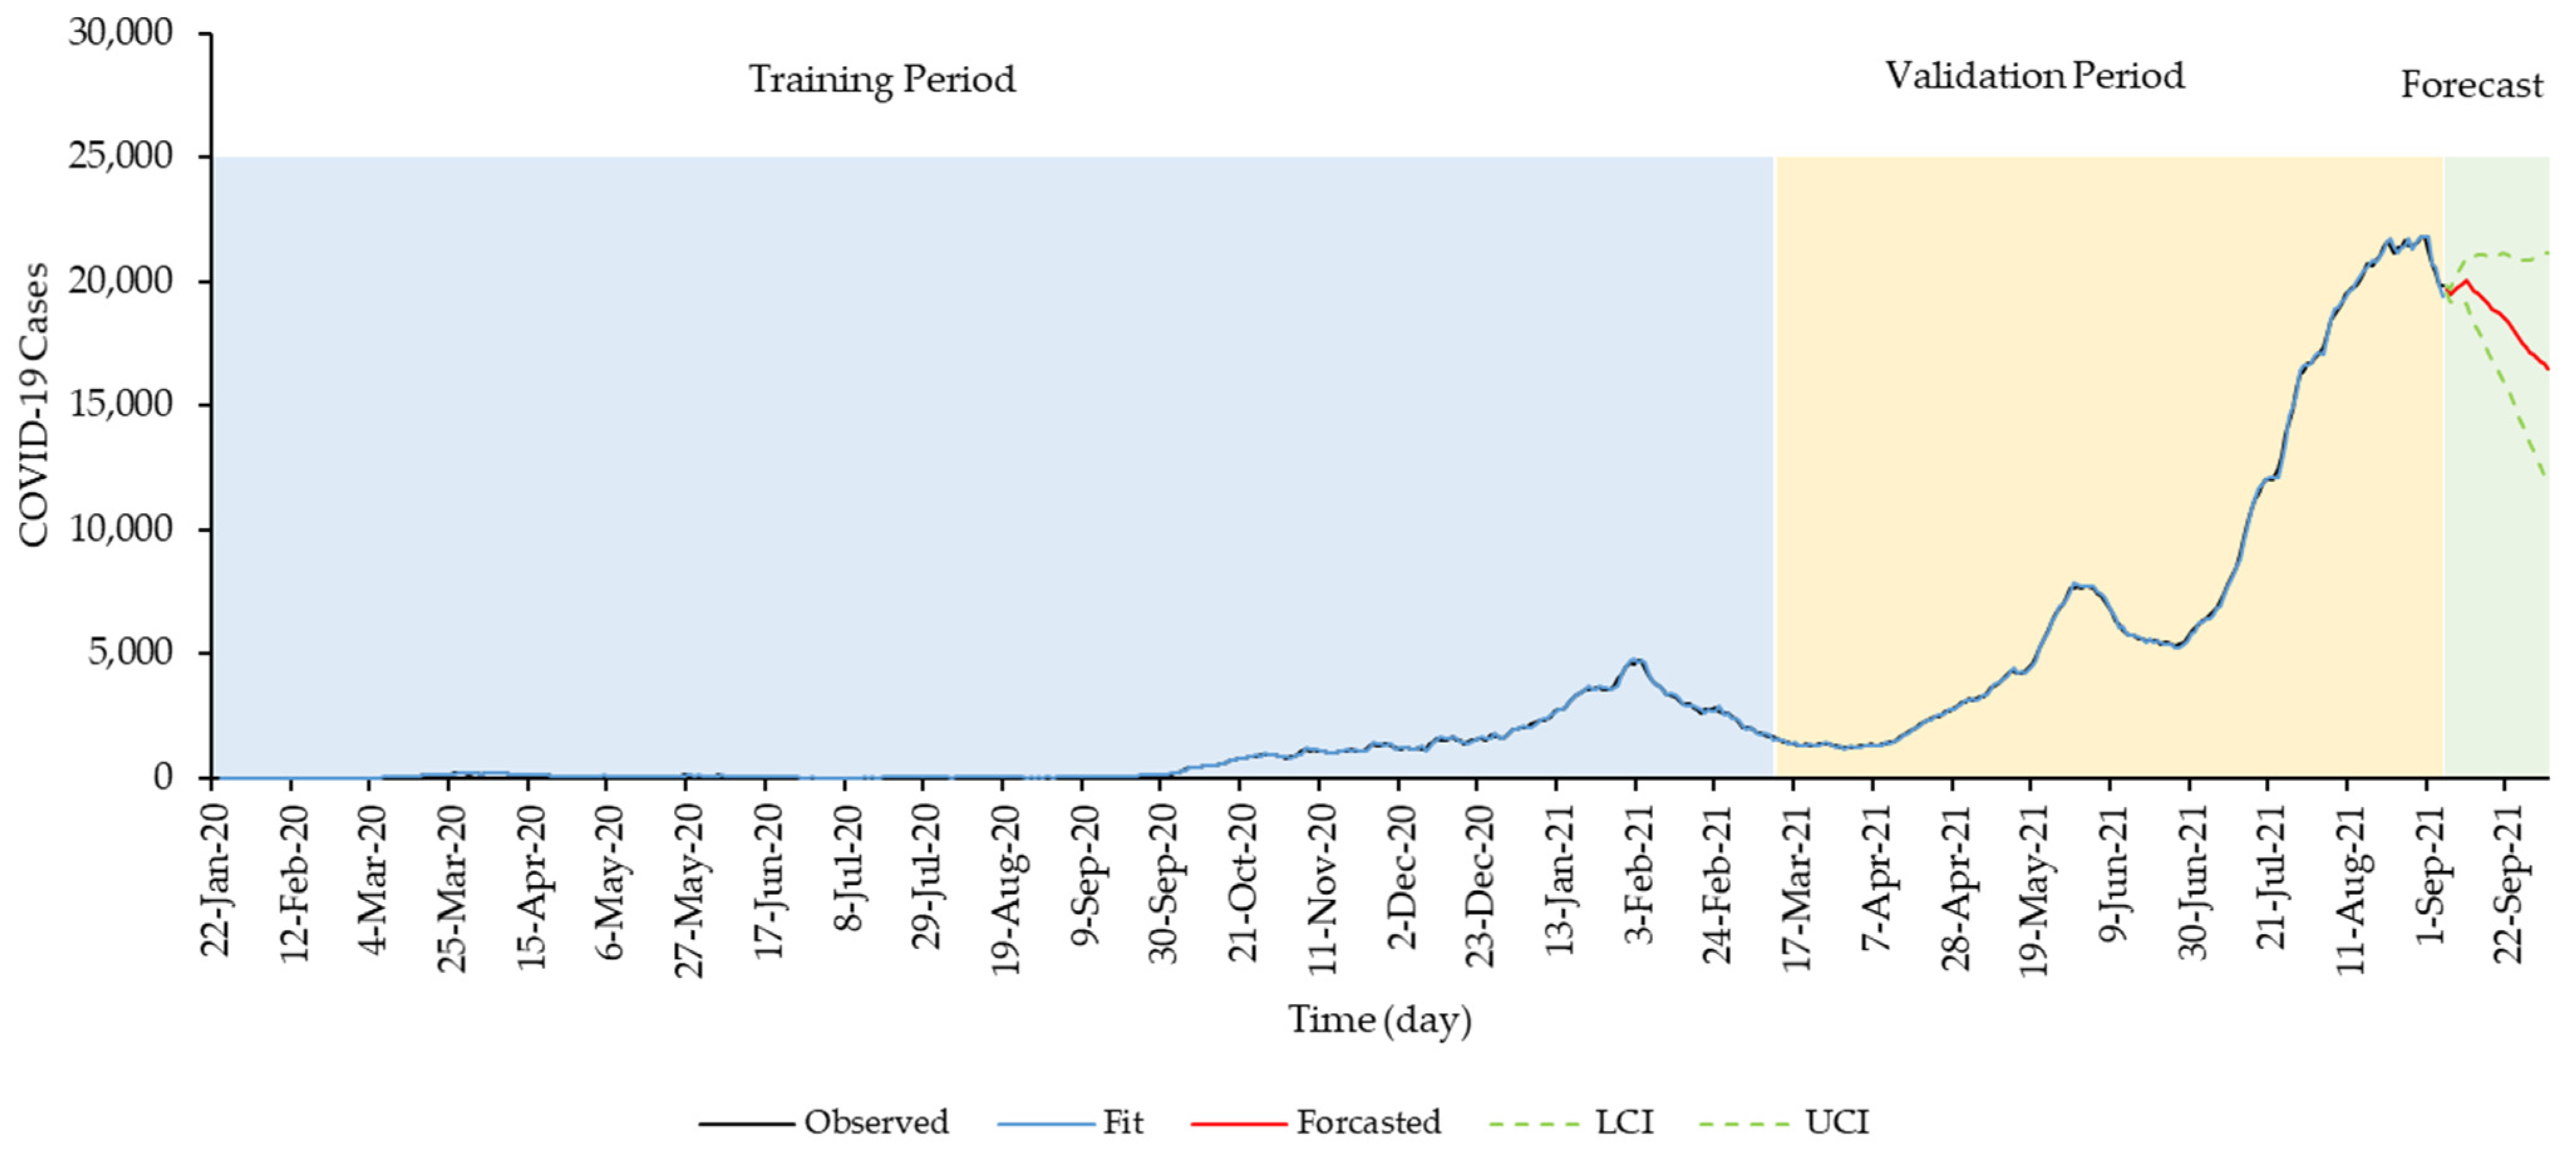
2.4. Model Training, Validation and Forecast Generation
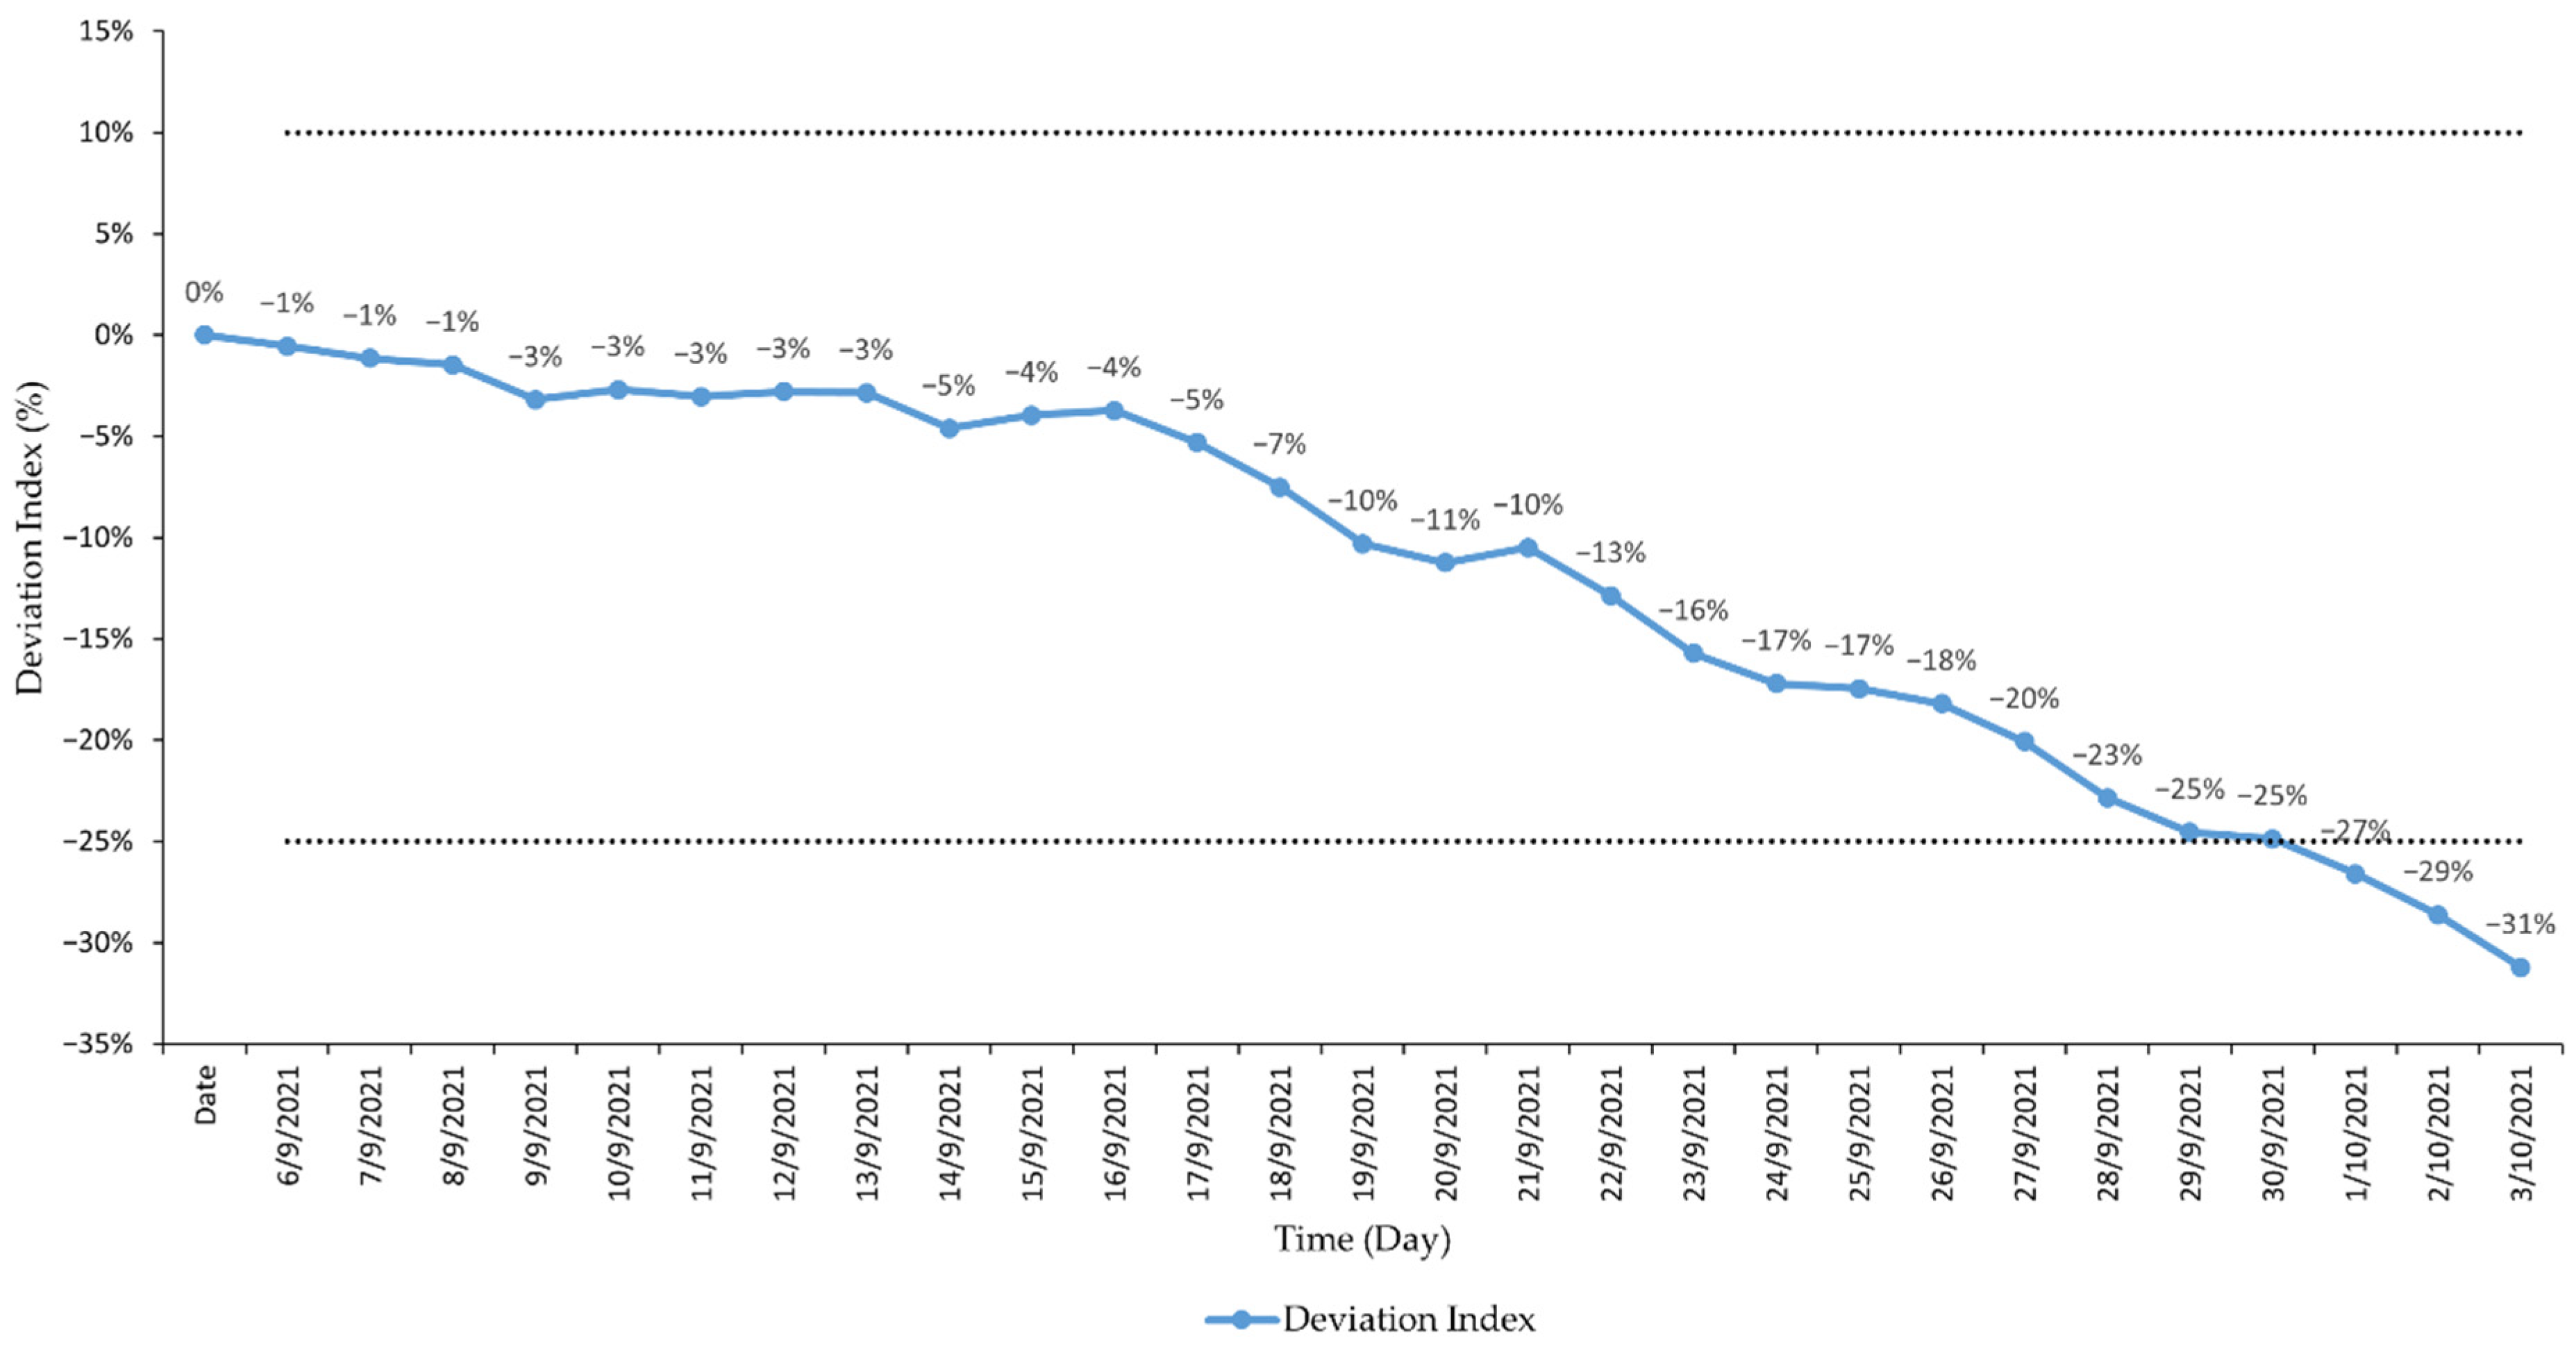
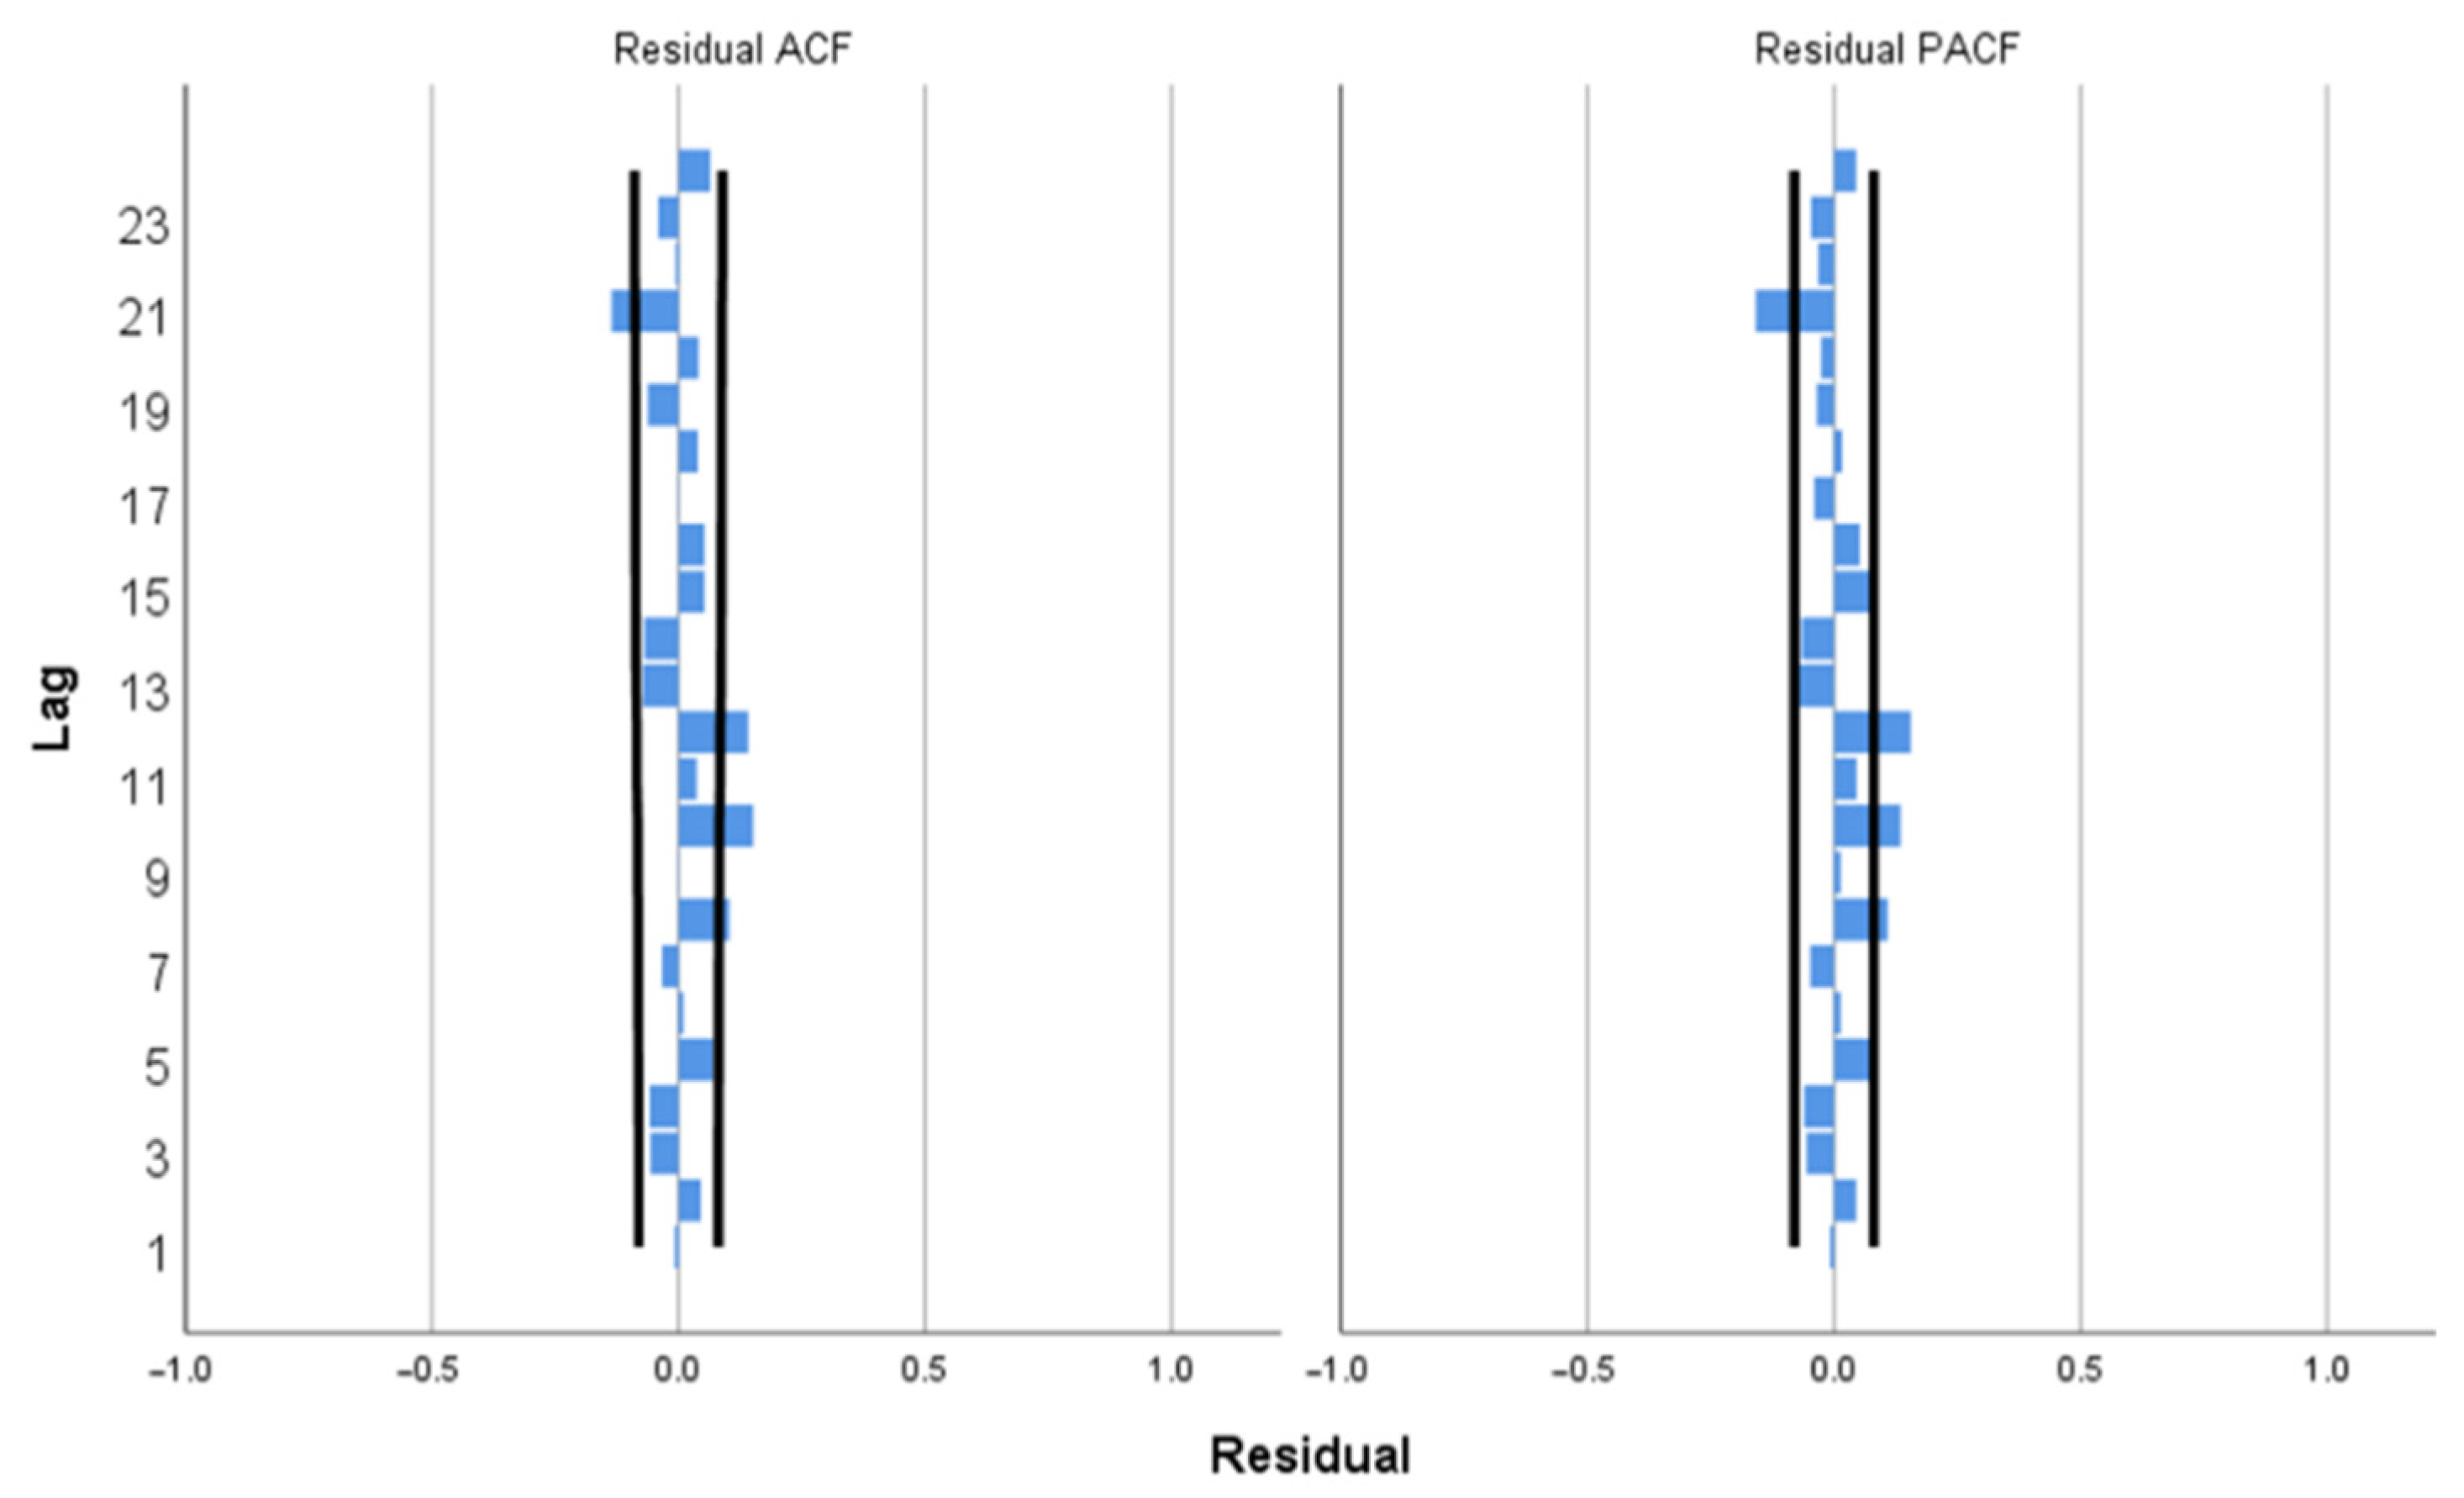
3. Results
4. Discussion
5. Conclusions
Author Contributions
Funding
Institutional Review Board Statement
Informed Consent Statement
Data Availability Statement
Acknowledgments
Conflicts of Interest
Appendix A

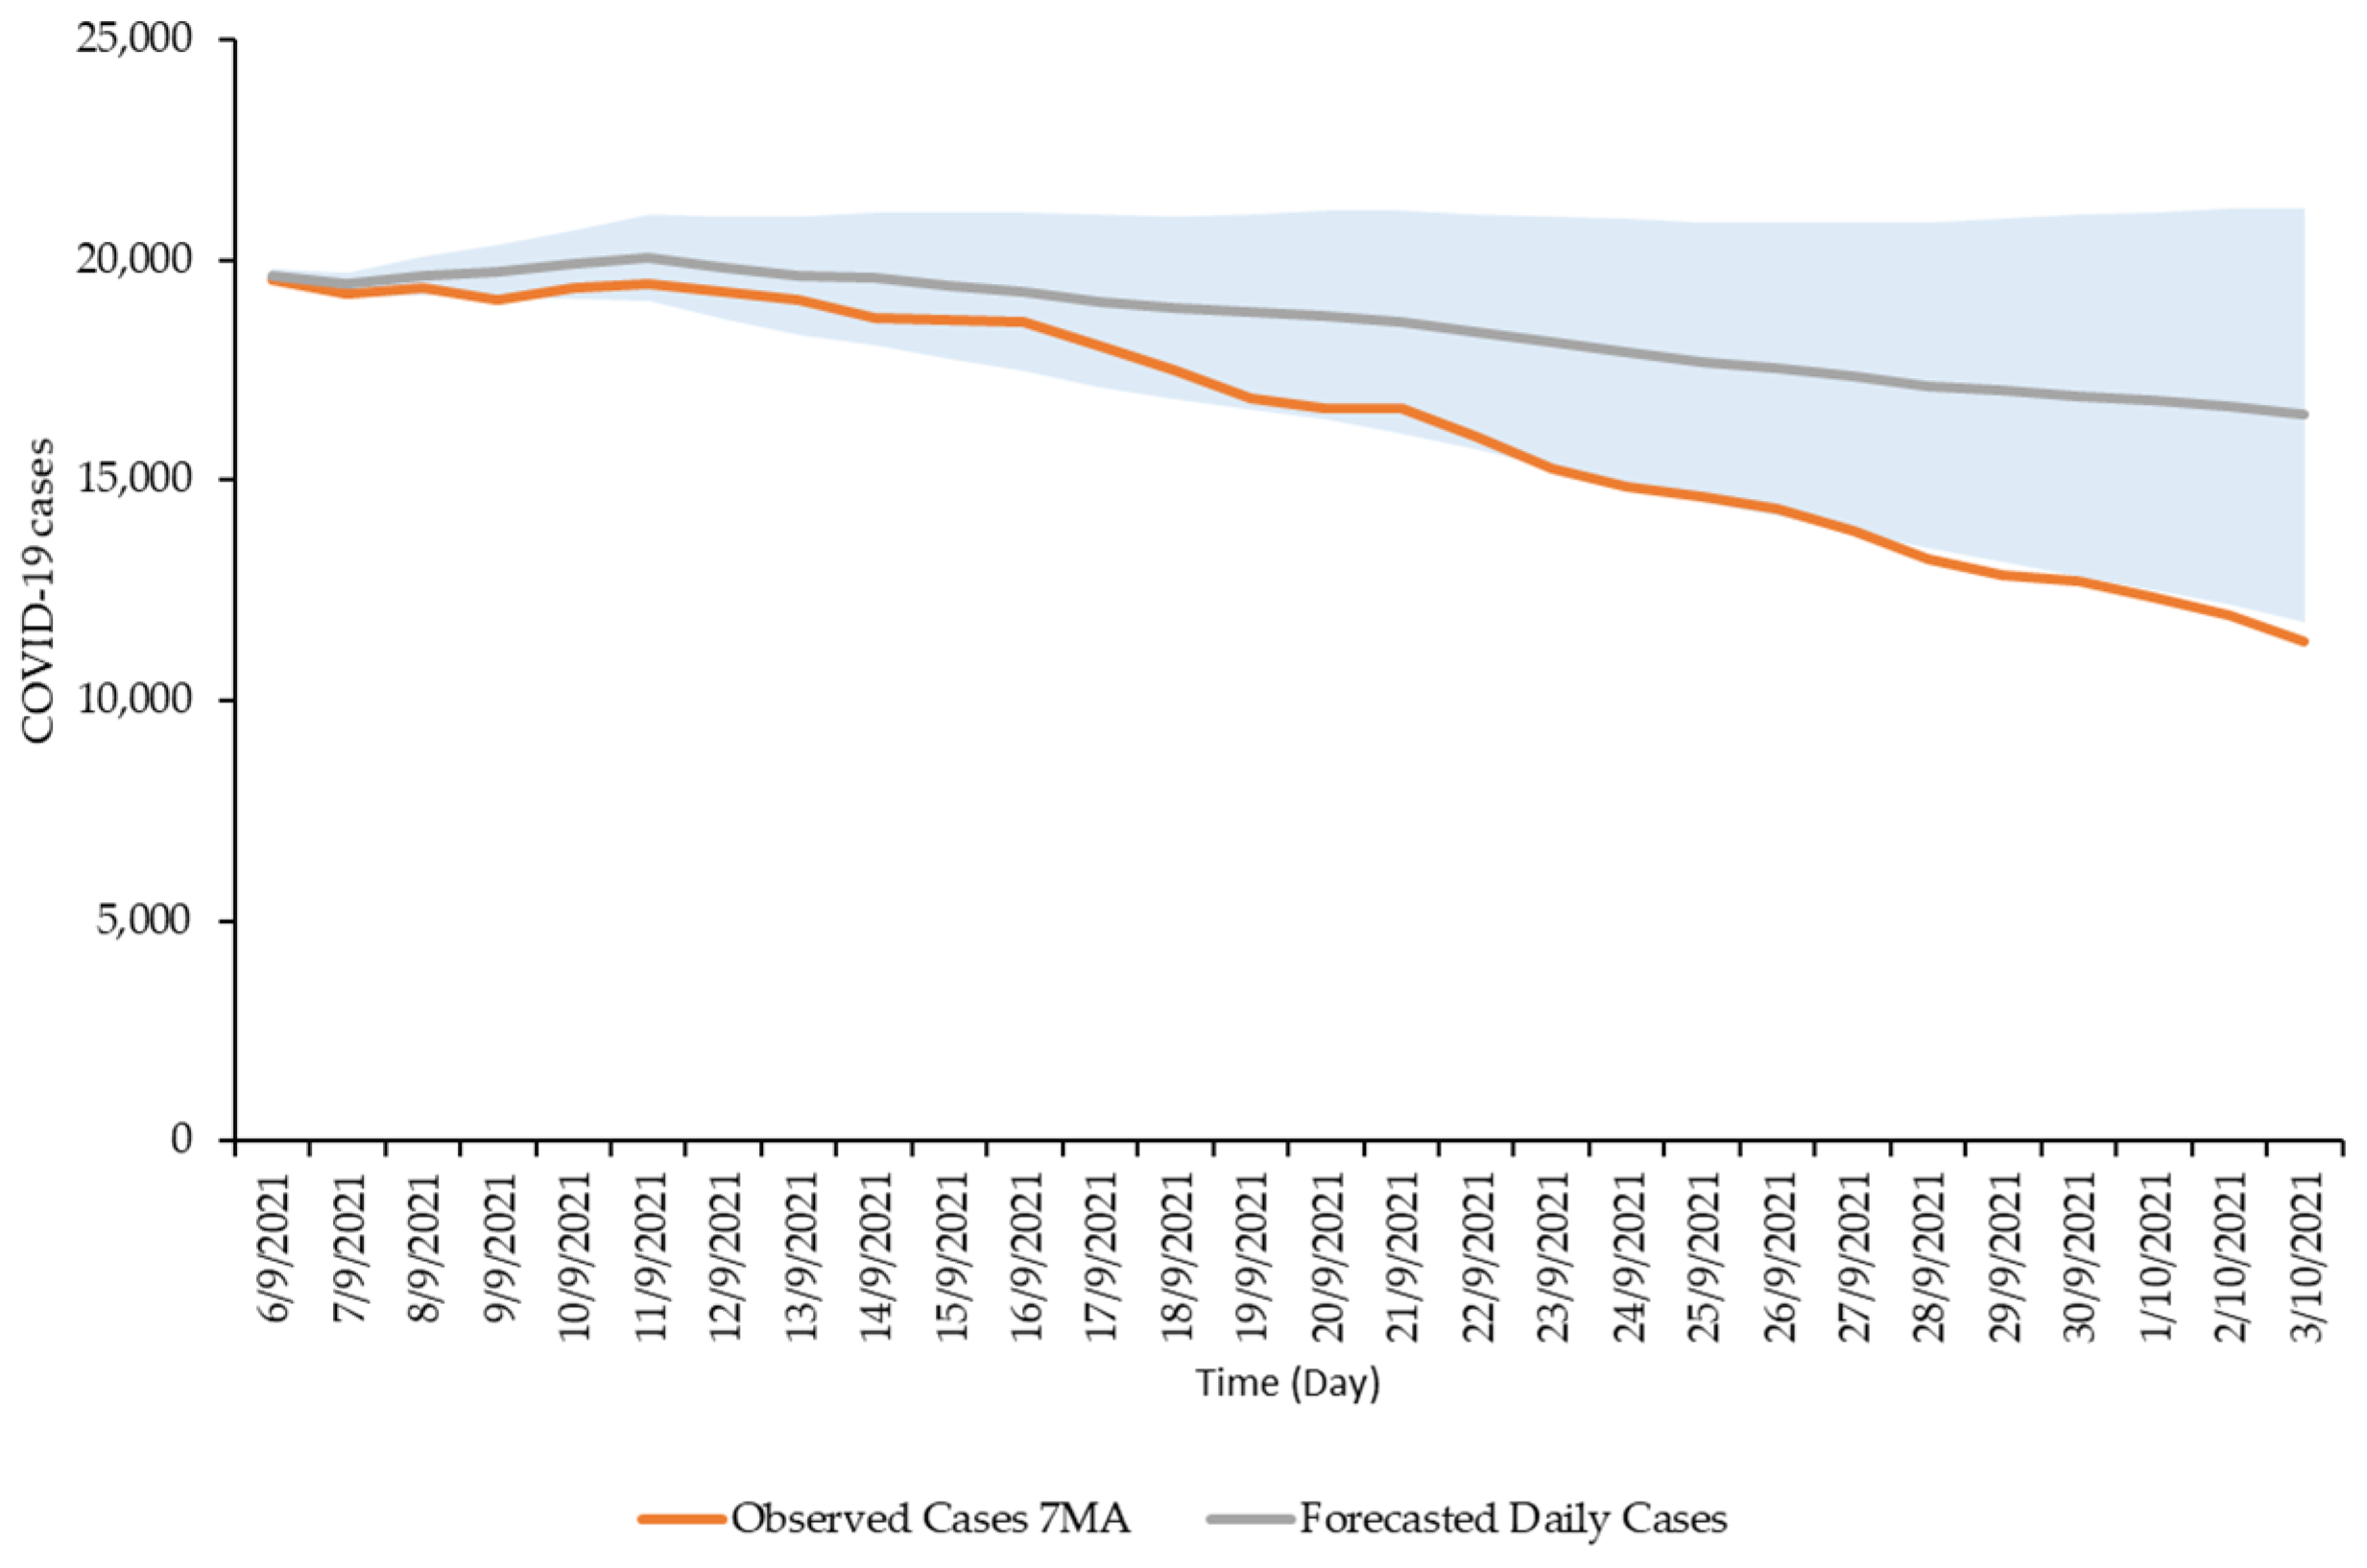
| Date | Forecasted Daily Cases | Lower CI | Upper CI | Observed Daily Cases (MA) |
|---|---|---|---|---|
| 6 September 2021 | 19,654 | 19,510 | 19,798 | 19,547 |
| 7 September 2021 | 19,434 | 19,151 | 19,716 | 19,211 |
| 8 September 2021 | 19,638 | 19,203 | 20,073 | 19,350 |
| 9 September 2021 | 19,739 | 19,137 | 20,340 | 19,110 |
| 10 September 2021 | 19,901 | 19,118 | 20,683 | 19,367 |
| 11 September 2021 | 20,046 | 19,070 | 21,021 | 19,437 |
| 12 September 2021 | 19,819 | 18,637 | 21,002 | 19,266 |
| 13 September 2021 | 19,642 | 18,293 | 20,991 | 19,083 |
| 14 September 2021 | 19,575 | 18,072 | 21,078 | 18,672 |
| 15 September 2021 | 19,404 | 17,753 | 21,055 | 18,638 |
| 16 September 2021 | 19,285 | 17,488 | 21,082 | 18,568 |
| 17 September 2021 | 19,067 | 17,127 | 21,007 | 18,054 |
| 18 September 2021 | 18,899 | 16,816 | 20,981 | 17,482 |
| 19 September 2021 | 18,812 | 16,588 | 21,036 | 16,876 |
| 20 September 2021 | 18,735 | 16,363 | 21,107 | 16,629 |
| 21 September 2021 | 18,592 | 16,067 | 21,116 | 16,642 |
| 22 September 2021 | 18,360 | 15,680 | 21,040 | 15,998 |
| 23 September 2021 | 18,123 | 15,284 | 20,961 | 15,275 |
| 24 September 2021 | 17,926 | 14,926 | 20,927 | 14,844 |
| 25 September 2021 | 17,694 | 14,529 | 20,859 | 14,608 |
| 26 September 2021 | 17,532 | 14,200 | 20,865 | 14,344 |
| 27 September 2021 | 17,339 | 13,829 | 20,850 | 13,860 |
| 28 September 2021 | 17,145 | 13,450 | 20,841 | 13,227 |
| 29 September 2021 | 17,045 | 13,158 | 20,932 | 12,862 |
| 30 September 2021 | 16,923 | 12,839 | 21,008 | 12,717 |
| 1 October 2021 | 16,802 | 12,514 | 21,089 | 12,336 |
| 2 October 2021 | 16,681 | 12,185 | 21,177 | 11,910 |
| 3 October 2021 | 16,473 | 11,763 | 21,182 | 11,333 |
References
- Timeline of WHO’s Response to COVID-19. Available online: https://www.who.int/emergencies/diseases/novel-coronavirus-2019/interactive-timeline#! (accessed on 19 March 2021).
- Timeline of WHO’s Response to COVID-19 Event 42. Available online: https://www.who.int/news-room/detail/29-06-2020-covidtimeline (accessed on 26 April 2021).
- Infographic: What a Third COVID-19 Wave Could Look Like|Coronavirus Pandemic News|Al Jazeera. Available online: https://www.aljazeera.com/news/2020/11/17/infographic-what-a-third-covid-19-wave-looks-like (accessed on 19 March 2021).
- Saito, S.; Asai, Y.; Matsunaga, N.; Hayakawa, K.; Terada, M.; Ohtsu, H.; Tsuzuki, S.; Ohmagari, N. First and Second COVID-19 Waves in Japan: A Comparison of Disease Severity and Characteristics. J. Infect. 2021, 82, 84–123. [Google Scholar] [CrossRef] [PubMed]
- Cacciapaglia, G.; Cot, C.; Sannino, F. Second Wave COVID-19 Pandemics in Europe: A Temporal Playbook. Sci. Rep. 2020, 10, 1–8. [Google Scholar] [CrossRef] [PubMed]
- Solis, J.; Franco-Paredes, C.; Henao-Martinez, A.F.; Krsak, M.; Zimmer, S.M. Structural Vulnerability in the U.S. Revealed in Three Waves of COVID-19. American Journal of Tropical Medicine and Hygiene. Am. Soc. Trop. Med. Hyg. 2020, 103, 25–278. [Google Scholar] [CrossRef] [PubMed]
- Turning the Tide on Malaysia’s Third COVID-19 Wave|The Star. Available online: https://www.thestar.com.my/news/nation/2020/10/14/turning-the-tide-on-malaysias-third-covid-19-wave (accessed on 26 April 2021).
- Malaysia’s Third COVID-19 Wave—A Paradigm Shift Required—PubMed. Available online: https://pubmed.ncbi.nlm.nih.gov/33510100/ (accessed on 26 April 2021).
- Situasi Terkini COVID-19 di Malaysia 25 April 2021|COVID-19 MALAYSIA. Available online: http://covid-19.moh.gov.my/terkini/2021/04/situasi-terkini-covid-19-di-malaysia-25042021 (accessed on 26 April 2021).
- Chang, S.L.; Harding, N.; Zachreson, C.; Cliff, O.M.; Prokopenko, M. Modelling Transmission and Control of the COVID-19 Pandemic in Australia. Nat. Commun. 2020, 11, 1–13. [Google Scholar] [CrossRef]
- Cao, J.; Jiang, X.; Zhao, B. Mathematical Modeling and Epidemic Prediction of COVID-19 and Its Significance to Epidemic Prevention and Control Measures. J. Biomed. Res. Innov. 2020, 1, 1–9. [Google Scholar]
- Payedimarri, A.B.; Concina, D.; Portinale, L.; Canonico, M.; Seys, D.; Vanhaecht, K.; Panella, M. Prediction Models for Public Health Containment Measures on COVID-19 Using Artificial Intelligence and Machine Learning: A Systematic Review. Int. J. Environ. Res. Public Health 2021, 18, 4499. [Google Scholar] [CrossRef] [PubMed]
- Dehning, J.; Zierenberg, J.; Spitzner, F.P.; Wibral, M.; Neto, J.P.; Wilczek, M.; Priesemann, V. Inferring Change Points in the COVID-19 Spreading Reveals the Effectiveness of Interventions. Science 2020, 369, eabb9789. [Google Scholar] [CrossRef]
- Ray, D.; Salvatore, M.; Bhattacharyya, R.; Wang, L.; Du, J.; Mohammed, S.; Purkayastha, S.; Halder, A.; Rix, A.; Barker, D.; et al. Predictions, Role of Interventions and Effects of a Historic National Lockdown in India’s Response to the the COVID-19 Pandemic: Data Science Call to Arms. Harvard Data Sci. Rev. 2020, 2020 (Suppl. S1). [Google Scholar] [CrossRef]
- COVID-19-Forecasts/COVID-19_Forecast_Model_Descriptions.md at Master · Cdcepi/COVID-19-Forecasts · GitHub. Available online: https://github.com/cdcepi/COVID-19-Forecasts/blob/master/COVID-19_Forecast_Model_Descriptions.md (accessed on 26 April 2021).
- Alsayed, A.; Sadir, H.; Kamil, R.; Sari, H. Prediction of Epidemic Peak and Infected Cases for COVID-19 Disease in Malaysia, 2020. Int. J. Environ. Res. Public Health 2020, 17, 4076. [Google Scholar] [CrossRef] [PubMed]
- Chen, L.-P.; Zhang, Q.; Yi, G.Y.; He, W. Model-Based Forecasting for Canadian COVID-19 Data. PLoS ONE 2021, 16, e0244536. [Google Scholar] [CrossRef]
- Cori, A.; Ferguson, N.M.; Fraser, C.; Cauchemez, S. A New Framework and Software to Estimate Time-Varying Reproduction Numbers during Epidemics. Am. J. Epidemiol. 2013, 178, 1505–1512. [Google Scholar] [CrossRef] [PubMed] [Green Version]
- Malki, Z.; Atlam, E.S.; Ewis, A.; Dagnew, G.; Alzighaibi, A.R.; ELmarhomy, G.; Elhosseini, M.A.; Hassanien, A.E.; Gad, I. ARIMA Models for Predicting the End of COVID-19 Pandemic and the Risk of Second Rebound. Neural Comput. Appl. 2021, 33, 2929–2948. [Google Scholar] [CrossRef] [PubMed]
- Adhikari, R.; Agrawal, R.K. An Introductory Study on Time Series Modeling and Forecasting. arXiv 2013, arXiv:1302.6613. [Google Scholar]
- Allard, R. Use of Time-Series Analysis in Infectious Disease Surveillance. Bull. World Health Organ. 1998, 76, 327–333. [Google Scholar] [PubMed]
- Lee, D.H.; Kim, Y.S.; Koh, Y.Y.; Song, K.Y.; Chang, I.H.; Lee, D.H.; Kim, Y.S.; Koh, Y.Y.; Song, K.Y.; Chang, I.H. Forecasting COVID-19 Confirmed Cases Using Empirical Data Analysis in Korea. Multidiscip. Digit. Publ. Inst. 2021, 9, 254. [Google Scholar] [CrossRef]
- Aditya Satrio, C.B.; Darmawan, W.; Nadia, B.U.; Hanafiah, N. Time Series Analysis and Forecasting of Coronavirus Disease in Indonesia Using ARIMA Model and PROPHET. In Procedia Computer Science; Elsevier B.V.: Amsterdam, The Netherlands, 2021; Volume 179, pp. 524–532. [Google Scholar] [CrossRef]
- Chakraborty, T.; Ghosh, I. Real-Time Forecasts and Risk Assessment of Novel Coronavirus (COVID-19) Cases: A Data-Driven Analysis. Chaos Solitons Fractals 2020, 135, 109850. [Google Scholar] [CrossRef] [PubMed]
- Singh, R.K.; Rani, M.; Bhagavathula, A.S.; Sah, R.; Rodriguez-Morales, A.J.; Kalita, H.; Nanda, C.; Sharma, S.; Sharma, Y.D.; Rabaan, A.A.; et al. Prediction of the COVID-19 Pandemic for the Top 15 Affected Countries: Advanced Autoregressive Integrated Moving Average (ARIMA) Model. JMIR Public Heal. Surveill. 2020, 6, e19115. [Google Scholar] [CrossRef] [PubMed]
- Perone, G. An ARIMA Model to Forecast the Spread and the Final Size of COVID-2019 Epidemic in Italy (4 April 2020). HEDG—Health Econometrics and Data Group Working Paper Series, University of York. 2020. Available online: https://ssrn.com/abstract=3564865 (accessed on 26 April 2021).
- ArunKumar, K.E.; Dinesh, V.; Kalaga, C.H.; Kumar, M.S.; Chilkoor, G.; Kawaji, M.; Brenza, T.M. Forecasting the dynamics of cumulative COVID-19 cases (confirmed, recovered and deaths) for top-16 countries using statistical machine learning models: Auto-Regressive Integrated Moving Average (ARIMA) and Seasonal Auto-Regressive Integrated Moving Average (SARIMA). Appl. Soft Comput. 2021, 103, 107161. [Google Scholar]
- Singh, S.; Sundram, B.M.; Rajendran, K.; Law, K.B.; Aris, T.; Ibrahim, H.; Dass, S.C.; Gill, B.S. Forecasting Daily Confirmed COVID-19 Cases in Malaysia Using ARIMA Models. J. Infect. Dev. Ctries. 2020, 14, 971–976. [Google Scholar] [CrossRef]
- Jensen, L. Guidelines for the Application of Arima Models in Time Series. Res. Nurs. Health 1990, 13, 429–435. [Google Scholar] [CrossRef] [PubMed]
- MA, E.; ZA, M.A.; AR, J. Forecasting Malaysia COVID-19 Incidence Based on Movement Control Order Using ARIMA and Expert Modeler. IIUM Med. J. Malays. 2020, 19. [Google Scholar] [CrossRef]
- Home|COVID-19 MALAYSIA. Available online: http://covid-19.moh.gov.my/ (accessed on 26 April 2021).
- Cheung, Y.W.; La, K.S. Lag Order and Critical Values of the Augmented Dickey-Fuller Test. J. Bus. Econ. Stat. 1995, 13, 277–280. [Google Scholar] [CrossRef]
- Vatcheva, K.P.; Lee, M. Multicollinearity in Regression Analyses Conducted in Epidemiologic Studies. Epidemiology 2016, 6, 227. [Google Scholar] [CrossRef] [Green Version]
- Hernandez-Matamoros, A.; Fujita, H.; Hayashi, T.; Perez-Meana, H. Forecasting of COVID19 per regions using ARIMA models and polynomial functions. Appl. Soft Comput. 2020, 96, 106610. [Google Scholar] [CrossRef] [PubMed]
- Ala’raj, M.; Majdalawieh, M.; Nizamuddin, N. Modeling and forecasting of COVID-19 using a hybrid dynamic model based on SEIRD with ARIMA corrections. Infect. Dis. Model. 2021, 6, 98–111. [Google Scholar] [CrossRef] [PubMed]
- Rostami-Tabar, B.; Rendon-Sanchez, J.F. Forecasting COVID-19 daily cases using phone call data. Appl. Soft Comput. 2021, 100, 106932. [Google Scholar] [CrossRef] [PubMed]


| Model | RMSE | MAE | BIC | Q18 |
|---|---|---|---|---|
| SARIMA (1,2,1) (2,0,0) with covariates—Selangor daily cases * | 73.374 | 39.716 | 8.656 | 52.628 |
| SARIMA (1,2,1) (2,0,0) ** | 73.704 | 39.111 | 8.654 | 51.505 |
| SARIMA (1,2,1) (2,0,0) with covariates—Selangor daily cases ** | 73.584 | 39.436 | 8.662 | 51.812 |
| SARIMA (1,2,1) (2,0,0) | 524.894 | 277.137 | 12.580 | 68.129 |
| ARIMA (1,2,1) with covariates—Selangor daily cases * | 87.301 | 47.836 | 8.982 | 167.963 |
| Model Covariate | Estimates | Standard Error (SE) | p-Value * | |
|---|---|---|---|---|
| Malaysia (7-day MA) | Constant | 1.157 | 0.988 | 0.242 |
| AR (Lag 1) | 0.251 | 0.116 | 0.031 * | |
| Difference | 2 | |||
| MA (Lag 1) | 0.564 | 0.098 | 0.000 * | |
| AR, Seasonal (Lag 1) | −0.710 | 0.044 | 0.000 * | |
| AR, Seasonal (Lag 2) | −0.365 | 0.047 | 0.000 * | |
| Daily Selangor cases (7-day MA) | Numerator (Lag 0) | −0.001 | 0.000 ** | 0.011 * |
Publisher’s Note: MDPI stays neutral with regard to jurisdictional claims in published maps and institutional affiliations. |
© 2022 by the authors. Licensee MDPI, Basel, Switzerland. This article is an open access article distributed under the terms and conditions of the Creative Commons Attribution (CC BY) license (https://creativecommons.org/licenses/by/4.0/).
Share and Cite
Tan, C.V.; Singh, S.; Lai, C.H.; Zamri, A.S.S.M.; Dass, S.C.; Aris, T.B.; Ibrahim, H.M.; Gill, B.S. Forecasting COVID-19 Case Trends Using SARIMA Models during the Third Wave of COVID-19 in Malaysia. Int. J. Environ. Res. Public Health 2022, 19, 1504. https://doi.org/10.3390/ijerph19031504
Tan CV, Singh S, Lai CH, Zamri ASSM, Dass SC, Aris TB, Ibrahim HM, Gill BS. Forecasting COVID-19 Case Trends Using SARIMA Models during the Third Wave of COVID-19 in Malaysia. International Journal of Environmental Research and Public Health. 2022; 19(3):1504. https://doi.org/10.3390/ijerph19031504
Chicago/Turabian StyleTan, Cia Vei, Sarbhan Singh, Chee Herng Lai, Ahmed Syahmi Syafiq Md Zamri, Sarat Chandra Dass, Tahir Bin Aris, Hishamshah Mohd Ibrahim, and Balvinder Singh Gill. 2022. "Forecasting COVID-19 Case Trends Using SARIMA Models during the Third Wave of COVID-19 in Malaysia" International Journal of Environmental Research and Public Health 19, no. 3: 1504. https://doi.org/10.3390/ijerph19031504
APA StyleTan, C. V., Singh, S., Lai, C. H., Zamri, A. S. S. M., Dass, S. C., Aris, T. B., Ibrahim, H. M., & Gill, B. S. (2022). Forecasting COVID-19 Case Trends Using SARIMA Models during the Third Wave of COVID-19 in Malaysia. International Journal of Environmental Research and Public Health, 19(3), 1504. https://doi.org/10.3390/ijerph19031504