Abstract
Continuity of care (COC) has been shown to possess numerous health benefits for chronic diseases. Specifically, the establishment of its level can facilitate clinical decision-making and enhanced allocation of healthcare resources. However, the use of a generalizable predictive methodology to determine the COC in patients has been underinvestigated. To fill this research gap, this study aimed to develop a machine learning model to predict the future COC of asthma patients and explore the associated factors. We included 31,724 adult outpatients with asthma who received care from the University of Washington Medicine between 2011 and 2018, and examined 138 features to build the machine learning model. Following the 10-fold cross-validations, the proposed model yielded an accuracy of 88.20%, an average area under the receiver operating characteristic curve of 0.96, and an average F1 score of 0.86. Further analysis revealed that the severity of asthma, comorbidities, insurance, and age were highly correlated with the COC of patients with asthma. This study used predictive methods to obtain the COC of patients, and our excellent modeling strategy achieved high performance. After further optimization, the model could facilitate future clinical decisions, hospital management, and improve outcomes.
1. Introduction
1.1. Background
Continuity of care (COC) is a mode of structured care delivery. It has been shown to offer numerous health benefits for chronic disease management with fewer adverse outcomes [1,2] and reduced costs [3,4]. A patient with a low level of COC involves better ongoing healthcare management. Thus, knowing the level of COC is essential for implementing care interventions. Thus far, its measurements have varied and mostly focused on finding a way to measure the “interpersonal relationship” between patients and collaborators, such as physicians, caregivers, and patients themselves [5,6,7,8]. Despite the availability of different measurements, appropriately obtaining COCs with a generalizable methodology has been underinvestigated. Notably, the predictive model is an artificial intelligence method that can be deployed in the clinic to facilitate decisions prospectively [9]. Using an effective technique to predict the COC of patients would be a breakthrough. However, the high dependence on multidisciplinary knowledge and massive data collection limits this progression [10]. To precisely identify the degree of COC, we used a machine learning classification model to predict the future level of COC of patients and targeted one of the major chronic diseases, asthma.
Asthma is a common chronic disease that would cause poor outcomes if out of continuous control. In the United States, 7.8% of the people have asthma, causing 1,629,469 emergency department (ED) visits; 178,530 hospitalizations; and over 10.0 million deaths annually [11]. Unlike other chronic diseases, it affects a broader age range, indicating that any effective improvement in asthma would benefit more patients. In addition, younger patients with asthma have a lower COC and more often experience episodic exacerbations [12]. By knowing the COC beforehand and improving it using practical methods, as many as 60–75% of the future ED visits and 25% of the hospitalization by patients with asthma can be avoided [13,14,15,16].
1.2. Current Research Gap
Previous studies have focused on finding an association between the COC and outcomes in patients with asthma. However, as demonstrated by the literature [17], proper gauging of COC and outcomes should be prioritized before exploring the relationship between them. As identifying the outcomes of patients is much easier than ascertaining the COC, many studies have developed a predictive model for the former [18,19,20,21,22,23,24,25,26,27,28,29,30,31,32,33,34], while limited research has been performed for the latter.
Most importantly, thus far, assessing the COC of patients has relied on historical data [5,6,7,8]. Studies have extracted patients having longitudinal visiting records for several years to measure the COC, such as the continuity of care index (COCI). The existing quantitative methods all used historical data and had a limited sample pool. Moreover, it cannot be obtained for a new patient who has never been in a specific healthcare system. In the University of Washington Medicine (UWM), approximately 40% of the new patients with asthma receive medical care per year, as shown in Table 1. Assuming that using the past COC could predict its future level, the highest prediction accuracy would be less than 60%. Furthermore, the COC of patients is likely to change with time; thus, prior COC cannot represent the future ones for existing patients with 100% accuracy. We calculated the prediction accuracy using the historical COC for outpatients with asthma who received care from the UWM for 5 years. The highest accuracy was 57.94%, as shown in Table 1. Thus, in this study, the baseline prediction accuracy was set to 57.94%. Although this method seemed uncomplicated, it was insufficient. Furthermore, additional barriers would further affect this approach:

Table 1.
The distributions of the patients and the data instances between 2014 to 2018.
- Clinical research has mostly chosen claims data, electronic health records (EHR), patient surveys, and consultation to collect data. The claims data and the EHRs usually contain complete historical data, however, extracting and cleaning this massive raw data for clinical researchers is complicated. Thus, patient surveys and consultations are more preferable [7,35,36,37,38,39]. However, general consultation data collection is practiced using computers, including telephone calls or emails, depending on the computer system or the operation person. It could be misleading if various researchers shared the same data or if the computer system changed. Although patient surveys could avoid such misrepresentative findings, the small sample size would limit the study. Therefore, the simple method that directly uses the previous COC to represent the future is limited by specific research, and it is not generalized.
- Several studies have shown that patient demographics and comorbidities are associated with the COC of patients [37,38]. Using these attributes could certainly facilitate the evaluation of COC in some new patients. Current studies mainly focus on investigating the probability that these characteristics would affect the COC; however, they do not implement them accurately to indicate its specific level. In this research, models were developed to explore the feasibility of using demographic and comorbidity attributes to assess the COC.
Notably, a critical intervention for patients after an asthma attack is to invest in care management. It costs over $5000 per person annually [40] and generally enrolls only below 3% of the patients due to resource limitations [41]. The COC is a part of care management. Undeniably, earlier intervention for patients with low COC would achieve better quality and cost-effectiveness of care management. Thus, it is worthwhile to investigate a generalizable predictive methodology to determine the future COC.
1.3. Objective
This study was designed to fill the aforementioned research gap. We proposed a machine learning model to predict the future COC for outpatients with asthma. Our final model integrated the EHRs and the administrative data to estimate three possible categorical COC levels: high, moderate, and low.
2. Materials and Methods
2.1. Data Source
This retrospective cohort study used the EHRs and the administrative data extracted from the UWM, the most extensive academic healthcare system in the State of Washington. The data warehouse has been collecting complete adults’ data from 12 clinics and 3 hospitals since 2011. This study’s patient population included all outpatient visits from 2011 to 2018.
2.2. Data Collection and Patient Cohort
The enterprise data warehouse of the UWM contains the original and uncleaned EHRs and administrative data. To ensure data validity, we implemented a data collection and cleaning process before building the predictive model. We identified patients with asthma in a specific year using a minimum of one diagnosis code of asthma in that year: the International Classification of Diseases, Ninth Revision codes 493.9x, 493.8x, 493.1x, and 493.0x; and the International Classification of Diseases, Tenth Revision codes J45.x [20,42,43]. The patient cohort included 31,724 adult outpatients (age ≥ 18 years) with asthma between 1 January 2011 and 31 December 2018; 5057 outpatients (age < 18 years) were excluded. The distribution of this study’s dataset is presented in Figure 1.
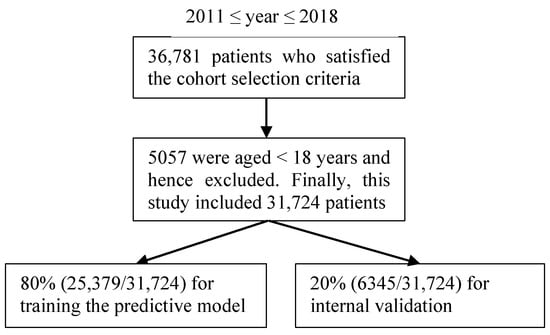
Figure 1.
The patient cohort in the study.
2.3. Prediction Target
The prediction target in this study was the class of COC score, which represent the level of COC of the patient. To calculate the score of the patients’ COC, the most common COC measurement algorithm, the continuity of care index (COCI) [44], was chosen and divided into three dimensions following the classification strategy of the study [45]. The COCI is composed of the number of visits to each physician and that of distinct physicians consulted [44]. The following general equation represents the COCI of the outpatient visits.
where N refers to the total number of visits to the physicians, nj denotes the number of visits to physician j, and M refers to the total number of different physicians.
The COCI ranges from 0 to 1, with a higher score indicating a higher level of COC. In this study, the COCI was classified into three levels: high (0.34–1.00), moderate (0.17–0.33), and low (0.00–0.16). For building an enhanced model, we assigned the numbers 3, 2, and 1 to high, moderate, and low levels, respectively, to represent these three dimensions.
2.4. Preprocessing Feature Values
The quality of data and features determines the performance and reliability of a machine learning model; specifically, preprocessing features are essential before training data. In this study, a total of 138 features were examined, describing a large variety of characteristics. Table A1 in the Appendix A describes the details of these features. Except for the demographic features (such as age, gender, race, and ethnicity), those related to medication, insurance, comorbidity, family location, and types of visits were included in this study. Typically, we utilized standardization to process complicated features. We adopted a uniform quantity standard to calculate the structured attributes. An instance of medication features for improved understanding is as follows: a patient who was prescribed medications twice in a specific year. Medications A and B were prescribed for the first time, and A and C for the second time; the total number of prescribed medications was four, and the number of distinct prescribed medications is three this year. In addition, binarization was introduced to quantify broad domain features, including those associated with the family location of patients. Our prior study [46] showed that the 5-mile radius from the patient’s home to the UMW was the threshold distance for the patients who mostly tended to receive care from it. Therefore, we divided the value for this attribute as 1 or 0 to distinguish whether the distance was less than 5 miles.
Every input data instance in the predictive model was independent of the outcome. Therefore, the features corresponding to the number of visits to the physicians were not considered, such as “number of outpatient visits to the patient’s primary care providers”, “number of differing providers the patient saw in outpatient visits,” and “number of differing primary care providers of the patient”. In addition, if some features described similar items, they were integrated into one category. For instance, “primary asthma diagnosis” and “priority asthma diagnosis” were categorized as one entity under “primary asthma diagnosis”.
2.5. Modeling
2.5.1. Data Preparation
Most classification algorithms accept only numerical features. Thus, we applied one-hot encoding to transform the categorical features into the numerical ones before they were added to the classifiers. Furthermore, as the COCI is a longitudinal prediction target, the corresponding values were initiated into computing because the patient was first shown in this UWM dataset. The entire 9-year period of this study was from January 2011 to December 2018.
2.5.2. Performance Metrics
For a multiclass classification problem, the prediction accuracy and the area under the receiver operating characteristic curve (AUROC) are two important metrics for evaluating the performance of a predictive model; however, it is not the sole measure to select a proper classifier. We further chose three additional standard metrics: precision, recall, and F1 score for a more precise evaluation. Precision refers to the percentage of positive cases from total predicted cases, recall refers to the percentage of how many total positive cases were predicted correctly with the built model, and F1 score refers to the combined result of precision and recall. The equations for the metrics are as follows:
TPi = TiPi,
Pi = TPi/(TPi + FPi),
Ri = TPi/(TPi + FNi),
F1i = 2PiRi/(Pi + Ri),
Here, Pi refers to precision for class i, Ri denotes recall for class i, F1i refers to F1 score for class i, TPi denotes true-positive classifications for class i, and FPi refers to false-positive classifications for class i. FNi refers to false-negative classifications for class i. The confusion matrix for multi-class classification is presented in Table 2.
Table 2.
The confusion matrix.
2.5.3. Classification Algorithms
Machine learning classification algorithms predict the probability of an objective variable by inputting labeled data for supervised learning. Our prediction target, the COCI of patients with asthma, was divided into three groups: high (3), moderate (2), and low (1). The machine learning classifiers are the best choice for handling this multiclass classification problem. In order to build a predictive model, this study proposed the use of the extreme gradient boosting (XGBoost) algorithm [47], an efficient and distributed realization of gradient boosting. Typically, the top six classification algorithms are employed to develop the advanced predictive models recognized in the data mining and machine learning literature [47,48]: random forest, k-nearest neighbor (k-NN), support vector machine (SVM), C4.5 decision tree, XGBoost, and Naive Bayes. Specifically, tree-based algorithms (e.g., random forest, C4.5, and XGBoost) and the SVM are both high-performance tools for classification. The former divides the input space into hyper-rectangles according to the target. The latter uses the kernel trick to convert a linearly nonseparable problem into a linearly separable one, thus prolonging the training duration. The six preliminary algorithms were tested and the XGBoost was selected owing to its superior performance.
The study sample was divided into 80% and 20% for training and internal validation, respectively. We fit them with the six algorithms and applied the 10-fold cross-validations to find the best parameters. The parameters tuned in the experiments for each model are as follows: the balanced or not of class weight, the number of trees, and split criterion measure in random forest; the number of neighbors in the k-NN; the balanced or not of class weight, regularization strength, and kernel function in the SVM; the class weight and trees’ maximum depth in the C4.5 and the XGBoost; and the prior probabilities and likelihoods of different classes in the Naive Bayes. The other parameters were automatically set by each algorithm.
2.5.4. Evaluating the Superiority of the Final Model
Overall, 138 features were used to build the final model. Checking more types of features was undoubtedly an essential part of the modeling strategy. As this study was innovative, it was necessary to investigate whether an uncomplicated use of patients’ demographic or comorbidity features to predict the future COC would also be effective. We constructed two additional models using the same patient cohort, prediction target, feature preprocessing method, and machine learning algorithm. The difference between these two models and the final one was the number of features. We named “model_2” as the second model using only demographic features, and “model_3” as the third one using demographic and comorbidity features. The details of the features are listed in Table A2 and Table A3 of the Appendix A.
The purpose of these two models was to examine whether the final model was superior to the simpler models. It was unnecessary to use as many comorbidity features as the final model when the model_3 was built. Furthermore, most clinical studies could not obtain complete comorbidity information by patient surveys or consultations. Thus, we chose 10 asthma-related comorbidity features to build model_3.
3. Results
3.1. Distributions of the COCI and the Data Instances
Table 3 presents the distributions of the COCI classes and the data instances. During the entire study period, 40.68% (12,905/31,724), 5.69% (1804/31,724), and 53.63% (17,015/31,724) of the data instances indicated low (COCI class = 1), moderate (COCI class = 2), and high COC levels (COCI class = 3), respectively.
Table 3.
The distributions of the COCI category and the data instances between 2011 to 2018.
3.2. Characteristics of the Patient Cohort
Table 4 shows the characteristics of the patient cohort. We computed the p-value using the chi-square test [42] to evaluate the statistical differences of the data instances. As displayed in Table 4, most characteristics of the patients presented statistically significantly different distributions (p < 0.001) among the three COCI classes, with the exception of the occurrence of bronchopulmonary dysplasia (p = 0.99) and cystic fibrosis (p = 0.02) in the patient.
Table 4.
The characteristics of the patients at the UWM from 2011 to 2018.
3.3. Classification Results
3.3.1. Performance Results of Various Machine Learning Models
In this study, the dataset was randomly divided into 80% and 20% as a training and test set, respectively. For comparison purposes, five additional models with the random forest, k-NN, SVM, C4.5, and Naive Bayes were evaluated using 10-fold cross-validations under the same sample of the training and test sets. The average values of accuracy, precision, recall, F1 score, and the AUROC of the six models are listed in Table 5. The baseline accuracy calculated using the direct method mentioned previously is listed in Table 5 for an improved comparison.
Table 5.
Prediction performance of various machine learning models.
For a multiclass classification problem, high accuracy and the AUROC guarantee good performance for a predictive model. Furthermore, recall and precision are able to indicate critical factors for imbalanced datasets. Higher recall and precision indicate that additional instances were identified correctly. Notably, the F1 score is the weighted average of recall and precision. Thus, we considered the F1 score, accuracy, and the AUROC as assessments of the prediction performance.
Across the models, our final model using the XGBoost classifier yielded the highest accuracy (88.20%), the highest F1 score (0.86), and the highest AUROC (0.96). Figure 2 presents the ROC curves of the model. The model gained a microaverage AUROC of 0.96 and a macroaverage AUROC of 0.90, respectively. Specifically, the AUROC of each class of the final model yielded 0.98, 0.80, and 0.93 for classes 1, 2, and 3, respectively. The confusion matrix of the final model is presented in Figure 3. In addition, we tuned a total of 138 features into the XGBoost classifier that was able to automatically compute each feature’s importance value based on its allocated contribution to the model [49]. Our final model was built with 127 features selected by the XGBoost, as listed in Table A4 of the Appendix A, in descending order of the importance values. The XGBoost automatically filtered noncontributing features.
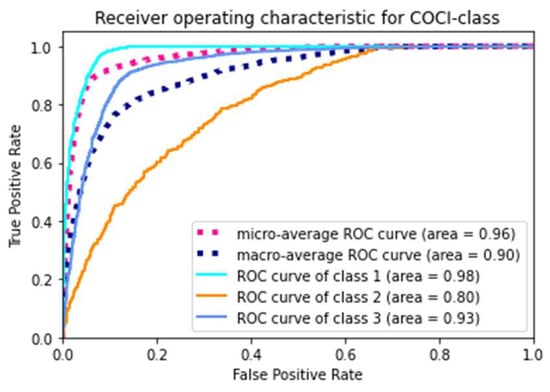
Figure 2.
The receiver operating characteristic curve of the final model.
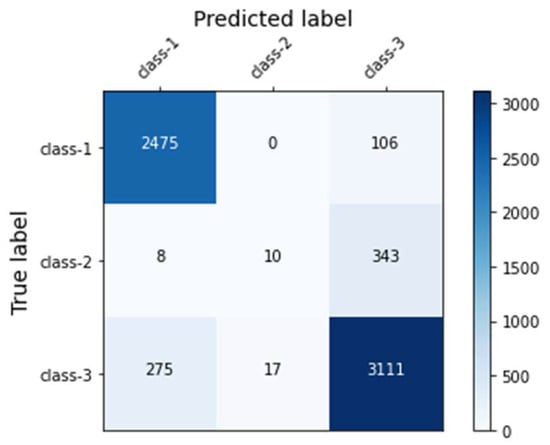
Figure 3.
The confusion matrix of the final model.
3.3.2. Superiority Evaluation Results
The superiority evaluation study examined the performance of two simpler models built with fewer features. With the exception of the features, the dataset, prediction target, and modeling strategy were all consistent with the final model. The comparison results are presented in Table 6 and Figure 4. The final model yielded the best performance among all the metrics.
Table 6.
Performance results between the final and compared models.
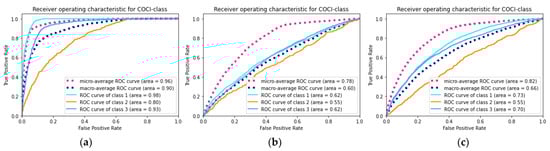
Figure 4.
The receiver operating characteristic curve of the models. (a) The final model built by full features; (b) the model_2 built by only demographic features; (c) the model_3 built by demographic and comorbidity features.
4. Discussion
4.1. Principal Findings
In this study, a machine-learning model was developed to predict the future COC of patients with asthma. For enhanced identification and to calculate its level, the COCI was selected, which is the most common algorithm employed by patients and physicians. The XGBoost model yielded the best performance, including the highest accuracy, AUROC, and F1 score. XGBoost won in this study because of its superior big data processing capability. Nevertheless, other algorithms, such as random forest, performed appropriately as well based on the UWM data, owing to our excellent modeling strategy of feature engineering. Furthermore, solely using demographic or comorbidity features to assess the COC was inadequate, further validating the superiority of the modeling strategy. Generally, this study fills the research gap on the use of the predictive method to obtain the COC of patients with asthma that could facilitate the clinical decision-making and allocation of resources, eventually improving patient outcomes.
Overall, 138 features were assessed, and 92.03% (127/138) were used in the final model. Notably, most of the top 30 features in Table A4 of the Appendix A were related to the severity of asthma, comorbidities, insurance, and age, precisely consistent with prior research on the factors associated with care continuity [50].
4.2. Comparison with Prior Work
This study fills the research gap of predictive model construction for estimating patients’ COCs; thus, prior works relevant to it are limited. Nevertheless, the use of machine learning to improve patient outcomes, such as disease or poor outcome prediction, has been studied broadly to date. In the research on predicting future outcomes of patients with asthma [18,19,20,21,22,23,24,25,26,27,28,29,30,31,32,33,34], the AUROC ranged from 0.70 to 0.90. The highest AUROC with 0.98 for the low COC level patients in this study obtained better performance than the other models. When building a clinical machine learning model, a similar modeling strategy is usually chosen; although the prediction targets are not compatible, the extensive and effective features and the massive data fed into the model facilitate yielding a higher AUROC. Moreover, our precise data extraction strategy for identifying the prediction target contributes to excellent performance.
Notably, different models were built on varying patient cohorts and predicting similar targets. Some studies have used data from patient surveys and self-report outcomes to analyze the COC of those with asthma. This study employed the EHRs and the administrative data that contained greater clinical characteristics for enhanced profiling. The final predictive model was built using the XGBoost, a state-of-the-art machine-learning algorithm. Compared with statistical approaches (linear model) such as logistic regression, the XGBoost (ensemble model) can intensify the prediction performance with less fundamental assumptions on data distribution [51,52]. As partial evidence for this, we built two additional simpler models to validate our modeling strategy’s superiority and generalizability. The excellent performance demonstrated the feasibility of using our final model to predict the COC of patients with asthma.
4.3. Clinical Significance and Potential Use
Our model showed excellent performance in predicting the level of COC for patients with asthma. After working with the healthcare system’s Information Technology (IT) team, we can deploy the model by publishing it as a web service, and the model would benefit both patients and hospital management. Knowing the level of future COC could facilitate the design of an improved objective intervention for patients with asthma. In addition, investing in patients with high COC and providing long-term health services has practically been the goal of all policymakers and healthcare organizations to save colossal costs.
Furthermore, once the patients were identified as having low COC, interventions could have been implemented to prevent it. In the clinical environment, interventions such as adding the COC score to the medical record, investing the patient into care management, and increasing the frequency of follow-up should be considered. Moreover, research has found that adjusting insurance policies, roles, and care delivery strategies can improve the COC [53]. However, such interventions for continuity of asthma care are multifaceted, as they [54] consist of several components such as: (1) interdisciplinary cooperation including interdisciplinary care standards, case conferences, and shared patient management tools; (2) the education of patients and their caregivers and the decision-making involved; (3) implementation of measurable goals of a care plan; (4) allocation of supplemental resources; and (5) coordination of care in the transition. These various components must be considered before designing the interventions.
Literature [55,56] has demonstrated that reimbursement and copayments are associated with improving COC; thus, if this insurance policy is reasonable, such as offering higher reimbursement or lower copayments, both patients and physicians could benefit.
Care delivery strategies can be flexible because thus far, no standard has been used uniformly, and numerous factors should be considered. Investing patients in case management is an effective strategy for improving the COC [57]. Typically, case management is a client-faced approach for promoting cooperation among services, benefits, and opportunities. Activities are designed by case managers to optimize the functioning of people with multiple needs [57]. Regarding asthma care, nurses could be case managers who devote themselves to improving the COC of patients [58]. The literature [59] has indicated that scheduling nurse-led follow-up care appointments increases the COC. A study [60] that recruited 1000 patients (including those with asthma) found that making earlier follow-up care appointments (after discharge is the best time) improved the attendance of the appointment. Similar results were found in research [61] that provided the patients with asthma a free 5-day medication tutorial such as prednisone, a 2-day telephone reminder for making an appointment, and travel vouchers for revisiting their providers that would significantly increase the COC.
Nevertheless, the follow-up care appointments made by providers obtained improved adherence compared to scheduling by patients themselves. The literature [62] has shown that 29% of the cases did not revisit when the care facility stopped the follow-up appointments. Therefore, education is necessary for patients and their caregivers. Numerous studies [58,63,64,65,66] have shown that education programs in various forms, such as home-, web-, and telephone-based, have positive influences on asthma control. These programs increase the conjunction between patients or their caregivers and healthcare facilities [67]. Despite no evidence proving whether education is directly associated with the COC, the conjunction increased by the education programs supports this viewpoint, as the COC is essentially a mode of care delivery coordinated by patients and healthcare facilities. Thus, future research could investigate the association between the COC and asthma education.
4.4. Limitations
This study has several limitations that could be potential topics for future research:
- This study chose the COCI, an algorithm that mainly focuses on the relationship between patients and physicians to assess the COC of patients. In the future, it is possible to evaluate the COC using other methods by considering the interpersonal, geographical, socioeconomic, educational, and cultural aspects;
- The UWM is an academic healthcare system located in an urban area, and we could not access the data outside it. Thus, this study method’s generalizability to other healthcare systems and rural areas could be further examined;
- This study’s model was built using a machine learning algorithm, which is a black-box approach, without any explanation. In the future, implementing a rule-based method to explain the predictions would benefit clinical use.
5. Conclusions
This study fills the research gap in building a predictive model on massive and longitudinal data to estimate the patients’ COCs. The excellent modeling strategy of assessing many features and precise prediction target identification obtained a high performance. This methodology has the potential to be generalized and benefit more diseases. After further optimization, the model could facilitate future clinical decisions, hospital management, and improve outcomes.
Author Contributions
Conceptualization, Y.T., G.C. and Z.Z.; methodology, Y.T.; software, Y.T.; validation, Y.T., and G.C.; formal analysis, Y.T.; investigation, B.L.; resources, Y.T.; data curation, Y.T.; writing—original draft preparation, Y.T.; writing—review and editing, Y.T., G.C. and Z.Z.; supervision, Z.Z.; project administration, Z.Z. All authors have read and agreed to the published version of the manuscript.
Funding
This research was funded by the National Natural Science Foundation of China, 72174184 and 72104221. Y.T. was funded by the program of the China Scholarship Council, 201907040091. The funders had no role in the study design, data collection and analysis, decision to publish, or preparation of the manuscript.
Institutional Review Board Statement
The institutional review boards of the UWM approved this study on the EHR and the administrative data.
Informed Consent Statement
Not applicable.
Acknowledgments
The authors would like to thank Katy Atwood for helping with the retrieval of the UWM data set and Michael D Johnson for useful discussions. Y.T. did the work at the University of Washington when she was a visiting student.
Conflicts of Interest
The authors declare no conflict of interest.
Appendix A
Table A1.
The list of candidate features considered in the final model.
Table A1.
The list of candidate features considered in the final model.
| Feature Category | Features |
|---|---|
| Features on patient demographics | Race; age; ethnicity (Hispanic/non-Hispanic); marital status (married, divorced, separated, single, widowed, or partnered); gender; and language. |
| Features that are concerning diagnoses and calculated based on ICD-10 and ICD-9 diagnosis codes | No. of diagnoses of asthma; No. of diagnosis codes concerns ICD-10 and ICD-9; no. of primary asthma diagnoses; no. of years since first diagnosed with asthma in the data set; no. of diagnoses of status asthmaticus; whether the latest diagnoses of asthma is a primary one; the severity of the latest asthma diagnoses; the utmost exacerbation severity among all of the asthma diagnoses; no. of diagnoses of acute asthma; no. of days since the latest asthma diagnosis; the severity of the utmost severity of asthma diagnosis; no. of diagnosis codes of noncompliance with the medication regimen; no. of days since the latest diagnoses with acute asthma or status asthmaticus; the latest diagnoses of asthma that indicate the exacerbation severity (uncomplicated, exacerbation, or asthmaticus); allergic rhinitis; sleep apnea; gastrostomy tube; immunoglobulin A (IgA) deficiency; cystic fibrosis; cirrhosis; chronic obstructive pulmonary disease (COPD); no. of years since first diagnosed with COPD in the data set; vitamin D deficiency; upper respiratory tract infection; congestive heart failure; esophagitis; anxiety or depression; ischemic heart disease; eczema; obesity; paraplegia or hemiplegia; decreased tone; metastatic solid tumor; increased tone; pneumonia; vocal cord dysfunction; psoriasis; anaphylaxis; vasculitis; gastrointestinal obstruction; inflammatory bowel disease; dementia; mental disorder; breathing abnormality like dyspnea; mild liver disease; Alzheimer’s or Parkinson’s disease; pregnancy; myocardial infarction; folate deficiency; gastrointestinal bleeding; malignancy; moderate or severe liver disease; peripheral vascular disease; acquired immunodeficiency syndrome; peptic ulcer disease; cerebrovascular disease; gastroesophageal reflux; substance use; rheumatic disease; renal disease; diabetes without chronic complication; cataract; bronchopulmonary dysplasia; tracheostomy; sinusitis; and family history of asthma. |
| Features concerning medications | The sum of medications ordered; the sum of various medications ordered; no. of medication orders; the sum of medication refills authorized; the sum of asthma medications ordered; the sum of units of medications ordered; no. of medication orders concerning asthma; the sum of asthma medication refills authorized; the sum of various asthma medications ordered; the sum of units of medications ordered concerning asthma; no. of medication prescribers; no. of medication prescribers concerning asthma; the sum of short-acting beta-2 agonists (SABAs) ordered; the sum of units of SABAs ordered; the sum of refills authorized for SABAs; the sum of systemic corticosteroids ordered; the sum of units of systemic corticosteroids ordered; the sum of refills authorized for systemic corticosteroids; no. of reliever orders concerning asthma; the sum of refills authorized for asthma relievers; the sum of relievers ordered concerning asthma; the sum of diverse asthma relievers ordered; the sum of units of relievers ordered concerning asthma that are neither SABAs nor systemic corticosteroids; the sum of units of relievers ordered concerning asthma; the sum of relievers ordered concerning asthma that are neither SABAs nor systemic corticosteroids; the sum of controllers ordered concerning asthma; no. of controller orders concerning asthma; the sum of various asthma controllers ordered; the sum of units of controllers ordered concerning asthma; the sum of refills authorized for asthma controllers; the sum of refills authorized for inhaled corticosteroids; the sum of inhaled corticosteroids ordered; the sum of units of inhaled corticosteroids ordered; the sum of refills authorized for mast cell stabilizers; the sum of ordered for mast cell stabilizers; the sum of units of ordered for mast cell stabilizers; the sum of nebulizer medications ordered; no. of nebulizer medication orders; the sum of various nebulizer medications ordered; the sum of units of ordered concerning nebulizer medications; the sum of refills authorized for nebulizer medications; whether spacer was used; and whether nebulizer was used. |
| Features concerning insurances | Whether the patient enrolled in any public insurance; whether the patient was paid by charity or self-paid; and whether the patient enrolled in any private insurance. We calculate the features related to insurances on the last day of the specific year. |
| Features concerning the visit types of the patient | No. of ED visits; the latest length of stay of ED visit; no. of ED visits concerning asthma; the average ED visit’s length of stay; no. of outpatient visits; no. of all type (ED visit, hospital stay, and outpatient visit) of visits; no. of outpatient visits who diagnosed with asthma as the primary diagnosis; the total length of hospital stay; no. of hospitalizations; the average a hospitalization’s length of stay; the latest visit’s admission type (trauma, urgent, elective, or emergency); the most emergent hospital admission type among all of the visits; no. of prime asthma visits; and the latest visit’s type (ED visit, hospital stay, or outpatient visit). According to our prior paper [34], we defined a prime asthma visit as an ED visit with a diagnosis of asthma, a hospitalization with a diagnosis of asthma, or an outpatient visit with a primary diagnosis of asthma. An outpatient visit with only a secondary diagnosis of asthma was assigned as a minor asthma visit. |
| Features concerning appointment and visit status | No. of no shows; and no. of canceled appointments. |
| Features concerning the family location of the patient | Whether the distance from the patient’s home to UMW is less than 5-miles. |
Table A2.
The list of candidate features considered in model_2.
Table A2.
The list of candidate features considered in model_2.
| Feature Category | Features |
|---|---|
| Features on patient demographics | Race; age; ethnicity (Hispanic/non-Hispanic); marital status (married, divorced, separated, single, widowed, or partnered); gender; and language. |
Table A3.
The list of candidate features considered in model_3.
Table A3.
The list of candidate features considered in model_3.
| Feature Category | Features |
|---|---|
| Features on patient demographics | Race; age; ethnicity (Hispanic/non-Hispanic); marital status (married, divorced, separated, single, widowed, or partnered); gender; and language. |
| Features that are concerning diagnoses and calculated based on ICD-10 and ICD-9 diagnosis codes (Comorbidity features) | Allergic rhinitis; sleep apnea; cystic fibrosis; COPD; anxiety or depression; eczema; obesity; gastroesophageal reflux; bronchopulmonary dysplasia; and sinusitis. |
Table A4.
The features used in our final model and their importance values.
Table A4.
The features used in our final model and their importance values.
| Rank | Feature | Importance Calculated as the Feature’s Apportioned Contribution to the Model |
|---|---|---|
| 1 | No. of diagnoses | 0.5311 |
| 2 | No. of outpatient visits who diagnosed with asthma as the primary diagnosis | 0.0792 |
| 3 | No. of asthma diagnoses | 0.0102 |
| 4 | Whether the latest diagnosis of asthma is a primary one | 0.0078 |
| 5 | The severity of the latest asthma diagnoses | 0.0065 |
| 6 | No. of prime asthma visits | 0.0061 |
| 7 | No. of medication orders | 0.0059 |
| 8 | The sum of refills authorized for asthma controllers; | 0.0057 |
| 9 | No. of years since first diagnosed with asthma in the data set | 0.0057 |
| 10 | The sum of units of controllers ordered concerning asthma | 0.0050 |
| 11 | The severity of the utmost severity of asthma diagnosis | 0.0044 |
| 12 | Whether the patient has AIDS/HIV | 0.0044 |
| 13 | Whether the patient has mental disorder | 0.0043 |
| 14 | No. of ED visits concerning asthma | 0.0041 |
| 15 | The sum of units of relievers ordered concerning asthma | 0.0039 |
| 16 | Whether the patient has sinusitis | 0.0038 |
| 17 | The sum of units of SABAs ordered | 0.0038 |
| 18 | Whether the patient has substance use | 0.0038 |
| 19 | No. of outpatient visits | 0.0038 |
| 20 | No. of primary asthma diagnoses | 0.0038 |
| 21 | No. of all type (ED visit, hospital stay, and outpatient visit) of visits | 0.0038 |
| 22 | The sum of asthma medication refills authorized | 0.0038 |
| 23 | The sum of refills authorized for SABAs | 0.0036 |
| 24 | The total length of hospital stay | 0.0036 |
| 25 | No. of ED visits | 0.0035 |
| 26 | The sum of units of inhaled corticosteroids ordered | 0.0035 |
| 27 | Age | 0.0035 |
| 28 | Whether the patient is single | 0.0035 |
| 29 | Whether the patient is Hispanic | 0.0035 |
| 30 | The sum of refills authorized for inhaled corticosteroids | 0.0035 |
| 31 | No. of reliever orders concerning asthma | 0.0035 |
| 32 | Whether the patient has rhinitis | 0.0035 |
| 33 | Whether the patient has vitamin D deficiency | 0.0035 |
| 34 | Whether the patient was paid by charity or self-paid | 0.0034 |
| 35 | Whether the patient has psoriasis | 0.0034 |
| 36 | The sum of various asthma medications ordered | 0.0034 |
| 37 | Whether the distance from the patient’s home to UMW is less than 5-mile | 0.0034 |
| 38 | No. of diagnoses of status asthmaticus | 0.0034 |
| 39 | No. of controller orders concerning asthma | 0.0034 |
| 40 | No. of canceled appointments | 0.0033 |
| 41 | Whether the patient has dyspnea | 0.0033 |
| 42 | The sum of diverse asthma relievers ordered | 0.0033 |
| 43 | Whether the patient has pneumonia | 0.0032 |
| 44 | Whether the patient has rheumatic_disease | 0.0032 |
| 45 | No. of medication orders | 0.0032 |
| 46 | The sum of units of medications ordered | 0.0032 |
| 47 | The sum of refills authorized for systemic corticosteroids | 0.0032 |
| 48 | Whether the patient has COPD | 0.0032 |
| 49 | The sum of refills authorized for asthma relievers | 0.0032 |
| 50 | No. of no shows | 0.0031 |
| 51 | The sum of various asthma controllers ordered | 0.0031 |
| 52 | Whether the patient has folate deficiency | 0.0031 |
| 53 | The sum of units of systemic corticosteroids ordered | 0.0031 |
| 54 | The sum of SABAs ordered | 0.0031 |
| 55 | the average a hospitalization’s length of stay | 0.0031 |
| 56 | The sum of various medications ordered | 0.0031 |
| 57 | Whether the patient is pacific islander | 0.0031 |
| 58 | No. of diagnoses of acute asthma | 0.0031 |
| 59 | The sum of units of medications ordered | 0.0031 |
| 60 | No. of medication prescribers | 0.0030 |
| 61 | Whether the patient is married | 0.0030 |
| 62 | No. of medication prescribers concerning asthma | 0.0030 |
| 63 | Whether the patient is separated | 0.0030 |
| 64 | The sum of medication refills authorized | 0.0030 |
| 65 | Whether the patient has sleep apnea | 0.0030 |
| 66 | The sum of various nebulizer medications ordered | 0.0030 |
| 67 | Whether the patient has myocardial infarction | 0.0030 |
| 68 | The average ED visit’s length of stay | 0.0030 |
| 69 | Whether the patient has AP dementia | 0.0029 |
| 70 | Whether the patient has moderate or severe liver disease | 0.0029 |
| 71 | Whether the patient is female | 0.0029 |
| 72 | The utmost exacerbation severity among all of the asthma diagnoses | 0.0029 |
| 73 | Whether the patient is pregnant | 0.0029 |
| 74 | No. of diagnosis codes of noncompliance with the medication regimen | 0.0029 |
| 75 | Whether nebulizer was used | 0.0029 |
| 76 | Whether the patient is White | 0.0029 |
| 77 | Whether the patient has obesity diagnosis code | 0.0028 |
| 78 | Whether the patient enrolled in any public insurance | 0.0028 |
| 79 | No. of nebulizer medication orders | 0.0028 |
| 80 | Whether the patient has ischemic heart disease | 0.0028 |
| 81 | Whether spacer was used | 0.0028 |
| 82 | Whether the patient has peripheral vascular disease | 0.0028 |
| 83 | Whether the patient is widowed | 0.0028 |
| 84 | Whether the patient has inflammatory bowel disease | 0.0028 |
| 85 | Whether the patient enrolled in any private insurance | 0.0028 |
| 86 | Whether the patient has gastrointestinal bleeding | 0.0028 |
| 87 | Whether the patient has renal disease | 0.0028 |
| 88 | Whether the patient is Asian | 0.0028 |
| 89 | Whether the patient has reflux | 0.0027 |
| 90 | Whether the patient is Black | 0.0027 |
| 91 | Whether the patient has esophagitis | 0.0027 |
| 92 | The sum of units of ordered concerning nebulizer medications | 0.0027 |
| 93 | No. of years since first diagnosed with COPD in the data set | 0.0027 |
| 94 | Whether the patient has anxiety depression | 0.0027 |
| 95 | The sum of systemic corticosteroids ordered | 0.0027 |
| 96 | The severity of the utmost severity of asthma diagnosis | 0.0027 |
| 97 | Whether the patient has mild liver disease | 0.0026 |
| 98 | Whether the patient is divorced | 0.0026 |
| 99 | The sum of relievers ordered concerning asthma that are neither SABAs nor systemic corticosteroids | 0.0026 |
| 100 | The sum of units of inhaled corticosteroids ordered | 0.0026 |
| 101 | Whether the patient has vocal cord dysfunction | 0.0026 |
| 102 | Whether the patient speaks Spanish | 0.0025 |
| 103 | Whether the patient has eczema | 0.0025 |
| 104 | Whether the patient has diabetes with chronic complication | 0.0025 |
| 105 | Whether the patient has malignancy | 0.0024 |
| 106 | Whether the patient has gastrostomy tube | 0.0023 |
| 107 | Whether the patient has URTI | 0.0023 |
| 108 | The sum of units of relievers ordered concerning asthma that are neither SABAs nor systemic corticosteroids | 0.0023 |
| 109 | Whether the patient has anaphylaxis | 0.0023 |
| 110 | Whether the patient has metastatic | 0.0022 |
| 111 | Whether the patient has cerebrovascular | 0.0022 |
| 112 | Whether the patient has vasculitis | 0.0022 |
| 113 | No. of hospitalizations | 0.0022 |
| 114 | The sum of refills authorized for nebulizer medications | 0.0022 |
| 115 | Whether the patient has cirrhosis | 0.0020 |
| 116 | Whether the patient has diabetes without chronic complication | 0.0020 |
| 117 | Whether the patient speaks English | 0.0020 |
| 118 | Whether the patient has congestive heart failure | 0.0019 |
| 119 | Whether the patient has decreased tone | 0.0018 |
| 120 | Whether the patient has cystic fibrosis | 0.0017 |
| 121 | Whether the patient has increased tone | 0.0014 |
| 122 | Whether the patient has GI obstruction | 0.0012 |
| 123 | Whether the patient has hemiplegia | 0.0012 |
| 124 | Whether the patient has IgA deficiency | 0.0009 |
| 125 | Whether the patient has peptic ulcer disease | 0.0008 |
| 126 | Whether the patient has Charlson dementia | 0.0008 |
| 127 | Whether the patient has bronchiolitis | 0.0005 |
References
- Maarsingh, O.R.; Henry, Y.; van de Ven, P.M.; Deeg, D.J. Continuity of care in primary care and association with survival in older people: A 17-year prospective cohort study. Br. J. Gen. Pract. 2016, 66, e531–e539. [Google Scholar] [CrossRef]
- Christakis, D.A.; Wright, J.A.; Koepsell, T.D.; Emerson, S.; Connell, F.A. Is Greater Continuity of Care Associated With Less Emergency Department Utilization? Pediatrics 1999, 103, 738–742. [Google Scholar] [CrossRef] [PubMed]
- Bazemore, A.; Petterson, S.; Peterson, L.E.; Bruno, R.; Chung, Y.; Phillips, R.L. Higher Primary Care Physician Continuity is Associated With Lower Costs and Hospitalizations. Ann. Fam. Med. 2018, 16, 492–497. [Google Scholar] [CrossRef] [PubMed]
- Hussey, P.S.; Schneider, E.C.; Rudin, R.S.; Fox, D.S.; Lai, J.; Pollack, C.E. Continuity and the costs of care for chronic disease. JAMA Int. Med. 2014, 174, 742–748. [Google Scholar] [CrossRef] [PubMed]
- Saultz, J.W. Defining and measuring interpersonal continuity of care. Ann. Fam. Med. 2003, 1, 134–143. [Google Scholar] [CrossRef]
- Rose, D.; Sweeney, A.; Leese, M.; Clement, S.; Jones, I.R.; Burns, T.; Catty, J.; Wykes, T. Developing a user-generated measure of continuity of care: Brief report. Acta Psychiatr. Scand. 2009, 119, 320–324. [Google Scholar] [CrossRef] [PubMed]
- Salisbury, C.; Sampson, F.; Ridd, M.; Montgomery, A.A. How should continuity of care in primary health care be assessed? Br. J. Gen. Pract. 2009, 59, 276–282. [Google Scholar] [CrossRef] [PubMed]
- Haggerty, J.L.; Roberge, D.; Freeman, G.K.; Beaulieu, C.; Breton, M. Validation of a Generic Measure of Continuity of Care: When Patients Encounter Several Clinicians. Ann. Fam. Med. 2012, 10, 443–451. [Google Scholar] [CrossRef] [PubMed]
- Vogenberg, F.R. Predictive and prognostic models: Implications for healthcare decision-making in a modern recession. Am. Health Drug Benefits 2009, 2, 218–222. [Google Scholar]
- van Gemert-Pijnen, J.E.W.C.; Nijland, N.; van Limburg, M.; Ossebaard, H.C.; Kelders, S.M.; Eysenbach, G.; Seydel, E.R. A holistic framework to improve the uptake and impact of eHealth technologies. J. Med. Int. Res. 2011, 13, e111. [Google Scholar] [CrossRef] [PubMed]
- Most Recent National Asthma Data. Centers for Disease Control and Prevention. Available online: https://www.cdc.gov/asthma/most_recent_national_asthma_data.htm (accessed on 23 November 2021).
- Cyr, M.C.; Martens, A.C.; Berbiche, D.; Perreault, S.; Blais, L. Continuity of Care in the Ambulatory Treatment of Adolescents with Asthma. J. Adolesc. Health 2006, 39, 926.e11–926.e17. [Google Scholar] [CrossRef] [PubMed]
- Cree, M.; Bell, N.R.; Johnson, D.; Carriere, K.C. Increased continuity of care associated with decreased hospital care and emergency department visits for patients with asthma. Dis. Manag. 2006, 9, 63–71. [Google Scholar] [CrossRef] [PubMed]
- Greineder, D.K.; Loane, K.C.; Parks, P. A randomized controlled trial of a pediatric asthma outreach program. J. Allergy Clin. Immunol. 1999, 103, 436–440. [Google Scholar] [CrossRef]
- Kelly, C.S.; Morrow, A.L.; Shults, J.; Nakas, N.; Strope, G.L.; Adelman, R.D. Outcomes evaluation of a comprehensive intervention program for asthmatic children enrolled in medicaid. Pediatrics 2000, 105, 1029–1035. [Google Scholar] [CrossRef] [PubMed]
- Axelrod, R.C.; Zimbro, K.S.; Chetney, R.R.; Sabol, J.; Ainsworth, V.J. A disease management program utilizing life coaches for children with asthma. J. Clin. Outcomes Manag. 2001, 8, 38–42. [Google Scholar]
- Van Walraven, C.; Oake, N.; Jennings, A.; Forster, A.J. The association between continuity of care and outcomes: A systematic and critical review. J. Eval. Clin. Pract. 2010, 16, 947–956. [Google Scholar] [CrossRef] [PubMed]
- Lieu, T.A.; Quesenberry, C.P.; Sorel, M.E.; Mendoza, G.R.; Leong, A.B. Computer-based models to identify high-risk children with asthma. Am. J. Respir. Crit. Care Med. 1998, 157, 1173–1180. [Google Scholar] [CrossRef]
- Loymans, R.J.B.; Honkoop, P.J.; Termeer, E.H.; Snoeck-Stroband, J.B.; Assendelft, W.J.J.; Schermer, T.R.J.; Chung, K.F.; Sousa, A.R.; Sterk, P.J.; Reddel, H.K.; et al. Identifying patients at risk for severe exacerbations of asthma: Development and external validation of a multivariable prediction model. Thorax 2016, 71, 838–846. [Google Scholar] [CrossRef]
- Schatz, M.; Cook, E.F.; Joshua, A.; Petitti, D. Risk factors for asthma hospitalizations in a managed care organization: Development of a clinical prediction rule. Am. J. Manag. Care 2003, 9, 538–547. [Google Scholar] [CrossRef]
- Eisner, M.D.; Yegin, A.; Trzaskoma, B. Severity of asthma score predicts clinical outcomes in patients with moderate to severe persistent asthma. Chest 2012, 141, 58–65. [Google Scholar] [CrossRef] [PubMed]
- Sato, R.; Tomita, K.; Sano, H.; Ichihashi, H.; Yamagata, S.; Sano, A.; Yamagata, T.; Miyara, T.; Iwanaga, T.; Muraki, M.; et al. The Strategy for Predicting Future Exacerbation of Asthma Using a Combination of the Asthma Control Test and Lung Function Test. J. Asthma 2009, 46, 677–682. [Google Scholar] [CrossRef] [PubMed]
- Osborne, M.L.; Pedula, K.L.; O’Hollaren, M.; Ettinger, K.M.; Stibolt, T.; Buist, A.S.; Vollmer, W.M. Assessing future need for acute care in adult asthmatics: The Profile of Asthma Risk Study: A prospective health maintenance organization-based study. Chest 2007, 132, 1151–1161. [Google Scholar] [CrossRef]
- Miller, M.K.; Lee, J.H.; Blanc, P.D.; Pasta, D.J.; Gujrathi, S.; Barron, H.; Wenzel, S.E.; Weiss, S.T. TENOR Study Group TENOR risk score predicts healthcare in adults with severe or difficult-to-treat asthma. Eur. Respir. J. 2006, 28, 1145–1155. [Google Scholar] [CrossRef] [PubMed]
- Peters, D.; Chen, C.; Markson, L.E.; Allen-Ramey, F.C.; Vollmer, W.M. Using an asthma control questionnaire and administrative data to predict health-care utilization. Chest 2006, 129, 918–924. [Google Scholar] [CrossRef] [PubMed][Green Version]
- Yurk, R.A.; Diette, G.B.; Skinner, E.A.; Dominici, F.; Clark, R.D.; Steinwachs, D.M.; Wu, A.W. Predicting patient-reported asthma outcomes for adults in managed care. Am. J. Manag. Care 2004, 10, 321–328. [Google Scholar]
- Loymans, R.J.B.; Debray, T.P.A.; Honkoop, P.J.; Termeer, E.H.; Snoeck-Stroband, J.B.; Schermer, T.R.J.; Assendelft, W.J.J.; Timp, M.; Chung, K.F.; Sousa, A.R.; et al. Exacerbations in Adults with Asthma: A Systematic Review and External Validation of Prediction Models. J. Allergy Clin. Immunol. Pract. 2018, 6, 1942–1952. [Google Scholar] [CrossRef]
- Lieu, T.A.; Capra, A.M.; Quesenberry, C.P.; Mendoza, G.R.; Mazar, M. Computer-based models to identify high-risk adults with asthma: Is the glass half empty of half full? J. Asthma 1999, 36, 359–370. [Google Scholar] [CrossRef] [PubMed]
- Schatz, M.; Nakahiro, R.; Jones, C.H.; Roth, R.M.; Joshua, A.; Petitti, D. Asthma population management: Development and validation of a practical 3-level risk stratification scheme. Am. J. Manag. Care 2004, 10, 25–32. [Google Scholar] [PubMed]
- Grana, J.; Preston, S.; McDermott, P.D.; Hanchak, N.A. The use of administrative data to risk-stratify asthmatic patients. Am. J. Med. Qual. 1997, 12, 113–119. [Google Scholar] [CrossRef] [PubMed]
- Forno, E.; Fuhlbrigge, A.; Soto-Quirós, M.E.; Avila, L.; Raby, B.A.; Brehm, J.; Sylvia, J.M.; Weiss, S.T.; Celedón, J.C. Risk factors and predictive clinical scores for asthma exacerbations in childhood. Chest 2010, 138, 1156–1165. [Google Scholar] [CrossRef]
- Luo, G.; He, S.; Stone, B.L.; Nkoy, F.L.; Johnson, M.D. Developing a Model to Predict Hospital Encounters for Asthma in Asthmatic Patients: Secondary Analysis. JMIR Med. Inform. 2020, 8, e16080. [Google Scholar] [CrossRef]
- Luo, G.; Nau, C.L.; Crawford, W.W.; Schatz, M.; Zeiger, R.S.; Rozema, E.; Koebnick, C. Developing a Predictive Model for Asthma-Related Hospital Encounters in Patients With Asthma in a Large, Integrated Health Care System: Secondary Analysis. JMIR Med. Inform. 2020, 8, e22689. [Google Scholar] [CrossRef]
- Tong, Y.; Messinger, A.I.; Wilcox, A.B.; Mooney, S.D.; Davidson, G.H.; Suri, P.; Luo, G. Forecasting Future Asthma Hospital Encounters of Patients With Asthma in an Academic Health Care System: Predictive Model Development and Secondary Analysis Study. J. Med. Int. Res. 2021, 23, e22796. [Google Scholar] [CrossRef]
- da Nóbrega, V.M.; Silva, M.E.d.A.; Fernandes, L.T.B.; Viera, C.S.; Reichert, A.P.d.S.; Collet, N. Chronic disease in childhood and adolescence: Continuity of care in the Health Care Network. Rev. Esc. Enferm. 2017, 51, 1–8. [Google Scholar] [CrossRef] [PubMed]
- McDermott, A.; Sanderson, E.; Metcalfe, C.; Barnes, R.; Thomas, C.; Cramer, H.; Kessler, D. Continuity of care as a predictor of ongoing frequent attendance in primary care: A retrospective cohort study. BJGP Open 2020, 4, 101083. [Google Scholar] [CrossRef] [PubMed]
- Christakis, D.A.; Kazak, A.E.; Wright, J.A.; Zimmerman, F.J.; Bassett, A.L.; Connell, F.A. What Factors Are Associated with Achieving High Continuity of Care? Fam. Med. 2004, 36, 55–60. [Google Scholar] [PubMed]
- Aller, M.B.; Vargas, I.; Waibel, S.; Coderch, J.; Sánchez-Pérez, I.; Colomés, L.; Llopart, J.R.; Ferran, M.; Vázquez, M.L. A comprehensive analysis of patients’ perceptions of continuity of care and their associated factors. Int. J. Qual. Health Care 2013, 25, 291–299. [Google Scholar] [CrossRef]
- Schaefer, J.A.; Cronkite, R.; Ingudomnukul, E. Assessing continuity of care practices in substance use disorder treatment programs. J. Stud. Alcohol 2004, 65, 513–520. [Google Scholar] [CrossRef]
- Rubin, R.J.; Dietrich, K.A.; Hawk, A.D. Clinical and economic impact of implementing a comprehensive diabetes management program in managed care. J. Clin. Endocrinol. Metab. 1998, 83, 2635–2642. [Google Scholar] [CrossRef]
- Axelrod, R.C.; Vogel, D. Predictive Modeling in Health Plans. Dis. Manag. Health Outcomes 2003, 11, 779–787. [Google Scholar] [CrossRef]
- Desai, J.R.; Wu, P.; Nichols, G.A.; Lieu, T.A.; O’Connor, P.J. Diabetes and asthma case identification, validation, and representativeness when using electronic health data to construct registries for comparative effectiveness and epidemiologic research. Med. Care 2012, 50, S30. [Google Scholar] [CrossRef]
- Wakefield, D.B.; Cloutier, M.M. Modifications to HEDIS and CSTE algorithms improve case recognition of pediatric asthma. Pediatr. Pulmonol. 2006, 41, 962–971. [Google Scholar] [CrossRef] [PubMed]
- Bice, T.W.; Boxerman, S.B. A Quantitative Measure of Continuity of Care. Med. Care 1977, 15, 347–349. [Google Scholar] [CrossRef] [PubMed]
- Cheng, S.H.; Chen, C.C.; Hou, Y.F. A longitudinal examination of continuity of care and avoidable hospitalization: Evidence from a universal coverage health care system. Arch. Int. Med. 2010, 170, 1671–1677. [Google Scholar] [CrossRef]
- Tong, Y.; Liao, Z.C.; Tarczy-Hornoch, P.; Luo, G. Using a Constraint-Based Method to Identify Chronic Disease Patients Who Are Apt to Obtain Care Mostly Within a Given Health Care System: Retrospective Cohort Study. JMIR Form. Res. 2021, 5, e26314. [Google Scholar] [CrossRef] [PubMed]
- Chen, T.; Guestrin, C. XGBoost: A Scalable Tree Boosting System. In Proceedings of the 22nd ACM SIGKDD International Conference on Knowledge Discovery and Data Mining, New York, NY, USA, 13 August 2016; pp. 785–794. [Google Scholar]
- Wu, X.; Kumar, V.; Ross Quinlan, J.; Ghosh, J.; Yang, Q.; Motoda, H.; McLachlan, G.J.; Ng, A.; Liu, B.; Yu, P.S.; et al. Top 10 algorithms in data mining. Knowl. Inf. Syst. 2008, 14, 1–37. [Google Scholar] [CrossRef]
- McHugh, M.L. The Chi-square test of independence. Biochem. Med. 2013, 23, 143–149. [Google Scholar] [CrossRef]
- Hastie, T.; Tibshirani, R.; Friedman, J. The Elements of Statistical Learning; Springer Series in Statistics; Springer: New York, NY, USA, 2009; ISBN 978-0-387-84857-0. [Google Scholar]
- Kuhn, M.; Johnson, K. Applied Predictive Modeling; Springer: New York, NY, USA, 2013; ISBN 978-1-4614-6848-6. [Google Scholar]
- Asadi, H.; Dowling, R.; Yan, B.; Mitchell, P. Machine learning for outcome prediction of acute ischemic stroke post intra-arterial therapy. PLoS ONE 2014, 9, e88225. [Google Scholar] [CrossRef]
- Aubin, M.; Giguère, A.; Martin, M.; Verreault, R.; Fitch, M.I.; Kazanjian, A.; Carmichael, P.-H. Interventions to improve continuity of care in the follow-up of patients with cancer. Cochrane Database Syst. Rev. 2012. [Google Scholar] [CrossRef]
- Beddar, S.M.; Aikin, J.L. Continuity of care: A challenge for ambulatory oncology nursing. Semin. Oncol. Nurs. 1994, 10, 254–263. [Google Scholar] [CrossRef]
- Hong, J.S.; Kang, H.C.; Kim, J. Continuity of care for elderly patients with diabetes mellitus, hypertension, asthma, and chronic obstructive pulmonary disease in Korea. J. Korean Med. Sci. 2010, 25, 1259–1271. [Google Scholar] [CrossRef]
- Gill, J.M.; Mainous, A.G.; Nsereko, M. The effect of continuity of care on emergency department use. Arch. Fam. Med. 2000, 9, 333–338. [Google Scholar] [CrossRef] [PubMed]
- Moxley, D.P. The Practice of Case Management; Sage Publications: Newbury Park, CA, USA, 1989. [Google Scholar]
- Gustafson, D.; Wise, M.; Bhattacharya, A.; Pulvermacher, A.; Shanovich, K.; Phillips, B.; Lehman, E.; Chinchilli, V.; Hawkins, R.; Kim, J.S. The effects of combining web-based eHealth with telephone nurse case management for pediatric asthma control: A randomized controlled trial. J. Med. Int. Res. 2012, 14, e101. [Google Scholar] [CrossRef] [PubMed]
- Moore, S.; Wells, M.; Plant, H.; Fuller, F.; Wright, M.; Corner, J. Nurse specialist led follow-up in lung cancer: The experience of developing and delivering a new model of care. Eur. J. Oncol. Nurs. 2006, 10, 364–377. [Google Scholar] [CrossRef] [PubMed]
- Thomas, E.J.; Burstin, H.R.; O’Neil, A.C.; Orav, E.J.; Brennan, T.A. Patient noncompliance with medical advice after the emergency department visit. Ann. Emerg. Med. 1996, 27, 49–55. [Google Scholar] [CrossRef]
- Baren, J.M.; Shofer, F.S.; Ivey, B.; Reinhard, S.; DeGeus, J.; Stahmer, S.A.; Panettieri, R.; Hollander, J.E. A randomized, controlled trial of a simple emergency department intervention to improve the rate of primary care follow-up for patients with acute asthma exacerbations. Ann. Emerg. Med. 2001, 38, 115–122. [Google Scholar] [CrossRef]
- Johnson, P.H.; Wilkinson, I.; Sutherland, A.M.; Johnston, I.D.; Hall, I.P. Improving communication between hospital and primary care increases follow-up rates for asthmatic patients following casualty attendance. Respir. Med. 1998, 92, 289–291. [Google Scholar] [CrossRef]
- Petersen, D.L.; Murphy, D.E.; Jaffe, D.M.; Richardson, M.S.; Fisher, E.B.; Shannon, W.; Sussman, L.; Strunk, R.C. A tool to organize instructions at discharge after treatment of asthmatic children in an emergency department. J. Asthma 1999, 36, 597–603. [Google Scholar] [CrossRef]
- Welsh, E.J.; Hasan, M.; Li, P. Home-based educational interventions for children with asthma. Cochrane Database Syst. Rev. 2011. [Google Scholar] [CrossRef]
- Finkelstein, J.A.; Lozano, P.; Fuhlbrigge, A.L.; Carey, V.J.; Inui, T.S.; Soumerai, S.B.; Sullivan, S.D.; Wagner, E.H.; Weiss, S.T.; Weiss, K.B.; et al. Practice-level effects of interventions to improve asthma care in primary care settings: The Pediatric Asthma Care Patient Outcomes Research Team. Health Serv. Res. 2005, 40, 1737–1757. [Google Scholar] [CrossRef]
- Wiecha, J.M.; Adams, W.G.; Rybin, D.; Rizzodepaoli, M.; Keller, J.; Clay, J.M. Evaluation of a web-based asthma self-management system: A randomised controlled pilot trial. BMC Pulm. Med. 2015, 15, 17. [Google Scholar] [CrossRef] [PubMed]
- Gardner, A.; Kaplan, B.; Brown, W.; Krier-Morrow, D.; Rappaport, S.; Marcus, L.; Conboy-Ellis, K.; Mullen, A.; Rance, K.; Aaronson, D. National standards for asthma self-management education. Ann. Allergy Asthma Immunol. 2015, 114, 178–186. [Google Scholar] [CrossRef] [PubMed]
Publisher’s Note: MDPI stays neutral with regard to jurisdictional claims in published maps and institutional affiliations. |
© 2022 by the authors. Licensee MDPI, Basel, Switzerland. This article is an open access article distributed under the terms and conditions of the Creative Commons Attribution (CC BY) license (https://creativecommons.org/licenses/by/4.0/).