
Assessing the Visualization-Based Decision Support System for Environmental Impact Assessments

 , and
, and
Abstract
1. Introduction
2. Related Works
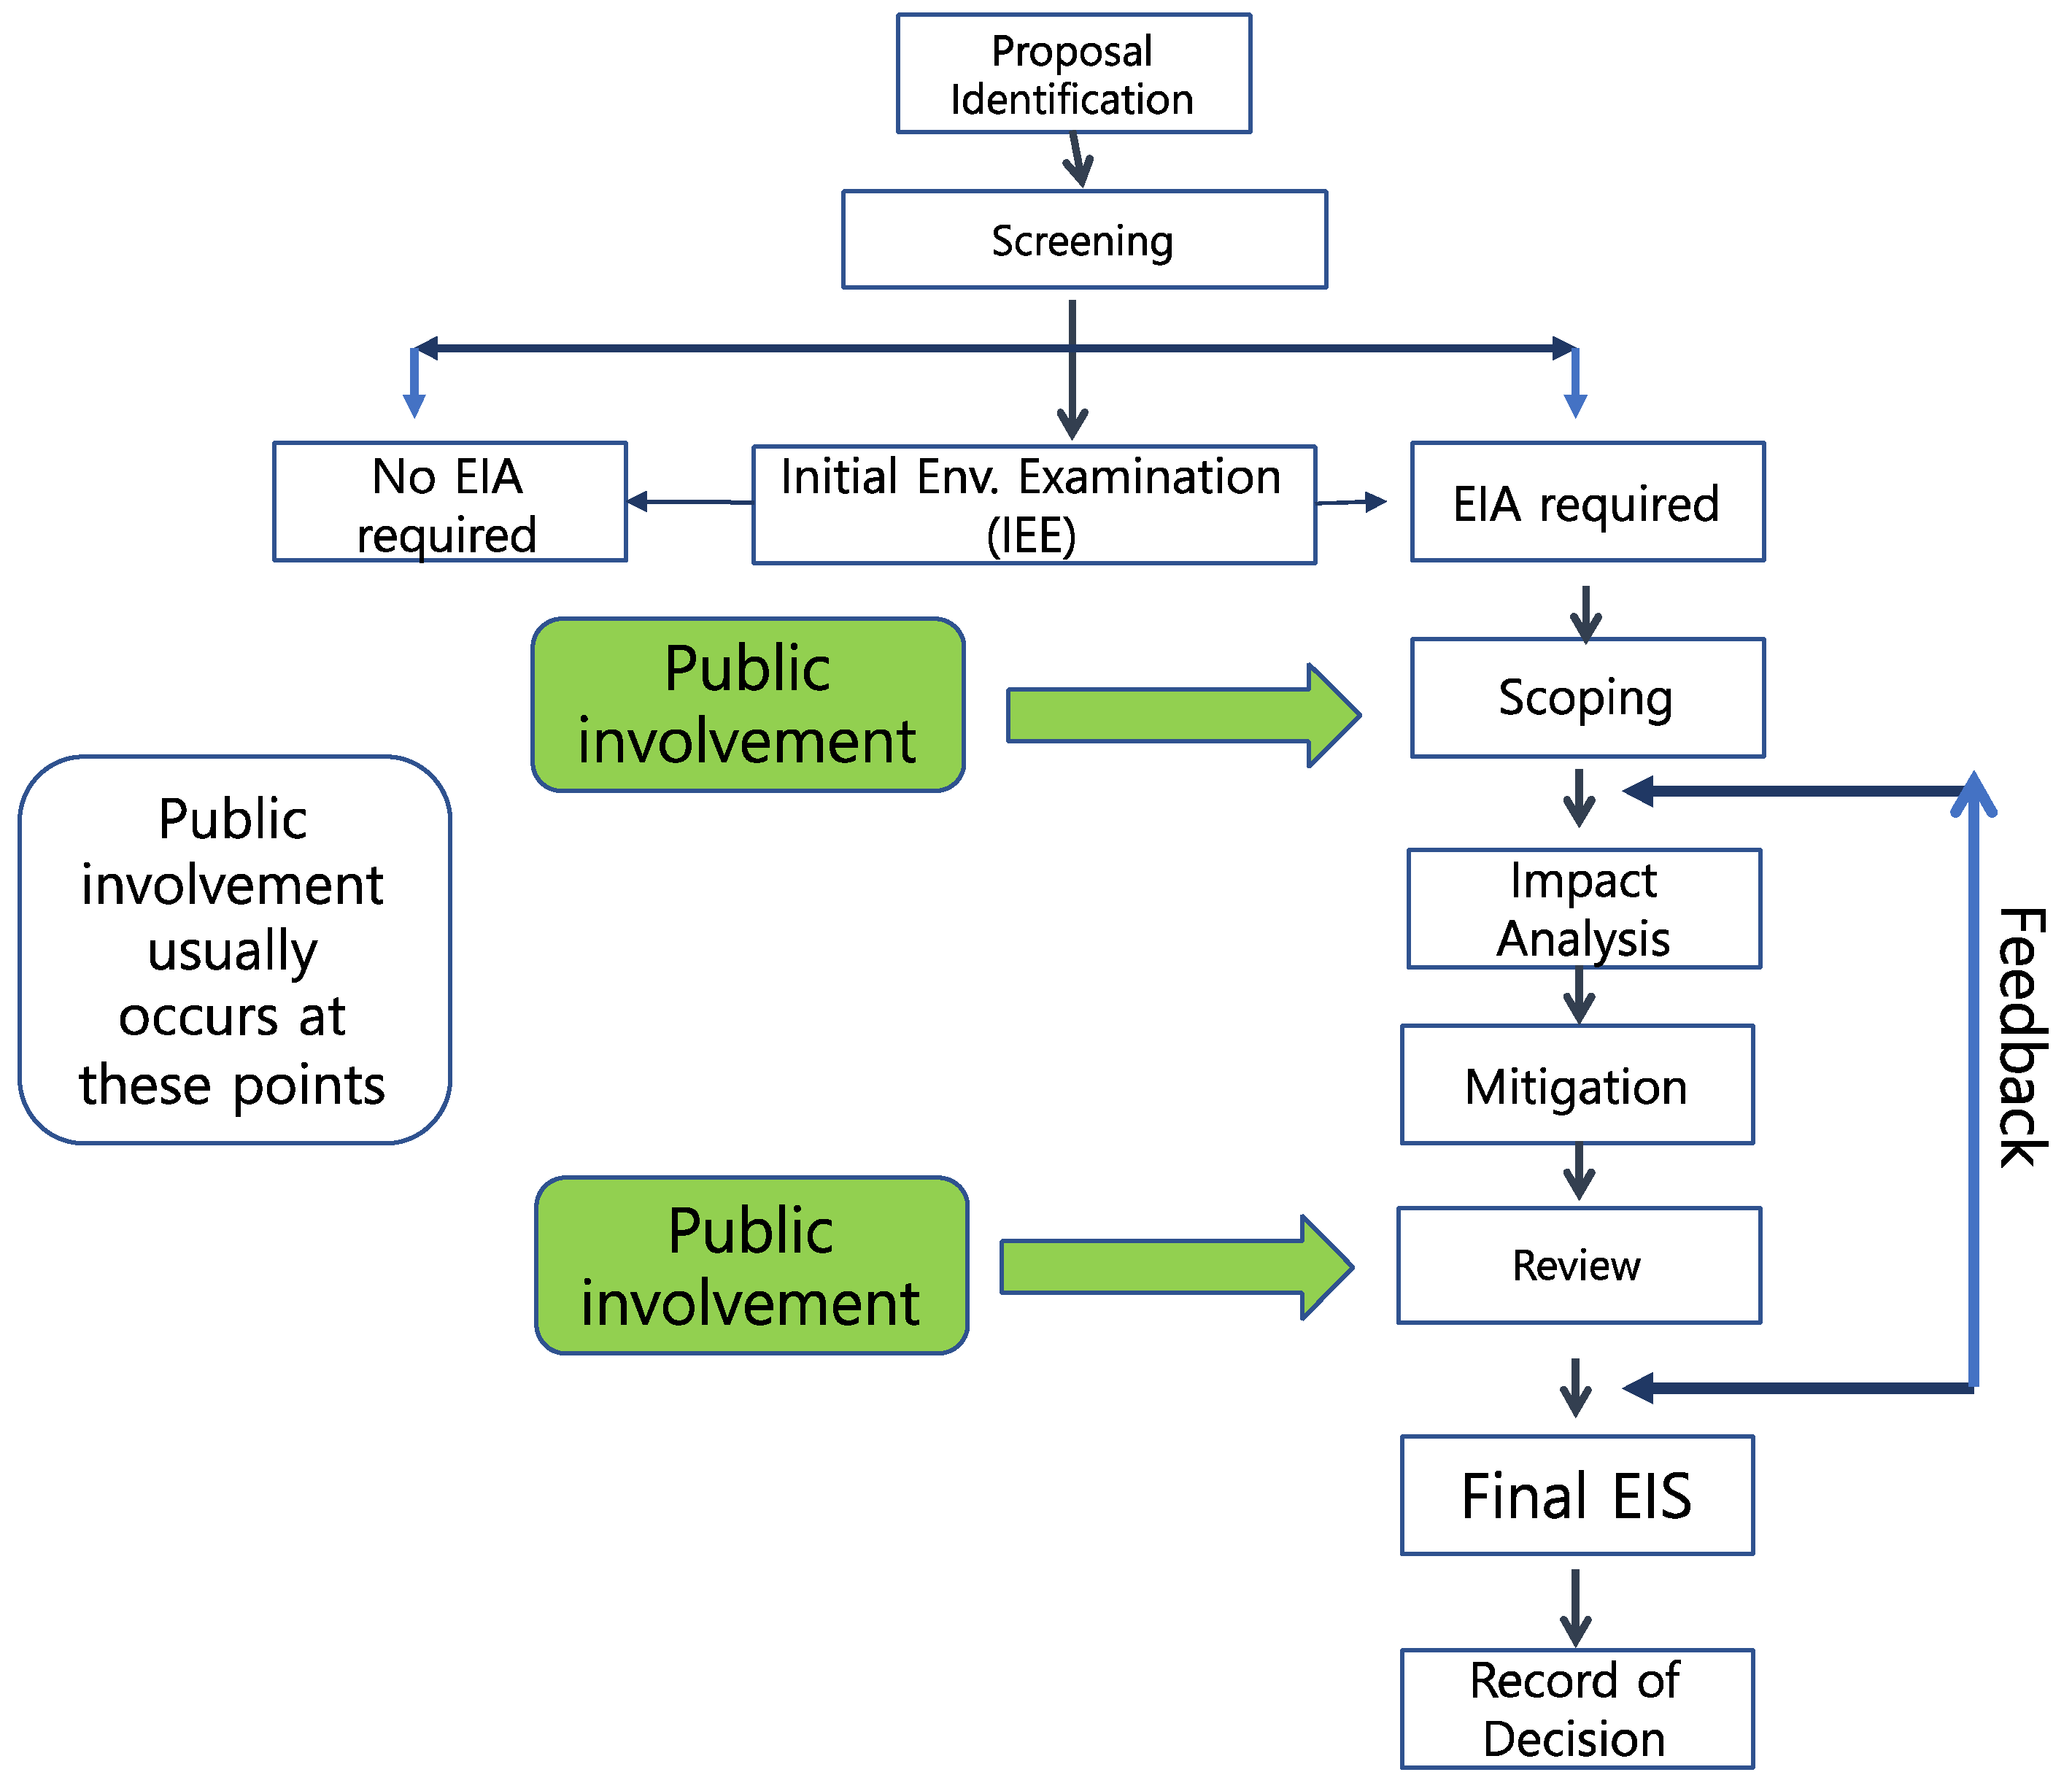
2.1. Environmental Impact Assessment (EIA)
2.2. Decision Support System (DSS)
3. User Analysis
3.1. System Design
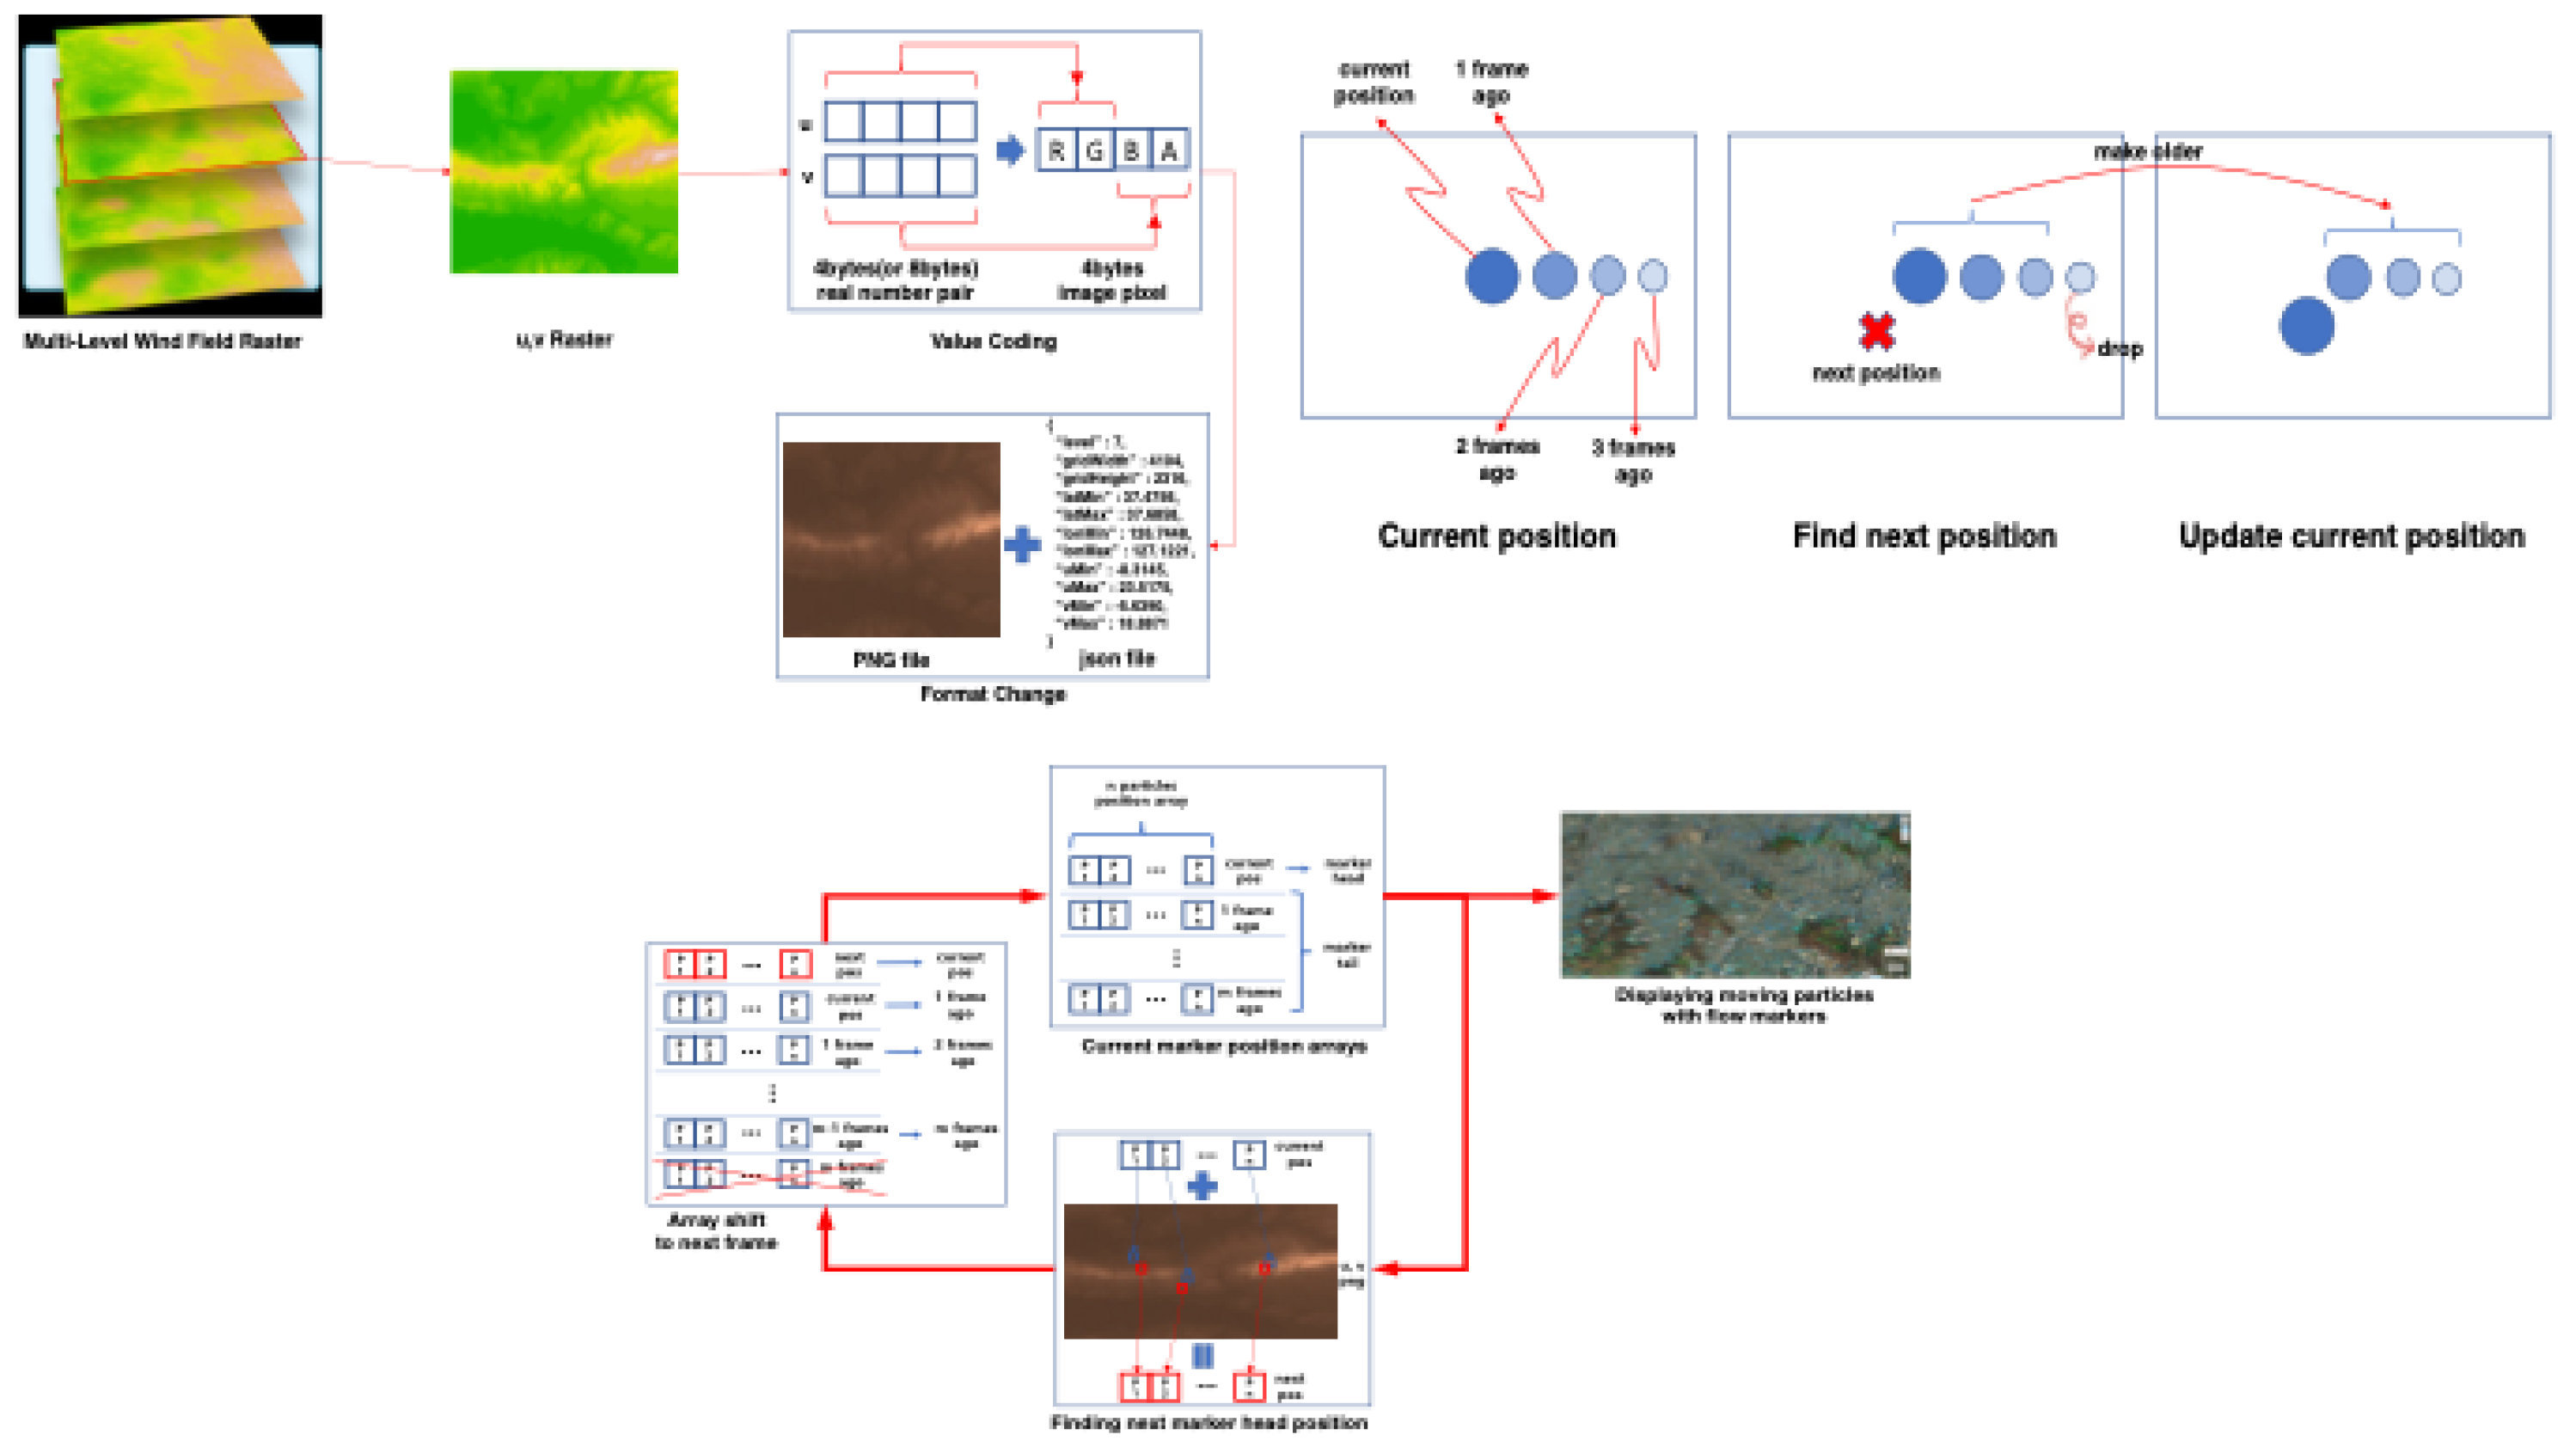
3.1.1. Algorithms and Models
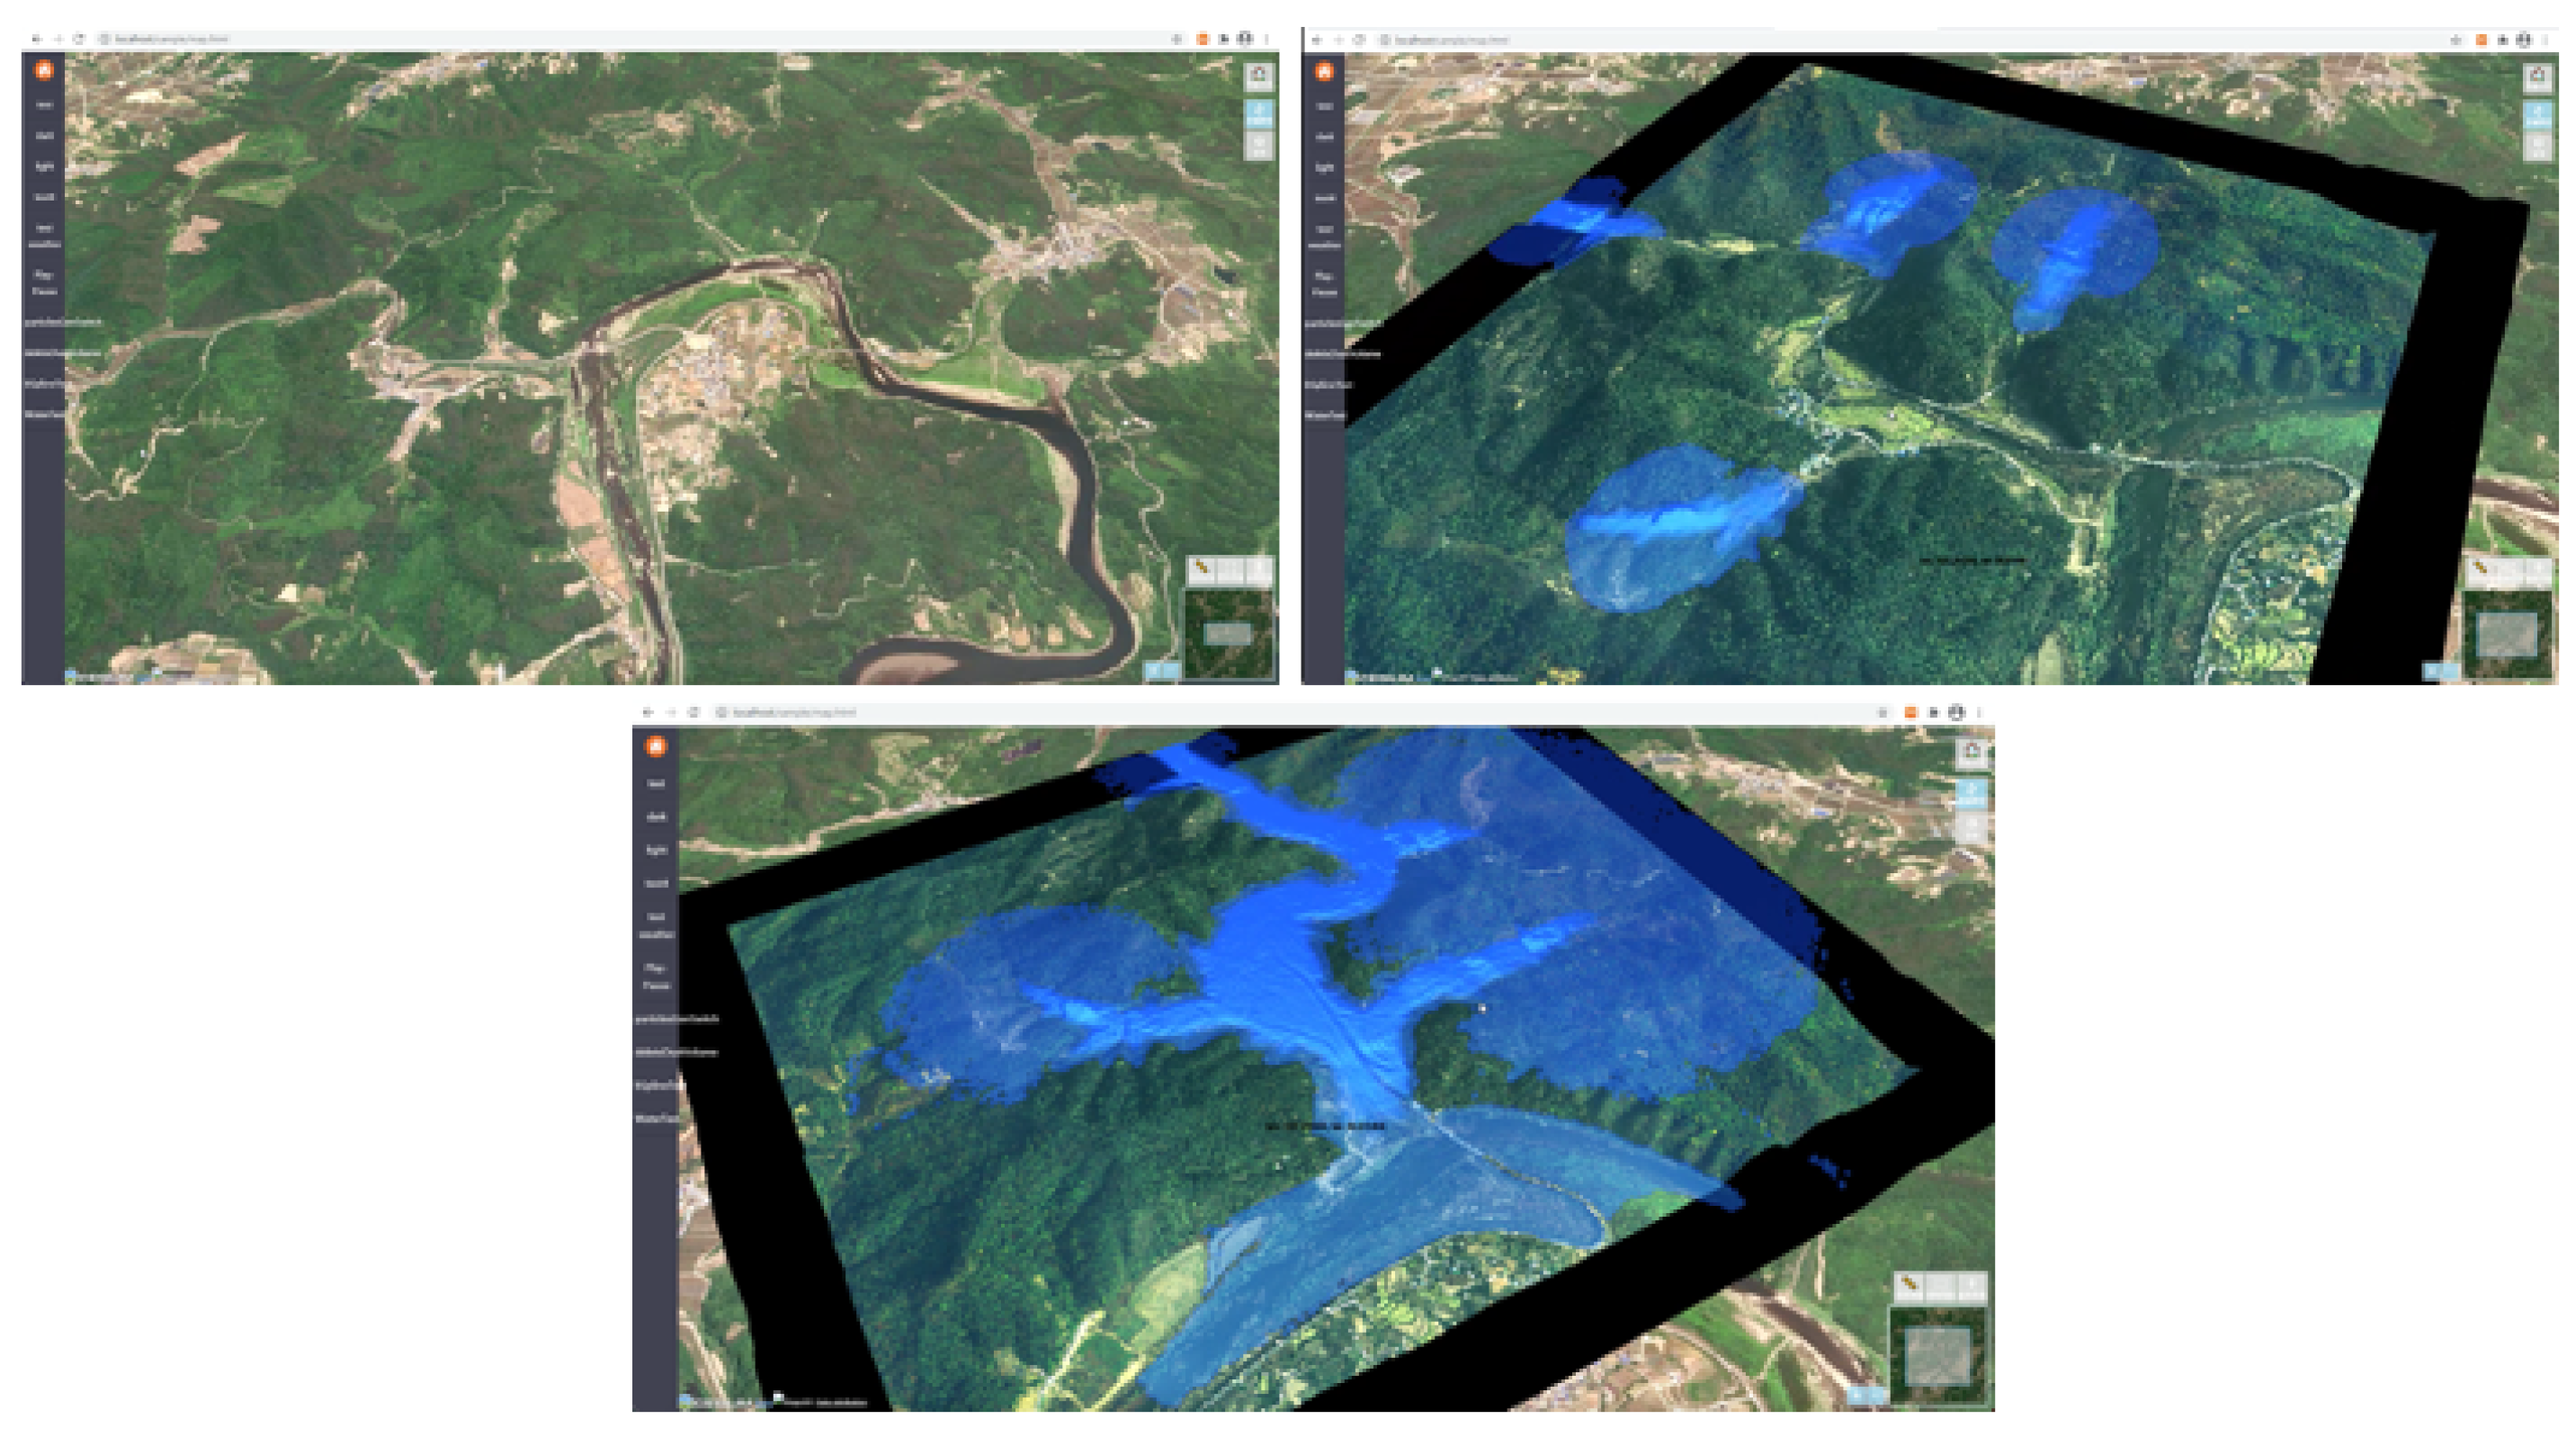
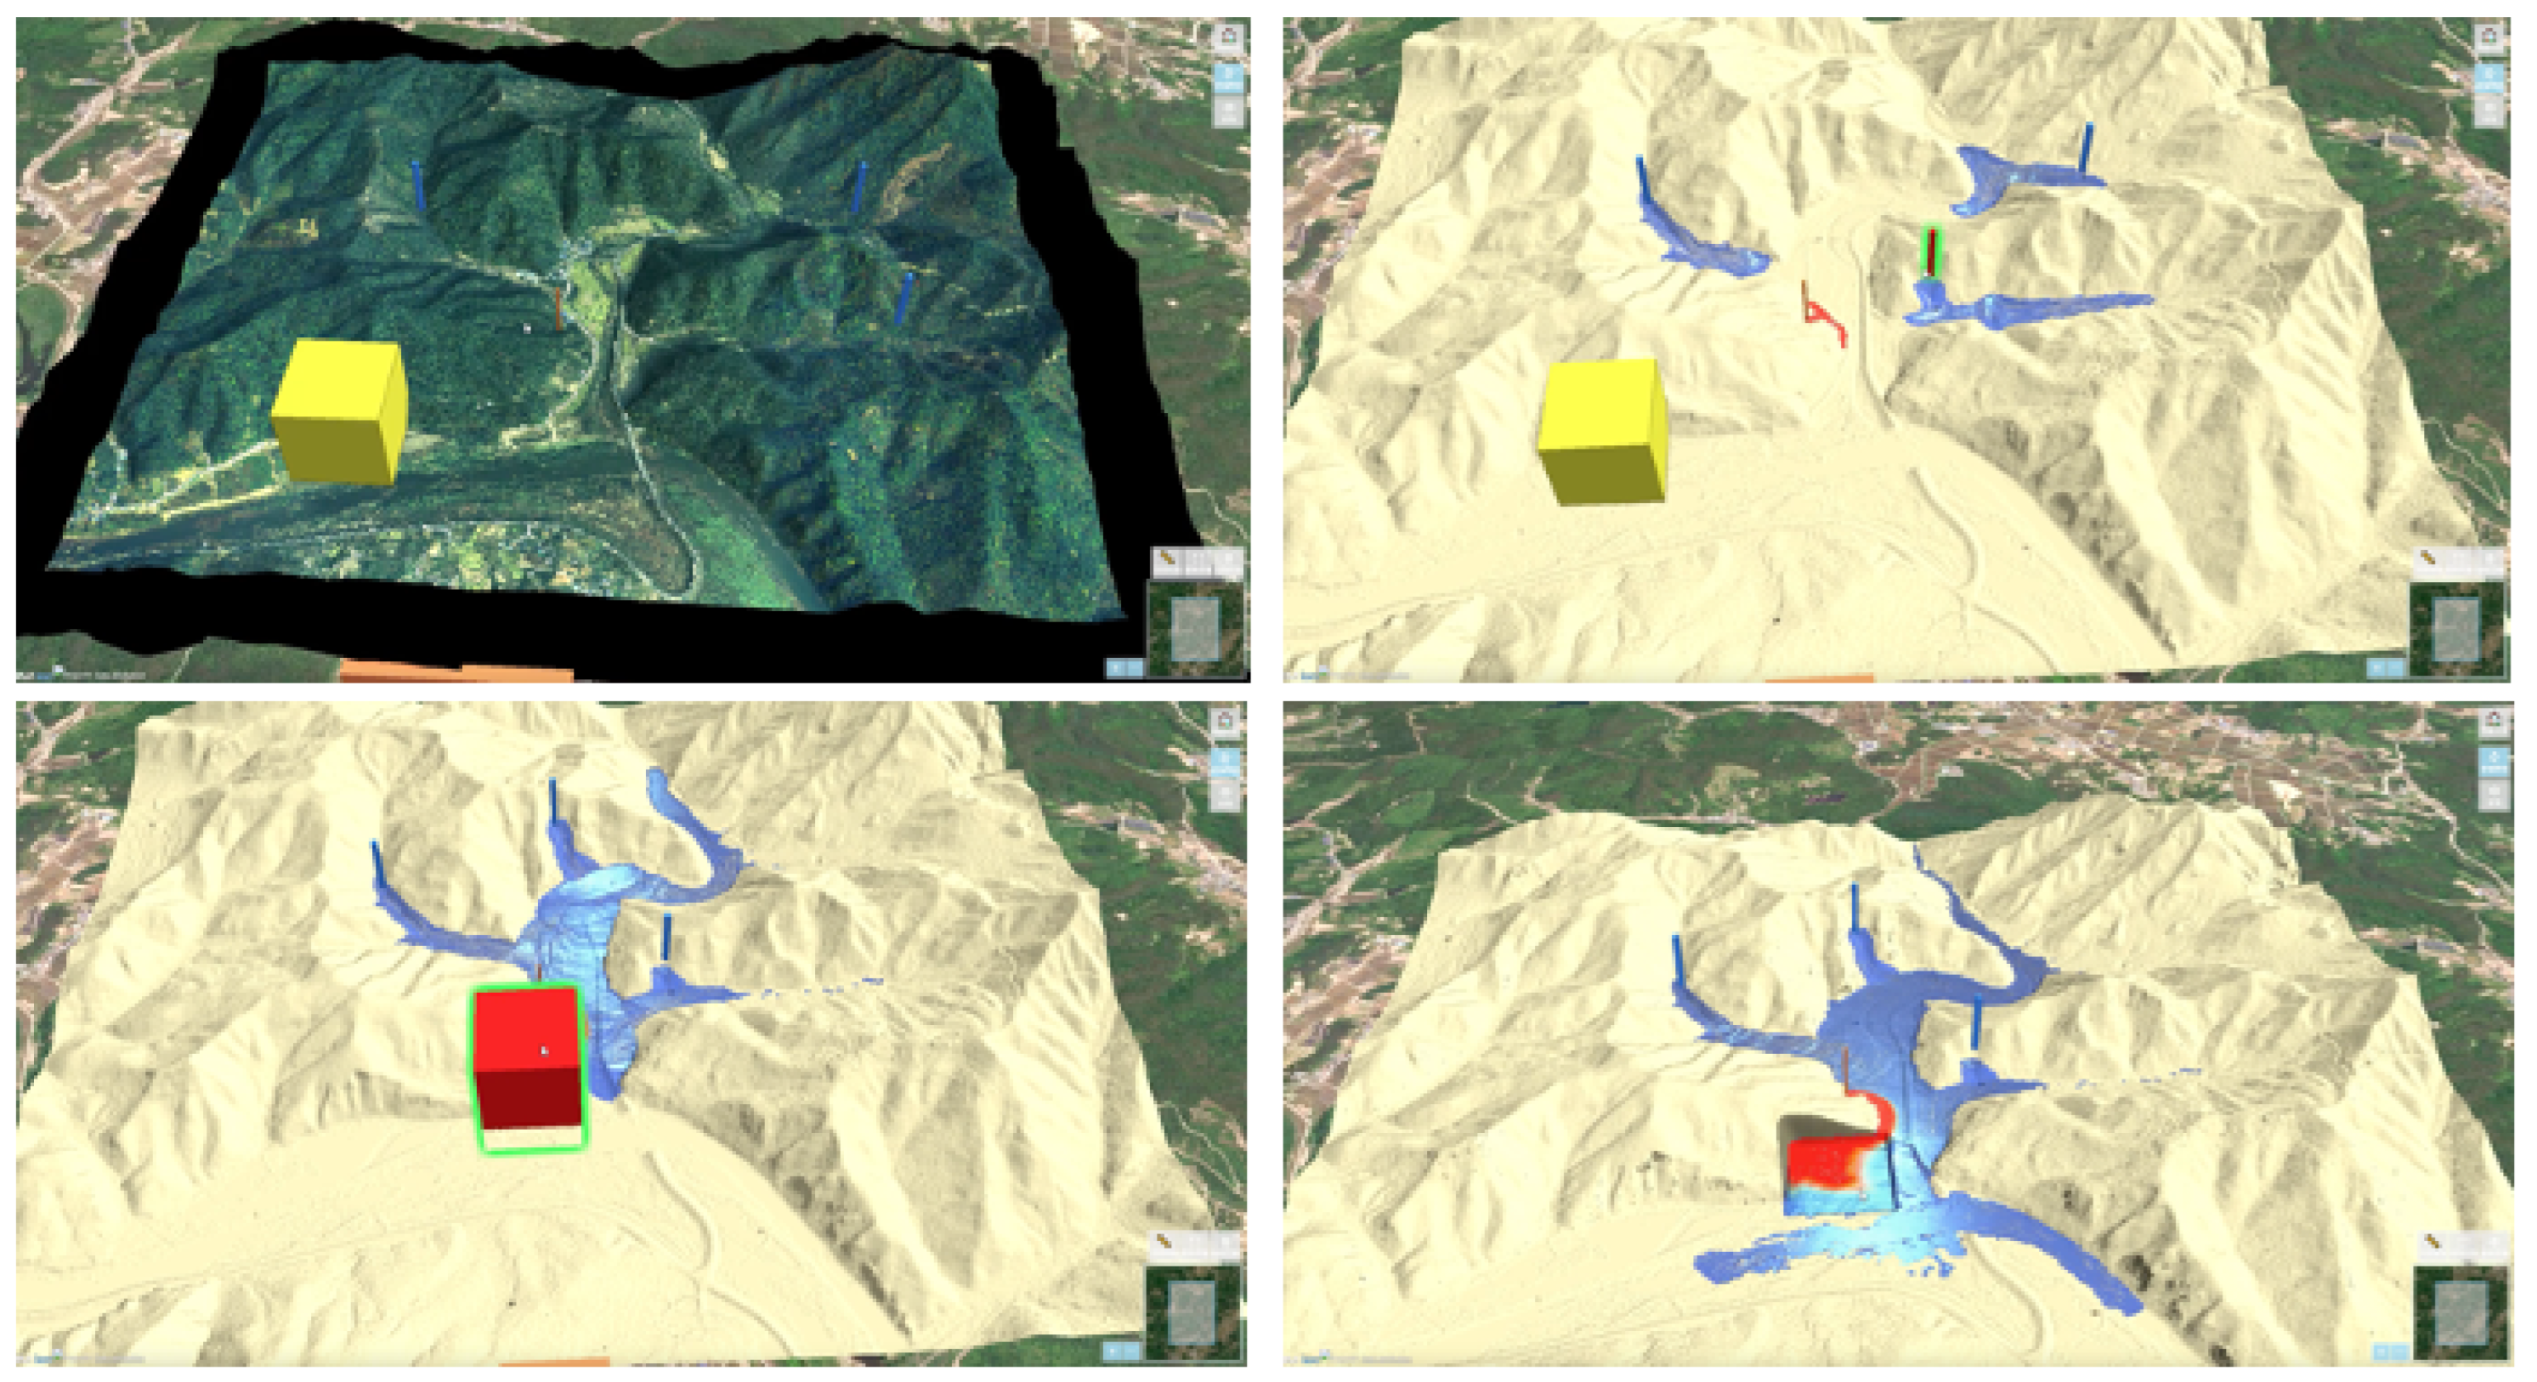
3.1.2. Hydrological Water Flow System
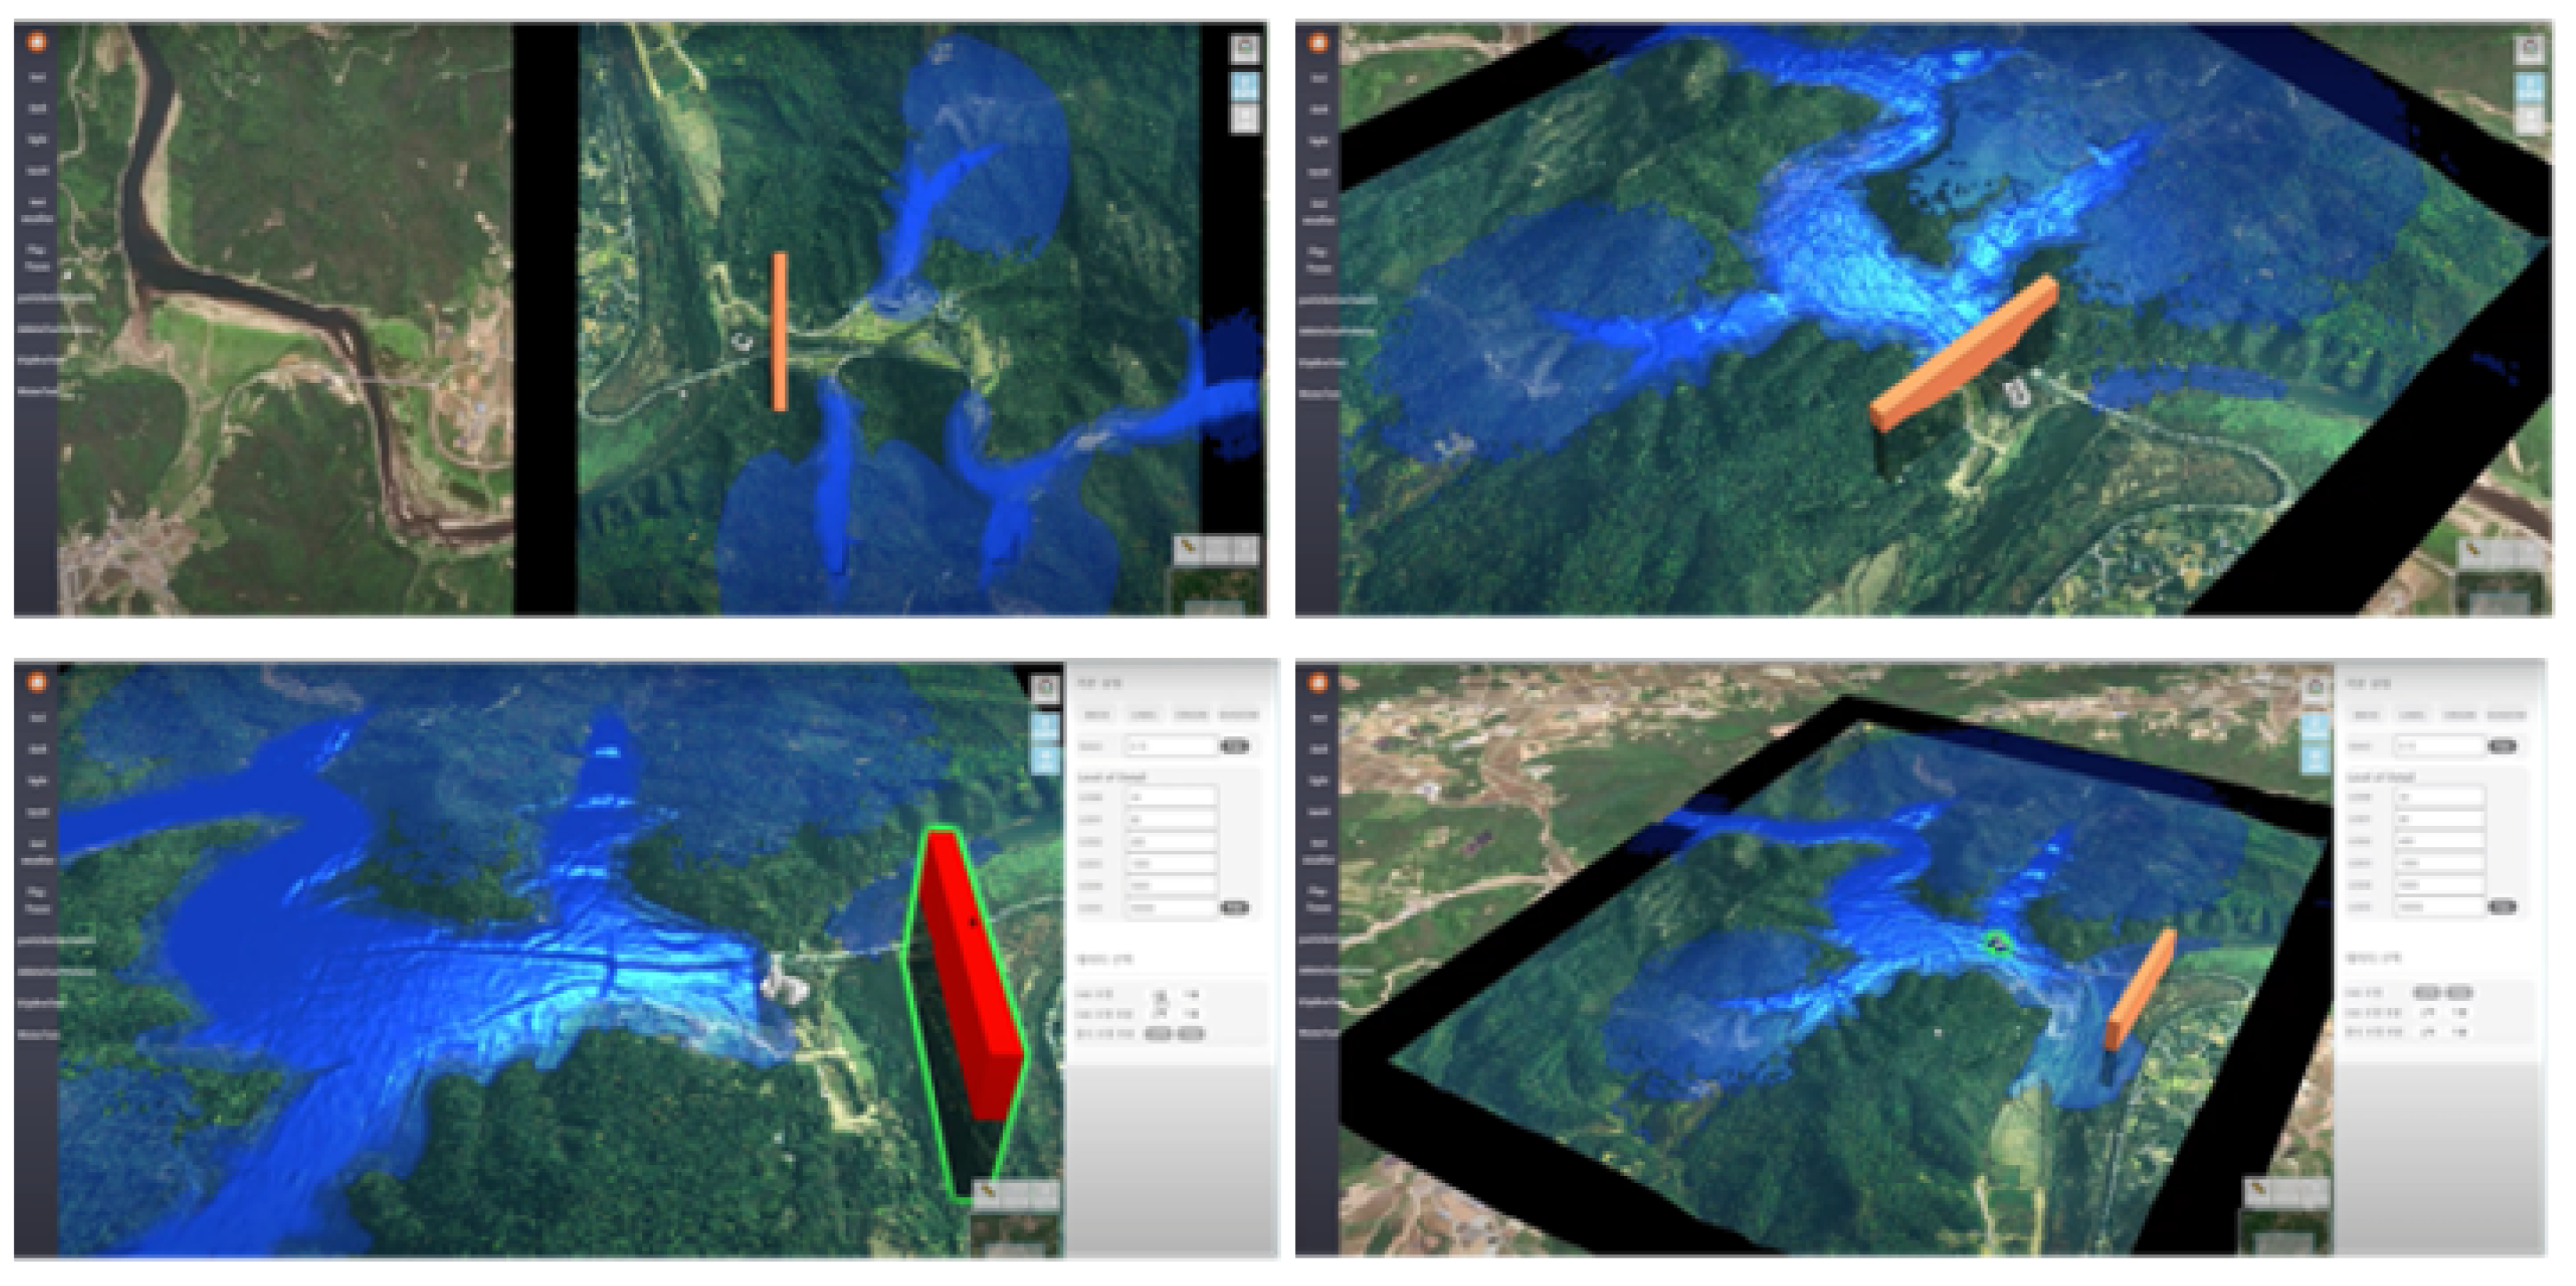
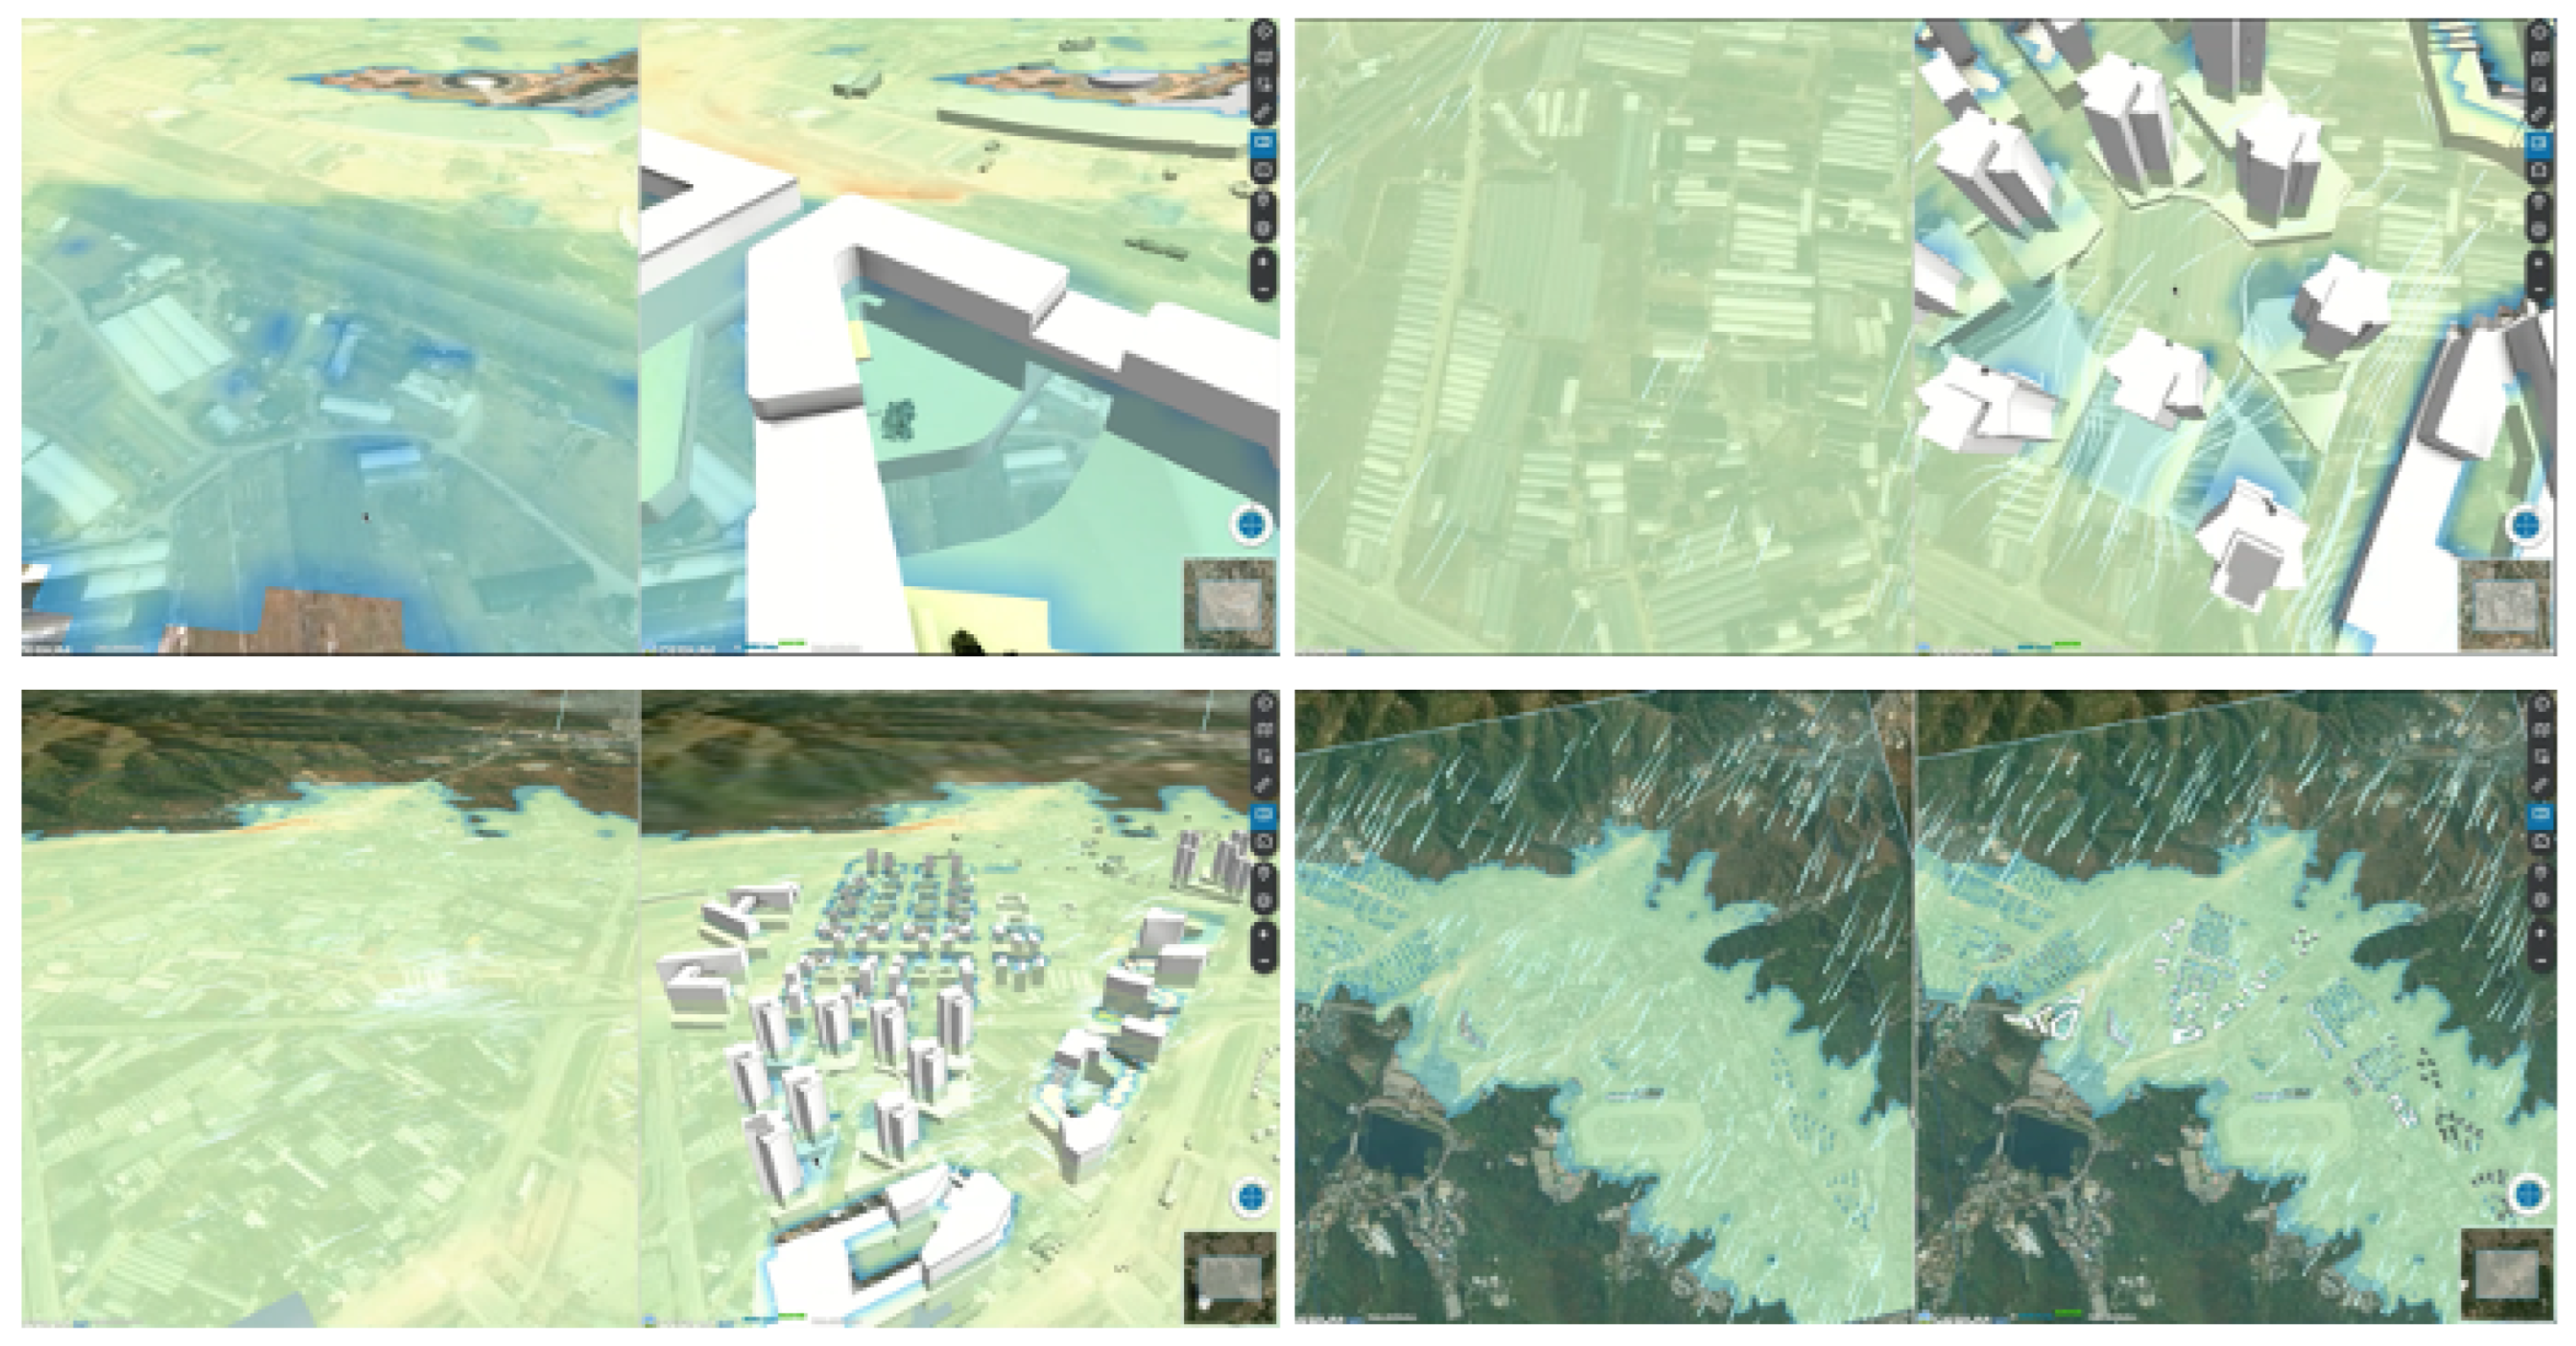
3.1.3. Interactive Water Simulation
3.1.4. Wind Simulation
3.1.5. Oil and Wastewater Simulation
3.2. Participants and Measurements
3.2.1. Computer Self-Efficacy Survey
3.2.2. System Usability Scale (SUS)
3.3. Procedures
4. Results
4.1. Impact of System Simulations on SUS Scores
4.2. Impacts of Individual Differences on SUS Scores
4.2.1. Environmental Expertise
4.2.2. Computer Self-Efficacy
4.2.3. Interaction Effect
5. Discussion
6. Limitations and Future Studies
7. Conclusions
Author Contributions
Funding
Institutional Review Board Statement
Informed Consent Statement
Conflicts of Interest
Appendix A. Computer Self-Efficiency Survey
- There was no one around to tell me what to do as I go.
- I had never used a package like it before.
- I had only the software manuals for reference.
- I had seen someone else using it before trying it myself.
- I could call someone for help if I got stuck.
- Someone else had helped me get started.
- I had a lot of time to complete the job for which the software was provided.
- I had just the built-in help facility for assistance.
- Someone showed me how to do it first.
- I had used similar packages before this one to do the same job.
Appendix B. System Usability Scale Survey Items
- I think that I would like to use this system frequently.
- I found the system unnecessarily complex.
- I thought the system was easy to use.
- I think that I would need the support of a technical person to be able to use this system.
- I found the various functions in this system were well integrated.
- I thought there was too much inconsistency in this system.
- I would imagine that most people would learn to use this system very quickly.
- I found the system very cumbersome to use.
- I felt very confident using the system.
- I needed to learn a lot of things before I could get going with this system.
References
- Makhdoum, M.F. Degradation model: A quantitative EIA instrument, acting as a Decision Support System (DSS) for environmental management. Environ. Manag. 2002, 30, 151–156. [Google Scholar] [CrossRef]
- Glasson, J.; Therivel, R. Introduction to Environmental Impact Assessment; Routledge: London, UK, 2019. [Google Scholar]
- United States National Environmental Policy Act of 1969. Available online: https://www.epa.gov/laws-regulations/summary-national-environmental-policy-act (accessed on 20 January 2022).
- Li, W.; Zhu, J.; Zhang, Y.; Cao, Y.; Hu, Y.; Fu, L.; Huang, P.; Xie, Y.; Yin, L.; Xu, B. A Fusion Visualization Method for Disaster Information Based on Self-Explanatory Symbols and Photorealistic Scene Cooperation. ISPRS Int. J. Geo-Inform. 2019, 8, 104. [Google Scholar] [CrossRef]
- Song, Y.-I.; Glasson, J. A new paradigm for Environmental Assessment (EA) in Korea. Environ. Impact Assess. Rev. 2010, 30, 90–99. [Google Scholar] [CrossRef]
- Partidario, M.R.; Monteiro, M.B. Strategic environmental assessment effectiveness in Portugal. Impact Assess. Proj. Apprais. 2019, 37, 247–265. [Google Scholar] [CrossRef]
- Therivel, R.; Gonzalez, A. Is SEA worth it? Short-term costs v. long-term benefits of strategic environmental assessment. Environ. Impact Assess. Rev. 2020, 83, 106411. [Google Scholar] [CrossRef]
- Kim, E.; Song, W.; Lee, D. A multi-scale metrics approach to forest fragmentation for Strategic Environmental Impact Assessment. Environ. Impact Assess. Rev. 2013, 42, 31–38. [Google Scholar] [CrossRef]
- Gill, L.; Kumar, V.K.; Lange, E.; Lerner, D.; Morgan, E.; Romano, D.; Shaw, E. An interactive visual decision support tool for sustainable urban river corridor management. In Proceedings of the International Environmental Modelling and Software Society (iEMSs) 2010 International Congress on Environmental Modelling and Software, Ottawa, ON, Canada, 5–8 July 2010. [Google Scholar]
- Isaacs, J.; Falconer, R.; Blackwood, D. A unique approach to visualising sustainability in the built environment. In Proceedings of the 2008 International Conference Visualisation, Washington, DC, USA, 9–11 July 2008; IEEE Xplore: Manhattan, NY, USA, 2008. [Google Scholar] [CrossRef]
- Cortes-Ramirez, J.; Sly, P.D.; Ng, J.; Jagals, P. Using human epidemiological analyses to support the assessment of the impacts of coal mining on health. Rev. Environ. Health 2019, 34, 391–401. [Google Scholar] [CrossRef]
- Caldwell, L.K. Environment: A New Focus for Public Policy? Public Admin. Rev. 1963, 23, 132–139. [Google Scholar] [CrossRef]
- Eom, S.B.; Lee, S.M.; Kim, E.B.; Somarajan, C. A survey of decision support system applications (1988–1994). J. Oper. Res. Soc. 1998, 49, 109–120. [Google Scholar] [CrossRef]
- Power, D.J. Decision Support Systems: Concepts and Resources for Managers; Greenwood/Quorum: Westport, CT, USA, 2002. [Google Scholar]
- Gunaratnam, M.; Alva-Argáez, A.; Kokossis, A.; Kim, J.-K.; Smith, R. Automated Design of Total Water Systems. Ind. Eng. Chem. Res. 2005, 44, 588–599. [Google Scholar] [CrossRef]
- Rodgers, P.A.; Huxor, A.P.; Caldwell, N.H.M. Design Support Using Distributed Web-Based AI Tools. Res. Eng. Des. 1999, 11, 31–44. [Google Scholar] [CrossRef]
- Bang, H.; Virós Martin, A.; Prat, A.; Selva, D. Daphne: An intelligent assistant for architecting earth observing satellite systems. In Proceedings of the 2018 AIAA Information Systems-AIAA Infotech@ Aerospace 2018, Kissimmee, FL, USA, 8–12 January 2018; p. 1366. [Google Scholar]
- Varma, V.K.; Ferguson, I.; Wild, I. Decision support system for the sustainable forest management. For. Ecol. Manag. 2000, 128, 49–55. [Google Scholar] [CrossRef]
- Sugumaran, R.; Meyer, J.C.; Davis, J. A Web-based environmental decision support system (WEDSS) for environmental planning and watershed management. J. Geogr. Syst. 2004, 6, 307–322. [Google Scholar] [CrossRef]
- Booty, W.; Lam, D.; Wong, I.; Siconolfi, P. Design and implementation of an environmental decision support system. Environ. Model. Softw. 2001, 16, 453–458. [Google Scholar] [CrossRef]
- Choi, S.-W.; Lee, E.-B.; Kim, J.-H. The Engineering Machine-Learning Automation Platform (EMAP): A Big-Data-Driven AI Tool for Contractors’ Sustainable Management Solutions for Plant Projects. Sustainability 2021, 13, 10384. [Google Scholar] [CrossRef]
- Relvas, H.; Miranda, A.I. An urban air quality modeling system to support decision-making: Design and implementation. Air Qual. Atmos. Health 2018, 11, 815–824. [Google Scholar] [CrossRef]
- Vogt, A.; Babel, F.; Hock, P.; Baumann, M.; Seufert, T. Immersive virtual reality or auditory text first? Effects of adequate sequencing and prompting on learning outcome. Br. J. Educ. Technol. 2021, 52, 2058–2076. [Google Scholar] [CrossRef]
- Li, W.; Zhu, J.; Fu, L.; Zhu, Q.; Xie, Y.; Hu, Y. An augmented representation method of debris flow scenes to improve public perception. Int. J. Geogr. Inf. Sci. 2020, 35, 1521–1544. [Google Scholar] [CrossRef]
- Gontier, M. Scale issues in the assessment of ecological impacts using a GIS-based habitat model—A case study for the Stockholm region. Environ. Impact Assess. Rev. 2007, 27, 440–459. [Google Scholar] [CrossRef]
- Narayanan, S.; McIlraith, S. Analysis and simulation of web services. Comput. Netw. 2003, 42, 675–693. [Google Scholar] [CrossRef]
- Chopard, B.; Droz, M. Cellular Automata; Springer: Berlin, Germany, 1998; Volume 1. [Google Scholar]
- Št’ava, O.; Beneš, B.; Brisbin, M.; Křivánek, J. Interactive terrain modeling using hydraulic erosion. In Proceedings of the 2008 ACM SIGGRAPH/Eurographics Symposium on Computer Animation 2008, Dublin, Ireland, 7–9 July 2008; pp. 201–210. [Google Scholar]
- Murphy, C.A.; Coover, D.; Owen, S.V. Development and Validation of the Computer Self-Efficacy Scale. Educ. Psychol. Meas. 1989, 49, 893–899. [Google Scholar] [CrossRef]
- Brooke, J. SUS: A ’Quick and Dirty’ Usability Scale. Usability Eval. Ind. 1996, 189, 4–7. [Google Scholar]
- Lewis, J.R. The System Usability Scale: Past, Present, and Future. Int. J. Hum.-Comput. Interact. 2018, 34, 577–590. [Google Scholar] [CrossRef]
- Compeau, D.R.; Higgins, C.A. Computer Self-Efficacy: Development of a Measure and Initial Test. MIS Q. 1995, 19, 189–211. [Google Scholar] [CrossRef]
- The World Bank. Participation Sourcebook; ESD: Washington, DC, USA, 1996. [Google Scholar]
- Glucker, A.N.; Driessen, P.; Kolhoff, A.; Runhaar, H.A. Public participation in environmental impact assessment: Why, who and how? Environ. Impact Assess. Rev. 2013, 43, 104–111. [Google Scholar] [CrossRef]
- Hartley, N.; Wood, C. Public participation in environmental impact assessment—Implementing the Aarhus Convention. Environ. Impact Assess. Rev. 2005, 25, 319–340. [Google Scholar] [CrossRef]
- Sheppard, S.R.J. Guidance for crystal ball gazers: Developing a code of ethics for landscape visualization. Landsc. Urban Plan. 2001, 54, 183–199. [Google Scholar] [CrossRef]
- IAP2. Student Workbook—Planning for Effective Public Participation; International Association for Public Participation: Montreal, QC, Canada, 2006. [Google Scholar]
- Partidário, M.R.; Sheate, W.R. Knowledge brokerage—Potential for increased capacities and shared power in impact assessment. Environ. Impact Assess. Rev. 2013, 39, 26–36. [Google Scholar] [CrossRef]
- Partidärio, M.R. A strategic advocacy role in sea for sustainability. J. Environ. Assess. Policy Manag. 2015, 17, 1550015. [Google Scholar] [CrossRef]


| Environment (No. of Items) | Items |
|---|---|
| Atmospheric (4) | Weather, air quality, odors, greenhouse gas emissions |
| Soil (3) | Land use, soil, topographic/geological features |
| Water (3) | Water quality (ground and underground), hydraulics/hydrology, marine environment |
| Living (6) | Environmentally friendly resource circulation, noise/vibrations, recreation/landscape, hygiene and public health, radio interference, barriers to daylight |
| Bio-ecological (2) | Plants and animals (land and ocean), natural environmental assets |
| Socio-economic (3) | Population, housing, and industry |
| Dependent Variable | Hydrological Water Flow | Interactive Water | Wind | Oil and Wastewater |
|---|---|---|---|---|
| SUS Score | 3.43 (1.47) | 3.37 (1.46) | 3.49 (1.41) | 3.33 (1.52) |
| Factor | Estimate | Standard Error | DFDen | T Ratio | Prob > |t| |
|---|---|---|---|---|---|
| Intercept | 2.924 | 0.344 | 243.1 | 8.50 | <0.0001 * |
| Computer Self-Efficacy | 0.102 | 0.039 | 307 | 2.61 | 0.0095 ** |
| Environmental Expertise | 0.631 | 0.074 | 305.9 | 8.50 | <0.0001 *** |
| Computer Self-Efficacy * Environmental Expertise | 0.173 | 0.039 | 307.9 | 4.48 | <0.0001 *** |
Publisher’s Note: MDPI stays neutral with regard to jurisdictional claims in published maps and institutional affiliations. |
© 2022 by the authors. Licensee MDPI, Basel, Switzerland. This article is an open access article distributed under the terms and conditions of the Creative Commons Attribution (CC BY) license (https://creativecommons.org/licenses/by/4.0/).
Share and Cite
Lee, S.-y.; Shin, S.; Kim, H.; Kim, M.-K.; Yoon, S.-Y.; Lee, S. Assessing the Visualization-Based Decision Support System for Environmental Impact Assessments. Int. J. Environ. Res. Public Health 2022, 19, 1345. https://doi.org/10.3390/ijerph19031345
Lee S-y, Shin S, Kim H, Kim M-K, Yoon S-Y, Lee S. Assessing the Visualization-Based Decision Support System for Environmental Impact Assessments. International Journal of Environmental Research and Public Health. 2022; 19(3):1345. https://doi.org/10.3390/ijerph19031345
Chicago/Turabian StyleLee, Seo-young, Sanghee Shin, Hakjoon Kim, Min-Kyung Kim, So-Yeon Yoon, and Sangdon Lee. 2022. "Assessing the Visualization-Based Decision Support System for Environmental Impact Assessments" International Journal of Environmental Research and Public Health 19, no. 3: 1345. https://doi.org/10.3390/ijerph19031345
APA StyleLee, S.-y., Shin, S., Kim, H., Kim, M.-K., Yoon, S.-Y., & Lee, S. (2022). Assessing the Visualization-Based Decision Support System for Environmental Impact Assessments. International Journal of Environmental Research and Public Health, 19(3), 1345. https://doi.org/10.3390/ijerph19031345