
Burnout Assessment Tool (BAT): Validity Evidence from Brazil and Portugal

 ,
,  , ,
, ,
Abstract
:1. Introduction
1.1. Burnout Assessment Tool (BAT)
1.2. Research Hypotheses
2. Methods
2.1. Sampling, and Data Collection
2.2. Constructs and Psychometric Instruments
2.2.1. Job Burnout
2.2.2. Work Engagement
2.2.3. Co-Worker Support
2.2.4. Role Clarity
2.2.5. Work Overload
2.2.6. Negative Change
2.3. Procedure
2.4. Data Analysis
3. Results
3.1. Descriptive Statistics of Study Participants
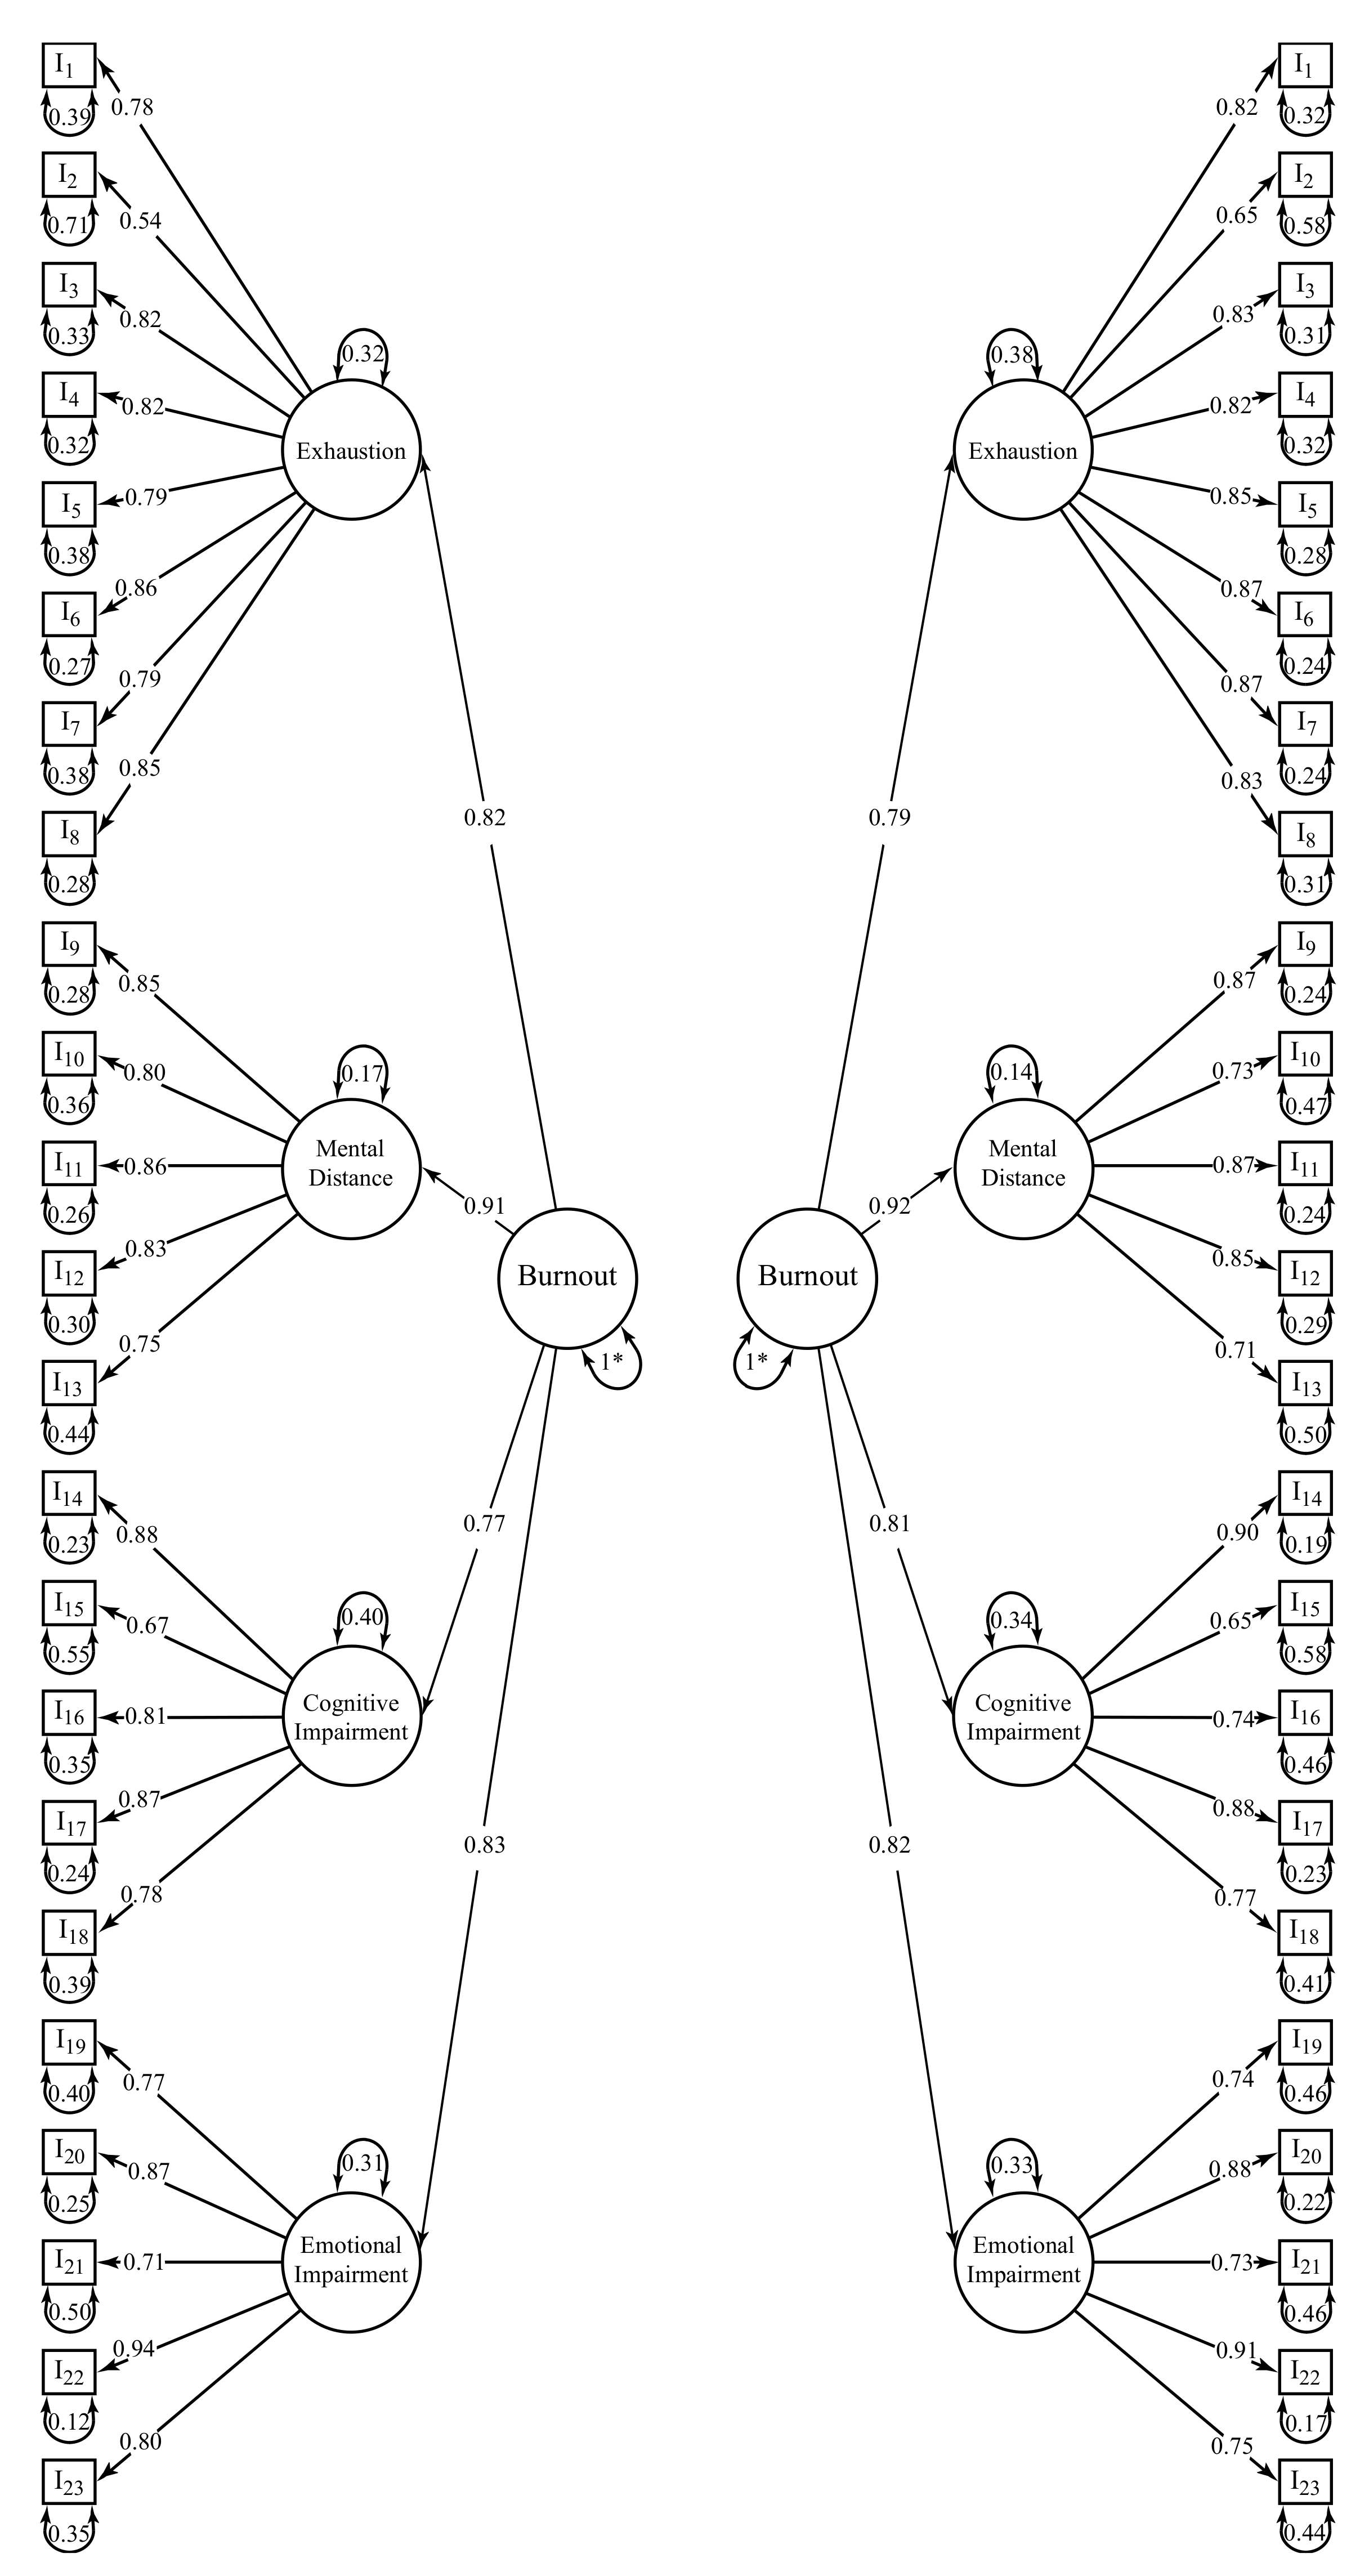
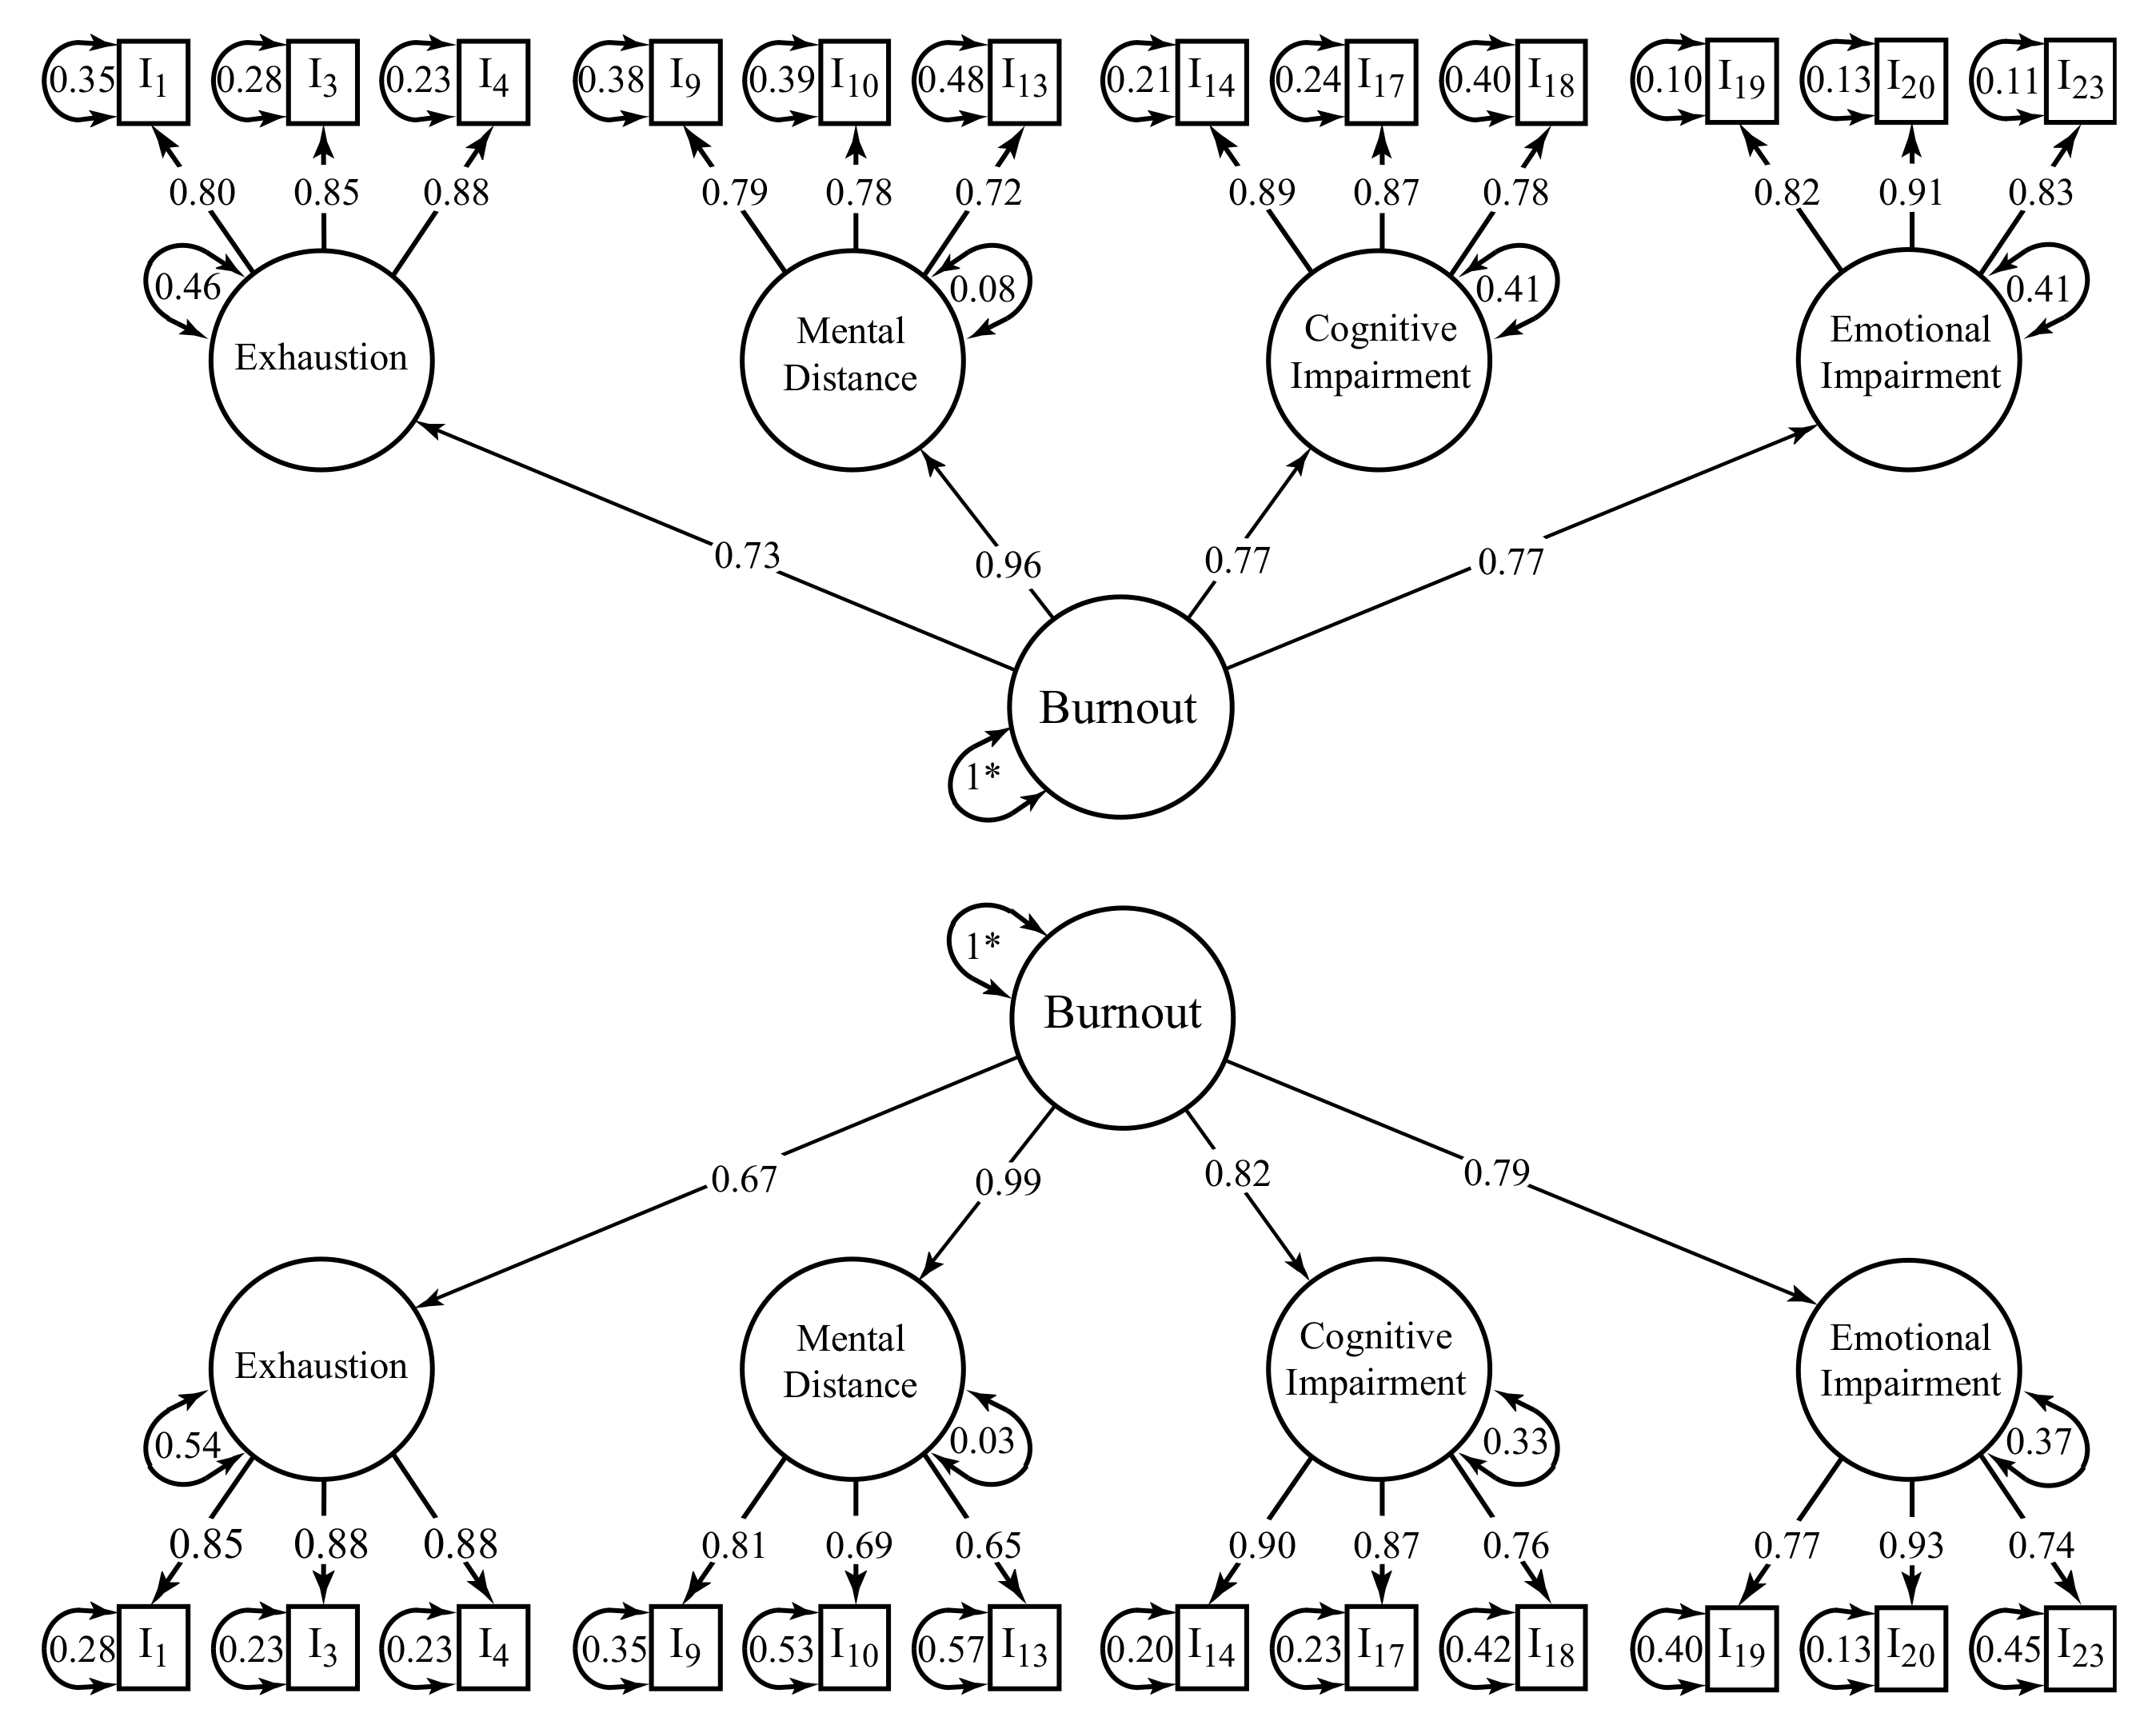
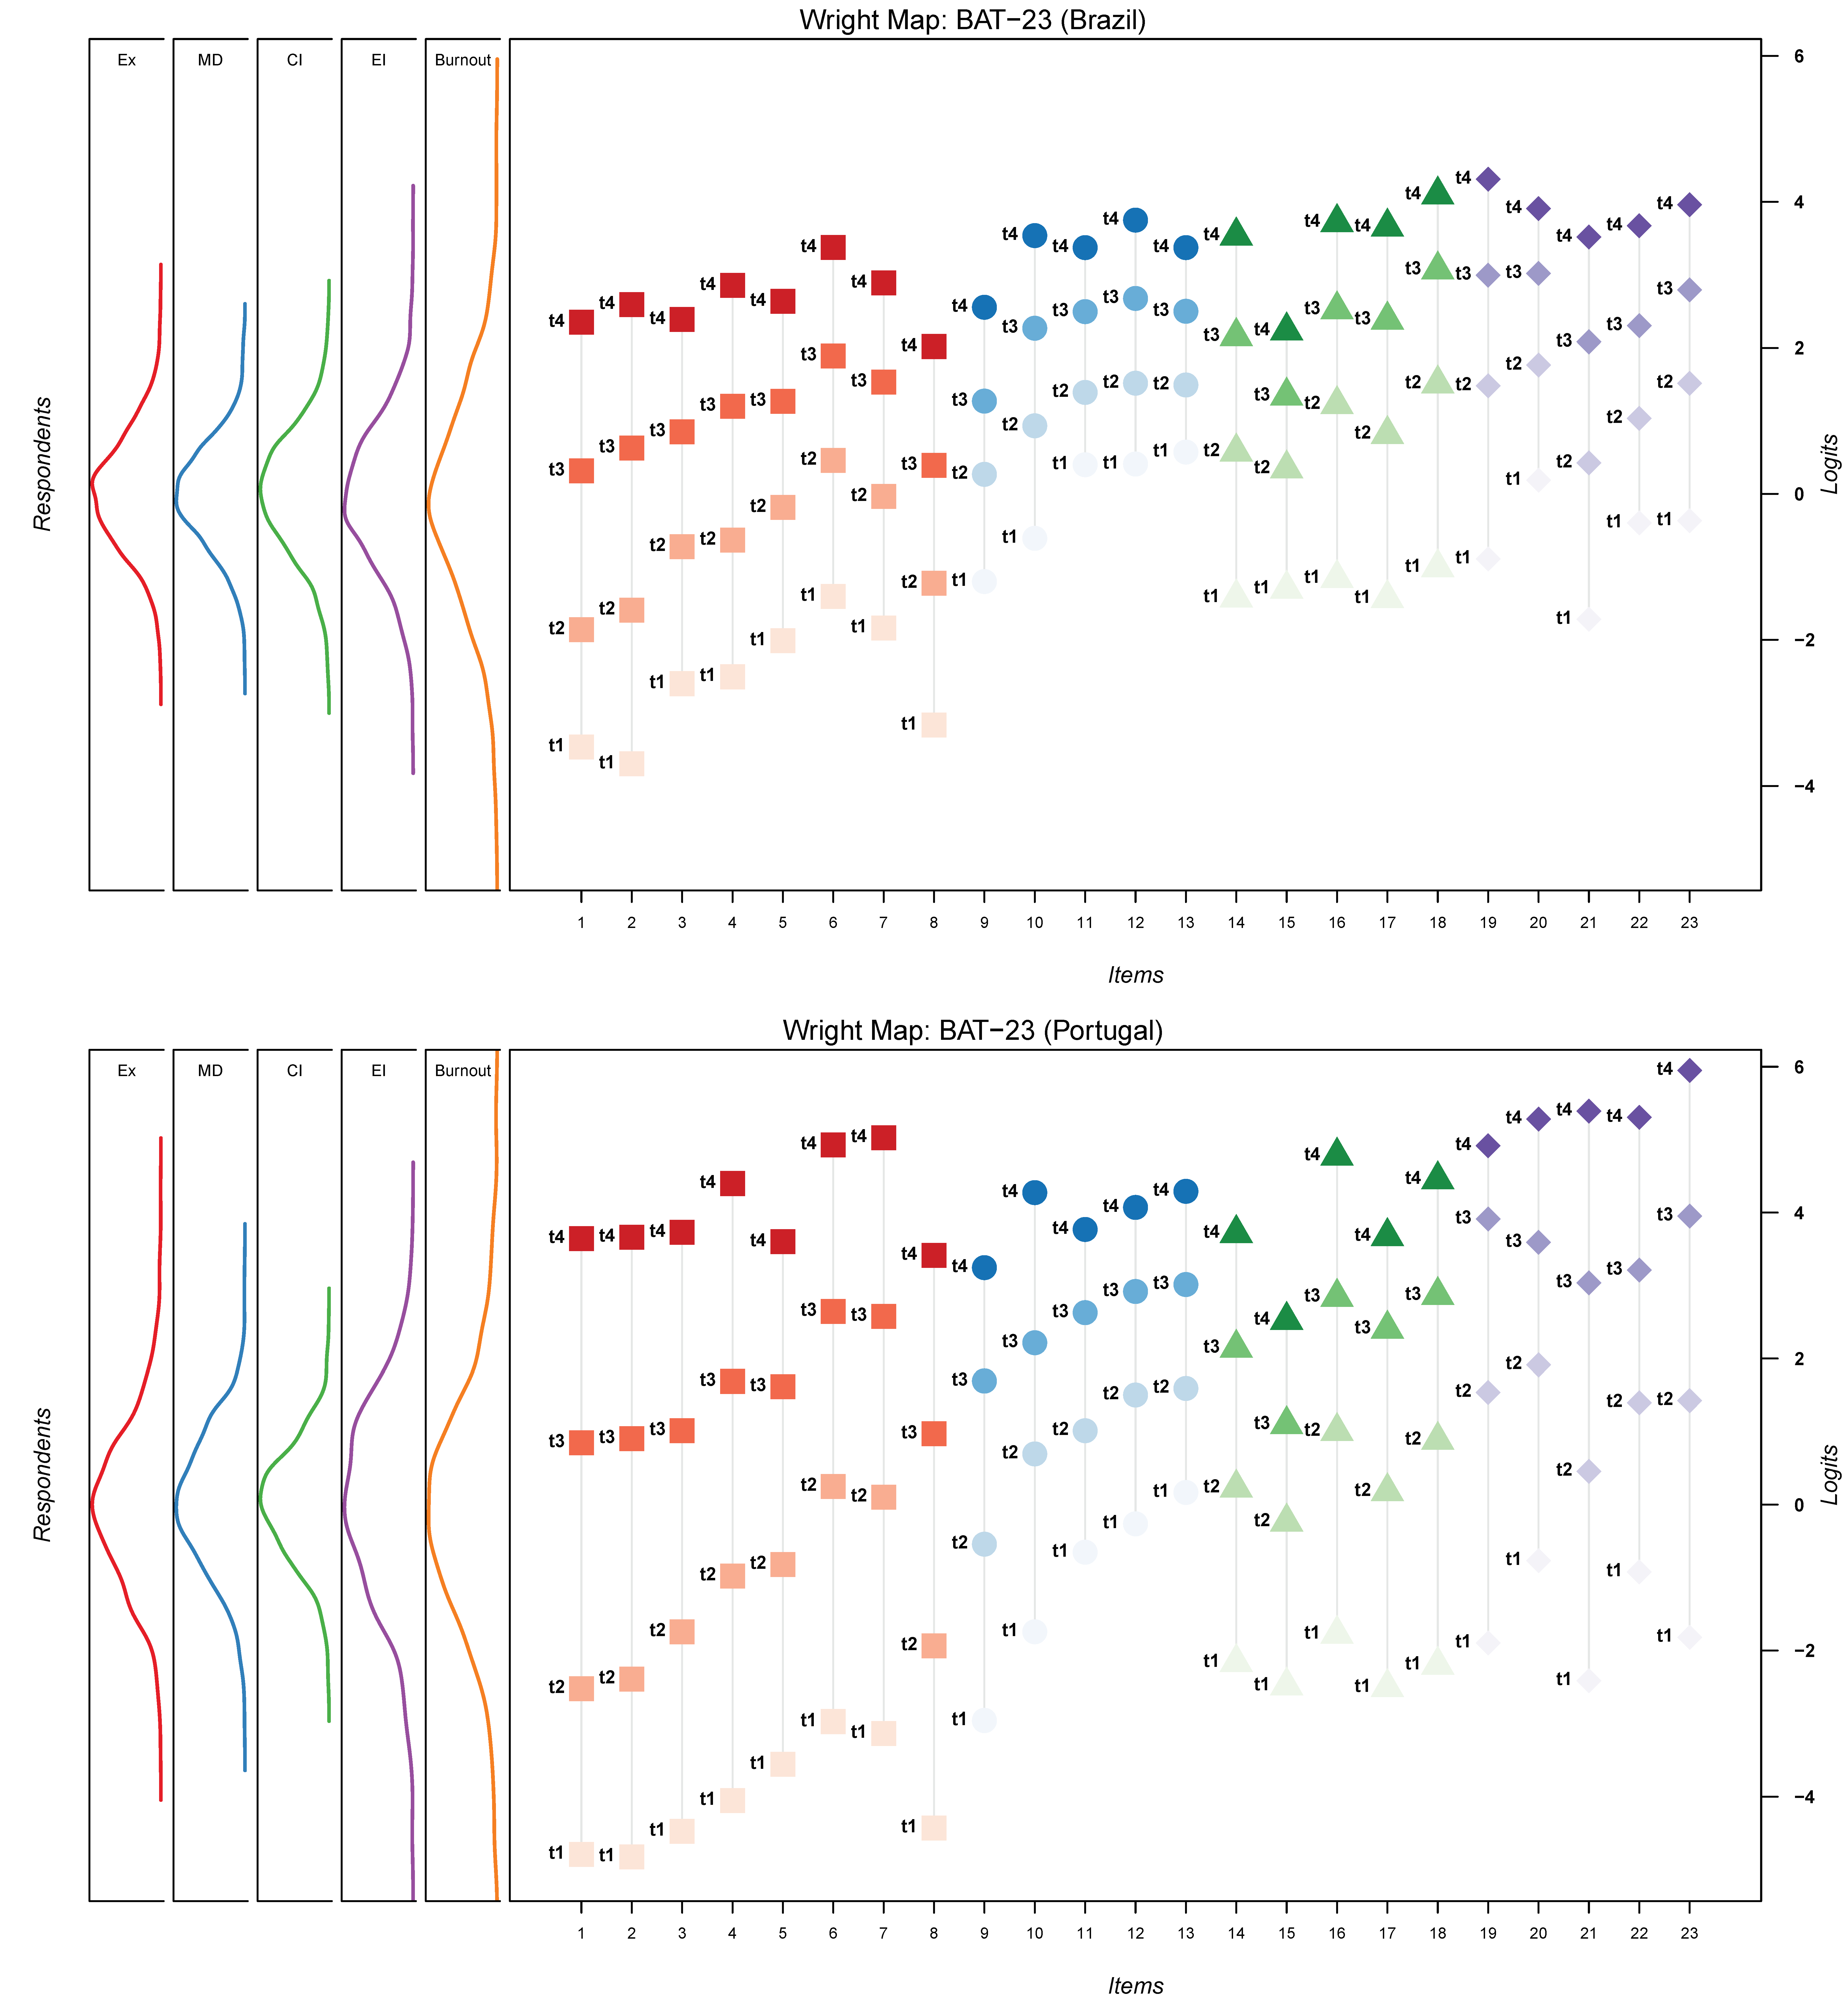
3.2. Validity Evidence Base on the Internal Structure
3.2.1. Dimensionality
3.2.2. Reliability of the Scores: Internal Consistency
3.2.3. Measurement Invariance
3.3. Validity Evidence Based on the Relations to Other Variables
4. Discussion
4.1. Weaknesses, Strengths, and Suggestions for Further Research
4.2. Practical Implications
5. Conclusions
Author Contributions
Funding
Institutional Review Board Statement
Informed Consent Statement
Data Availability Statement
Acknowledgments
Conflicts of Interest
References
- World Health Organization. International Statistical Classification of Diseases and Related Health Problems, 11th ed.; World Health Organization: Geneva, Switzerland, 2020. [Google Scholar]
- Maslach, C.; Schaufeli, W.B.; Leiter, M.P. Job burnout. Annu. Rev. Psychol. 2001, 52, 397–422. [Google Scholar] [CrossRef] [Green Version]
- Durand-Moreau, Q.V. Is burn-out finally a disease or not? Occup. Environ. Med. 2019, 76, 938. [Google Scholar] [CrossRef]
- Koutsimani, P.; Montgomery, A.; Georganta, K. The relationship between burnout, depression, and anxiety: A systematic review and meta-analysis. Front. Psychol. 2019, 10, 1–19. [Google Scholar] [CrossRef] [Green Version]
- Huibers, M.J.H.; Beurskens, A.J.H.M.; Prins, J.B.; Kant, I.J.; Bazelmans, E.; Van Schayck, C.P.; Knottnerus, J.A.; Bleijenberg, G. Fatigue, burnout, and chronic fatigue syndrome among employees on sick leave: Do attributions make the difference? Occup. Environ. Med. 2003, 60, i26–i31. [Google Scholar] [CrossRef] [Green Version]
- Santos, J.; Ramos, C.; Silva, A.; Amorim, S.; Winwood, P.; Carvalhais, C. Psychometric properties of the portuguese version of the occupational fatigue exhaustion/recovery (OFER) scale among industrial shift workers. Arch. Environ. Occup. Health 2021, 1–7. [Google Scholar] [CrossRef] [PubMed]
- Alessandri, G.; Perinelli, E.; De Longis, E.; Schaufeli, W.B.; Theodorou, A.; Borgogni, L.; Caprara, G.V.; Cinque, L. Job burnout: The contribution of emotional stability and emotional self-efficacy beliefs. J. Occup. Organ. Psychol. 2018, 91, 823–851. [Google Scholar] [CrossRef]
- Brand, S.; Beck, J.; Hatzinger, M.; Harbaugh, A.; Ruch, W.; Holsboer-Trachsler, E. Associations between satisfaction with life, burnout-related emotional and physical exhaustion, and sleep complaints. World J. Biol. Psychiatry 2010, 11, 744–754. [Google Scholar] [CrossRef] [PubMed]
- Ahola, K.; Hakanen, J.J. Job strain, burnout, and depressive symptoms: A prospective study among dentists. J. Affect. Disord. 2007, 104, 103–110. [Google Scholar] [CrossRef]
- Engelbrecht, G.J.; Beer, L.T.; Schaufeli, W.B. The relationships between work intensity, workaholism, burnout, and self-reported musculoskeletal complaints. Hum. Factors Ergon. Manuf. Serv. Ind. 2020, 30, 59–70. [Google Scholar] [CrossRef]
- Hakanen, J.J.; Schaufeli, W.B. Do burnout and work engagement predict depressive symptoms and life satisfaction? A three-wave seven-year prospective study. J. Affect. Disord. 2012, 141, 415–424. [Google Scholar] [CrossRef] [PubMed] [Green Version]
- Hallsten, L.; Voss, M.; Stark, S.; Josephson, M. Job burnout and job wornout as risk factors for long-term sickness absence. Work 2011, 38, 181–192. [Google Scholar] [CrossRef] [PubMed]
- Hillhouse, J.J.; Adler, C.M.; Walters, D.N. A simple model of stress, burnout and symptomatology in medical residents: A longitudinal study. Psychol. Health Med. 2000, 5, 63–73. [Google Scholar] [CrossRef]
- Lizano, E.L.; Mor Barak, M. Job burnout and affective wellbeing: A longitudinal study of burnout and job satisfaction among public child welfare workers. Child. Youth Serv. Rev. 2015, 55, 18–28. [Google Scholar] [CrossRef]
- Salvagioni, D.A.J.; Melanda, F.N.; Mesas, A.E.; González, A.D.; Gabani, F.L.; De Andrade, S.M. Physical, psychological and occupational consequences of job burnout: A systematic review of prospective studies. PLoS ONE 2017, 12, e0185781. [Google Scholar] [CrossRef] [PubMed]
- Toker, S.; Melamed, S.; Berliner, S.; Zeltser, D.; Shapira, I. Burnout and risk of coronary heart disease: A prospective study of 8838 employees. Psychosom. Med. 2012, 74, 840–847. [Google Scholar] [CrossRef] [PubMed]
- Bakker, A.B.; Demerouti, E.; Sanz-Vergel, A.I. Burnout and work engagement: The JD–R approach. Annu. Rev. Organ. Psychol. Organ. Behav. 2014, 1, 389–411. [Google Scholar] [CrossRef]
- Shah, K.; Chaudhari, G.; Kamrai, D.; Lail, A.; Patel, R.S. How essential is to focus on physician’s health and burnout in coronavirus (COVID-19) pandemic? Cureus 2020, 12, e7538. [Google Scholar] [CrossRef] [PubMed] [Green Version]
- Morgantini, L.A.; Naha, U.; Wang, H.; Francavilla, S.; Acar, Ö.; Flores, J.M.; Crivellaro, S.; Moreira, D.; Abern, M.; Eklund, M.; et al. Factors contributing to healthcare professional burnout during the COVID-19 pandemic: A rapid turnaround global survey. PLoS ONE 2020, 15, e0238217. [Google Scholar] [CrossRef]
- Cabarkapa, S.; Nadjidai, S.E.; Murgier, J.; Ng, C.H. The psychological impact of COVID-19 and other viral epidemics on frontline healthcare workers and ways to address it: A rapid systematic review. Brain Behav. Immun.-Health 2020, 8, 100144. [Google Scholar] [CrossRef]
- De Beer, L.T.; Schaufeli, W.B.; De Witte, H.; Hakanen, J.J.; Shimazu, A.; Glaser, J.; Seubert, C.; Bosak, J.; Sinval, J.; Rudnev, M. Measurement invariance of the Burnout Assessment Tool (BAT) across seven cross-national representative samples. Int. J. Environ. Res. Public Health 2020, 17, 5604. [Google Scholar] [CrossRef]
- Hu, Q.; Schaufeli, W.B.; Taris, T.W. How are changes in exposure to job demands and job resources related to burnout and engagement? A longitudinal study among Chinese nurses and police officers. Stress Health 2017, 33, 631–644. [Google Scholar] [CrossRef] [PubMed]
- Schaufeli, W.B.; Bakker, A.B.; van Rhenen, W. How changes in job demands and resources predict burnout, work engagement, and sickness absenteeism. J. Organ. Behav. 2009, 30, 893–917. [Google Scholar] [CrossRef] [Green Version]
- Schaufeli, W.B. Burnout in Europe: Relations with National Economy, Governance and Culture; KU Leuven: Leuven, Belgium, 2018. [Google Scholar]
- Seidler, A.; Thinschmidt, M.; Deckert, S.; Then, F.; Hegewald, J.; Nieuwenhuijsen, K.; Riedel-Heller, S.G. The role of psychosocial working conditions on burnout and its core component emotional exhaustion—A systematic review. J. Occup. Med. Toxicol. 2014, 9, 10. [Google Scholar] [CrossRef] [Green Version]
- Vîrgă, D.; Schaufeli, W.B.; Taris, T.W.; van Beek, I.; Sulea, C. Attachment styles and employee performance: The mediating role of burnout. J. Psychol. 2019, 153, 383–401. [Google Scholar] [CrossRef]
- Maslach, C.; Jackson, S.E.; Leiter, M.P. Maslach Burnout Inventory Manual, 4th ed.; Mind Garden: Menlo Park, CA, USA, 2016. [Google Scholar]
- Sakakibara, K.; Shimazu, A.; Toyama, H.; Schaufeli, W.B. Validation of the Japanese version of the burnout assessment tool. Front. Psychol. 2020, 11, 1–15. [Google Scholar] [CrossRef]
- Schaufeli, W.B.; Desart, S.; De Witte, H. Burnout Assessment Tool (BAT)—Development, validity, and reliability. Int. J. Environ. Res. Public Health 2020, 17, 9495. [Google Scholar] [CrossRef] [PubMed]
- Squires, A.; Finlayson, C.; Gerchow, L.; Cimiotti, J.P.; Matthews, A.; Schwendimann, R.; Griffiths, P.; Busse, R.; Heinen, M.; Brzostek, T.; et al. Methodological considerations when translating “burnout”. Burn. Res. 2014, 1, 59–68. [Google Scholar] [CrossRef] [Green Version]
- Kristensen, T.S.; Borritz, M.; Villadsen, E.; Christensen, K.B. The copenhagen burnout inventory: A new tool for the assessment of burnout. Work Stress 2005, 19, 192–207. [Google Scholar] [CrossRef]
- Demerouti, E.; Bakker, A.B.; Vardakou, I.; Kantas, A. The convergent validity of two burnout instruments: A multitrait-multimethod analysis. Eur. J. Psychol. Assess. 2003, 19, 12–23. [Google Scholar] [CrossRef]
- Yıldırım, M.; Solmaz, F. COVID-19 burnout, COVID-19 stress and resilience: Initial psychometric properties of COVID-19 Burnout Scale. Death Stud. 2020, 1–9. [Google Scholar] [CrossRef]
- Schaufeli, W.B.; De Witte, H.; Desart, S. Manual Burnout Assessment Tool (BAT); Unpublished internal report; KU Leuven: Leuven, Belgium, 2019. [Google Scholar]
- Schaufeli, W.B.; Taris, T.W. The conceptualization and measurement of burnout: Common ground and worlds apart the views expressed in Work & Stress Commentaries are those of the author(s), and do not necessarily represent those of any other person or organization, or of the journal. Work Stress 2005, 19, 256–262. [Google Scholar] [CrossRef]
- Sinval, J.; van Veldhoven, M.; Oksanen, T.; Azevedo, L.F.; Atallah, Á.N.; Melnik, T.; Marôco, J. Interventions for improving recovery from work. Cochrane Database Syst. Rev. 2021, 12, CD014518. [Google Scholar] [CrossRef]
- Hadžibajramović, E.; Schaufeli, W.B.; De Witte, H. A rasch analysis of the Burnout Assessment Tool (BAT). PLoS ONE 2020, 15, e0242241. [Google Scholar] [CrossRef] [PubMed]
- Angelini, G.; Buonomo, I.; Benevene, P.; Consiglio, P.; Romano, L.; Fiorilli, C. The Burnout Assessment Tool (BAT): A contribution to Italian validation with teachers’. Sustainability 2021, 13, 9065. [Google Scholar] [CrossRef]
- Oprea, B.; Iliescu, D.; De Witte, H. Romanian short version of the Burnout Assessment Tool: Psychometric properties. Eval. Health Prof. 2021, 44, 406–415. [Google Scholar] [CrossRef]
- Vinueza-Solórzano, A.M.; Portalanza-Chavarría, C.A.; de Freitas, C.P.P.; Schaufeli, W.B.; De Witte, H.; Hutz, C.S.; Souza Vazquez, A.C. The Ecuadorian version of the Burnout Assessment Tool (BAT): Adaptation and validation. Int. J. Environ. Res. Public Health 2021, 18, 7121. [Google Scholar] [CrossRef] [PubMed]
- Spagnoli, P.; Buono, C.; Kovalchuk, L.S.; Cordasco, G.; Esposito, A. Perfectionism and burnout during the COVID-19 crisis: A two-wave cross-lagged study. Front. Psychol. 2021, 11, 1–7. [Google Scholar] [CrossRef] [PubMed]
- Eurofound. Sixth European Working Conditions Survey—Overview Report (2017 Update); Publications Office of the European Union: Luxembourg, 2017; ISBN 9789289715966. [Google Scholar] [CrossRef]
- American Educational Research Association; American Psychological Association; National Council on Measurement in Education. Standards for Educational and Psychological Testing; American Psychological Association: Washington, DC, USA, 2014; ISBN 9780935302356. [Google Scholar]
- Soohyun, C. A preliminary validation study for the Korean version of the Burnout Assessment Tool (K-BAT). Korean J. Ind. Organ. Psychol. 2020, 33, 461–499. [Google Scholar] [CrossRef]
- Kolachev, N.; Osin, E.; Schaufeli, W.B.; Desart, S. Personal resources and burnout: Evidence from a study among librarians of Moscow region. Organ. Psychol. 2019, 9, 129–147. [Google Scholar]
- Nunnally, J.C.; Bernstein, I.H. Psychometric Theory, 3rd ed.; McGraw-Hill: New York, NY, USA, 1994; ISBN 0-07-047849-X. [Google Scholar]
- Zumbo, B.D.; Gadermann, A.M.; Zeisser, C. Ordinal versions of coefficients alpha and theta for Likert rating scales. J. Mod. Appl. Stat. Methods 2007, 6, 21–29. [Google Scholar] [CrossRef]
- Schaufeli, W.B.; De Witte, H.; Desart, S. De Burnout Assessment Tool (BAT): Een nieuw instrument voor het meten van burn-out. Tijdschr. Klin. Psychol. 2020, 50, 267–283. [Google Scholar]
- Adriaenssens, J.; De Gucht, V.; Maes, S. Determinants and prevalence of burnout in emergency nurses: A systematic review of 25 years of research. Int. J. Nurs. Stud. 2015, 52, 649–661. [Google Scholar] [CrossRef]
- Dimou, F.M.; Eckelbarger, D.; Riall, T.S. Surgeon burnout: A systematic review. J. Am. Coll. Surg. 2016, 222, 1230–1239. [Google Scholar] [CrossRef] [PubMed] [Green Version]
- Purvanova, R.K.; Muros, J.P. Gender differences in burnout: A meta-analysis. J. Vocat. Behav. 2010, 77, 168–185. [Google Scholar] [CrossRef]
- Innstrand, S.T.; Langballe, E.M.; Falkum, E.; Aasland, O.G. Exploring within- and between-gender differences in burnout: 8 different occupational groups. Int. Arch. Occup. Environ. Health 2011, 84, 813–824. [Google Scholar] [CrossRef] [PubMed]
- Sinval, J.; Marôco, J. Short index of job satisfaction: Validity evidence from Portugal and Brazil. PLoS ONE 2020, 15, e0231474. [Google Scholar] [CrossRef] [PubMed] [Green Version]
- Sinval, J.; Miller, V.; Marôco, J. Openness toward organizational change scale (OTOCS): Validity evidence from Brazil and Portugal. PLoS ONE 2021, 16, e0249986. [Google Scholar] [CrossRef]
- Sinval, J.; Sirgy, M.J.; Lee, D.-J.; Marôco, J. The quality of work life scale: Validity evidence from Brazil and Portugal. Appl. Res. Qual. Life 2020, 15, 1323–1351. [Google Scholar] [CrossRef]
- Cronbach, L.J.; Meehl, P.E. Construct validity in psychological tests. Psychol. Bull. 1955, 52, 281–302. [Google Scholar] [CrossRef] [Green Version]
- Demerouti, E.; Bakker, A.B.; Nachreiner, F.; Schaufeli, W.B. The job demands-resources model of burnout. J. Appl. Psychol. 2001, 86, 499–512. [Google Scholar] [CrossRef]
- Bakker, A.B.; Demerouti, E. Job demands–resources theory: Taking stock and looking forward. J. Occup. Health Psychol. 2017, 22, 273–285. [Google Scholar] [CrossRef]
- Schaufeli, W.B.; Taris, T.W. A critical review of the job demands-resources model: Implications for improving work and health. In Bridging Occupational, Organizational and Public Health: A Transdisciplinary Approach; Bauer, G.F., Hämmig, O., Eds.; Springer: Dordrecht, The Netherlands, 2014. [Google Scholar] [CrossRef]
- Alarcon, G.M. A meta-analysis of burnout with job demands, resources, and attitudes. J. Vocat. Behav. 2011, 79, 549–562. [Google Scholar] [CrossRef]
- Halbesleben, J.R.B. Sources of social support and burnout: A meta-analytic test of the conservation of resources model. J. Appl. Psychol. 2006, 91, 1134–1145. [Google Scholar] [CrossRef]
- Lesener, T.; Gusy, B.; Wolter, C. The job demands-resources model: A meta-analytic review of longitudinal studies. Work Stress 2019, 33, 76–103. [Google Scholar] [CrossRef]
- Van den Broeck, A.; Elst, T.V.; Baillien, E.; Sercu, M.; Schouteden, M.; De Witte, H.; Godderis, L. Job demands, job resources, burnout, work engagement, and their relationships: An analysis across sectors. J. Occup. Environ. Med. 2017, 59, 369–376. [Google Scholar] [CrossRef] [PubMed]
- Rigdon, E.E. Calculating degrees of freedom for a structural equation model. Struct. Equ. Model. A Multidiscip. J. 1994, 1, 274–278. [Google Scholar] [CrossRef]
- Jak, S.; Jorgensen, T.D.; Verdam, M.G.E.; Oort, F.J.; Elffers, L. Analytical power calculations for structural equation modeling: A tutorial and shiny app. Behav. Res. Methods 2021, 53, 1385–1406. [Google Scholar] [CrossRef] [PubMed]
- Kelley, K.; Lai, K. Sample size planning for confirmatory factor models: Power and accuracy for effects of interest. In The Wiley Handbook of Psychometric Testing: A Multidisciplinary Reference on Survey, Scale and Test Development; Irwing, P., Booth, T., Hughes, D., Eds.; John Wiley & Sons: Hoboken, NJ, USA, 2018; pp. 113–138. [Google Scholar] [CrossRef]
- International Test Commission. ITC Guidelines for Translating and Adapting Tests, 2nd ed.; International Test Commission: Quebec, QC, Canada, 2018; Volume 18, pp. 101–134. [Google Scholar] [CrossRef]
- Schaufeli, W.B.; Bakker, A.B. Utrecht Work Engagement Scale; Occupational Health Psychology Unit, Utrecht University: Utrecht, The Netherlands, 2003. [Google Scholar]
- Schaufeli, W.B.; Shimazu, A.; Hakanen, J.J.; Salanova, M.; de Witte, H. An ultra-short measure for work engagement. Eur. J. Psychol. Assess. 2017, 1–15. [Google Scholar] [CrossRef]
- Sinval, J.; Pasian, S.R.; Queirós, C.; Marôco, J. Brazil-Portugal transcultural adaptation of the UWES-9: Internal consistency, dimensionality, and measurement invariance. Front. Psychol. 2018, 9, 1–18. [Google Scholar] [CrossRef] [PubMed] [Green Version]
- Vazquez, A.C.S.; Magnan, E.d.S.; Pacico, J.C.; Hutz, C.S.; Schaufeli, W.B. Adaptation and validation of the Brazilian version of the Utrecht Work Engagement Scale. Psico-USF 2015, 20, 207–217. [Google Scholar] [CrossRef] [Green Version]
- Sinval, J.; Queirós, C.; Pasian, S.R.; Marôco, J. Transcultural adaptation of the Oldenburg Burnout Inventory (OLBI) for Brazil and Portugal. Front. Psychol. 2019, 10, 1–28. [Google Scholar] [CrossRef]
- Schwarzer, R.; Knoll, N. Functional roles of social support within the stress and coping process: A theoretical and empirical overview. Int. J. Psychol. 2007, 42, 243–252. [Google Scholar] [CrossRef]
- Schaufeli, W.B. Applying the job demands-resources model. Organ. Dyn. 2017, 46, 120–132. [Google Scholar] [CrossRef]
- Rizzo, J.R.; House, R.J.; Lirtzman, S.I. Role conflict and ambiguity in complex organizations. Adm. Sci. Q. 1970, 15, 150. [Google Scholar] [CrossRef]
- Schaufeli, W.B.; Bakker, A.B.; van der Heijden, F.M.M.A.; Prins, J.T. Workaholism among medical residents: It is the combination of working excessively and compulsively that counts. Int. J. Stress Manag. 2009, 16, 249–272. [Google Scholar] [CrossRef] [Green Version]
- Greubel, J.; Kecklund, G. The impact of organizational changes on work stress, sleep, recovery and health. Ind. Health 2011, 49, 353–364. [Google Scholar] [CrossRef] [Green Version]
- LimeSurvey, An Open Source Survey Tool [Computer Software]; GmbH LimeSurvey: Hamburg, Germany, 2021.
- SurveyMonkey, [Computer Software]; SurveyMonkey: San Mateo, CA, USA, 2021.
- R Core Team. R: A Language and Environment for Statistical Computing (Version 4.1.1) [Computer Software]. 2021. Available online: https://www.r-project.org/ (accessed on 22 December 2021).
- RStudio Team. RStudio: Integrated Development for R (Version 1.4.1717) [Computer Software]. 2021. Available online: https://www.rstudio.com/ (accessed on 22 December 2021).
- Kelley, K. MBESS: The MBESS R Package (R Package Version 4.6.0) [Computer Software]. 2019. Available online: https://cran.r-project.org/package=MBESS (accessed on 22 December 2021).
- McNamara, A.; Arino de la Rubia, E.; Zhu, H.; Ellis, S.; Quinn, M. skimr: Compact and Flexible Summaries of Data (R Package Version 2.1.3) [Computer Software]. 2021. Available online: https://cran.r-project.org/package=skimr (accessed on 22 December 2021).
- Rich, B. table1: Tables of Descriptive Statistics in HTML (R Package Version 1.4.2) [Computer Software]. 2021. Available online: https://cran.r-project.org/package=table1 (accessed on 22 December 2021).
- Peterson, B.G.; Carl, P. PerformanceAnalytics, Econometric Tools for Performance and Risk Analysis (R Package Version 2.0.4) [Computer Software]. 2020. Available online: https://cran.r-project.org/package=PerformanceAnalytics (accessed on 22 December 2021).
- Lüdecke, D. sjstats: Statistical Functions for Regression Models (R Package Version 0.18.1) [Computer Software]. 2021. Available online: https://cran.r-project.org/package=sjstats (accessed on 22 December 2021). [CrossRef]
- Lemon, J. plotrix: A Package in the Red Light District of R. R-News 2006, 6, 8–12. [Google Scholar]
- Poncet, P. modeest: Mode Estimation (R Package Version 2.4.0) [Computer Software]. 2019. Available online: https://cran.r-project.org/package=modeest (accessed on 22 December 2021).
- Finney, S.J.; DiStefano, C. Non-normal and categorical data in structural equation modeling. In Structural Equation Modeling: A Second Course; Hancock, G.R., Mueller, R.O., Eds.; Information Age Publishing: Charlotte, NC, USA, 2013; pp. 439–492. [Google Scholar]
- Marôco, J. Análise de Equações Estruturais: Fundamentos Teóricos, Software & Aplicações, 3rd ed.; ReportNumber: Pêro Pinheiro, Portugal, 2021; ISBN 978-989-96763-6-7. [Google Scholar]
- Revelle, W. psych: Procedures for Psychological, Psychometric, and Personality Research (R package Version 1.9.4) [Computer Software]. 2019. Available online: https://cran.r-project.org/package=psych (accessed on 22 December 2021).
- Mardia, K.V. Measures of multivariate skewness and kurtosis with applications. Biometrika 1970, 57, 519–530. [Google Scholar] [CrossRef]
- Hu, L.; Bentler, P.M. Cutoff criteria for fit indexes in covariance structure analysis: Conventional criteria versus new alternatives. Struct. Equ. Model. A Multidiscip. J. 1999, 6, 1–55. [Google Scholar] [CrossRef]
- Byrne, B.M. Structural Equation Modeling with AMOS, 3rd ed.; Multivariate applications series; Routledge: New York, NY, USA, 2010; ISBN 9780805863727. [Google Scholar] [CrossRef]
- Rosseel, Y. lavaan: An R package for structural equation modeling. J. Stat. Softw. 2012, 48, 1–21. [Google Scholar] [CrossRef] [Green Version]
- Muthén, B.O. Latent variable structural equation modeling with categorical data. J. Econom. 1983, 22, 43–65. [Google Scholar] [CrossRef]
- Fornell, C.; Larcker, D.F. Evaluating structural equation models with unobservable variables and measurement error. J. Mark. Res. 1981, 18, 39–50. [Google Scholar] [CrossRef]
- Hair, J.F.; Babin, B.J.; Anderson, R.E.; Black, W.C. Multivariate Data Analysis, 8th ed.; Cengage Learning: Andover, UK, 2019; ISBN 9781473756540. [Google Scholar]
- Briggs, D.C.; Wilson, M. An introduction to multidimensional measurement using Rasch models. J. Appl. Meas. 2003, 4, 87–100. [Google Scholar]
- Adams, R.J.; Wilson, M.; Wang, W.-C. The multidimensional random coefficients multinomial logit model. Appl. Psychol. Meas. 1997, 21, 1–23. [Google Scholar] [CrossRef]
- Robitzsch, A.; Kiefer, T.; Wu, M. TAM, Test Analysis Modules (R Package Version 3.7-16) [Computer Software]. 2021. Available online: https://rdrr.io/cran/TAM/ (accessed on 22 December 2021).
- Wright, B.D.; Stone, M.H. Best Test Design; Mesa Press: Chicago, IL, USA, 1979; ISBN 79-88489. [Google Scholar]
- Callingham, R.; Bond, T. Some notes on the term: “Wright map”. Rasch Meas. Trans. 2006, 18, 85–104. [Google Scholar]
- Irribarra, D.T.; Freund, R. WrightMap: IRT Item-Person Map with “ConQuest” Integration (R Package Version 1.2.3) [Computer Software]. 2020. Available online: https://cran.r-project.org/package=WrightMap (accessed on 22 December 2021).
- Mair, P. Modern Psychometrics with R; Use R! Springer: Cham, Switzerland, 2018; ISBN 978-3-319-93175-3. [Google Scholar] [CrossRef]
- Bond, T.G.; Fox, C.M. Applying the rasch model. In Applying the Rasch Model: Fundamental Measurement in the Human Sciences, 3rd ed.; Routledge: New York, NY, USA, 2015; ISBN 9780805854619. [Google Scholar] [CrossRef]
- Linacre, J.M. What do infit and outfit mean-square and standardized mean? Rasch Meas. Trans. 2002, 16, 878. [Google Scholar]
- McDonald, R.P. Test Theory: A Unified Treatment; Routledge: Mahwah, NJ, USA, 1999; ISBN 9781410601087. [Google Scholar] [CrossRef]
- Jorgensen, T.D.; Pornprasertmanit, S.; Schoemann, A.M.; Rosseel, Y. semTools: Useful Tools for Structural Equation Modeling (R Package Version 0.5–5) [Computer Software]. 2021. Available online: https://cran.r-project.org/package=semTools (accessed on 22 December 2021).
- Adams, R.J. Reliability as a measurement design effect. Stud. Educ. Eval. 2005, 31, 162–172. [Google Scholar] [CrossRef]
- Millsap, R.E.; Yun-Tein, J. Assessing factorial invariance in ordered-categorical measures. Multivar. Behav. Res. 2004, 39, 479–515. [Google Scholar] [CrossRef] [Green Version]
- Cheung, G.W.; Rensvold, R.B. Evaluating goodness-of-fit indexes for testing measurement invariance. Struct. Equ. Model. A Multidiscip. J. 2002, 9, 233–255. [Google Scholar] [CrossRef]
- Satorra, A.; Bentler, P.M. A scaled difference chi-square test statistic for moment structure analysis. Psychometrika 2001, 66, 507–514. [Google Scholar] [CrossRef] [Green Version]
- Cohen, J. Statistical Power Analysis for the Behavioral Sciences, 2nd ed.; Lawrence Erlbaum Associates: Hillsdale, NJ, USA, 1988; ISBN 0805802835. [Google Scholar]
- Højsgaard, S.; Halekoh, U. doBy: Groupwise Statistics, LSmeans, Linear Contrasts, Utilities (R Package Version 4.6-2) [Computer Software]. 2018. Available online: https://cran.r-project.org/package=doBy (accessed on 22 December 2021).
- International Labour Office. International Standard Classification of Occupations; International Labour Organization: Geneva, Switzerland, 2012; Volume I, ISBN 978-92-2-125953-4. [Google Scholar] [CrossRef]
- Wilson, M. Constructing Measures: An Item Response Moeling Approach; Routledge: Mahwah, NJ, USA, 2004; ISBN 9781410611697. [Google Scholar] [CrossRef]
- Halbesleben, J.R.B. A meta-analysis of work engagement: Relationships with burnout, demands, resources, and consequences. In Work Engagement: A Handbook of Essential Theory and Research; Bakker, A.B., Leiter, M.P., Eds.; Routledge: Hove, UK, 2010; pp. 102–117. [Google Scholar] [CrossRef]
- Greer, F.; Liu, J. Creating short forms and screening measures. In Principles and Methods of Test Construction: Standards and Recent Advances; Schweizer, K., DiStefano, C., Eds.; Psychological assessment—science and practice; Hogrefe Publishing: Boston, MA, USA, 2016; pp. 272–287. ISBN 978-0-88937-449-2. [Google Scholar]
- Rammstedt, B.; Beierlein, C. Can’t we make it any shorter? The limits of personality assessment and ways to overcome them. J. Individ. Differ. 2014, 35, 212–220. [Google Scholar] [CrossRef]
- Galloway, A. Non-probability sampling. In Encyclopedia of Social Measurement; Kempf-Leonard, K., Ed.; Elsevier: Amsterdam, The Netherlands, 2005; Volume 2, pp. 859–864. [Google Scholar] [CrossRef]
- Vehovar, V.; Toepoel, V.; Steinmetz, S. Nonprobability sampling. In The SAGE Handbook of Survey Methodology; Wolf, C., Joye, D., Smith, T.W., Fu, Y., Eds.; Sage: Thousand Oaks, CA, USA, 2016; p. 329. [Google Scholar] [CrossRef]
- Celestino, V.R.R.; Bucher-Maluschke, J.S.N.F.; Marqueze, E.C. Fatigue at work: Scale validation with airline pilots. BAR-Brazilian Adm. Rev. 2020, 17, 1–24. [Google Scholar] [CrossRef]
- Krzanowski, W.J.; Hand, D.J. ROC Curves for Continuous Data; Routledge: Boca Raton, FL, USA, 2009; ISBN 978-1-4398-0021-8. [Google Scholar] [CrossRef]
- Merkle, E.C.; Rosseel, Y. blavaan: Bayesian structural equation models via parameter expansion. J. Stat. Softw. 2018, 85, 1–30. [Google Scholar] [CrossRef] [Green Version]

| Item | English | Brazil | Portugal | |||||||
|---|---|---|---|---|---|---|---|---|---|---|
| Never | Rarely | Sometimes | Often | Always | Nunca | Raramente | Algumas vezes | Frequentemente | Sempre | |
| 1 | 2 | 3 | 4 | 5 | 1 | 2 | 3 | 4 | 5 | |
| Exhaustion | Exaustão | |||||||||
| 1 S | At work, I feel mentally exhausted | No trabalho, sinto-me mentalmente exausto | No trabalho, sinto-me mentalmente exausto(a) | |||||||
| 2 | Everything I do at work requires a great deal of effort | Tudo o que faço no trabalho exige muito esforço | Tudo o que faço no trabalho exige muito esforço | |||||||
| 3 S | After a day at work, I find it hard to recover my energy | Acho difícil recuperar minha energia depois de um dia de trabalho | Depois de um dia no trabalho, acho difícil recuperar a minha energia | |||||||
| 4 S | At work, I feel physically exhausted | No trabalho, sinto-me fisicamente exausto | No trabalho, sinto-me fisicamente exausto(a) | |||||||
| 5 | When I get up in the morning, I lack the energy to start a new day at work | Ao levantar pela manhã, me falta energia para começar um novo dia no trabalho | Quando me levanto de manhã, falta-me a energia para começar um novo dia no trabalho | |||||||
| 6 | I want to be active at work, but somehow I am unable to manage | Quero ser ativo no trabalho, mas de alguma forma não consigo | Quero estar ativo(a) no trabalho, mas de alguma forma sou incapaz de o fazer | |||||||
| 7 | When I exert myself at work, I get tired quicker than normal | Quando eu me esforço no trabalho, me canso mais rápido do que o normal | Quando me esforço no trabalho, fico rapidamente cansado(a) | |||||||
| 8 | At the end of my working day, I feel mentally exhausted and drained | No final do meu dia de trabalho, eu me sinto mentalmente exausto e esgotado | No final de um dia de trabalho, sinto-me mentalmente exausto(a) e esgotado(a) | |||||||
| Mental distance | Distância mental | |||||||||
| 9 S | I struggle to find any enthusiasm for my work | Eu luto para encontrar algum entusiasmo pelo meu trabalho | Tenho dificuldade em encontrar algum entusiasmo pelo meu trabalho | |||||||
| 10 S | At work, I do not think what I am doing and I function on autopilot | Não penso no que estou fazendo no meu trabalho, eu funciono em piloto automático | No trabalho, não penso muito no que estou a fazer e funciono em piloto automático | |||||||
| 11 | I feel a strong aversion towards my job | Sinto forte aversão pelo meu trabalho | Sinto uma forte aversão em relação ao meu trabalho | |||||||
| 12 | I feel indifferent about my job | Sinto-me indiferente em relação ao meu trabalho | Sinto-me indiferente em relação ao meu trabalho | |||||||
| 13 S | I am cynical about what my work means to others | Sou pessimista sobre o que meu trabalho significa para os outros | Sou cínico(a) sobre o que o meu trabalho significa para os outros | |||||||
| Cognitive impairment | Incapacidade no Controlo Cognitivo | |||||||||
| 14 S | At work, I have trouble staying focused | Em meu trabalho, tenho dificuldade em manter o foco | No trabalho, tenho dificuldade em manter-me focado(a) | |||||||
| 15 | At work I struggle to think clearly | No trabalho, eu me esforço para pensar claramente | No trabalho, luto para pensar claramente | |||||||
| 16 | I am forgetful and distracted at work | Sou esquecido e distraído no trabalho | Sou esquecido(a) e distraído(a) no trabalho | |||||||
| 17 S | When I’m working, I have trouble concentrating | Tenho dificuldade em me concentrar quando estou trabalhando | Quando estou a trabalhar, tenho dificuldade em me concentrar | |||||||
| 18 S | I make mistakes in my work because I have my mind on other things | Cometo erros no trabalho porque minha mente está em outras coisas | Faço erros no meu trabalho porque tenho a cabeça sobrecarregada com outras coisas | |||||||
| Emotional impairment | Incapacidade no Controlo Emocional | |||||||||
| 19 S | At work, I feel unable to control my emotions | No trabalho, sinto-me incapaz de controlar as minhas emoções | No trabalho, sinto-me incapaz de controlar as minhas emoções | |||||||
| 20 S | I do not recognize myself in the way I react emotionally at work | Eu não me reconheço na maneira como reajo emocionalmente no trabalho | Não me reconheço na maneira como reajo emocionalmente no trabalho | |||||||
| 21 | During my work I become irritable when things do not go the way I want | Durante o trabalho, fico irritado quando as coisas não são do jeito que eu quero | Durante o trabalho, fico irritadiço(a) quando as coisas não são como eu quero | |||||||
| 22 | I get upset and sad at work without knowing why | Fico insatisfeito e triste no trabalho sem saber o porquê | Fico perturbado(a) e triste no trabalho sem saber porquê | |||||||
| 23 S | At work I may overreact unintentionally | No trabalho, eu posso ter reações exageradas sem querer | Pode acontecer que no trabalho eu reaja exageradamente sem querer | |||||||
| Brazil | Portugal | Total | |
|---|---|---|---|
| (n = 2217) | (n = 886) | (N = 3103) | |
| Age (Years) | |||
| M (SD) | 36.9 (11.1) | 38.9 (11.4) | 37.2 (11.1) |
| Mdn [Min, Max] | 36.0 [17.0, 90.0] | 41.0 [18.0, 68.0] | 36.0 [17.0, 90.0] |
| Sex | |||
| Female | 1653 (74.8%) | 537 (72.5%) | 2190 (74.2%) |
| Male | 558 (25.2%) | 204 (27.5%) | 762 (25.8%) |
| Academic Level | |||
| High school, vocational education, or lower | 554 (25.0%) | 258 (34.6%) | 812 (27.4%) |
| Graduation | 547 (24.7%) | 204 (27.3%) | 751 (25.3%) |
| Post-graduation | 1116 (50.3%) | 284 (38.1%) | 1400 (47.2%) |
| Occupational Group (ISCO-08) | |||
| Armed Forces Occupations | 6 (0.3%) | 0 (0.0%) | 6 (0.2%) |
| Clerical Support Workers | 1 (0.1%) | 133 (20.2%) | 134 (5.2%) |
| Craft and Related Trades Workers | 1 (0.1%) | 5 (0.8%) | 6 (0.2%) |
| Elementary Occupations | 15 (0.8%) | 4 (0.6%) | 19 (0.7%) |
| Managers | 149 (7.8%) | 63 (9.6%) | 212 (8.3%) |
| Professionals | 1071 (56.2%) | 300 (45.5%) | 1371 (53.4%) |
| Services and Sales Workers | 75 (3.9%) | 83 (12.6%) | 158 (6.2%) |
| Technicians and Associate Professionals | 589 (30.9%) | 65 (9.9%) | 654 (25.5%) |
| Plant and Machine Operators and Assemblers | 0 (0.0%) | 7 (1.1%) | 7 (0.3%) |
| Item | M | SD | Min | P25 | Mdn | P75 | Max | Histogram | SEM | CV | Mode | sk | ku | Infit | Outfit |
|---|---|---|---|---|---|---|---|---|---|---|---|---|---|---|---|
| Brazil | |||||||||||||||
| Item 1 S | 3.31 | 0.99 | 1 | 3 | 3 | 4 | 5 | ▁▃▇▆▂ | 0.02 | 0.30 | 3 | −0.23 | −0.22 | 0.981 | 0.977 |
| Item 2 | 3.19 | 0.97 | 1 | 3 | 3 | 4 | 5 | ▁▃▇▅▂ | 0.02 | 0.30 | 3 | −0.05 | −0.31 | 1.412 | 1.434 |
| Item 3 S | 2.94 | 1.12 | 1 | 2 | 3 | 4 | 5 | ▂▆▇▅▂ | 0.02 | 0.38 | 3 | 0.09 | −0.71 | 0.924 | 0.920 |
| Item 4 S | 2.82 | 1.06 | 1 | 2 | 3 | 3 | 5 | ▂▆▇▅▂ | 0.02 | 0.38 | 3 | 0.13 | −0.51 | 0.897 | 0.884 |
| Item 5 | 2.67 | 1.14 | 1 | 2 | 3 | 3 | 5 | ▅▇▇▅▂ | 0.02 | 0.43 | 2 | 0.32 | −0.63 | 1.075 | 1.087 |
| Item 6 | 2.32 | 1.06 | 1 | 2 | 2 | 3 | 5 | ▆▇▆▂▁ | 0.02 | 0.46 | 2 | 0.56 | −0.30 | 1.099 | 1.109 |
| Item 7 | 2.56 | 1.10 | 1 | 2 | 2 | 3 | 5 | ▅▇▇▃▂ | 0.02 | 0.43 | 2 | 0.37 | −0.50 | 1.043 | 1.033 |
| Item 8 | 3.20 | 1.11 | 1 | 2 | 3 | 4 | 5 | ▂▅▇▆▃ | 0.02 | 0.35 | 3 | −0.09 | −0.71 | 0.871 | 0.857 |
| Item 9 S | 2.47 | 1.27 | 1 | 1 | 2 | 3 | 5 | ▇▇▆▅▂ | 0.03 | 0.51 | 2 | 0.49 | −0.84 | 1.115 | 1.108 |
| Item 10 S | 2.05 | 1.07 | 1 | 1 | 2 | 3 | 5 | ▇▆▅▂▁ | 0.02 | 0.52 | 1 | 0.84 | −0.01 | 1.139 | 1.132 |
| Item 11 | 1.75 | 1.05 | 1 | 1 | 1 | 2 | 5 | ▇▃▂▁▁ | 0.02 | 0.60 | 1 | 1.38 | 1.14 | 0.975 | 1.028 |
| Item 12 | 1.71 | 1.00 | 1 | 1 | 1 | 2 | 5 | ▇▃▂▁▁ | 0.02 | 0.58 | 1 | 1.39 | 1.28 | 0.994 | 0.935 |
| Item 13 S | 1.69 | 1.04 | 1 | 1 | 1 | 2 | 5 | ▇▂▂▁▁ | 0.02 | 0.61 | 1 | 1.50 | 1.50 | 1.285 | 1.422 |
| Item 14 S | 2.27 | 1.01 | 1 | 2 | 2 | 3 | 5 | ▅▇▆▂▁ | 0.02 | 0.44 | 2 | 0.56 | −0.15 | 0.919 | 0.902 |
| Item 15 | 2.47 | 1.24 | 1 | 1 | 2 | 3 | 5 | ▆▇▆▃▂ | 0.03 | 0.50 | 2 | 0.58 | −0.63 | 1.562 | 1.685 |
| Item 16 | 2.05 | 0.93 | 1 | 1 | 2 | 3 | 5 | ▅▇▃▁▁ | 0.02 | 0.45 | 2 | 0.87 | 0.66 | 0.985 | 0.983 |
| Item 17 S | 2.19 | 0.96 | 1 | 2 | 2 | 3 | 5 | ▅▇▅▁▁ | 0.02 | 0.44 | 2 | 0.66 | 0.18 | 0.885 | 0.869 |
| Item 18 S | 1.95 | 0.85 | 1 | 1 | 2 | 2 | 5 | ▆▇▃▁▁ | 0.02 | 0.43 | 2 | 0.86 | 0.92 | 0.994 | 0.981 |
| Item 19 S | 1.95 | 0.91 | 1 | 1 | 2 | 2 | 5 | ▇▇▃▁▁ | 0.02 | 0.47 | 2 | 0.92 | 0.71 | 1.061 | 1.075 |
| Item 20 S | 1.71 | 0.93 | 1 | 1 | 1 | 2 | 5 | ▇▅▂▁▁ | 0.02 | 0.55 | 1 | 1.40 | 1.69 | 0.956 | 0.889 |
| Item 21 | 2.35 | 1.04 | 1 | 2 | 2 | 3 | 5 | ▅▇▆▂▁ | 0.02 | 0.44 | 2 | 0.54 | −0.23 | 1.185 | 1.190 |
| Item 22 | 1.99 | 1.08 | 1 | 1 | 2 | 3 | 5 | ▇▆▃▂▁ | 0.02 | 0.54 | 1 | 0.93 | 0.06 | 1.047 | 1.019 |
| Item 23 S | 1.86 | 0.96 | 1 | 1 | 2 | 2 | 5 | ▇▆▃▁▁ | 0.02 | 0.52 | 1 | 1.12 | 0.89 | 0.975 | 0.980 |
| Portugal | |||||||||||||||
| Item 1 S | 3.21 | 0.86 | 1 | 3 | 3 | 4 | 5 | ▁▂▇▅▁ | 0.03 | 0.27 | 3 | −0.09 | 0.22 | 0.927 | 0.930 |
| Item 2 | 3.18 | 0.86 | 1 | 3 | 3 | 4 | 5 | ▁▂▇▅▁ | 0.03 | 0.27 | 3 | −0.04 | 0.12 | 1.313 | 1.312 |
| Item 3 S | 3.07 | 0.92 | 1 | 2 | 3 | 4 | 5 | ▁▅▇▅▁ | 0.03 | 0.30 | 3 | 0.03 | −0.24 | 0.900 | 0.907 |
| Item 4 S | 2.84 | 0.91 | 1 | 2 | 3 | 3 | 5 | ▁▆▇▃▁ | 0.03 | 0.32 | 3 | 0.17 | −0.22 | 0.912 | 0.905 |
| Item 5 | 2.82 | 1.00 | 1 | 2 | 3 | 3 | 5 | ▂▆▇▃▁ | 0.03 | 0.36 | 3 | 0.26 | −0.29 | 0.979 | 0.979 |
| Item 6 | 2.45 | 0.91 | 1 | 2 | 2 | 3 | 5 | ▂▇▆▂▁ | 0.03 | 0.37 | 2 | 0.46 | 0.04 | 0.988 | 0.989 |
| Item 7 | 2.49 | 0.90 | 1 | 2 | 2 | 3 | 5 | ▂▇▆▂▁ | 0.03 | 0.36 | 2 | 0.41 | −0.02 | 0.888 | 0.879 |
| Item 8 | 3.12 | 0.93 | 1 | 3 | 3 | 4 | 5 | ▁▃▇▅▁ | 0.03 | 0.30 | 3 | 0.02 | −0.16 | 0.913 | 0.903 |
| Item 9 S | 2.75 | 0.99 | 1 | 2 | 3 | 3 | 5 | ▂▆▇▃▁ | 0.03 | 0.36 | 3 | 0.24 | −0.25 | 0.979 | 0.986 |
| Item 10 S | 2.29 | 0.99 | 1 | 2 | 2 | 3 | 5 | ▅▇▅▂▁ | 0.03 | 0.43 | 2 | 0.54 | −0.24 | 1.152 | 1.148 |
| Item 11 | 2.02 | 1.03 | 1 | 1 | 2 | 3 | 5 | ▇▇▅▁▁ | 0.03 | 0.51 | 1 | 0.84 | 0.15 | 0.859 | 0.878 |
| Item 12 | 1.85 | 0.96 | 1 | 1 | 2 | 2 | 5 | ▇▆▃▁▁ | 0.03 | 0.52 | 1 | 1.08 | 0.72 | 0.876 | 0.772 |
| Item 13 S | 1.75 | 0.95 | 1 | 1 | 1 | 2 | 5 | ▇▅▂▁▁ | 0.03 | 0.55 | 1 | 1.21 | 0.91 | 1.257 | 1.339 |
| Item 14 S | 2.42 | 0.94 | 1 | 2 | 2 | 3 | 5 | ▃▇▆▂▁ | 0.03 | 0.39 | 2 | 0.40 | −0.06 | 0.816 | 0.808 |
| Item 15 | 2.76 | 1.12 | 1 | 2 | 3 | 4 | 5 | ▃▇▇▅▂ | 0.04 | 0.41 | 2 | 0.30 | −0.67 | 1.310 | 1.349 |
| Item 16 | 2.16 | 0.84 | 1 | 2 | 2 | 3 | 5 | ▃▇▃▁▁ | 0.03 | 0.39 | 2 | 0.56 | 0.29 | 0.970 | 0.961 |
| Item 17 S | 2.45 | 0.88 | 1 | 2 | 2 | 3 | 5 | ▂▇▆▂▁ | 0.03 | 0.36 | 2 | 0.43 | 0.29 | 0.771 | 0.776 |
| Item 18 S | 2.23 | 0.81 | 1 | 2 | 2 | 3 | 5 | ▂▇▅▁▁ | 0.03 | 0.36 | 2 | 0.56 | 0.53 | 0.960 | 0.944 |
| Item 19 S | 2.08 | 0.81 | 1 | 2 | 2 | 3 | 5 | ▃▇▃▁▁ | 0.03 | 0.39 | 2 | 0.72 | 1.01 | 1.150 | 1.161 |
| Item 20 S | 1.87 | 0.87 | 1 | 1 | 2 | 2 | 5 | ▇▇▃▁▁ | 0.03 | 0.47 | 2 | 0.96 | 0.82 | 0.855 | 0.821 |
| Item 21 | 2.34 | 0.89 | 1 | 2 | 2 | 3 | 5 | ▃▇▆▂▁ | 0.03 | 0.38 | 2 | 0.33 | −0.17 | 1.076 | 1.085 |
| Item 22 | 1.99 | 0.94 | 1 | 1 | 2 | 3 | 5 | ▇▇▅▁▁ | 0.03 | 0.47 | 2 | 0.77 | 0.08 | 0.981 | 0.929 |
| Item 23 S | 2.07 | 0.81 | 1 | 2 | 2 | 3 | 5 | ▃▇▃▁▁ | 0.03 | 0.39 | 2 | 0.54 | 0.25 | 0.979 | 0.987 |
| BAT-23 | ||||||||||||
|---|---|---|---|---|---|---|---|---|---|---|---|---|
| BAT Dimensions | Brazil | Portugal | Total | |||||||||
| αord | ω | CR | EAP | αord | ω | CR | EAP | αord | ω | CR | EAP | |
| Exhaustion | 0.92 | 0.91 | 0.95 | 0.92 | 0.92 | 0.91 | 0.96 | 0.92 | 0.93 | 0.92 | 0.96 | 0.92 |
| Mental Distance | 0.91 | 0.88 | 0.93 | 0.88 | 0.91 | 0.88 | 0.93 | 0.89 | 0.90 | 0.88 | 0.93 | 0.88 |
| Cognitive Impairment | 0.89 | 0.86 | 0.92 | 0.86 | 0.89 | 0.86 | 0.91 | 0.87 | 0.89 | 0.86 | 0.92 | 0.87 |
| Emotional Impairment | 0.91 | 0.88 | 0.95 | 0.87 | 0.91 | 0.88 | 0.94 | 0.88 | 0.90 | 0.88 | 0.94 | 0.88 |
| BAT-12 | ||||||||||||
| BAT Dimensions | Brazil | Portugal | Total | |||||||||
| αord | ω | CR | EAP | αord | ω | CR | EAP | αord | ω | CR | EAP | |
| Exhaustion | 0.88 | 0.85 | 0.88 | 0.85 | 0.90 | 0.86 | 0.90 | 0.85 | 0.88 | 0.85 | 0.88 | 0.85 |
| Mental Distance | 0.81 | 0.76 | 0.81 | 0.84 | 0.76 | 0.71 | 0.76 | 0.83 | 0.80 | 0.75 | 0.80 | 0.84 |
| Cognitive Impairment | 0.87 | 0.85 | 0.88 | 0.83 | 0.86 | 0.84 | 0.88 | 0.84 | 0.87 | 0.85 | 0.88 | 0.84 |
| Emotional Impairment | 0.89 | 0.85 | 0.89 | 0.82 | 0.86 | 0.81 | 0.86 | 0.82 | 0.88 | 0.84 | 0.88 | 0.82 |
| BAT-23 | |||||
|---|---|---|---|---|---|
| Countries (nBrazil = 2217, and nPortugal = 886) | |||||
| Model Invariance | χ2scaled | df | CFIscaled | Δχ2 | ΔCFIscaled |
| 1—Configural | 6635.928 | 452 | 0.934 | - | - |
| 2—Thresholds | 6725.056 | 494 | 0.934 | 50.517 ns | −0.000 |
| 3—Factor loadings | 6677.411 | 513 | 0.934 | 76.445 *** | 0.000 |
| 4—Structural weights | 6303.609 | 516 | 0.938 | 8.782 * | 0.004 |
| 5—Intercepts (first-order) | 6558.480 | 539 | 0.936 | 239.490 *** | −0.002 |
| 6—Latent means | 6572.809 | 543 | 0.936 | 94.758 *** | 0.000 |
| 7—Disturbances | 7064.532 | 547 | 0.930 | 15.470 ** | −0.006 |
| 8—Residuals | 6371.645 | 570 | 0.938 | 204.445 *** | −0.008 |
| Sex (nFemale = 2190, and nMale = 762) | |||||
| 1—Configural | 6325.536 | 452 | 0.934 | - | - |
| 2—Thresholds | 6458.035 | 494 | 0.933 | 53.446 ns | −0.001 |
| 3—Factor loadings | 6319.252 | 513 | 0.935 | 21.808 ns | 0.002 |
| 4—Structural weights | 6034.940 | 516 | 0.938 | 9.471 * | 0.003 |
| 5—Intercepts (first-order) | 6076.032 | 539 | 0.938 | 78.902 *** | 0.000 |
| 6—Latent means | 5163.396 | 543 | 0.948 | 16.141 ** | 0.010 |
| 7—Disturbances | 5973.735 | 547 | 0.939 | 59.214 *** | −0.009 |
| 8—Residuals | 5407.522 | 570 | 0.946 | 147.978 *** | 0.007 |
| BAT-12 | |||||
| Countries (nBrazil = 2217, and nPortugal = 886) | |||||
| Model Invariance | χ2scaled | df | CFIscaled | Δχ2 | ΔCFIscaled |
| 1—Configural | 1043.678 | 100 | 0.977 | - | - |
| 2—Thresholds | 1080.661 | 120 | 0.977 | 26.138 ns | 0.000 |
| 3—Factor loadings | 1081.793 | 128 | 0.977 | 21.379 ** | 0.000 |
| 4—Structural weights | 1032.024 | 132 | 0.978 | 16.411 ** | 0.001 |
| 5—Intercepts (first-order) | 1170.409 | 144 | 0.975 | 113.210 *** | −0.003 |
| 6—Latent means | 1750.003 | 148 | 0.961 | 127.530 *** | −0.014 |
| 7—Disturbances | 1690.957 | 151 | 0.963 | -132.455 ns | 0.002 |
| 8—Residuals | 1763.487 | 163 | 0.961 | 118.999 *** | −0.002 |
| Sex (nFemale = 2190, and nMale = 762) | |||||
| 1—Configural | 930.282 | 100 | 0.979 | - | - |
| 2—Thresholds | 970.210 | 120 | 0.979 | 23.217 ns | 0.000 |
| 3—Factor loadings | 958.424 | 128 | 0.979 | 9.269 ns | 0.000 |
| 4—Structural weights | 911.328 | 131 | 0.980 | 9.925 * | 0.001 |
| 5—Intercepts (first-order) | 973.760 | 143 | 0.979 | 44.065 *** | −0.001 |
| 6—Latent means | 845.688 | 147 | 0.982 | 15.721 ** | 0.003 |
| 7—Disturbances | 1172.354 | 151 | 0.974 | 46.429 *** | −0.008 |
| 8—Residuals | 1173.808 | 163 | 0.975 | 57.478 *** | 0.001 |
| BAT−23 | ||||||||||
|---|---|---|---|---|---|---|---|---|---|---|
| Brazil Total Sample (n = 2217) | ||||||||||
| Dimension | M | SD | Min | P25 | Mdn | P75 | Max | Histogram | sk | ku |
| Exhaustion | 2.87 | 0.83 | 1.00 | 2.25 | 2.88 | 3.38 | 5.00 | ▂▅▇▃▂ | 0.18 | −0.27 |
| Mental distance | 1.93 | 0.87 | 1.00 | 1.20 | 1.80 | 2.40 | 5.00 | ▇▃▂▁▁ | 1.09 | 0.78 |
| Cognitive impairment | 2.19 | 0.79 | 1.00 | 1.60 | 2.20 | 2.60 | 5.00 | ▇▇▃▁▁ | 0.62 | 0.43 |
| Emotional impairment | 1.97 | 0.81 | 1.00 | 1.40 | 1.80 | 2.40 | 5.00 | ▇▅▂▁▁ | 1.08 | 1.17 |
| Burnout | 2.32 | 0.69 | 1.00 | 1.83 | 2.26 | 2.74 | 5.00 | ▅▇▅▁▁ | 0.68 | 0.58 |
| Brazil Female Sample (n = 1653) | ||||||||||
| Exhaustion | 2.90 | 0.83 | 1.00 | 2.38 | 2.88 | 3.38 | 5.00 | ▂▅▇▃▂ | 0.15 | −0.30 |
| Mental distance | 1.90 | 0.86 | 1.00 | 1.20 | 1.60 | 2.40 | 5.00 | ▇▃▂▁▁ | 1.11 | 0.79 |
| Cognitive impairment | 2.19 | 0.78 | 1.00 | 1.60 | 2.00 | 2.60 | 5.00 | ▇▇▃▁▁ | 0.59 | 0.31 |
| Emotional impairment | 1.99 | 0.80 | 1.00 | 1.40 | 1.80 | 2.40 | 5.00 | ▇▅▂▁▁ | 1.01 | 0.95 |
| Burnout | 2.33 | 0.69 | 1.00 | 1.83 | 2.26 | 2.74 | 5.00 | ▅▇▅▁▁ | 0.65 | 0.37 |
| Brazil Male Sample (n = 558) | ||||||||||
| Exhaustion | 2.78 | 0.83 | 1.00 | 2.25 | 2.75 | 3.38 | 5.00 | ▂▆▇▃▁ | 0.26 | −0.13 |
| Mental distance | 2.02 | 0.90 | 1.00 | 1.40 | 1.80 | 2.60 | 5.00 | ▇▃▂▁▁ | 1.06 | 0.79 |
| Cognitive impairment | 2.17 | 0.79 | 1.00 | 1.60 | 2.20 | 2.60 | 5.00 | ▇▇▃▁▁ | 0.69 | 0.81 |
| Emotional impairment | 1.91 | 0.82 | 1.00 | 1.20 | 1.60 | 2.40 | 5.00 | ▇▅▁▁▁ | 1.29 | 1.88 |
| Burnout | 2.29 | 0.69 | 1.04 | 1.78 | 2.22 | 2.74 | 5.00 | ▆▇▅▁▁ | 0.76 | 1.29 |
| BAT−12 | ||||||||||
| Brazil Total Sample (n = 2217) | ||||||||||
| Exhaustion | 3.02 | 0.93 | 1.00 | 2.33 | 3.00 | 3.67 | 5.00 | ▂▃▇▃▂ | 0.07 | −0.35 |
| Mental distance | 2.07 | 0.92 | 1.00 | 1.33 | 2.00 | 2.67 | 5.00 | ▇▅▃▁▁ | 0.84 | 0.19 |
| Cognitive Impairment | 2.14 | 0.82 | 1.00 | 1.67 | 2.00 | 2.67 | 5.00 | ▇▇▅▁▁ | 0.69 | 0.46 |
| Emotional impairment | 1.84 | 0.82 | 1.00 | 1.00 | 1.67 | 2.33 | 5.00 | ▇▃▂▁▁ | 1.21 | 1.54 |
| Burnout | 2.27 | 0.69 | 1.00 | 1.75 | 2.17 | 2.67 | 5.00 | ▅▇▃▁▁ | 0.72 | 0.78 |
| Brazil Female Sample (n = 1653) | ||||||||||
| Exhaustion | 3.06 | 0.91 | 1.00 | 2.33 | 3.00 | 3.67 | 5.00 | ▂▃▇▃▂ | 0.06 | −0.35 |
| Mental distance | 2.04 | 0.91 | 1.00 | 1.33 | 2.00 | 2.67 | 5.00 | ▇▃▃▁▁ | 0.86 | 0.16 |
| Cognitive impairment | 2.15 | 0.81 | 1.00 | 1.67 | 2.00 | 2.67 | 5.00 | ▇▇▆▁▁ | 0.64 | 0.35 |
| Emotional impairment | 1.86 | 0.81 | 1.00 | 1.33 | 1.67 | 2.33 | 5.00 | ▇▅▂▁▁ | 1.15 | 1.33 |
| Burnout | 2.28 | 0.69 | 1.00 | 1.75 | 2.17 | 2.67 | 5.00 | ▅▇▃▁▁ | 0.70 | 0.55 |
| Brazil Male Sample (n = 558) | ||||||||||
| Exhaustion | 2.91 | 0.94 | 1.00 | 2.33 | 3.00 | 3.67 | 5 | ▂▅▇▃▂ | 0.11 | −0.34 |
| Mental distance | 2.14 | 0.93 | 1.00 | 1.33 | 2.00 | 2.67 | 5 | ▇▅▅▁▁ | 0.81 | 0.36 |
| Cognitive impairment | 2.10 | 0.84 | 1.00 | 1.33 | 2.00 | 2.67 | 5 | ▇▇▅▁▁ | 0.84 | 0.78 |
| Emotional impairment | 1.77 | 0.84 | 1.00 | 1.00 | 1.67 | 2.00 | 5 | ▇▃▂▁▁ | 1.42 | 2.24 |
| Burnout | 2.23 | 0.69 | 1.00 | 1.67 | 2.17 | 2.67 | 5 | ▅▇▃▁▁ | 0.80 | 1.52 |
| BAT-23 | ||||||||||
|---|---|---|---|---|---|---|---|---|---|---|
| Portugal Total Sample (n = 886) | ||||||||||
| Dimension | M | SD | Min | P25 | Mdn | P75 | Max | Histogram | sk | ku |
| Exhaustion | 2.91 | 0.74 | 1.00 | 2.38 | 2.88 | 3.38 | 5.00 | ▁▅▇▃▁ | 0.30 | 0.26 |
| Mental distance | 2.14 | 0.80 | 1.00 | 1.40 | 2.00 | 2.60 | 5.00 | ▇▆▃▁▁ | 0.70 | 0.09 |
| Cognitive impairment | 2.41 | 0.72 | 1.00 | 2.00 | 2.40 | 2.80 | 5.00 | ▃▇▅▁▁ | 0.41 | 0.54 |
| Emotional impairment | 2.08 | 0.70 | 1.00 | 1.60 | 2.00 | 2.40 | 5.00 | ▇▇▃▁▁ | 0.70 | 0.80 |
| Burnout | 2.45 | 0.62 | 1.00 | 2.04 | 2.39 | 2.83 | 5.00 | ▂▇▅▁▁ | 0.54 | 0.56 |
| Portugal Female Sample (n = 537) | ||||||||||
| Exhaustion | 2.95 | 0.76 | 1.12 | 2.50 | 2.88 | 3.38 | 5.00 | ▂▇▇▅▂ | 0.31 | 0.05 |
| Mental distance | 2.10 | 0.79 | 1.00 | 1.40 | 2.00 | 2.60 | 5.00 | ▇▆▃▁▁ | 0.68 | -0.04 |
| Cognitive impairment | 2.39 | 0.72 | 1.00 | 2.00 | 2.40 | 2.80 | 5.00 | ▃▇▅▁▁ | 0.33 | 0.51 |
| Emotional impairment | 2.08 | 0.69 | 1.00 | 1.60 | 2.00 | 2.40 | 5.00 | ▇▇▂▁▁ | 0.76 | 1.00 |
| Burnout | 2.45 | 0.63 | 1.04 | 2.00 | 2.39 | 2.83 | 5.00 | ▂▇▅▁▁ | 0.50 | 0.41 |
| Portugal Male Sample (n = 204) | ||||||||||
| Exhaustion | 2.85 | 0.73 | 1.00 | 2.38 | 2.75 | 3.38 | 5.00 | ▁▆▇▃▁ | 0.30 | 0.37 |
| Mental distance | 2.25 | 0.85 | 1.00 | 1.60 | 2.20 | 2.80 | 5.00 | ▇▇▃▁▁ | 0.78 | 0.35 |
| Cognitive impairment | 2.49 | 0.76 | 1.00 | 2.00 | 2.40 | 2.85 | 5.00 | ▃▇▃▂▁ | 0.57 | 0.55 |
| Emotional impairment | 2.09 | 0.77 | 1.00 | 1.40 | 2.00 | 2.60 | 5.00 | ▇▇▃▁▁ | 0.72 | 0.68 |
| Burnout | 2.48 | 0.66 | 1.00 | 2.00 | 2.39 | 2.84 | 4.91 | ▂▇▅▂▁ | 0.70 | 0.77 |
| BAT-12 | ||||||||||
| Portugal Total Sample (n = 886) | ||||||||||
| Exhaustion | 3.05 | 0.80 | 1.00 | 2.67 | 3.00 | 3.67 | 5.00 | ▁▃▇▃▁ | 0.12 | 0.05 |
| Mental distance | 2.27 | 0.78 | 1.00 | 1.67 | 2.00 | 2.67 | 5.00 | ▇▇▆▂▁ | 0.59 | 0.11 |
| Cognitive Impairment | 2.38 | 0.76 | 1.00 | 2.00 | 2.33 | 2.67 | 5.00 | ▅▇▇▁▁ | 0.48 | 0.59 |
| Emotional impairment | 2.02 | 0.71 | 1.00 | 1.33 | 2.00 | 2.33 | 5.00 | ▇▇▃▁▁ | 0.71 | 0.70 |
| Burnout | 2.43 | 0.61 | 1.00 | 2.00 | 2.33 | 2.75 | 5.00 | ▂▇▃▁▁ | 0.52 | 0.65 |
| Portugal Female Sample (n = 537) | ||||||||||
| Exhaustion | 3.09 | 0.82 | 1.00 | 2.67 | 3.00 | 3.67 | 5.00 | ▁▃▇▃▂ | 0.12 | -0.01 |
| Mental distance | 2.24 | 0.77 | 1.00 | 1.67 | 2.00 | 2.67 | 5.00 | ▇▇▇▁▁ | 0.55 | -0.01 |
| Cognitive impairment | 2.37 | 0.75 | 1.00 | 2.00 | 2.33 | 2.67 | 5.00 | ▅▇▇▁▁ | 0.42 | 0.56 |
| Emotional impairment | 2.02 | 0.70 | 1.00 | 1.33 | 2.00 | 2.33 | 5.00 | ▇▇▃▁▁ | 0.75 | 0.83 |
| Burnout | 2.43 | 0.61 | 1.00 | 2.00 | 2.33 | 2.83 | 5.00 | ▂▇▅▁▁ | 0.46 | 0.53 |
| Portugal Male Sample (n = 204) | ||||||||||
| Exhaustion | 2.96 | 0.80 | 1.00 | 2.33 | 3.00 | 3.33 | 5.00 | ▁▅▇▃▁ | 0.18 | 0.02 |
| Mental distance | 2.37 | 0.83 | 1.00 | 1.67 | 2.33 | 3.00 | 5.00 | ▆▇▆▂▁ | 0.65 | 0.21 |
| Cognitive impairment | 2.43 | 0.81 | 1.00 | 2.00 | 2.33 | 2.75 | 5.00 | ▃▇▆▂▁ | 0.76 | 0.72 |
| Emotional impairment | 2.02 | 0.77 | 1.00 | 1.33 | 2.00 | 2.33 | 5.00 | ▇▆▃▁▁ | 0.78 | 0.75 |
| Burnout | 2.44 | 0.66 | 1.00 | 2.00 | 2.33 | 2.83 | 4.92 | ▂▇▅▂▁ | 0.74 | 0.83 |
| BAT-23 | ||||||
|---|---|---|---|---|---|---|
| Burnout | Work Engagement | Negative Change | Work Overload | Role Clarity | Co-Workers Support | |
| Burnout | −0.81 *** | 0.52 *** | 0.59 *** | −0.62 *** | −0.45 *** | |
| Work Engagement | −0.75 *** | −0.61 *** | −0.32 *** | 0.66 *** | 0.41 *** | |
| Negative Change | 0.54 *** | −0.57 *** | 0.36 *** | −0.56 *** | −0.28 *** | |
| Work Overload | 0.35 *** | 0.08 * | 0.16 *** | −0.38 *** | −0.21 *** | |
| Role Clarity | −0.42 *** | 0.49 *** | −0.55 *** | 0.02 ns | 0.47 *** | |
| Co-workers Support | −0.45 *** | 0.49 *** | −0.52 *** | −0.12 *** | 0.53 *** | |
| BAT-12 | ||||||
| Burnout | Work Engagement | Negative Change | Work Overload | Role Clarity | Co-Workers Support | |
| Burnout | −0.80 *** | 0.53 *** | 0.61 *** | −0.62 *** | −0.44 *** | |
| Work Engagement | −0.73 *** | −0.61 *** | −0.31 *** | 0.66 *** | 0.41 *** | |
| Negative Change | 0.54 *** | −0.57 *** | 0.36 *** | −0.56 *** | −0.28 *** | |
| Work Overload | 0.35 *** | 0.09 ** | 0.15 *** | −0.38 *** | −0.21 *** | |
| Role Clarity | −0.44 *** | 0.48 *** | −0.56 *** | 0.02 ns | 0.47 *** | |
| Co-workers Support | −0.46 *** | 0.49 *** | −0.52 *** | −0.12 *** | 0.53 *** | |
Publisher’s Note: MDPI stays neutral with regard to jurisdictional claims in published maps and institutional affiliations. |
© 2022 by the authors. Licensee MDPI, Basel, Switzerland. This article is an open access article distributed under the terms and conditions of the Creative Commons Attribution (CC BY) license (https://creativecommons.org/licenses/by/4.0/).
Share and Cite
Sinval, J.; Vazquez, A.C.S.; Hutz, C.S.; Schaufeli, W.B.; Silva, S. Burnout Assessment Tool (BAT): Validity Evidence from Brazil and Portugal. Int. J. Environ. Res. Public Health 2022, 19, 1344. https://doi.org/10.3390/ijerph19031344
Sinval J, Vazquez ACS, Hutz CS, Schaufeli WB, Silva S. Burnout Assessment Tool (BAT): Validity Evidence from Brazil and Portugal. International Journal of Environmental Research and Public Health. 2022; 19(3):1344. https://doi.org/10.3390/ijerph19031344
Chicago/Turabian StyleSinval, Jorge, Ana Claudia S. Vazquez, Claudio Simon Hutz, Wilmar B. Schaufeli, and Sílvia Silva. 2022. "Burnout Assessment Tool (BAT): Validity Evidence from Brazil and Portugal" International Journal of Environmental Research and Public Health 19, no. 3: 1344. https://doi.org/10.3390/ijerph19031344