1. Introduction
Based on the noise reporting survey performed in the EU in 2017, more than 112 million inhabitants were exposed to average day–evening–night road traffic-related noise levels (L
den) ≥ 55 dB, and more than 78 million to night noise levels (L
night) ≥ 50 dB, in EEA-33 countries [
1]. The corresponding numbers for rail traffic were 21 and 17 million. L
den 55 dB and L
night 50 dB are the EU thresholds for excess exposure, as defined in the Environmental Noise Directive (END). Based on burden of disease (BoD) assessment, traffic noise is one of the most important environmental risks to human health in Europe [
2]. In 2011, the World Health Organization (WHO) Europe estimated that the main health burdens related to traffic noise resulted from sleep disturbance and annoyance [
3].
BoD calculations are based on the number of exposed individuals and exposure–response functions (ERFs). In environmental epidemiology, ERF is used to quantify population responses, such as annoyance or health effect, at different levels of exposure to a certain environmental stressor. ERFs generally depend on the exposure time. In this paper, the effects of long-term noise exposure are considered.
The most recent reviews and analyses of ERFs for traffic noise are presented in WHO’s systematic reviews on environmental noise and annoyance [
4] and sleep disturbance [
5]. These analyses include meta-analyses of several national surveys. Based on the reviews, there is high variation between the studies in terms of the methodology used in the social surveys and the exposure estimation, as well as between the communities (for example, population, building stock, habits, and meteorology). As a result of these differences, the ERFs fitted to the data (observed health effect vs. exposure) typically explain less than 40% of the variance, and the prediction interval is very large [
6].
Fidell et al. [
7] and Schomer et al. [
8] introduced a theory-based approach to predict the prevalence of annoyance. They defined the community tolerance level (L
ct) as a day–night sound level at which 50% of the people in a particular community are predicted to be highly annoyed. L
ct accounts for differences between sources and/or communities when predicting the percentage of those highly annoyed by noise. This theory-based method is included in the 2016 revision of ISO 1996-1 [
6].
The ERFs likely depend, at least to some extent, on the method used for exposure estimation. Unfortunately, the exposure estimation method is not always described in detail in publications. This leads to higher uncertainty in generalized ERFs based on meta- or re-analyses of several original studies.
In the END calculations, countries have used different methodologies to assign their populations to dwellings. In 2012, Kephalopoulos et al. [
9] published a methodological framework for Common Noise Assessment Methods in Europe (CNOSSOS-EU). They proposed a revised definition, under which the most exposed façade is the external wall of the dwelling exposed to the highest value of L
den or L
night from the specific noise source under consideration. For buildings containing multiple dwellings, when the specific layout of said dwellings is not known, the approach is based on the equal distribution principle, whereby residents are assigned equally to all façade noise receivers (i.e., locations where predictions of noise levels are available). Previously, the most exposed façade was determined as “the external wall facing onto and nearest to the specific noise source”. Thus, it was not defined whether it was the most exposed façade of the building or a dwelling. For example, in Finland, the locations of dwellings within a building are not known, and previously all inhabitants have been assigned to the building’s highest façade noise level [
10].
The CNOSSOS-EU method was established in the Commission Directive (EU) 2015/996 of 19 May 2015. In Finland, the CNOSSOS-EU method was already being used in the 2017 round. In the Helsinki Capital Region, the numbers of people exposed to high traffic noise levels were compared between the old (all inhabitants assigned to the highest façade noise level of the building) and the new (equal distribution) methods [
10]. The results for Helsinki are shown in
Table 1. Using the new method, the number of residents exposed to such noise was, on average, less than half that given by the old calculation method.
During the next round of END in 2022, the CNOSSOS-EU method will be used in all countries. This will remarkably decrease the estimated number of people exposed to high traffic noise levels. The equal distribution principle leads to more precise exposure estimation, and thus the old exposure–response functions may become unfit.
The aim of this study was to evaluate the effect of the exposure assessment approach on the exposure–response functions. In addition, ERFs for the effects of road and rail traffic noise on annoyance and sleep disturbance are provided for cities in subarctic climate regions, where the thermal insulation of residential buildings also enhances the sound insulation.
2. Materials and Methods
2.1. Study Design and Participants
The Helsinki Capital Region Environmental Health Survey was conducted in Helsinki, Espoo and Vantaa, in Finland. The survey was carried out to evaluate residents’ perceived exposures to specific environmental factors and their views of health risks caused by the environment. It aimed at assessing the health risks associated with noise and air pollution exposure and the potential health benefits of access to green areas. Additionally, some history of medical conditions and data on confounders were collected to facilitate epidemiological analysis. The questionnaire had 93 questions and numerous sub-questions. The survey was conducted in two phases: firstly, in the city of Helsinki from the latter part of May to August of 2015; secondly, in the cities of Espoo and Vantaa from June to August of 2016. In total, 8000 residents aged 25 years and above were chosen from the Population Registry of Finland using simple random sampling in 2015; the same number of residents was sampled in 2016, yielding a total sample of 16,000 residents. Potential respondents were contacted by post and invited to fill in a self-administered questionnaire, which they could choose to complete on paper or electronically. One reminder was sent to non-respondents. This procedure resulted in 7321 valid records.
2.2. Annoyance and Sleep Disturbance
Subjective noise annoyance was assessed using the questionnaire item, “Are you usually disturbed by road traffic noise (i.e., noise annoys you, disturbs your concentration, etc.) indoors at home when the windows are closed?” The response options were: (1) not at all; (2) slightly; (3) moderately; (4) very; (5) extremely. This question deviates from the instructions of ISO/TS 15666:2003 [
11]. The location (home indoors) and window position (closed) were added because in Finland the “Decree of the Ministry of Social Affairs and Health on Health-related Conditions of Housing and Other Residential Buildings and Qualification Requirements for Third-party Experts” requires these circumstances when estimating disturbance caused by noise at home [
12].
Subjective sleep disturbance was assessed using the questionnaire item, “Is your sleep usually disturbed by road traffic noise (i.e., noise prevents you from falling asleep, wakes you up) at home?” The response options to this question were: (1) not at all; (2) slightly; (3) moderately; (4) very; (5) extremely. The same questions about annoyance and sleep disturbance were then asked separately for rail traffic noise.
2.3. Window Orientation
The following questions were asked to find out the orientations of the windows in respondent’s dwellings (response options in parenthesis): “In which direction your dwelling windows are facing? ((1) the street; (2) the yard; (3) both the street and the yard)”; “In which direction your bedroom windows are facing? ((1) the street; (2) the yard)”.
2.4. Exposure Estimation
Lden and Lnight were used as the exposure indicators. Lden is a descriptor of A-weighted noise level based on long-term energy equivalent noise level (Leq) over a whole day, with a penalty of 5 dB for evening noise (19.00–22.00) and 10 dB for nighttime noise (22.00–7.00) to reflect people’s extra sensitivity to noise during evening and night. Lnight is the A-weighted long-term average sound level for nighttime (22.00–7.00).
The residential exposure to road and rail traffic noise was estimated from façade noise maps, which were modeled for the Helsinki Capital Region by the Sito consulting company. Sito carried out the 2017 noise calculations in accordance with the Environmental Noise Directive 2002/49/EC, using the Common Noise Assessment Methods in Europe (CNOSSOS-EU; the Commission Directive (EU) 2015/996 of 19 May 2015) for road and rail traffic noise. The noise models were based on 2016 data. There have been no major changes in the traffic situation in the years prior to the survey, and thus, the noise conditions have remained stable in the study area.
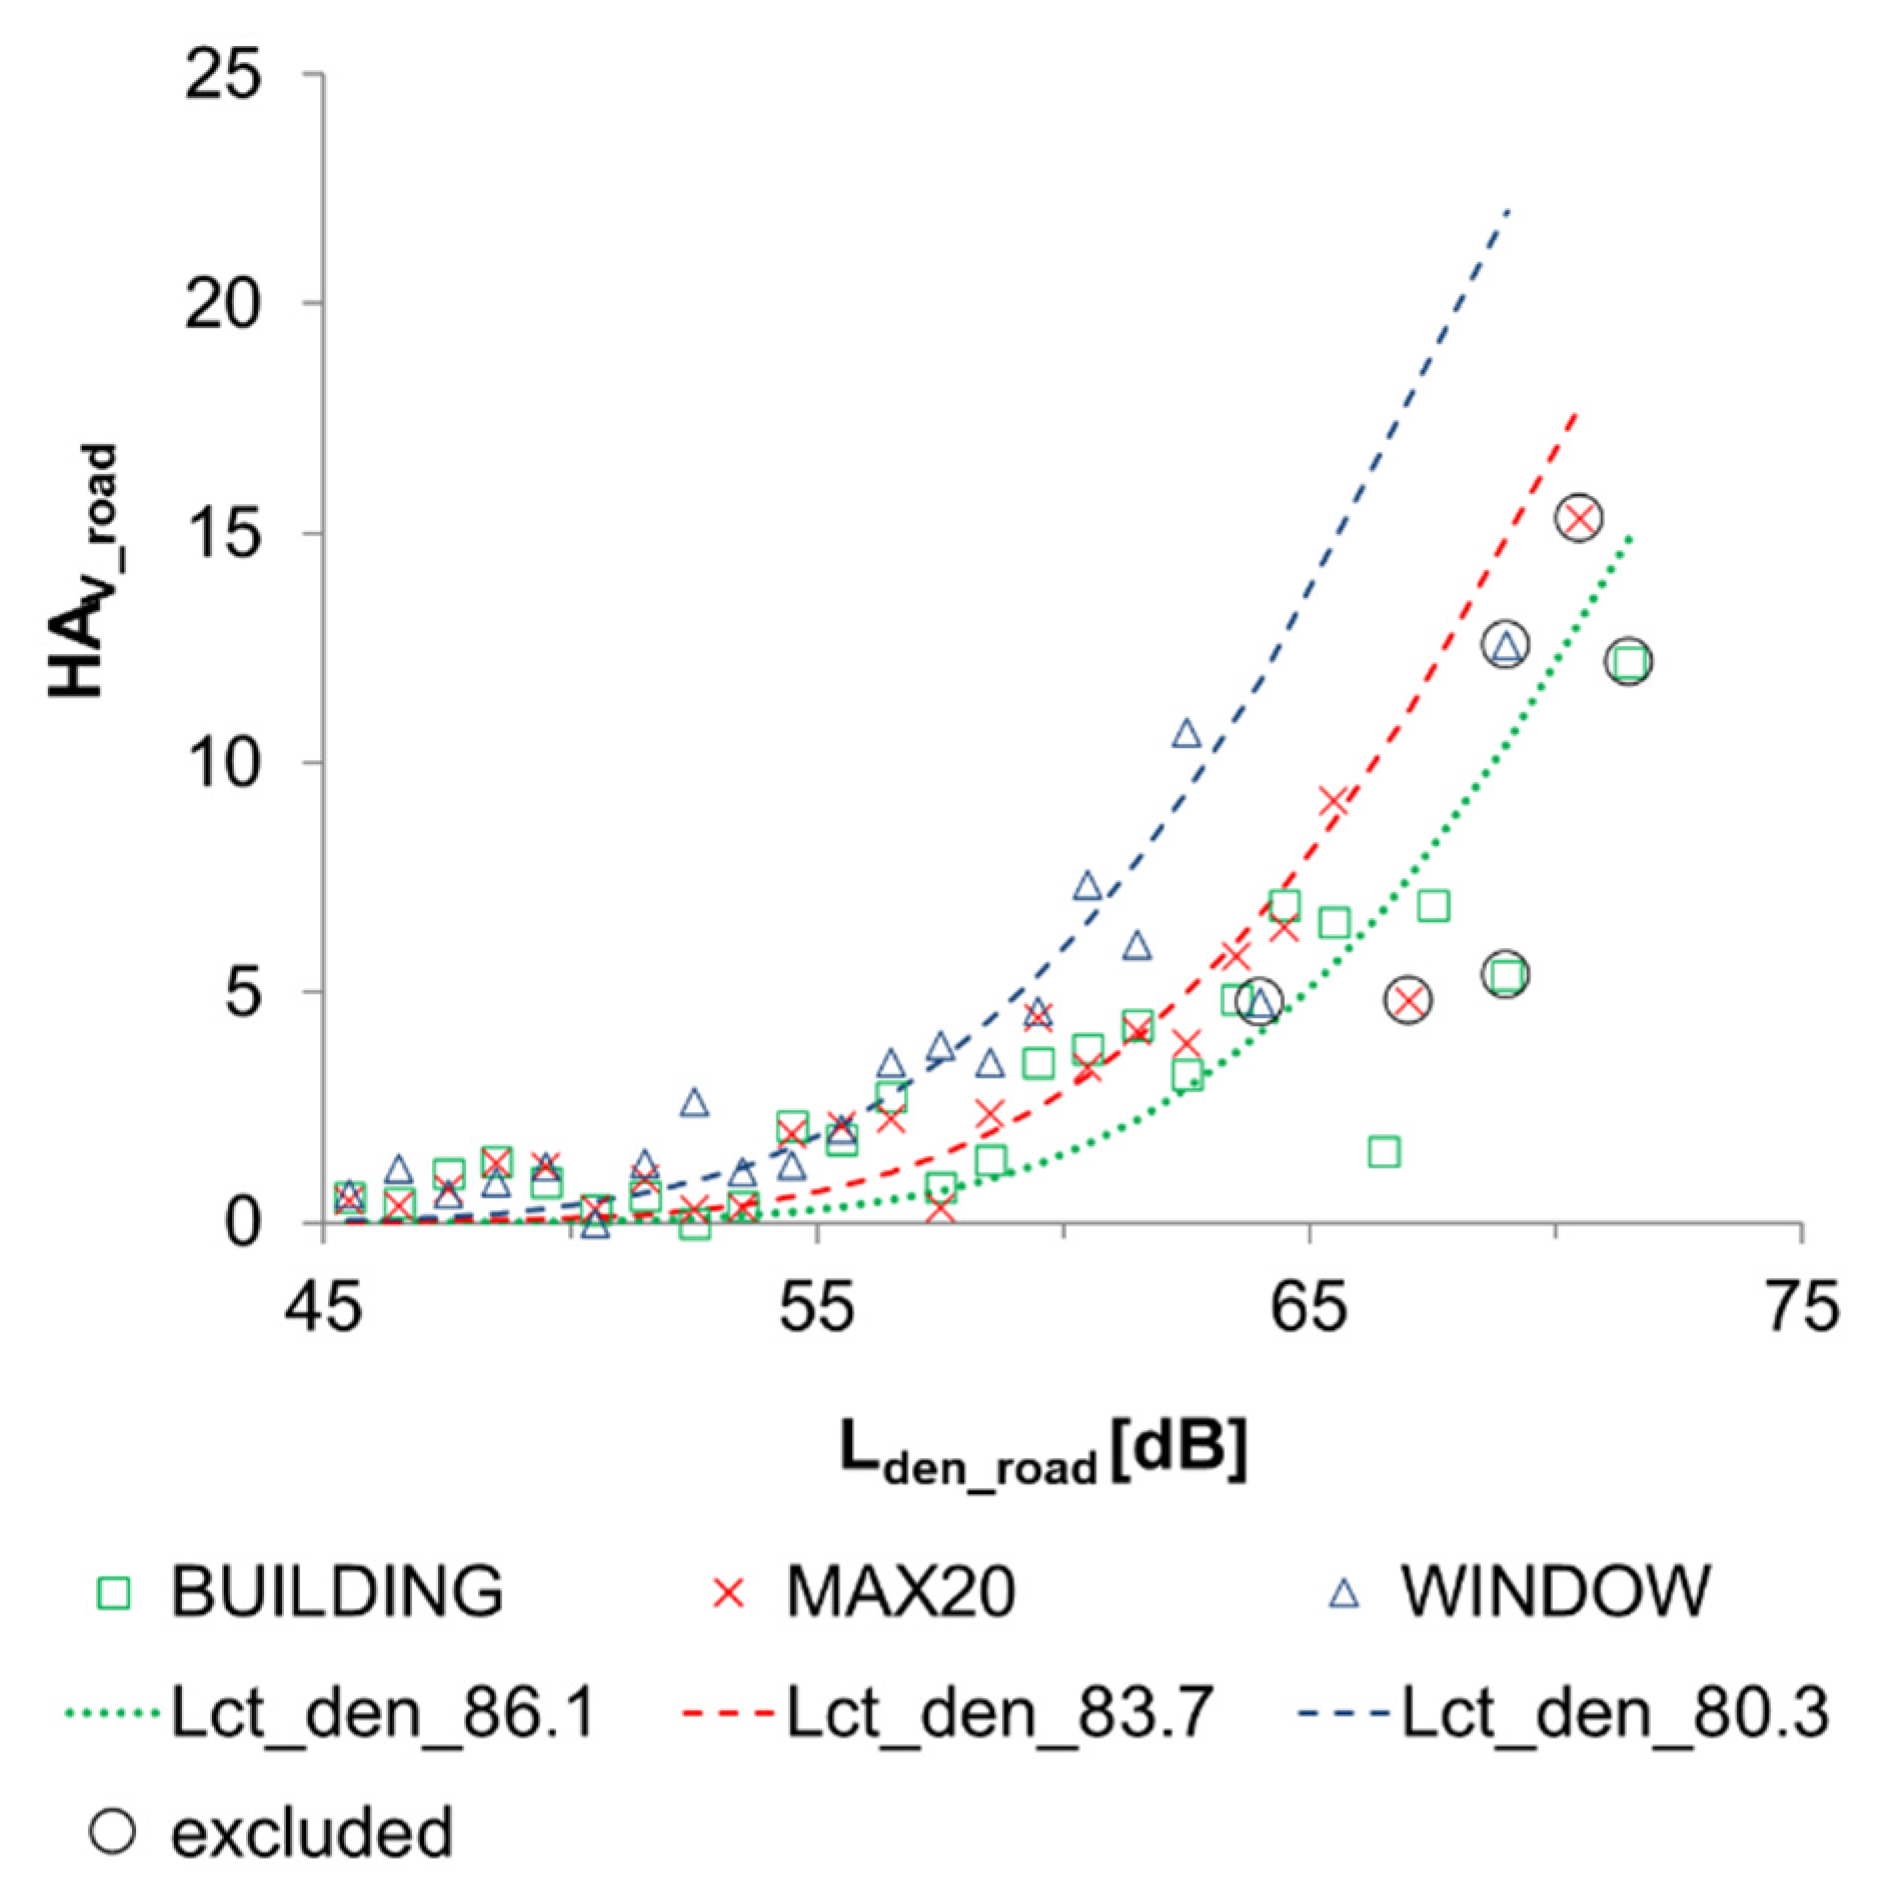
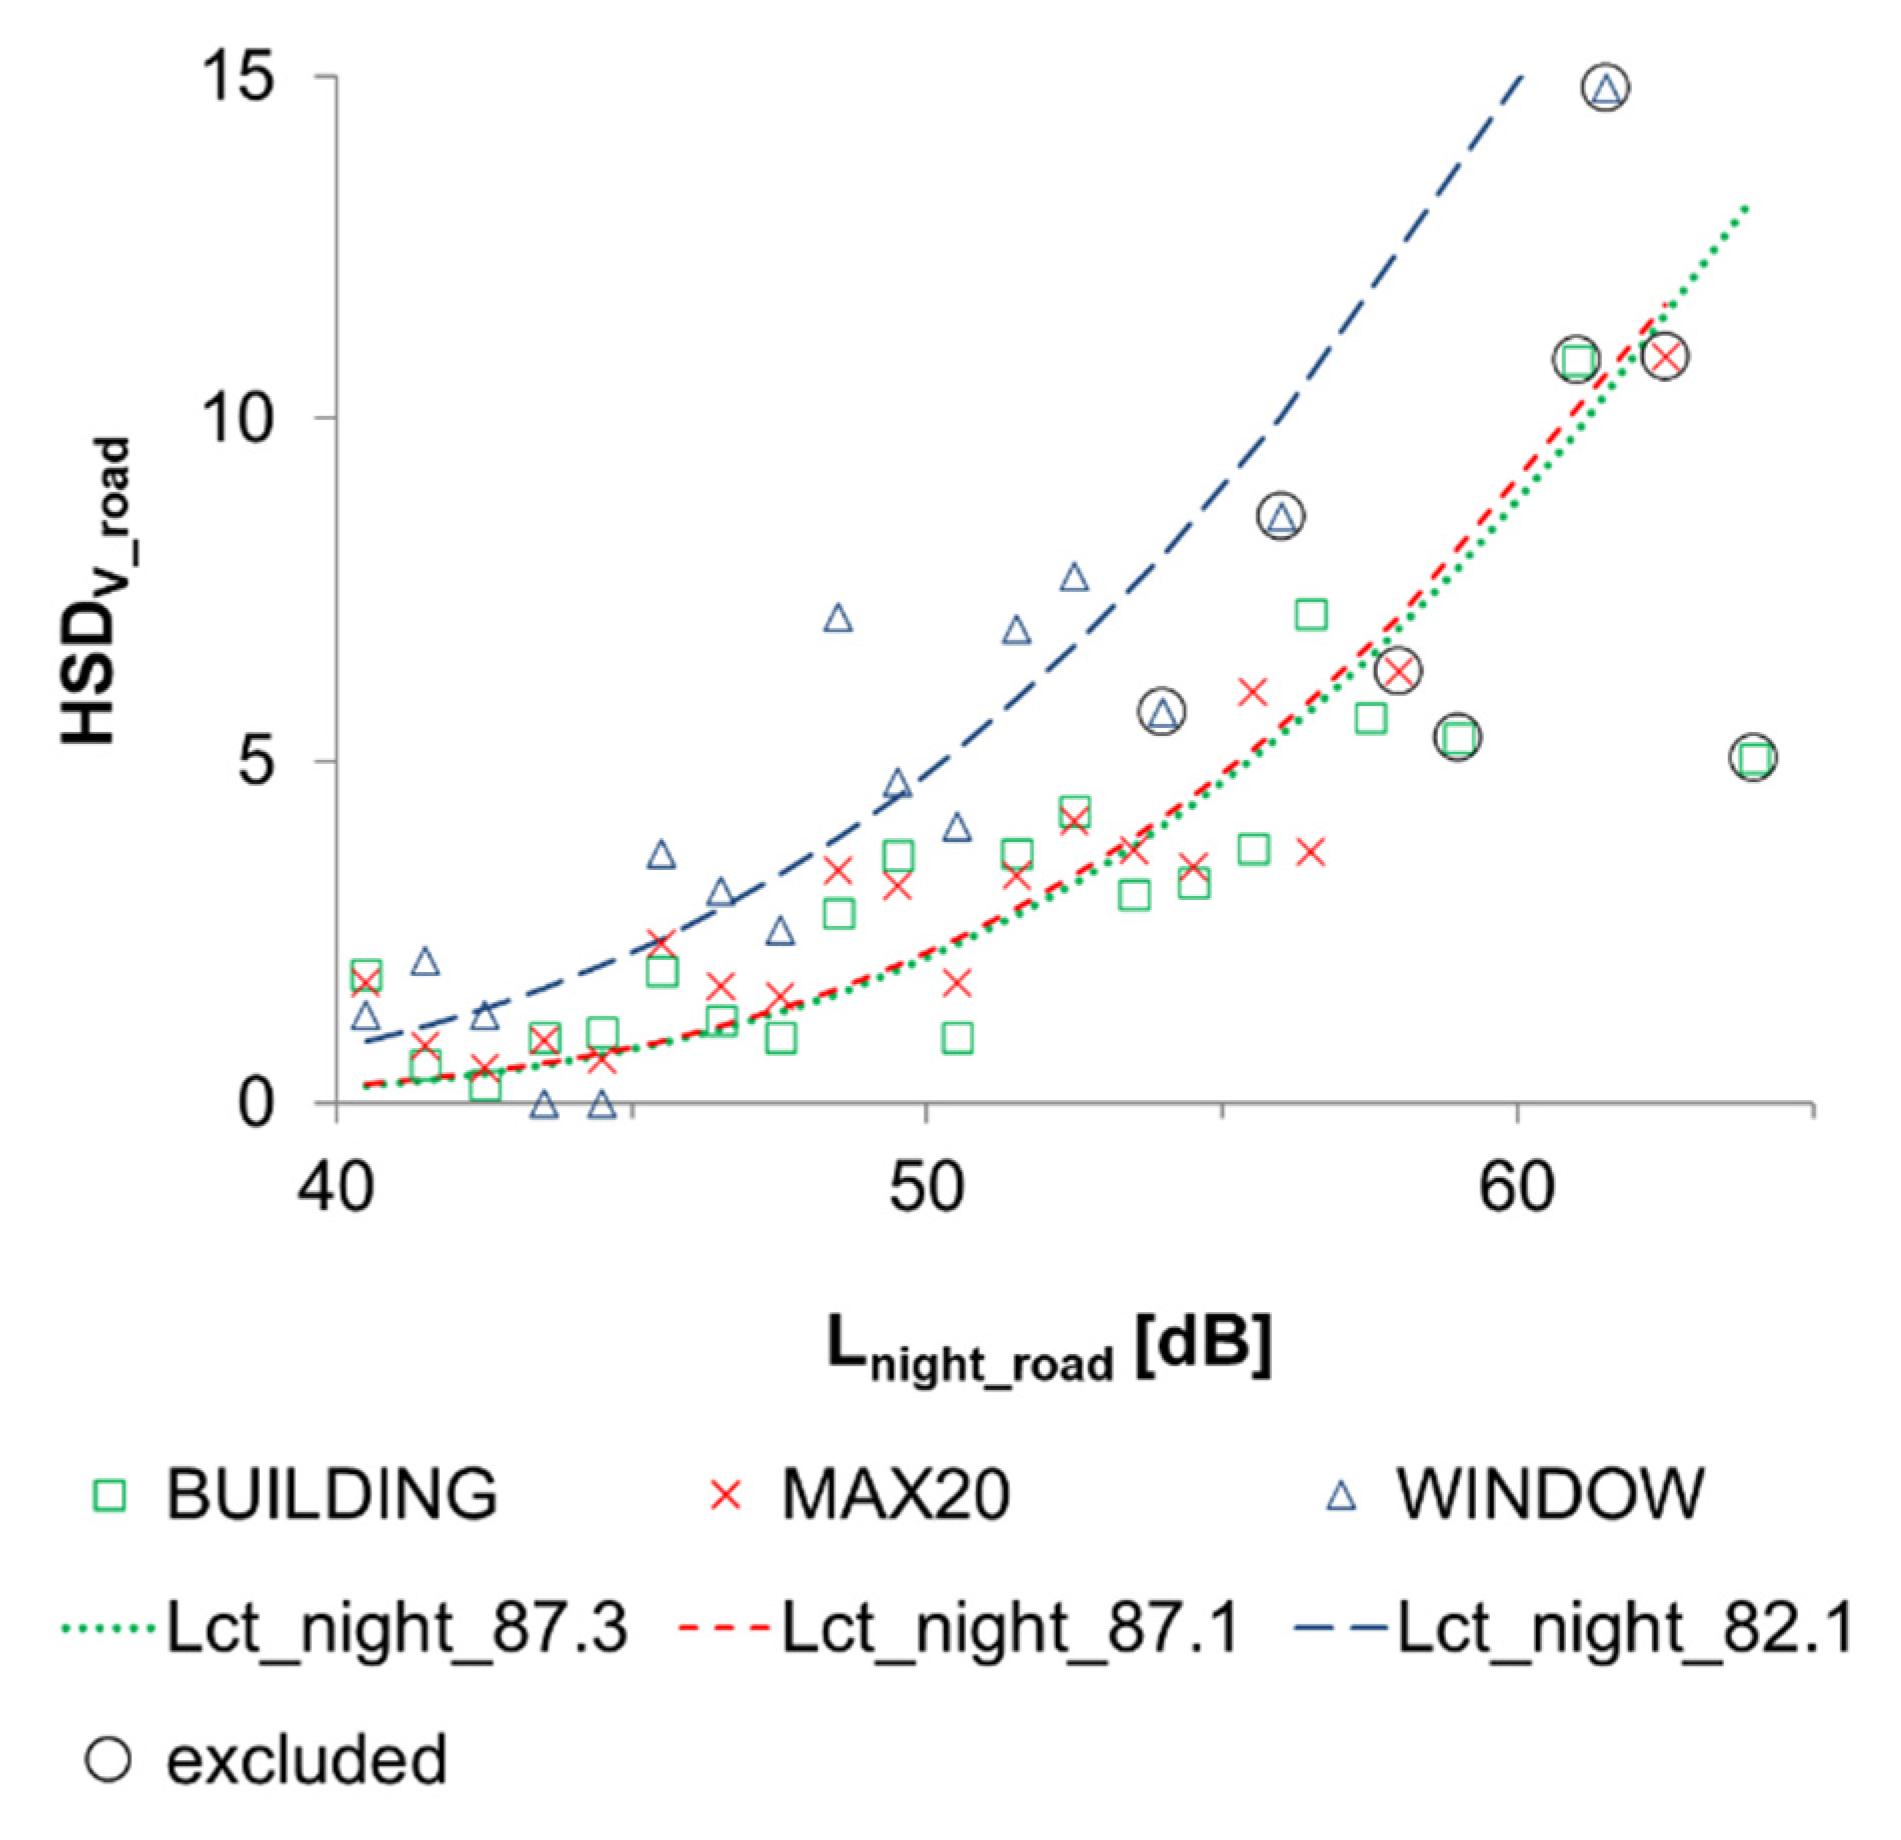
In order to study the effects of using different exposure assessment methods on exposure–response functions, three sets of L
den and L
night were used in this study for road traffic noise: (1) BUILDING: The highest façade noise level of the residential building was used for all respondents living in that building; (2) MAX20: the highest L
den or L
night at the façade points within 20 m of the center point of the building, as registered by the Digital and Population Data Services Agency for the resident’s home address, were used; (3) WINDOW: Depending on the directions of all windows in the dwelling (annoyance assessment) or the bedroom window (sleep disturbance), the highest (window(s) facing street), the lowest (window(s) facing yard), or the logarithmic average of the highest and lowest (windows facing both the street and the yard) L
den or L
night at the façade points within 20 m of resident’s home address were used in the exposure assessment. In Finland, the BUILDING method was used during the 1st and 2nd rounds of strategic noise mapping, because no data are available on dwelling location and the distribution of residents within the building [
10]. MAX20 is the best estimate for the average highest façade noise level in all dwellings in a given building when the window directions are not known, while the WINDOW method gives the best exposure estimate if window directions are known but there are no data on dwelling location within the building. Examples of the exposure assessment methods are shown in
Figure 1 in the Results. For rail traffic noise only the MAX20 method was available.
2.5. Outcome Variables
A special outcome variable is the percentage of “highly annoyed” study participants. Those who are highly annoyed are individuals that respond in the upper parts of the annoyance response scale. Based on the recommendation of the ICBEN team’s “community response to noise” [
13], the top two points of the 5-point scale (“very” and “extremely”) were combined to measure the percentage of highly annoyed and will be referred to as HA
V [
11]. The same 60% cut-off point was used to estimate the “percentage of highly sleep disturbed” (HSDV) respondents.
2.6. Exposure–Response Functions
For road traffic noise, L
den and L
night were divided into intervals of 1 dB. If such an interval contained less than 100 cases, it was combined with the adjacent interval with the least observations. This step was repeated until every interval contained at least 100 cases. This procedure was modified from [
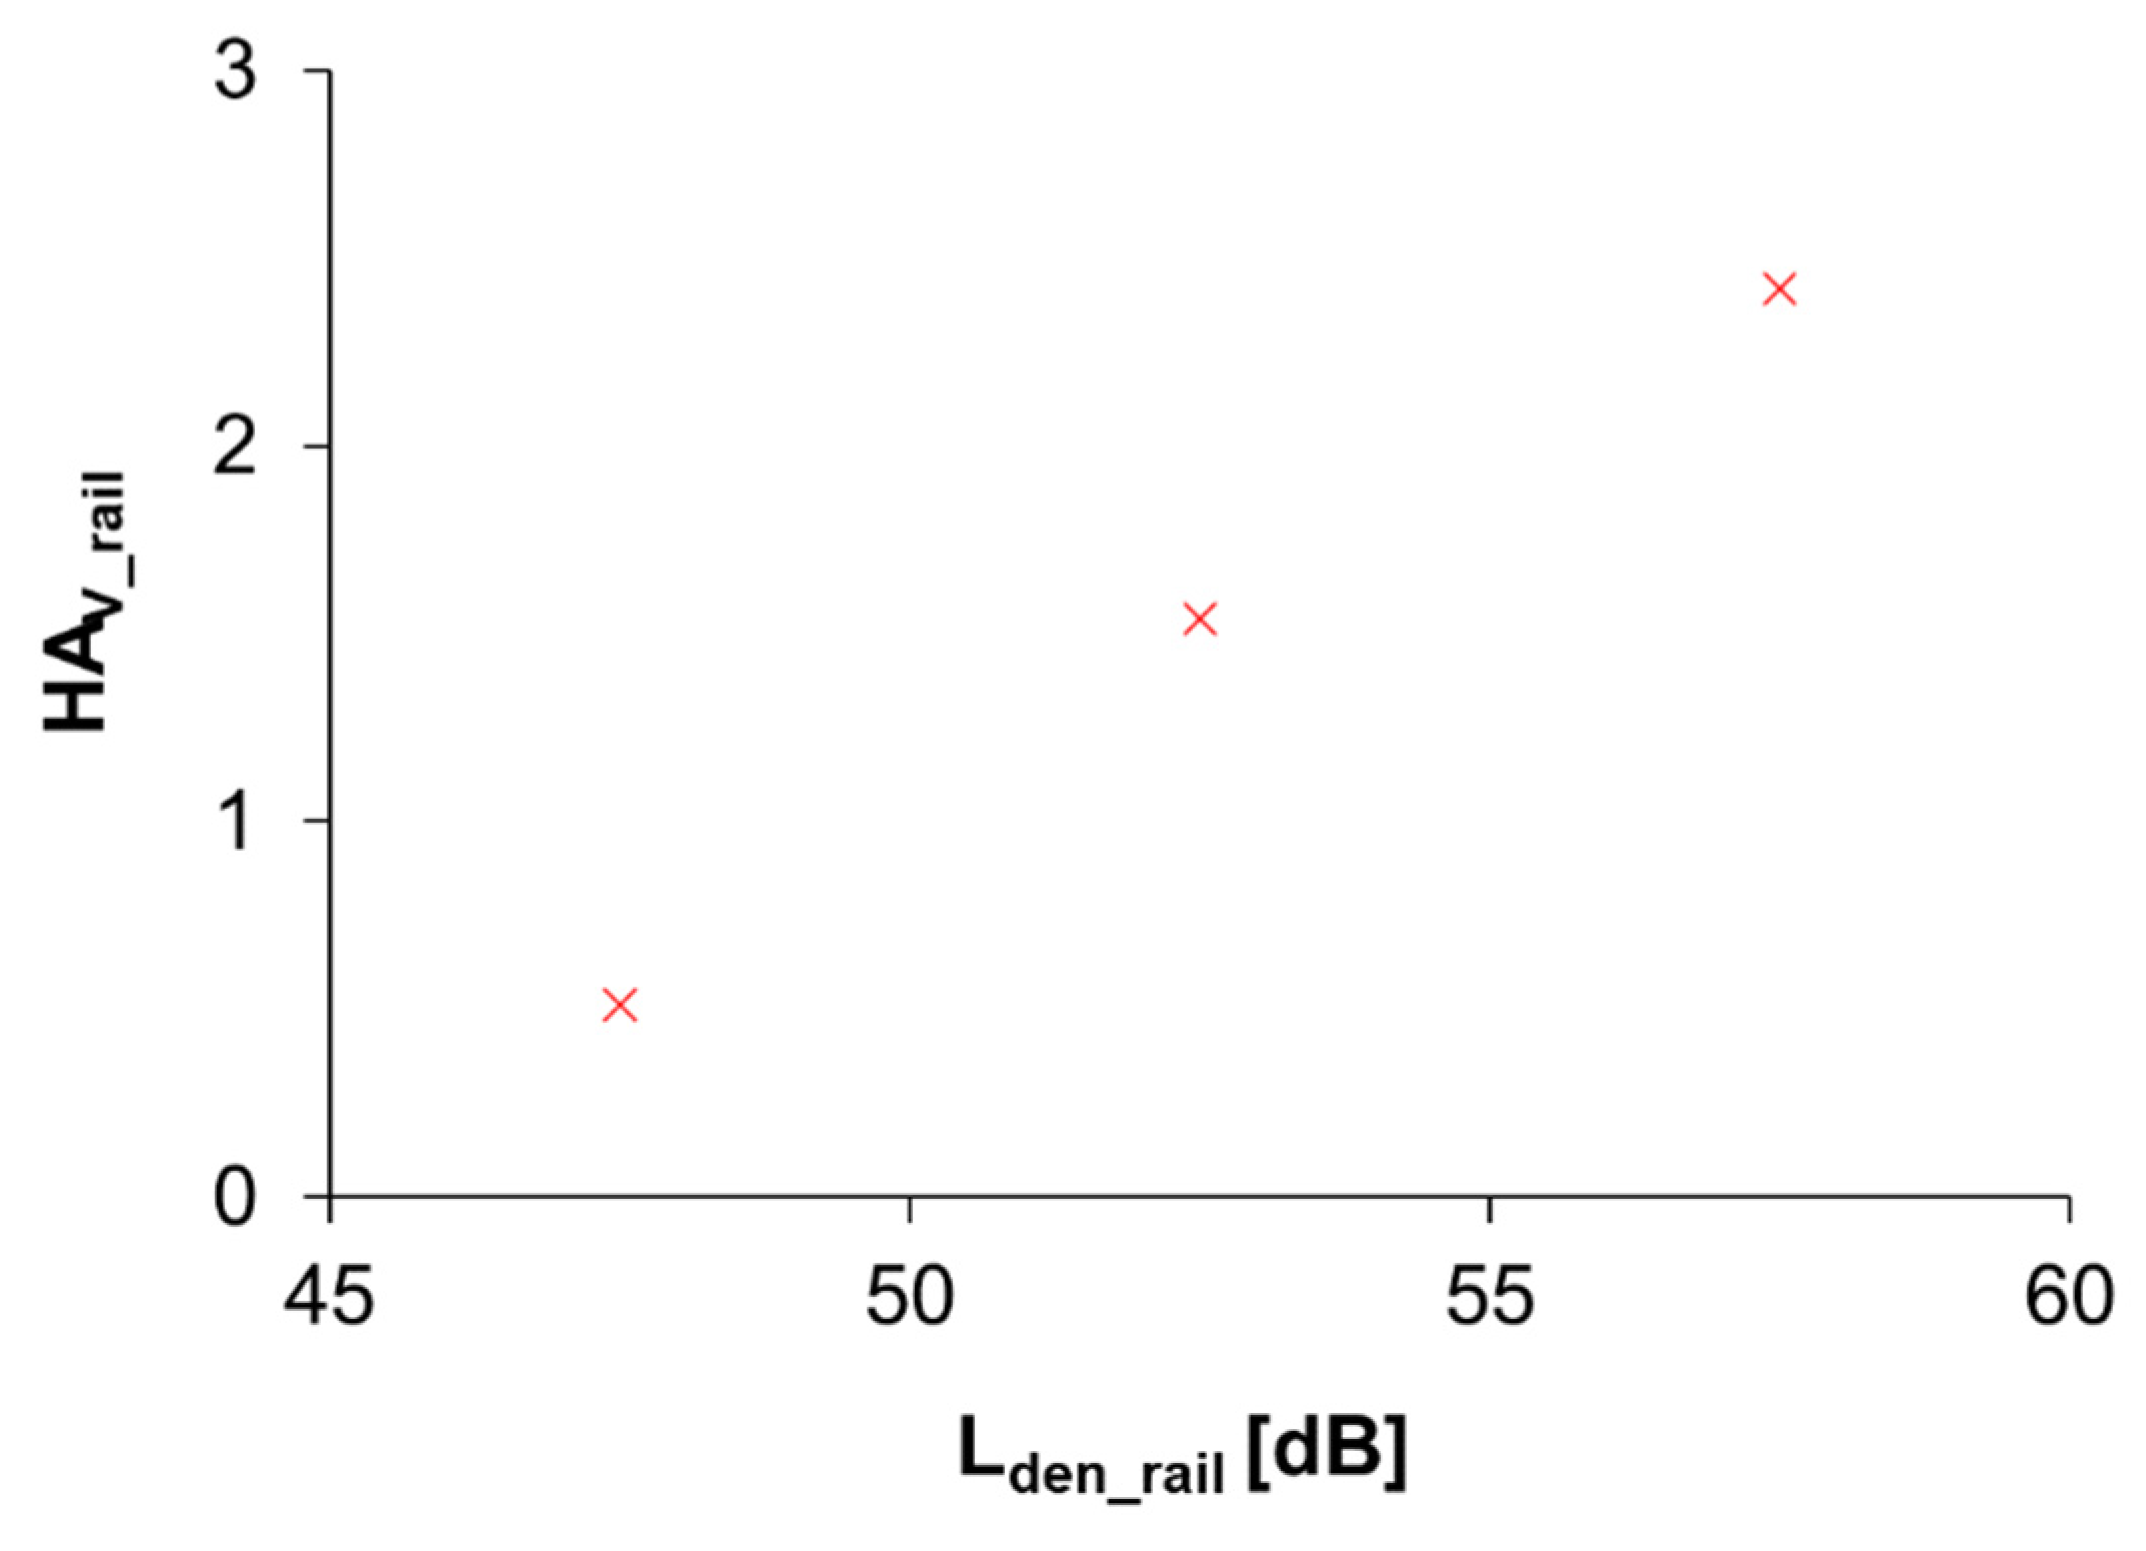
14]. For each resulting interval, the midpoint and the outcome variables were determined and plotted. For rail noise, intervals of 5 dB were used because the number of exposed individuals was much smaller, especially at the high noise levels. The exposure–response functions were only specified for L
den ≥ 45 dB and L
night ≥ 40 dB. Low exposure levels were excluded from the analyses because, in general, the assessment of those levels is relatively inaccurate, and when noise levels are low, other noise sources than traffic may be more significant.
Community tolerance level (L
ct_den) was determined for the study population. L
ct is defined as the day–night sound level (L
dn) at which 50% of the people in a particular community are predicted to be highly annoyed by noise exposure [
6,
7,
8]. L
ct is used as a parameter that accounts for differences between sources and/or communities when predicting the percentage of highly annoyed by noise exposure. A community with a higher L
ct is more tolerant to noise than a community with a lower L
ct. In addition to community properties, L
ct also depends on the exposure estimation method. In this paper, L
ct_den is defined as the L
den at which HA
V = 50 and is determined empirically by finding the value of L
ct_den (to a precision of 0.1 dB) that minimizes the root mean square difference between the theory-based equation (Equation (1)) and pairs of empirical (L
den, HA
V) observations derived from the questionnaire study. This procedure was modified from [
6].
There is no theory-based equation available for the HSDV in the literature. We modified Equation (1) to give the best fit for HSDV in our data and determined Lct_night as the Lnight at which HSDV = 50. Only observations with 1 dB intervals were used in the determination of Lct_den and Lct_night.
ERFs were also determined using regression formulation. However, the coefficients of determination (R2) between the exposure and the outcome variable were lower for 2nd or 3rd degree polynomial functions (best fit) than for Equation (1), and thus these functions are not shown.
It should be noted that all the ERFs presented in this paper are only applicable to existing situations and long-term (annual) averages of traffic noise. They should not be used with shorter time periods, such as weekends or during a brief increase in road traffic. In newly created situations, especially when the community is not familiar with the sound source in question, higher community annoyance can be expected. This difference may be up to 5 dB [
6].
4. Discussion
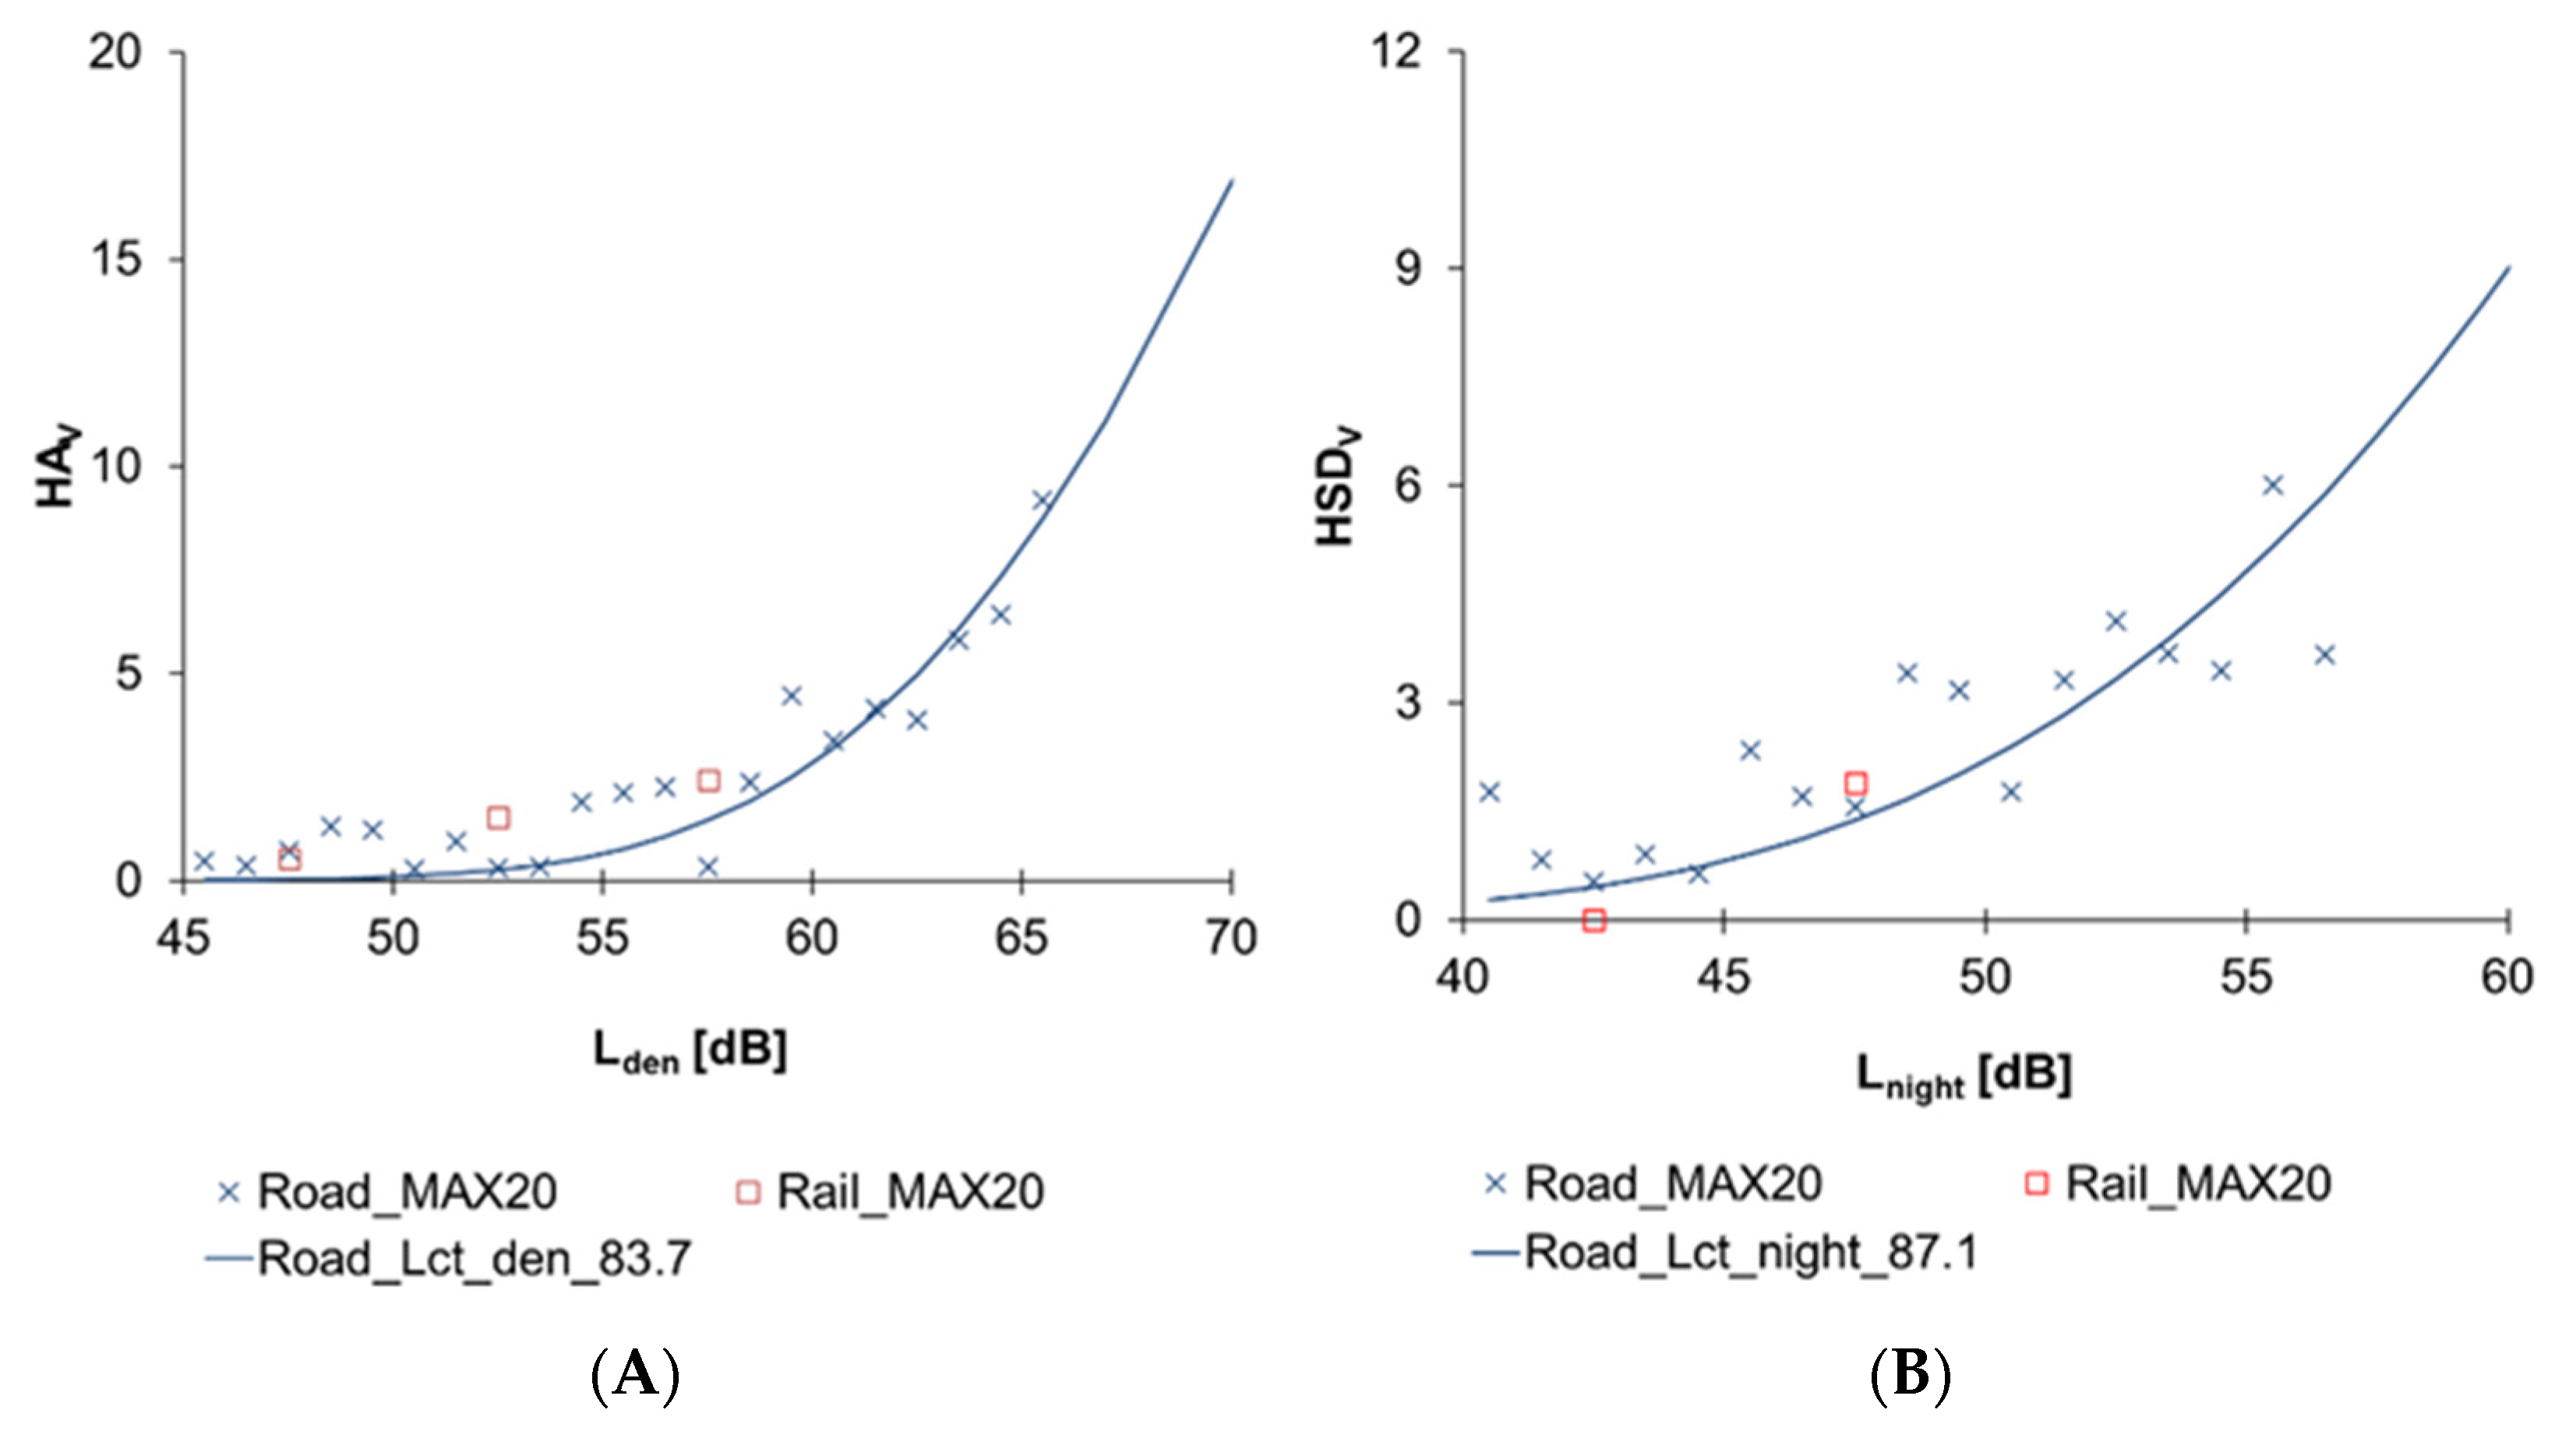
The exposure–response functions between road traffic noise and the percentage of highly annoyed and highly sleep disturbed respondents in the Helsinki Capital Region Environmental Health Survey were studied using three different exposure assessment methods. In addition, HAV was calculated for rail traffic noise using the highest façade noise level within 20 m of the coordinates of the dwelling.
There are inaccuracies in all the exposure assessment methods currently available for population level studies on the health effects of noise, including the ones used in this study. Home indoor noise levels would give more accurate exposure estimates, but the values of the variables affecting the sound insulation of dwellings are typically unknown. In this study, individuals reported their annoyance and sleep disturbance at the noise level that they were actually exposed to when at home, indoors, with the windows closed. Therefore, the noise exposure estimate, that is, the noise level modeled at the façade of their dwelling, was much higher than the actual exposure level. The magnitude of this error depends on the exposure assessment method selected. Under the BUILDING and MAX20 methods, the noise level at the most exposed façade of the dwelling is likely to be overestimated, especially for buildings containing several dwellings, and thus annoyance at certain façade noise levels may be misclassified into a higher noise class. This was observed in the results, as the HAV and HSDV decreased from WINDOW to MAX20, and again to BUILDING.
The data on the higher levels of rail traffic noise were, unfortunately, too sparse for use in the determination of exposure–response functions. The empirical observations derived from the questionnaire study were close to those for road traffic noise, but the effects of the different intervals used for the calculations (1 dB for road and 5–10 dB for rail traffic) are unclear. In the road traffic data, intervals above 1 dB tended to produce lower responses and were thus excluded from the analysis.
In multi-story residential buildings, 17% of the respondents only had access to the most exposed façade of the building, and 28%, only to the yard. Thus, using the CNOSSOS-EU method for assigning noise levels and populations to buildings gives more accurate estimates for the number of citizens in each noise class than the old method, under which the highest façade noise level of the entire residential building was allocated to all residents living in that building. In Finland, the 2017 END calculations were carried out using the CNOSSOS-EU method, and the number of residents exposed to Lden above 55 dB was generally less than half that given by the old calculation method. However, the ERF defined for the old exposure assessment method cannot be easily accommodated with the CNOSSOS-EU method. Based on our results, the estimates of adverse health effects will not decrease accordingly if the correct ERF is used. Therefore, there is an urgent need to develop ERFs for the CNOSSOS-EU exposure estimation method.


