Integrating Spatial Heterogeneity into an Analysis between Ecosystem Service Value and Its Driving Factors: A Case Study of Dalian, China
Abstract
1. Introduction
2. Materials and Methods
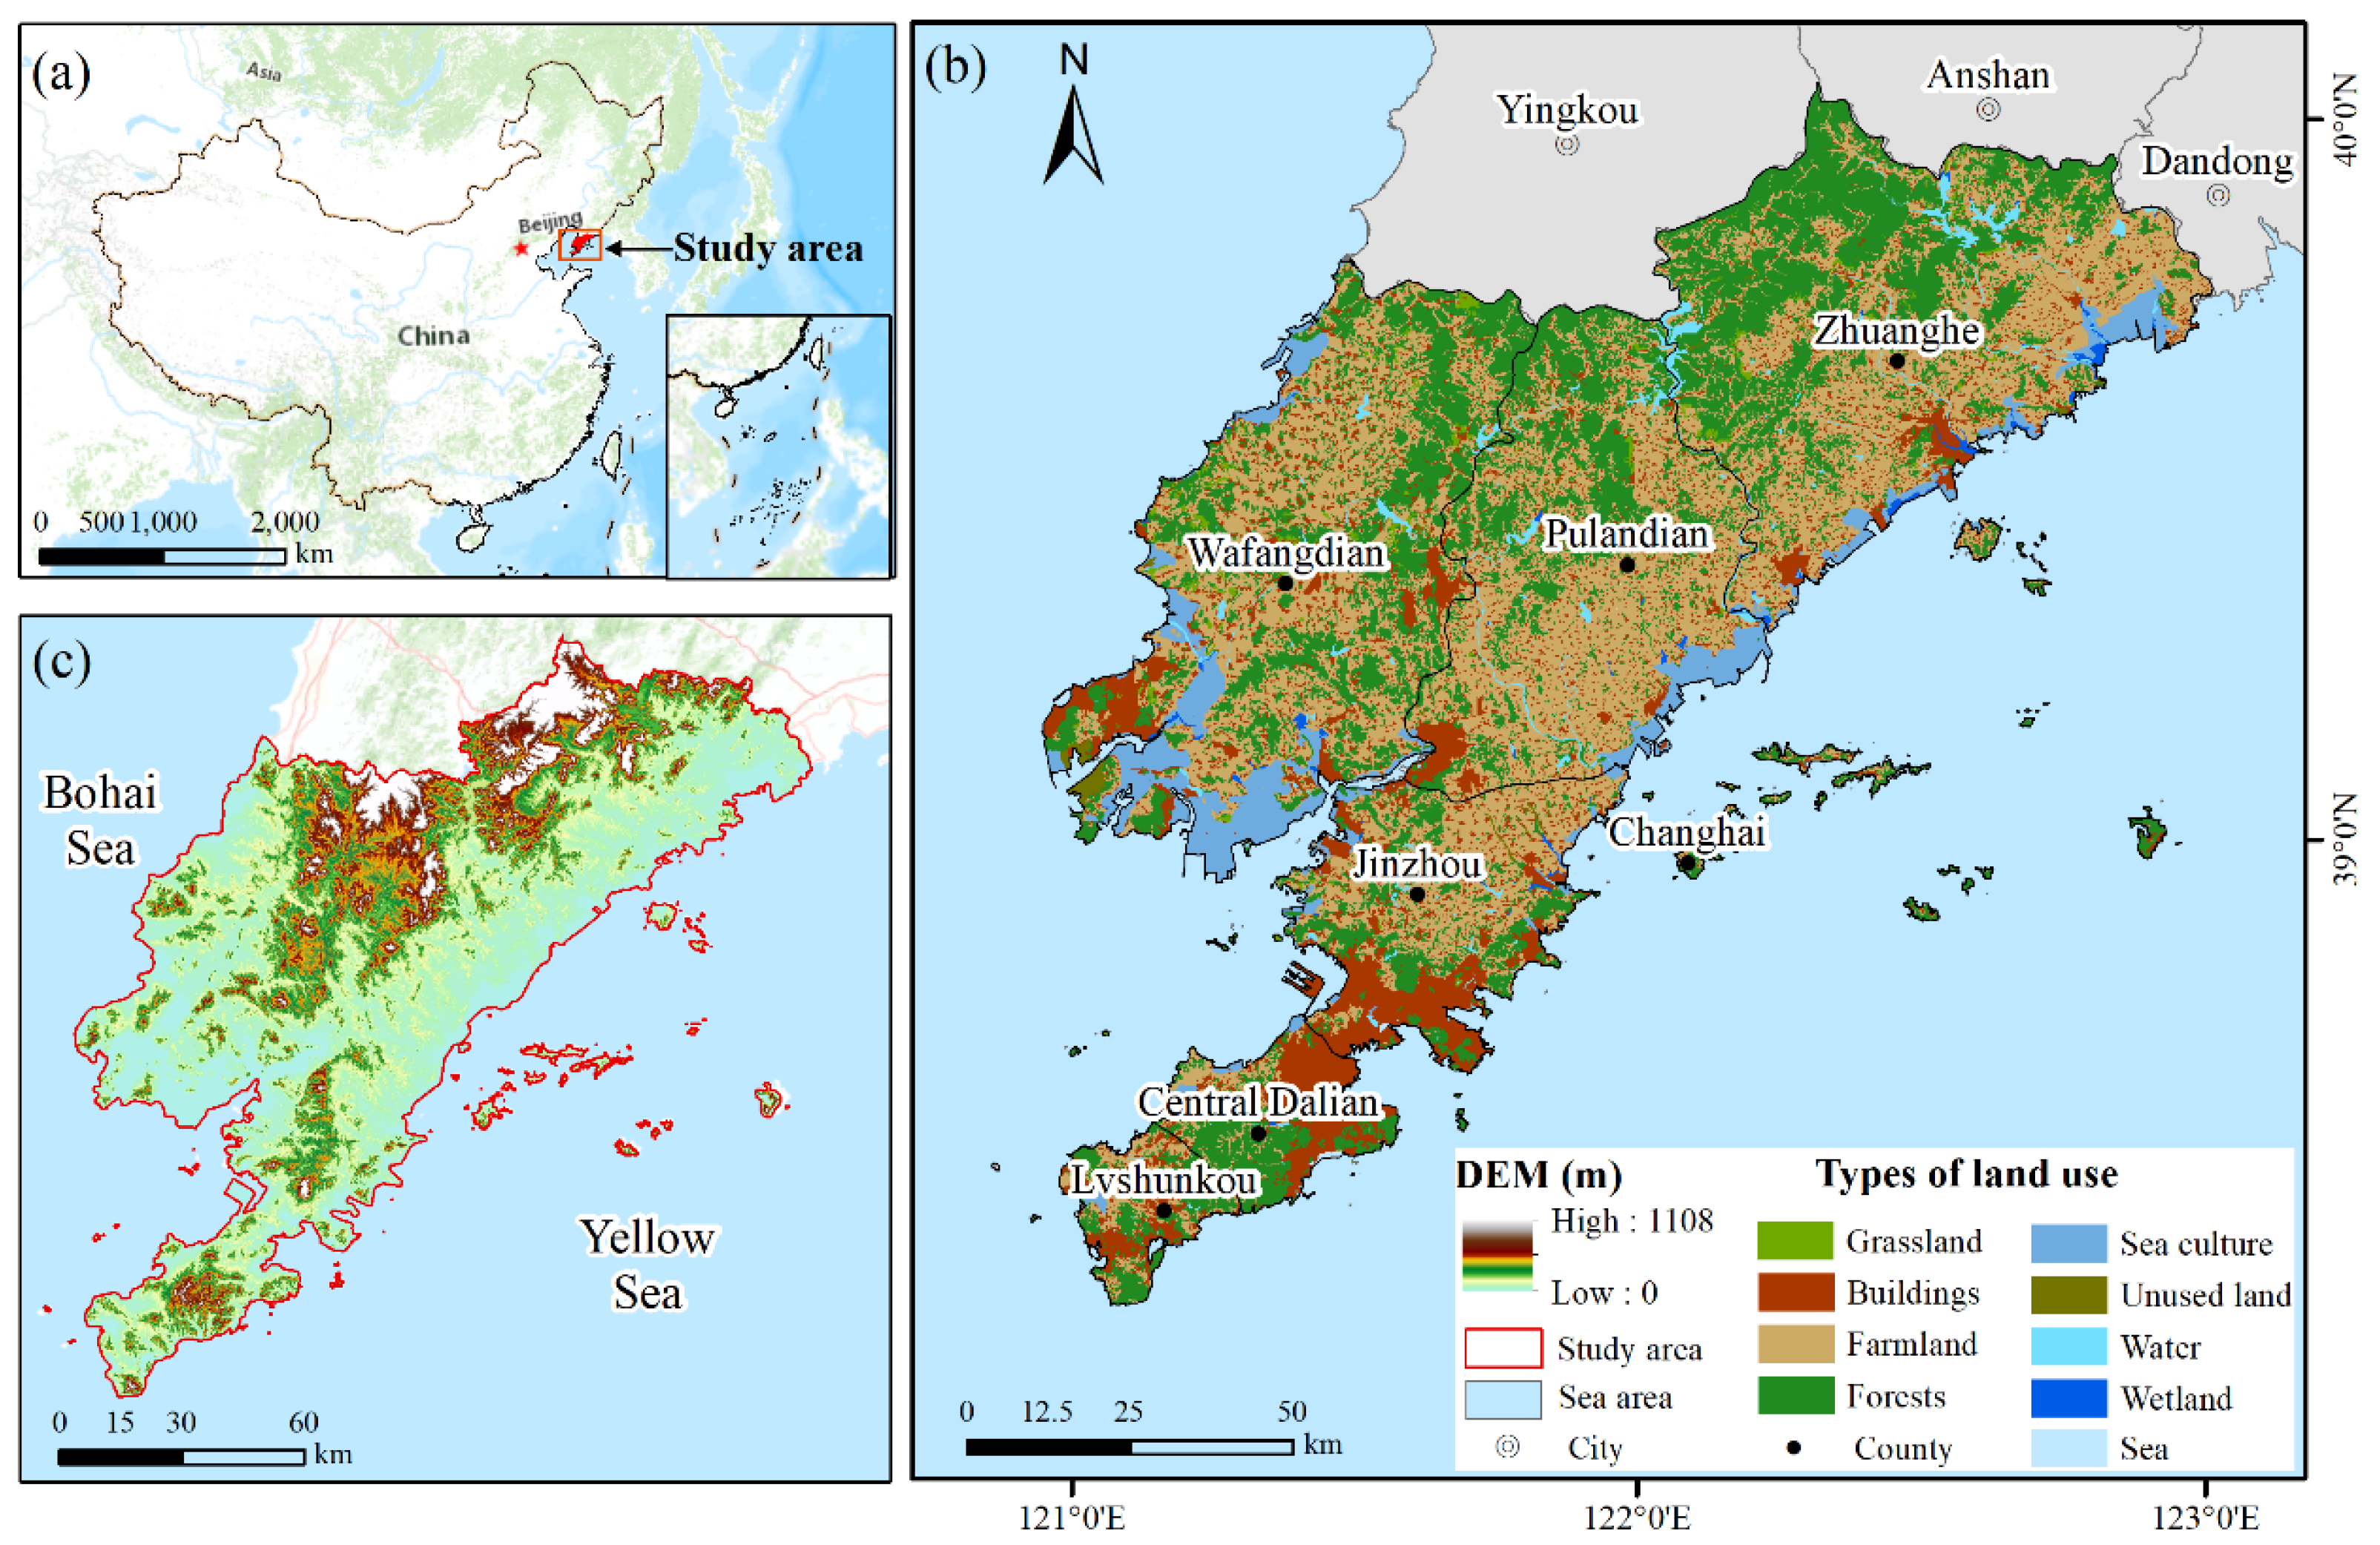
2.1. Study Area
2.2. Data Sources
2.3. Methods
2.3.1. Evaluation of ESV
2.3.2. Calculation of Driving Factors
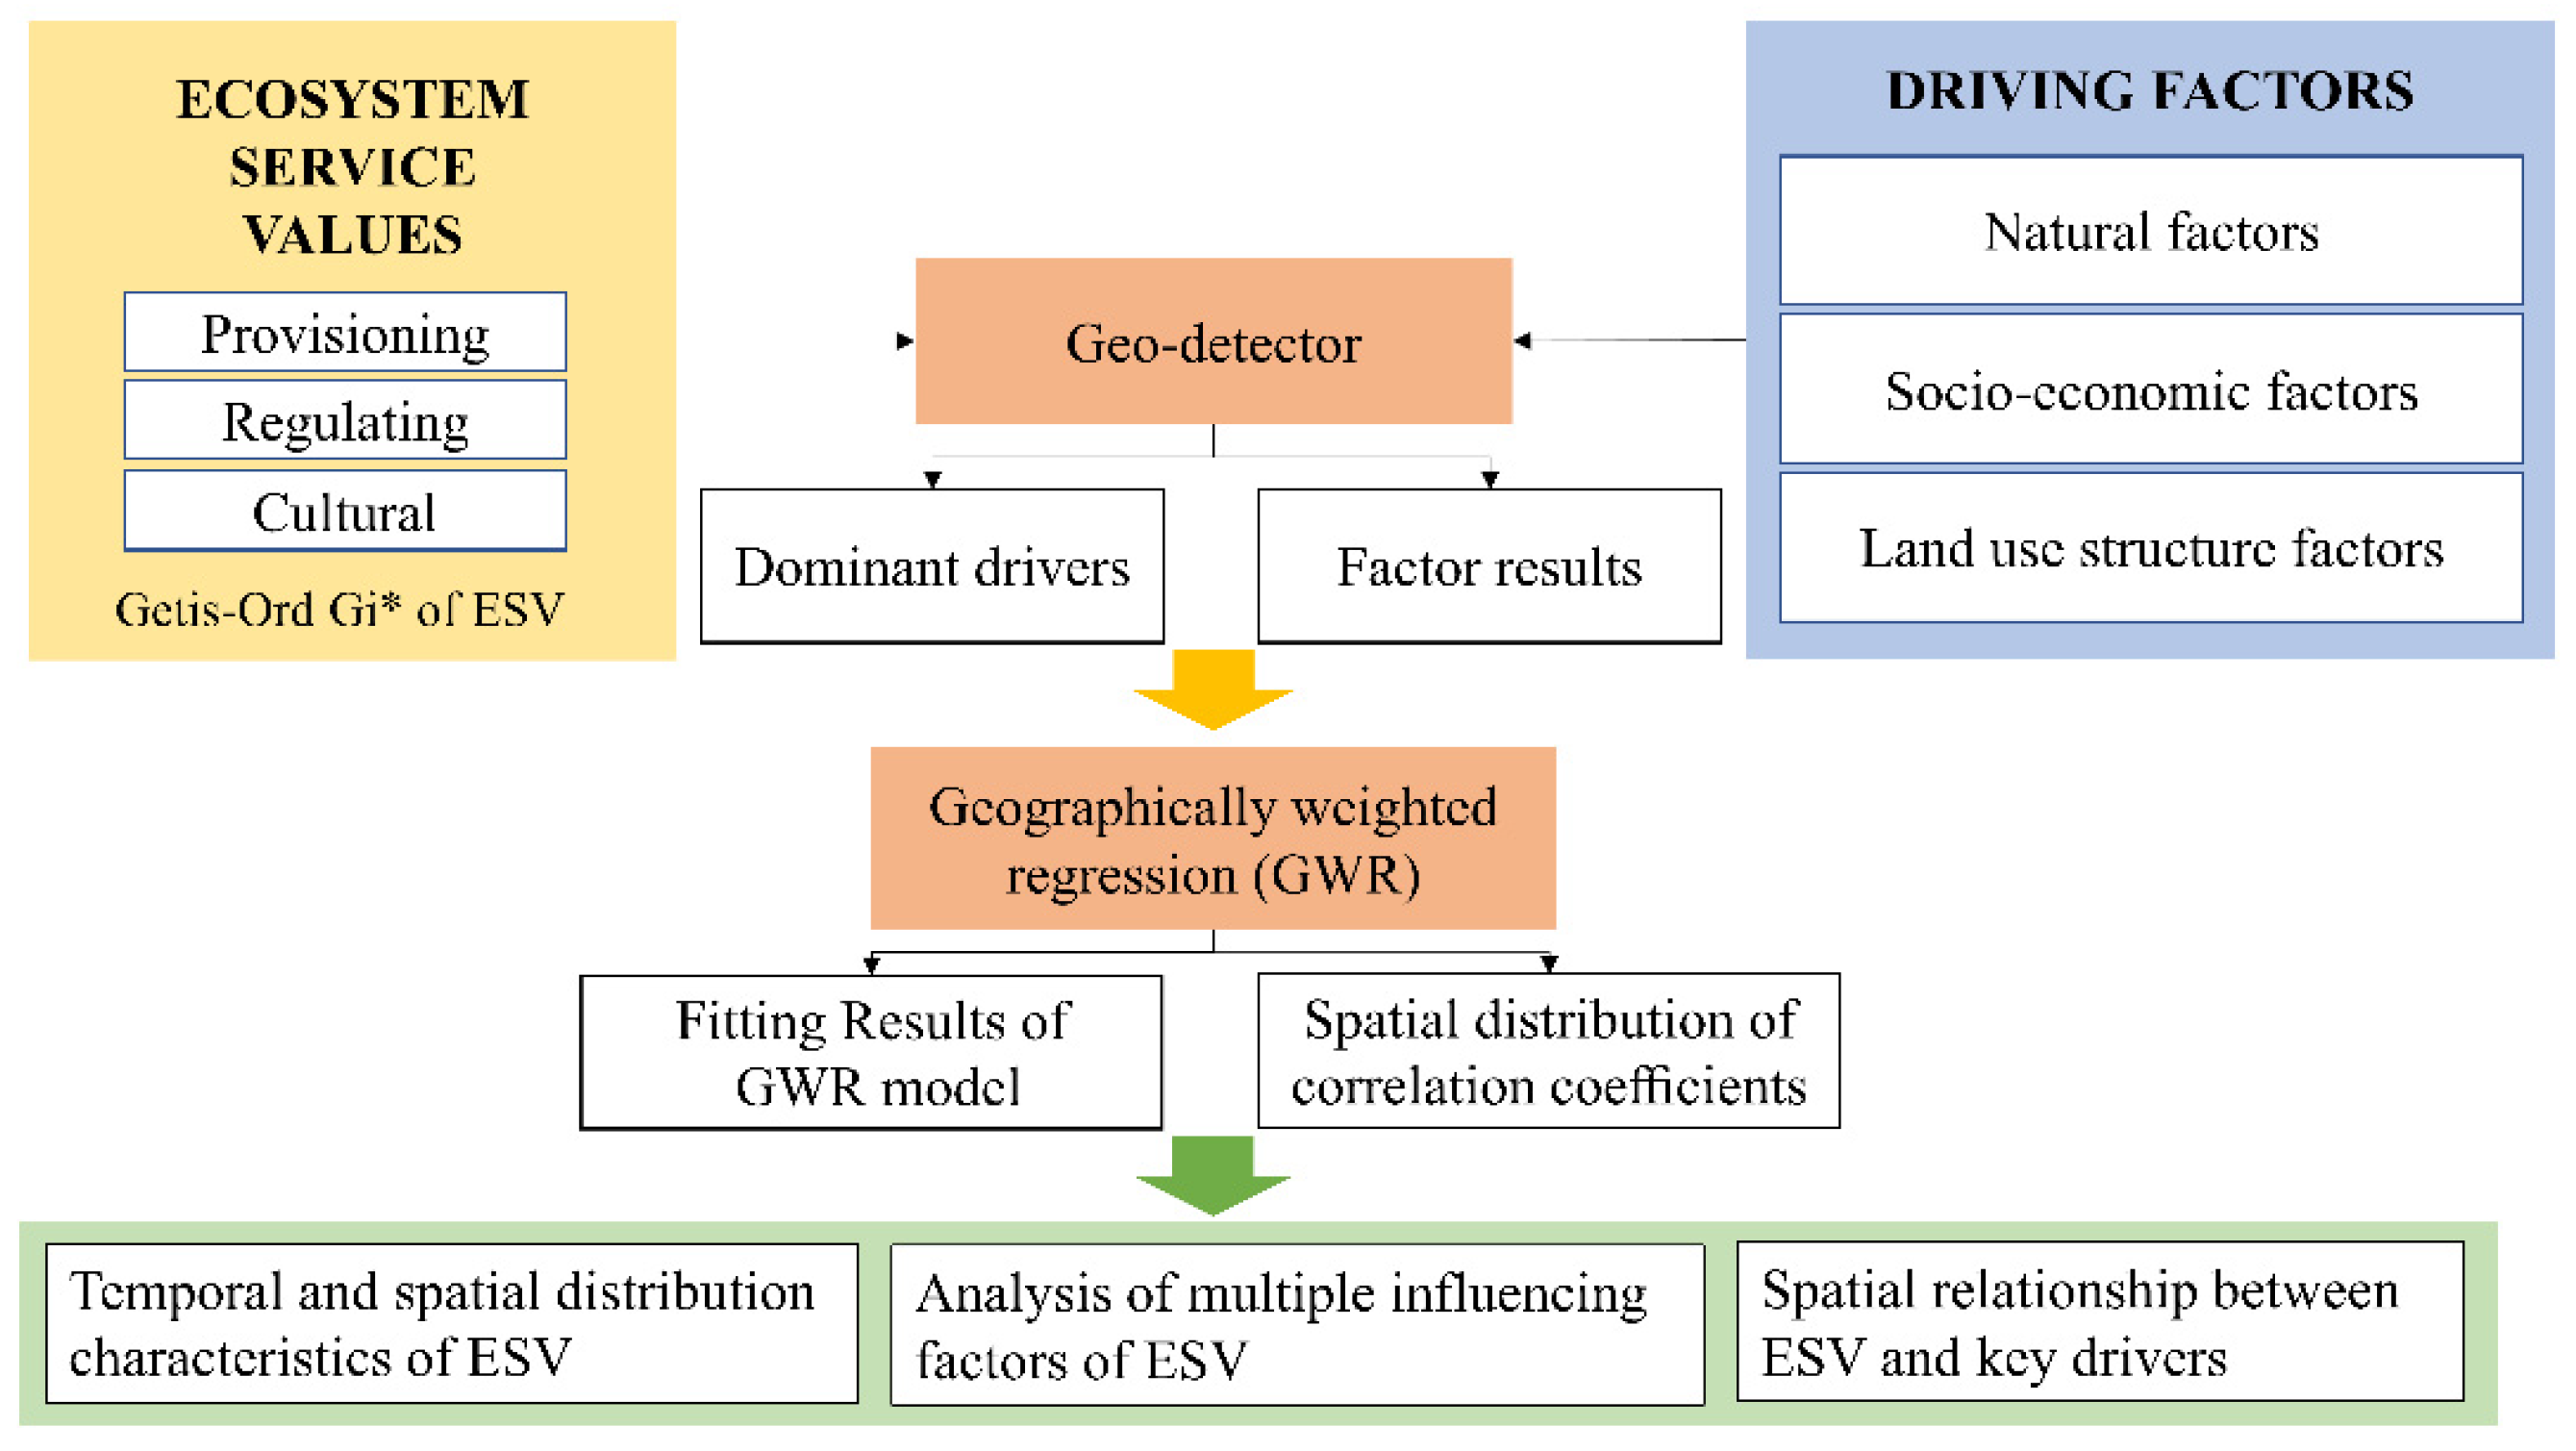
2.3.3. GIS Analysis and Spatial Statistics
3. Results
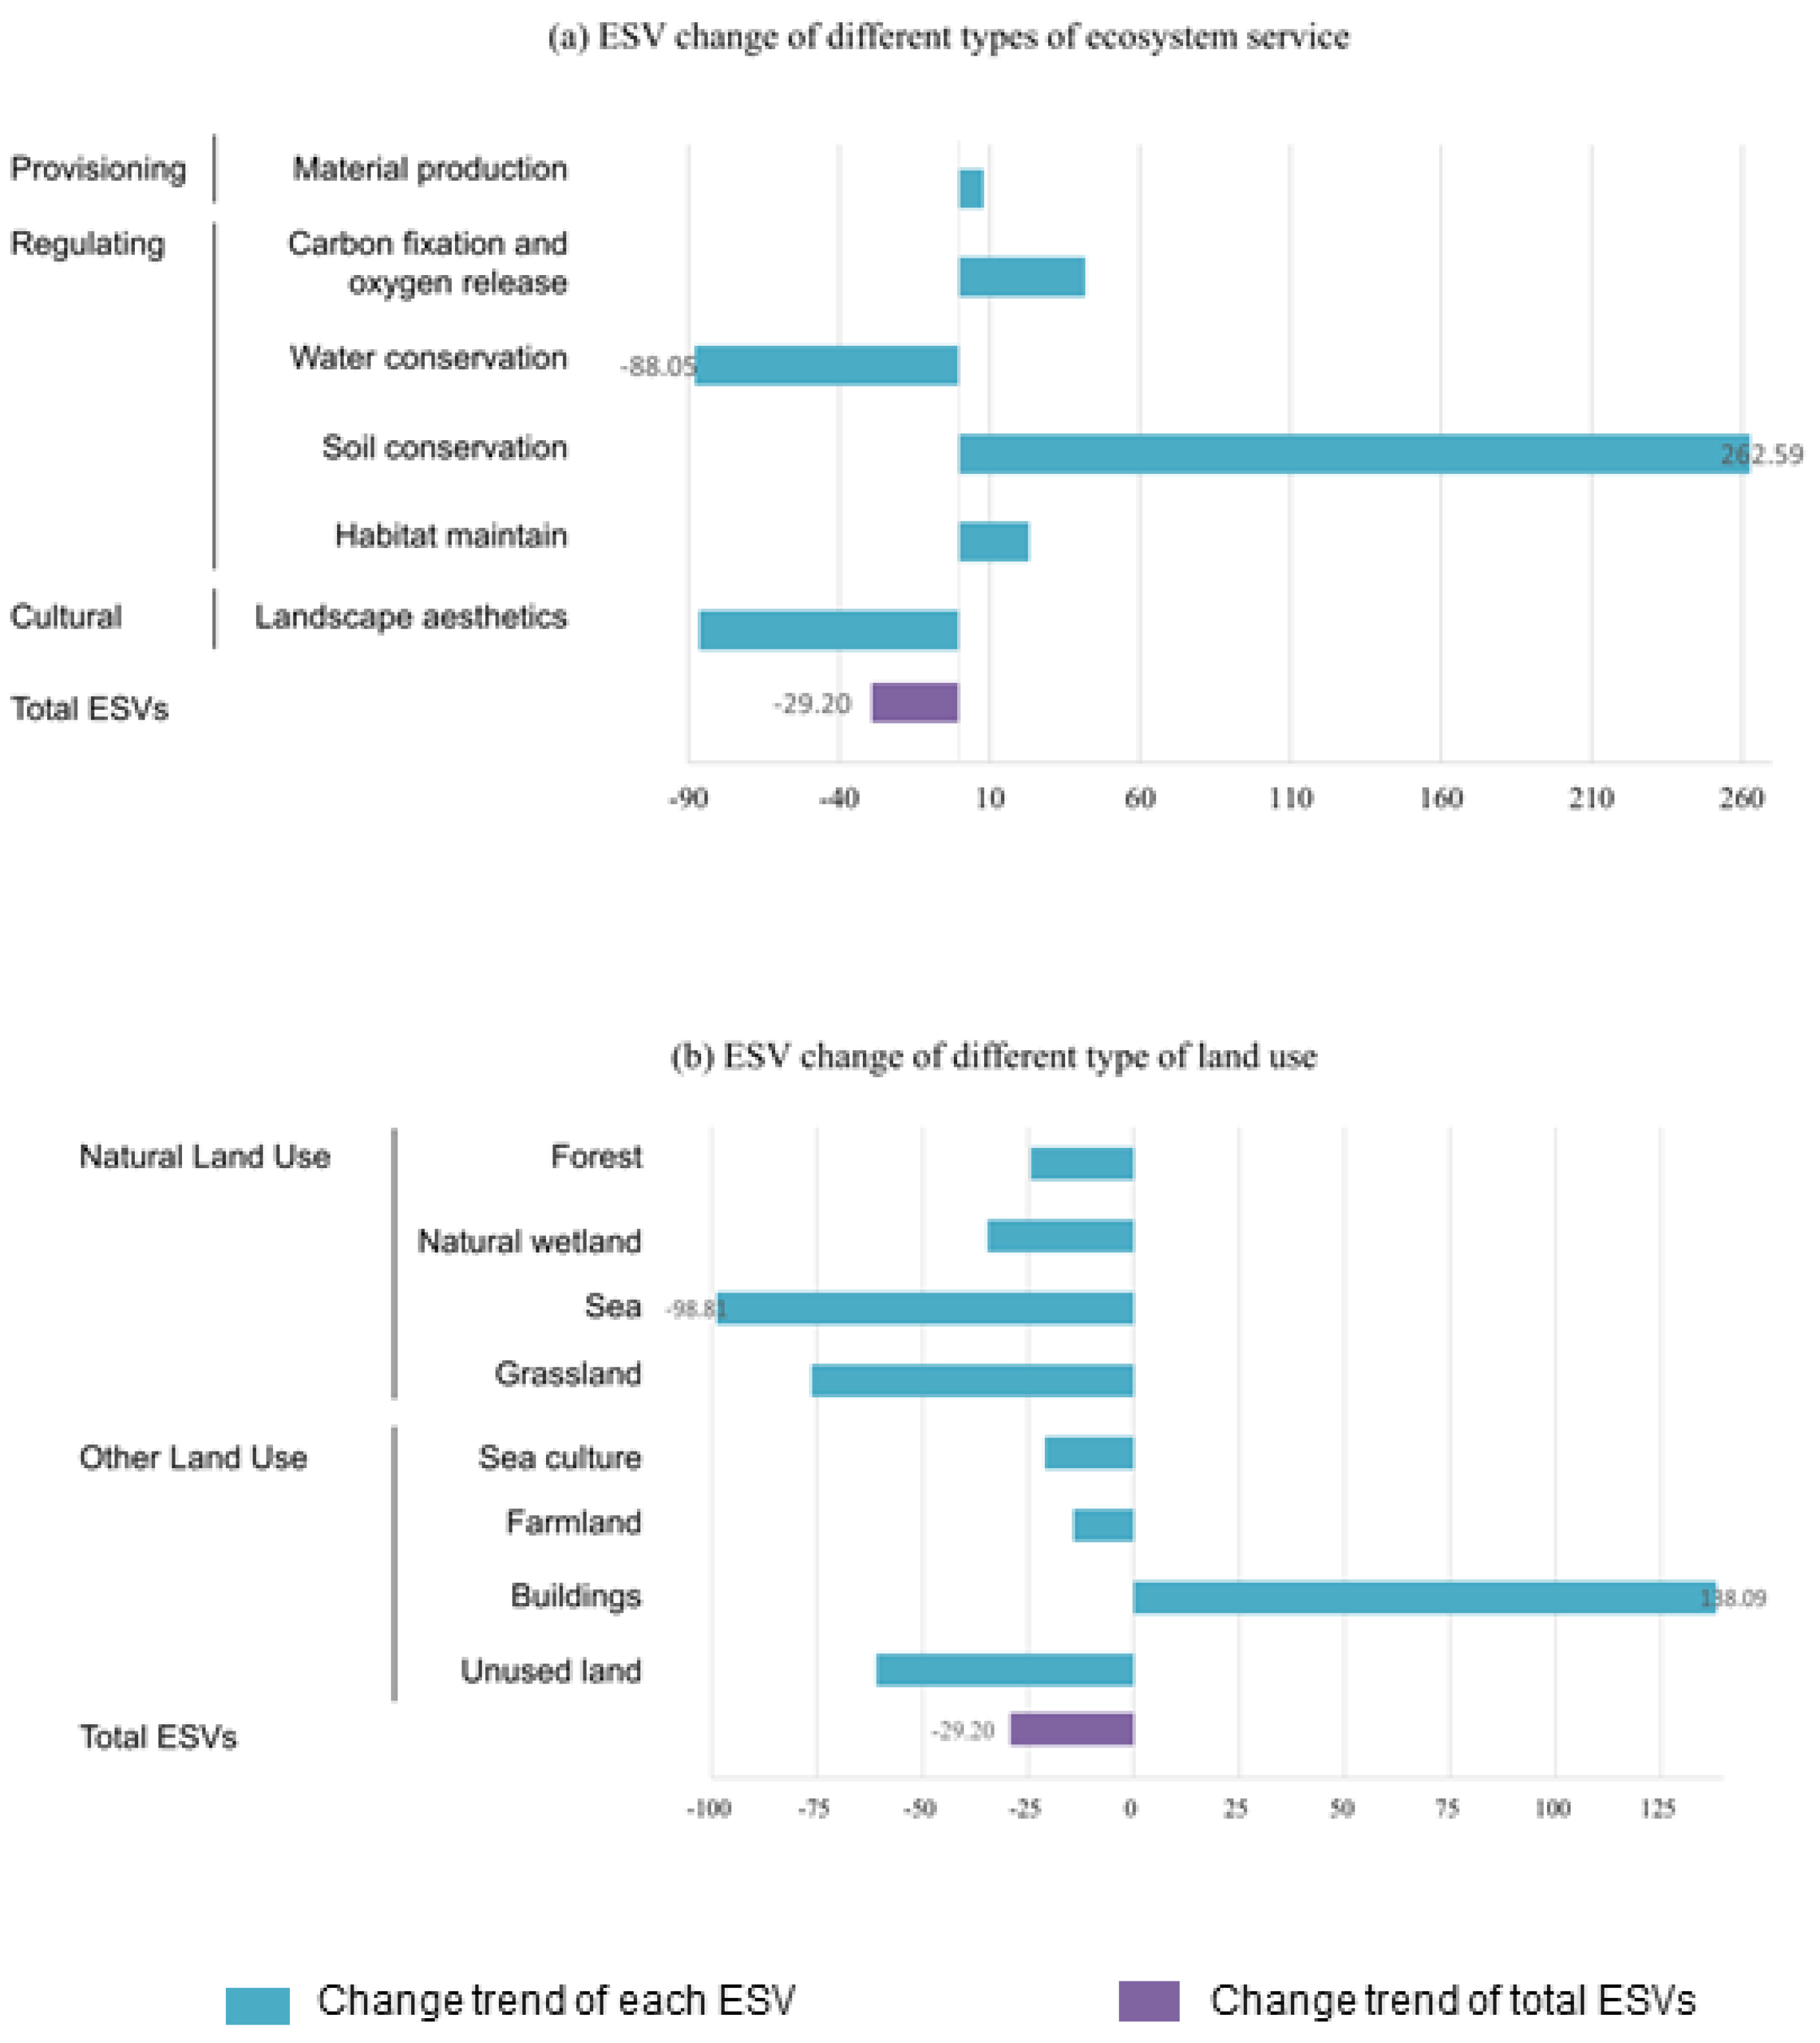
3.1. Variability of the ESV
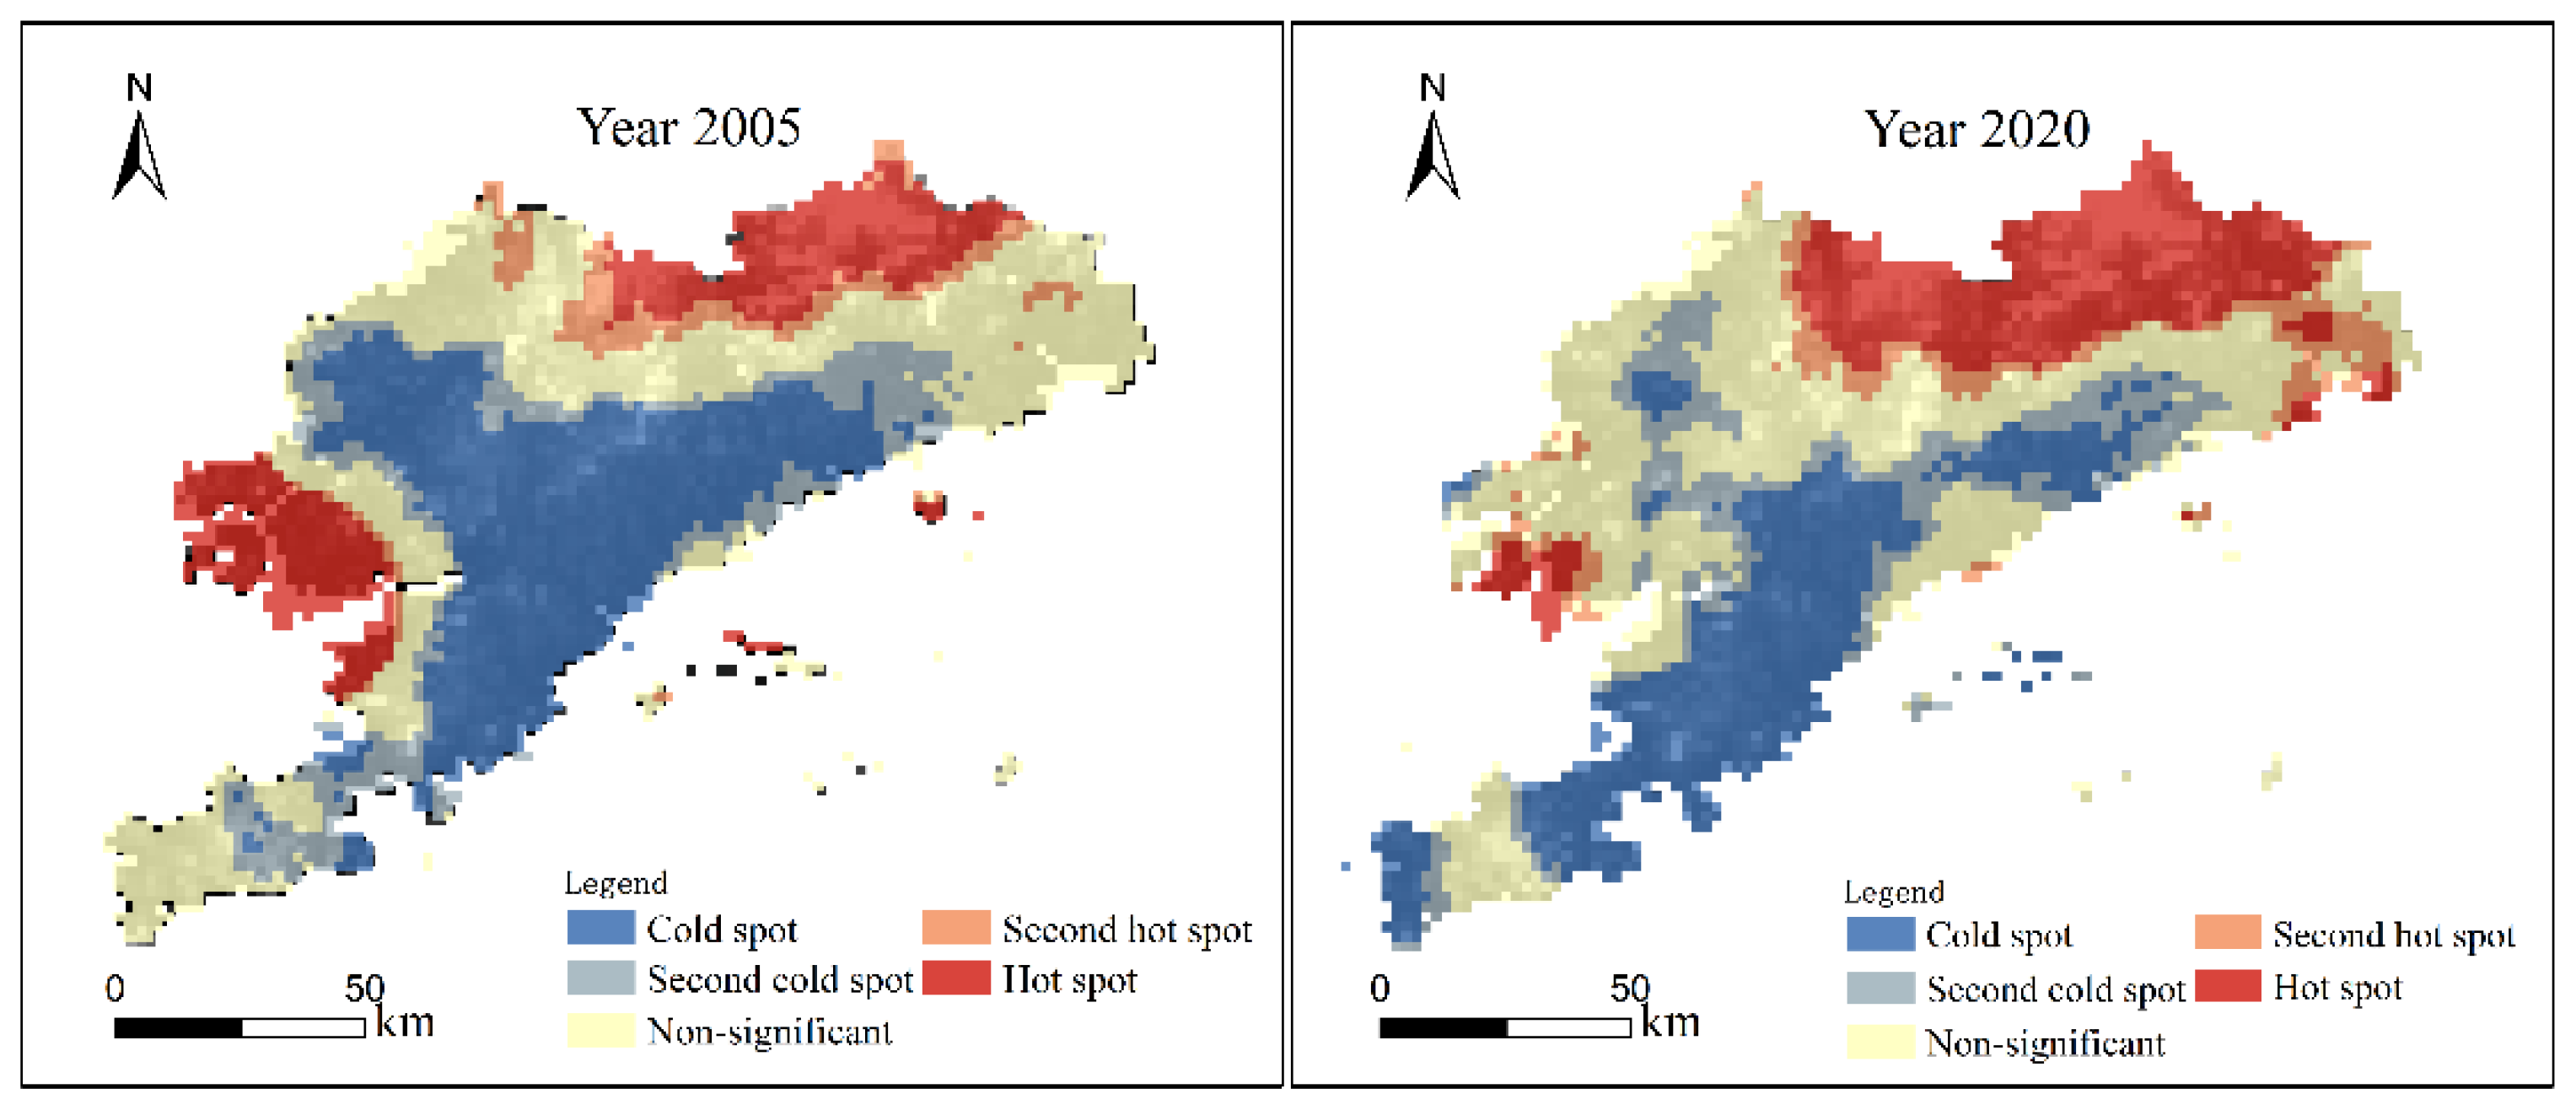
3.2. Spatiotemporal Distribution Characteristics of ESV
3.3. Analysis of Driving Factors for Variation in the ESV
3.4. Spatial Relationship between the ESV and Key Drivers
4. Discussion
4.1. Exploring Driving Factors for the ESV at Multiple Methods
4.2. Implication of the Relationship between Diverse Factors and the ESV
4.3. Contributions
5. Conclusions
Author Contributions
Funding
Institutional Review Board Statement
Informed Consent Statement
Data Availability Statement
Acknowledgments
Conflicts of Interest
Appendix A
| Category | Driving Forces | Computing Method of Data | Data Sources |
|---|---|---|---|
| Natural factors | Digital elevation model | - | http://www.gscloud.cn/ |
| Slope | Extracted by DEM data with ArcGIS slope tool. | http://www.gscloud.cn/ | |
| Normalized difference vegetation index | - | https://www.nasa.gov | |
| ≥10 °C Cumulative temperature | Calculation of inverse distance weight space interpolation used temperature data measured by 17 meteorological stations located around Dalian. | http://data.cma.cn | |
| Precipitation per year | Calculation of inverse distance weight space interpolation used precipitation data measured by 17 meteorological stations located around Dalian. | http://data.cma.cn | |
| Soil erosion | - | - | |
| Socio-economic factors | Gross domestic production per unit area | - | http://www.resdc.cn/ |
| Population per unit area | - | http://www.resdc.cn/ | |
| Urbanization rate | Calculation by DMSP nighttime light image. | http://www.resdc.cn/ | |
| Human active index | Calculation by land use vector data in Dalian. | - | |
| Land use structure factors | Land use intensity | Calculation by land use vector data in Dalian. | - |
| The proportion of natural land area | Calculation by land use vector data in Dalian. | - | |
| Shannon’s diversity index | Calculation by land use vector data in Dalian using a moving window of FRAGSTATS. | - | |
| Patch density | Calculation by land use vector data in Dalian using a moving window of FRAGSTATS. | - |
| Forest | Sea Culture | Wetland | Sea | Grassland | Farmland | Buildings | Unused Land | Total | ESV Change | Change Rate (%) | ||
|---|---|---|---|---|---|---|---|---|---|---|---|---|
| Material production | 2005 | 0.0065 | 42.8168 | 0.1508 | 26.0804 | 0.6316 | 42.9306 | 0.0000 | 0.0000 | 112.6167 | 8.9590 | 7.96 |
| 2020 | 16.6685 | 57.5037 | 0.4189 | 0.6796 | 0.7094 | 45.4689 | 0.0000 | 0.1267 | 121.5757 | |||
| Carbon fixation and oxygen release | 2005 | 95.2435 | 0.7008 | 2.9127 | 0.0022 | 7.0191 | 33.2491 | 6.1475 | 0.7275 | 146.0024 | 61.1746 | 41.90 |
| 2020 | 109.4548 | 0.9957 | 8.2204 | 0.0065 | 2.9108 | 67.0139 | 17.8513 | 0.7235 | 207.1770 | |||
| Water conservation | 2005 | 123.7115 | 28.1347 | 11.8123 | 19.8398 | 10.0058 | 54.2323 | 0.0000 | 1.3996 | 249.136 | −219.3689 | −88.05 |
| 2020 | 19.0810 | 0.0051 | 0.0658 | 0.0001 | 0.6572 | 9.9161 | 0.0000 | 0.0420 | 29.7671 | |||
| Soil conservation | 2005 | 8.7877 | 0.2199 | 0.2228 | 0.0428 | 0.7589 | 2.8168 | 3.3311 | 0.0390 | 16.219 | 42.5897 | 262.59 |
| 2020 | 43.3939 | 0.1551 | 0.8857 | 0.0047 | 0.5824 | 8.9865 | 4.7156 | 0.0847 | 58.8087 | |||
| Habitat maintenance | 2005 | 33.4381 | 1.3802 | 2.6368 | 2.2877 | 2.7580 | 11.2914 | 0.0000 | 0.3576 | 54.1498 | 12.5039 | 23.14 |
| 2020 | 52.8476 | 0.2482 | 11.8171 | 0.0803 | 0.6927 | 0.9839 | 0.0000 | 0.0109 | 66.6807 | |||
| Landscape aesthetics | 2005 | 75.0674 | 1.5151 | 20.7595 | 18.9134 | 3.1959 | 10.6951 | 0.0000 | 0.0139 | 130.1603 | −112.6859 | −86.58 |
| 2020 | 12.7597 | 0.1167 | 3.7518 | 0.0290 | 0.2123 | 0.6023 | 0.0000 | 0.0027 | 17.4744 | |||
| Total | 2005 | 336.2547 | 74.7676 | 38.4951 | 67.1664 | 24.3693 | 155.2153 | 9.4785 | 2.5376 | 708.2845 | −206.8099 | −29.20 |
| 2020 | 254.2054 | 59.0245 | 25.1598 | 0.8001 | 5.7648 | 132.9716 | 22.5670 | 0.9905 | 501.4836 | |||
| ESV change | −82.0493 | −15.7431 | −13.3353 | −66.3663 | −18.6045 | −22.2437 | 13.0885 | −1.5471 | - | - | - | |
| Change rate (%) | −0.2440 | −0.2106 | −0.3464 | −0.9881 | −0.7634 | −0.1433 | 1.3809 | −0.6097 | - | - | - |
References
- Millennium Ecosystem Assessment (MEA). Ecosystems and Human Well Being: Synthesis; Island Press: Washington, DC, USA, 2005. [Google Scholar] [CrossRef]
- TEEB Foundations. The Economics of Ecosystems and Biodiversity: Ecological and Economic Foundations; Earthscan Publications: London, UK; Washington, DC, USA, 2010. [Google Scholar]
- Luo, Q.; Zhou, J.; Li, Z.; Yu, B. Spatial differences of ecosystem services and their driving factors: A comparation analysis among three urban agglomerations in China’s Yangtze River Economic Belt. Sci. Total Environ. 2020, 725, 138452–138464. [Google Scholar] [CrossRef] [PubMed]
- Costanza, R.; De Groot, R.; Sutton, P.; Van der Ploeg, S.; Anderson, S.J.; Kubiszewski, I.; Farber, S.; Turner, R.K. Changes in the global value of ecosystem services. Glob. Environ. Chang. 2014, 26, 152–158. [Google Scholar] [CrossRef]
- Chen, M.; Liu, W.; Lu, D. Challenges and the way forward in China’s new-type urbanization. Land Use Policy 2016, 55, 334–339. [Google Scholar] [CrossRef]
- Sannigrahi, S.; Bhatt, S.; Rahmat, S.; Paul, S.K.; Sen, S. Estimating global ecosystem service values and its response to land surface dynamics during 1995–2015. Environ. Manag. 2018, 223, 115–131. [Google Scholar] [CrossRef] [PubMed]
- Chen, M.; Lu, Y.; Ling, L.; Wan, Y.; Luo, Z.; Huang, H. Drivers of changes in ecosystem service values in Ganjiang upstream watershed. Land Use Policy 2015, 47, 247–252. [Google Scholar] [CrossRef]
- Hao, F.; Lai, X.; Ouyang, W.; Xu, Y.; Wei, X.; Song, K. Effects of land use changes on the ecosystem service values of a reclamation farm in Northeast China. Environ. Manag. 2012, 50, 888–899. [Google Scholar] [CrossRef]
- Huang, X.; Li, W.H.; Ma, J.X. Changes of value of ecosystem services and its driving forces in the lower reaches of the Tarim River. Appl. Mech. Mater. 2012, 260–261, 1030–1034. [Google Scholar] [CrossRef]
- Kindu, M.; Schneider, T.; Teketay, D.; Knoke, T. Changes of ecosystem service values in response to land use/land cover dynamics in Munessa–Shashemene landscape of the Ethiopian Highlands. Sci. Total Environ. 2016, 547, 137–147. [Google Scholar] [CrossRef]
- Qi, Z.F.; Ye, X.Y.; Zhang, H.; Yu, Z. Land fragmentation and variation of ecosystem services in the context of rapid urbanization: The case of Taizhou city, China. Stoch. Environ. Res. Risk Assess. 2014, 28, 843–855. [Google Scholar] [CrossRef]
- Song, F.; Su, F.; Mi, C.; Sun, D. Analysis of driving forces on wetland ecosystem services value change: A case in Northeast China. Sci. Total Environ. 2021, 751, 141778–141791. [Google Scholar] [CrossRef]
- Wang, H.; Zhou, S.; Li, X.; Liu, H.; Chi, D.; Xu, K. The influence of climate change and human activities on ecosystem service value. Ecol. Eng. 2016, 87, 224–239. [Google Scholar] [CrossRef]
- Chen, W.; Zeng, J.; Zhong, M.; Pan, S. Coupling analysis of ecosystem services value and economic development in the Yangtze River economic Belt: A case study in Hunan Province, China. Remote Sens. 2021, 13, 1552. [Google Scholar] [CrossRef]
- Li, Z.; Xia, J.; Deng, X.; Yan, H. Multilevel modelling of impacts of human and natural factors on ecosystem services change in an oasis, Northwest China. Resour. Conserv. Recycl. 2021, 169, 105474–105485. [Google Scholar] [CrossRef]
- Shao, Y.; Yuan, X.; Ma, C.; Ma, R.; Ren, Z. Quantifying the spatial association between land use change and ecosystem services value: A case study in Xi’an, China. Sustainability 2020, 12, 4449. [Google Scholar] [CrossRef]
- Yang, R.; Ren, F.; Xu, W.; Ma, X.; Zhang, H.; He, W. China’s ecosystem service value in 1992–2018: Pattern and anthropogenic driving factors detection using Bayesian spatiotemporal hierarchy model. J. Environ. Manag. 2022, 302, 114089–114098. [Google Scholar] [CrossRef]
- Camacho-Valdez, V.; Ruiz-Luna, A.; Ghermandi, A.; Berlanga-Robles, C.A.; Nunes, P.A. Effects of land use changes on the ecosystem service values of coastal wetlands. Environ. Manag. 2014, 54, 852–864. [Google Scholar] [CrossRef] [PubMed]
- Gaglio, M.; Aschonitis, V.G.; Gissi, E.; Castaldelli, G.; Fano, E.A. Land use change effects on ecosystem services of river deltas and coastal wetlands: Case study in Volano–Mesola–Goro in Poriver delta (Italy). Ecol. Manag. 2017, 25, 67–86. [Google Scholar] [CrossRef]
- Huang, Q.; Sun, H.B.; Wang, R.H.; Zhang, H.Z. Effect of oasis land-use and land-cover change on ecosystem service values in typical Mountain–Oasis–Desert system in arid region. J. Desert Res. 2007, 27, 76–81. [Google Scholar] [CrossRef]
- Lambin, E.F.; Turner, B.L.; Geist, H.J.; Agbola, S.B.; Angelsen, A.; Bruce, J.W.; Coomes, O.T.; Dirzo, R.; Fischer, G.; Folke, C.; et al. The causes of land-use and land-cover change: Moving beyond the myths. Glob. Environ. Chang. 2001, 11, 261–269. [Google Scholar] [CrossRef]
- Wei, S. Land-use/land-cover change and ecosystem service provision in China. Sci. Total Environ. 2017, 576, 705–719. [Google Scholar] [CrossRef]
- You, H.M.; Han, J.L.; Pan, D.Z.; Xie, H.C.; TC, L.; Ma, J.B.; Huang, S.Z.; Tan, F.L. Dynamic evaluation and driving forces of ecosystem services in Quanzhou bay estuary wetland, China. Chin. J. Appl. Ecol. 2019, 30, 4286–4292. (In Chinese) [Google Scholar] [CrossRef]
- Cao, L.; Li, J.; Ye, M.; Pu, R.; Liu, Y.; Guo, Q.; Feng, B.; Song, X. Changes of ecosystem service value in a coastal zone of Zhejiang Province, China, during rapid urbanization. Int. J. Environ. Res. Public Health 2018, 15, 1301. [Google Scholar] [CrossRef] [PubMed]
- Chen, S.; Wang, Y.; Ni, Z.; Zhang, X.; Xia, B. Benefits of the ecosystem services provided by urban green infrastructures: Differences between perception and measurements. Urban For. Urban Green. 2020, 54, 126744–126759. [Google Scholar] [CrossRef]
- Duc, N.M.; Tiho, A.; Alan, R. Forest governance and economic values of forest ecosystem services in Vietnam. Land Use Policy 2018, 97, 103297. [Google Scholar] [CrossRef]
- Tong, C.; Feagin, R.A.; Lu, J.; Zhang, X.; Zhu, X.; Wang, W.; He, W. Ecosystem service values and restoration in the urban San Yang wetland of Wenzhou, China. Ecol. Eng. 2007, 29, 249–258. [Google Scholar] [CrossRef]
- Turner, K.G.; Anderson, S.; Gonzales-Chang, M.; Costanza, R.; Courville, S.; Dalgaard, T.; Dominati, E.; Kubiszewski, I.; Ogilvy, S.; Porfirio, L.; et al. A review of methods, data, and models to assess changes in the value of ecosystem services from land degradation and restoration. Ecol. Model. 2016, 319, 190–207. [Google Scholar] [CrossRef]
- Potter, C.S.; Randerson, J.T.; Field, C.B.; Matson, P.A.; Vitousek, P.M.; Mooney, H.A.; Klooster, S.A. Terrestrial ecosystem production: A process model based on global satellite and surface data. Glob. Biogeochem. Cycles 1993, 7, 811–841. [Google Scholar] [CrossRef]
- Quintas-Soriano, C.; García-Llorente, M.; Norström, A.; Meacham, M.; Peterson, G.; Castro, A.J. Integrating supply and demand in ecosystem service bundles characterization across Mediterranean transformed landscapes. Landsc. Ecol. 2019, 34, 1619–1633. [Google Scholar] [CrossRef]
- Xie, G.D.; Zhang, C.X.; Zhang, C.S.; Xiao, Y.; Lu, C.X. The value of ecosystem services in China. Resour. Sci. 2015, 37, 1740–1746. [Google Scholar]
- Jiang, B.; Bai, Y.; Chen, J.; Alatalo, J.M.; Xu, X.; Liu, G.; Wang, Q. Land management to reconcile ecosystem services supply and demand mismatches—A case study in Shanghai municipality, China. Land Degrad. Dev. 2020, 31, 2684–2699. [Google Scholar] [CrossRef]
- Remme, R.P.; Edens, B.; Schröter, M.; Hein, L. Monetary accounting of ecosystem services: A test case for Limburg province, the Netherlands. Ecol. Econ. 2015, 112, 116–128. [Google Scholar] [CrossRef]
- Qin, K.; Li, J.; Liu, J.; Yan, L.; Huang, H. Setting conservation priorities based on ecosystem services—A case study of the Guanzhong-Tianshui Economic Region. Sci. Total Environ. 2019, 650, 3062–3074. [Google Scholar] [CrossRef] [PubMed]
- Li, J.; Ren, Z.; Zhou, Z. Ecosystem services and their values: A case study in the Qinba mountains of China. Ecol. Res. 2006, 21, 597–604. [Google Scholar] [CrossRef]
- Remortel, R.D.V.; Hamilton, M.E.; Hickey, R.J. Estimating the LS factor for RUSLE through iterative slope length processing of digital elevation data within Arclnfo grid. Cartography 2001, 30, 27–35. [Google Scholar] [CrossRef]
- Williams, J.R.; Arnold, J.G. A system of erosion—Sediment yield models. Soil Technol. 1997, 11, 43–55. [Google Scholar] [CrossRef]
- Wischmeier, W.H.; Smith, D.D. Predicting rainfall erosion losses—A guide to conservation planning. Agric. Handb. (USA) 1978, 537, 48–49. [Google Scholar]
- Berta Aneseyee, A.; Noszczyk, T.; Soromessa, T.; Elias, E. The InVEST Habitat Quality Model Associated with Land Use/Cover Changes: A Qualitative Case Study of the Winike Watershed in the Omo-Gibe Basin, Southwest Ethiopia. Remote Sens. 2020, 12, 1103. [Google Scholar] [CrossRef]
- Chen, F.; Ge, X.P.; Chen, G.; Peng, B. Spatial different analysis of landscape change and human impact in urban fringe. Sci. Geogr. Sin. 2001, 3, 210–216. [Google Scholar] [CrossRef]
- Goudie, A. The Human Impact: Man’s Role in Environmental Change; The MIT Press: Cambridge, UK, 1981; pp. 19–47. [Google Scholar]
- Li, Z.P.; Liu, L.M.; Xie, H.L. Methodology of rural landscape classification: A case study in Baijiatuan village, Haidian district, Beijing. Resour. Sci. 2005, 27, 167–173. [Google Scholar] [CrossRef]
- Liang, F.C.; Liu, L.M. Quantitative analysis of human disturbance intensity of landscape patterns and preliminary optimization of ecological function regions: A case of Minqing county in Fujian Province. Resour. Sci. 2011, 33, 1138–1144. [Google Scholar] [CrossRef]
- Zhuang, D.F.; Liu, J.Y. Study on the model of regional differentiation of land use degree in China. J. Nat. Resour. 1997, 02, 10–16. [Google Scholar]
- Ord, J.K.; Getis, A. Local spatial autocorrelation statistics: Distributional issues and an application. Geogr. Anal. 1995, 27, 286–306. [Google Scholar] [CrossRef]
- Ord, J.K.; Getis, A. Testing for local spatial autocorrelation in the presence of global autocorrelation. J. Reg. Sci. 2001, 41, 411–432. [Google Scholar] [CrossRef]
- Wang, J.F.; Li, X.H.; Christakos, G.; Liao, Y.L.; Zhang, T.; Gu, X.; Zheng, X.Y. Geographical detectors-based health risk assessment and its application in the neural tube defects study of the Heshun region, China. Int. J. Geogr. Inf. Sci. 2010, 24, 107–127. [Google Scholar] [CrossRef]
- Wang, J.F.; Zhang, T.L.; Fu, B.J. A measure of spatial stratified heterogeneity. Ecol. Indic. 2016, 67, 250–256. [Google Scholar] [CrossRef]
- Wang, J.F.; Xu, C.D. Geo-detector: Principle and prospective. Acta Geogr. Sin. 2017, 72, 116–134. (In Chinese) [Google Scholar] [CrossRef]
- Cao, Y.; Kong, L.; Zhang, L.; Ouyang, Z. The balance between economic development and ecosystem service value in the process of land urbanization: A case study of China’s land urbanization from 2000 to 2015. Land Use Policy 2021, 108, 105536–105548. [Google Scholar] [CrossRef]
- Polasky, S.; Nelson, E.; Pennington, D.; Johnson, K.A. The impact of land-use change on ecosystem services, biodiversity and returns to landowners: A case study in the State of Minnesota. Environ. Resour. Econ. 2011, 48, 219–242. [Google Scholar] [CrossRef]
- Pan, N.; Guan, Q.; Wang, Q.; Sun, Y.; Li, H.; Ma, Y. Spatial Differentiation and Driving Mechanisms in Ecosystem Service Value of Arid Region: A case study in the middle and lower reaches of Shule River Basin, NW China. J. Clean. Prod. 2021, 319, 128718–128732. [Google Scholar] [CrossRef]
- Zhong, S.; Geng, Y.; Qian, Y.; Chen, W.; Pan, H. Analyzing ecosystem services of freshwater lakes and their driving forces: The case of Erhai Lake, China. Environ. Sci. Pollut. Res. 2019, 26, 10219–10229. [Google Scholar] [CrossRef]
- Chen, W.; Chi, G.; Li, J. Ecosystem services and their driving forces in the middle reaches of the Yangtze River urban agglomerations, China. Int. J. Environ. Res. Public Health 2020, 17, 3717. [Google Scholar] [CrossRef] [PubMed]
| Forest | Dry Farm | Paddy Field | Grassland | Building | Wetland | Salt Pan | Other Land Use | Water | |
|---|---|---|---|---|---|---|---|---|---|
| Lohani | 0.12 | 0.57 | 0.55 | 0.09 | 0.96 | 0.15 | 0.08 | 0.11 | 0.10 |
| Leopold | 0.11 | 0.58 | 0.57 | 0.08 | 0.94 | 0.13 | 0.09 | 0.06 | 0.14 |
| Delphi | 0.13 | 0.62 | 0.65 | 0.10 | 0.91 | 0.14 | 0.07 | 0.07 | 0.12 |
| Average | 0.12 | 0.59 | 0.59 | 0.09 | 0.94 | 0.14 | 0.08 | 0.08 | 0.12 |
| LUI Types | Land Use Types | LUI Types | Land Use Types |
|---|---|---|---|
| LUI-1 | Mudflat | LUI-2 | Shrubbery |
| Other land use | LUI-3 | Fish farming | |
| Moor | LUI-4 | Dry farm | |
| LUI-2 | Ocean | Paddy field | |
| Water | Salt pan | ||
| Forest | LUI-5 | Building | |
| Grassland |
| NDVI | LUI | HAI | POP | GDP | Proportion of Natural Land Area | Urbanization Rate | ||
|---|---|---|---|---|---|---|---|---|
| 2005 | q statistics | 0.2763 | 0.2482 | 0.2252 | 0.1908 | 0.1786 | 0.1590 | 0.0856 |
| P | 0.000 | 0.000 | 0.000 | 0.000 | 0.000 | 0.000 | 0.000 | |
| 2020 | q statistics | 0.1312 | 0.4677 | 0.4251 | 0.1278 | 0.1489 | 0.3928 | 0.0997 |
| P | 0.000 | 0.000 | 0.000 | 0.000 | 0.000 | 0.000 | 0.000 | |
| SLOPE | DEM | SHDI | PD | ≥10 °C Cumulative temperature | PRE | Soil erosion | ||
| 2005 | q statistics | 0.0681 | 0.0623 | 0.0597 | 0.0523 | 0.0267 | 0.0143 | 0.0078 |
| P | 0.000 | 0.000 | 0.000 | 0.000 | 0.000 | 0.000 | 0.931 | |
| 2020 | q statistics | 0.1896 | 0.2669 | 0.0185 | 0.0020 | 0.0665 | 0.0541 | 0.1084 |
| P | 0.000 | 0.000 | 0.000 | 0.000 | 0.025 | 0.000 | 0.000 |
| Diagnostic Information | 2005 | 2020 |
|---|---|---|
| Bandwidth size | 118.501637 | 116.070957 |
| Residual sum of squares | 18,087.061042 | 5086.711880 |
| Unbiased sigma estimate | 2.616989 | 1.443917 |
| AICc | 14,705.267611 | 10,263.690133 |
| R square | 0.415633 | 0.590915 |
| Adjusted R square | 0.327750 | 0.528816 |
Publisher’s Note: MDPI stays neutral with regard to jurisdictional claims in published maps and institutional affiliations. |
© 2022 by the authors. Licensee MDPI, Basel, Switzerland. This article is an open access article distributed under the terms and conditions of the Creative Commons Attribution (CC BY) license (https://creativecommons.org/licenses/by/4.0/).
Share and Cite
Zhao, Y.; Han, Z.; Yan, X.; Wang, X. Integrating Spatial Heterogeneity into an Analysis between Ecosystem Service Value and Its Driving Factors: A Case Study of Dalian, China. Int. J. Environ. Res. Public Health 2022, 19, 17055. https://doi.org/10.3390/ijerph192417055
Zhao Y, Han Z, Yan X, Wang X. Integrating Spatial Heterogeneity into an Analysis between Ecosystem Service Value and Its Driving Factors: A Case Study of Dalian, China. International Journal of Environmental Research and Public Health. 2022; 19(24):17055. https://doi.org/10.3390/ijerph192417055
Chicago/Turabian StyleZhao, Yuqing, Zenglin Han, Xiaolu Yan, and Xuezhe Wang. 2022. "Integrating Spatial Heterogeneity into an Analysis between Ecosystem Service Value and Its Driving Factors: A Case Study of Dalian, China" International Journal of Environmental Research and Public Health 19, no. 24: 17055. https://doi.org/10.3390/ijerph192417055
APA StyleZhao, Y., Han, Z., Yan, X., & Wang, X. (2022). Integrating Spatial Heterogeneity into an Analysis between Ecosystem Service Value and Its Driving Factors: A Case Study of Dalian, China. International Journal of Environmental Research and Public Health, 19(24), 17055. https://doi.org/10.3390/ijerph192417055


