1. Introduction
In the past two years, pandemics such as COVID-19 have had serious negative public health and socioeconomic impacts on countries, and the spread of such infectious diseases has slowed the pace of human social progress. To better prevent such pandemics, research literature on COVID-19 is emerging, and scholars from different countries are studying the impact of COVID-19 from their own perspectives, which will help to address social issues during epidemics in various countries. In the past year, there have been many cases of positive tests for the coronavirus in express boxes or infected courier service workers in several Chinese provinces, and China is currently firmly implementing a dynamic zero prevention and control policy to strictly prevent the spread of the coronavirus. Based on the above, and in order to strengthen the research results in the field of public health, this paper explores virus transmission from a new perspective, conducts research in the field of express box virus transmission, and discusses the corresponding recommendations for disease prevention.
It is known that the virus is affected by the environment and will show different transmission trends under different conditions. In a study of the effect of temperature on COVID-19 transmission in 427 cities worldwide, Wang M found that the cumulative number of confirmed cases peaked at 8.72 °C, each 1 °C increase in mean temperature in low temperature areas was associated with a 0.83 increase in the number of confirmed cases in cities, and the number of urban confirmed cases decreased by 0.86 cases for each 1 °C increase in average temperature in hot areas [
1]. A research team from the University of Hong Kong found that coronaviruses can survive for more than 4 days in culture media and that the viruses are highly stable at 5 °C [
2]. Other scholars studying the spread of the COVID-19 virus in different temperatures, humidity, and closed or open environments found that cold and dry conditions were enhancers of virus spread, and these factors were further enhanced in closed environments [
3,
4,
5,
6,
7,
8]. Coronaviruses and infectious diseases with similar transmission characteristics require some pathway to cause spatial spread on a global scale. Cui MJ [
9] systematically analyzed and compared the differential characteristics of spatial and temporal transmission of SARS and COVID-19 and analyzed the causes by combining the transmission characteristics of the virus itself and factors such as traffic and temperature and found that in addition to the transmission ability of the virus itself, the human transportation system was the main reason affecting the spatial long-distance leap spread of SARS and COVID-19. Thomas M [
10] found that a one-scalar-unit increase in weekly bus use was associated with a 1.38-fold increase in the incidence of COVID-19 pneumonia in metropolitan areas of the United States during the pandemic, and a single-scalar-unit increase in weekly rail train use was associated with an increase in incidence 1.54-fold correlation. Many scholars have also constructed models of spatial geographic spread of viruses using shipping aircraft as a virus dispersal pathway, and found by calculation that air transport networks, as a result of modern social development, would increase the risk of spatial spread of infectious diseases while reducing long-distance travel distances [
11,
12,
13]. This provides a reference guide for this paper to study the spatial geographic spread of coronaviruses in different environments.
The study of how COVID-19 is transported by express cartridges leading to spatial spread is most critical to understand the mechanism of coronavirus transmission. Coronavirus is transmitted mainly through droplets or aerosols in close contact with an infected person [
14,
15]. However, it has been shown that persons can be infected through contact with contaminated objects and surfaces. Further, it was emphasized that contaminated object surfaces play a non-negligible role in pathogen transmission [
16,
17,
18,
19]. Kray A found object transmission to be a very important source of transmission risk by studying COVID-19 through viral modeling [
20]. When Pastorino B conducted a study on the transmission of the coronavirus, they found that the infectivity of SARS-CoV-2 was significantly maintained in the presence of proteins regardless of the surface type, suggesting that dust mites infected with the virus play a key role in the indirect infection of objects [
21]. Ong S studied SARS-CoV-2 virus and found that the virus could complete self-inoculation and multiply on the skin surface after contact with infected objects, suggesting that objects are a greater threat as a means of virus transmission [
22]. This provides theoretical support for this paper to study the transmission of viruses in express boxes.
In summary, the study of virus transmission in express boxes, and its spatial and geographic spread by delivery, has a practical and scientific significance. Therefore, in this paper, based on the characteristics of express box transportation, the express box infectious disease model is established based on the comprehensive consideration of environmental influencing factors, such as temperature, disinfection, humidity, virus release intensity, and express vehicle transportation volume. Subsequently, the model calculation results are combined to explore the changes of virus spatial and geographical spread due to express box transportation, with the aim of providing prediction support and theoretical suggestions for virus prevention in public health-related fields, to better cope with future infectious disease pandemics.
2. Method: Express Box Dynamic Model
Theoretical knowledge related to infectious disease dynamics is the basis of this study, which is a mathematical model of infectious diseases established by Kermack and McKendrick through mathematical and kinetic knowledge [
23]. Infectious disease dynamics models quantitatively reveal the main characteristics of infectious diseases through hypotheses, parameters, variables, and the links between them, rely on data from early outbreaks, incorporate future uncertainties, help discover the mechanisms of infectious disease transmission, and scientifically predict epidemic trends [
24]. The SIR model and SEIR model are two classical models in the field of infectious disease dynamics, which classify the population during a pandemic into: susceptible (
S) latent population (
E), infected (
I), and cured/recovered (
R). Further, susceptible people have the probability
β to be infected, susceptible people transform into infected people according to the rate
α (
α is the reciprocal of the average incubation period), and infected people have the probability
γ to recover into cured/recovered people. During the pandemic, many scholars have used the above two models to predict the development trend of COVID-19 [
25,
26,
27]. This paper is based on the existence of realistic cases of infected express boxes, combined with the fact that coronaviruses themselves resemble soft colloidal spheres, with the function of adsorbing on the surface of objects and suspending in the air, and can remain highly active on the surface of inanimate objects, transfer and hide [
20,
28], also relied on the findings that coronaviruses can transfer and spread on the surface of objects, such as leather, for up to 48 h [
29], to study the transmission of infection in express boxes caused by the attachment and transfer of coronaviruses on the surface of paper or plastic-type express boxes.
First, in this paper, we establish the express box virus transmission model, Equation (1) (where:
S is the susceptible box,
I is the infected box, and the susceptible box has the probability
β to be infected, and
N is the total number of boxes in courier transportation). Notably, this model has no cured/recovered (
R), and combined with the characteristics of virus fomite transmission, there are two reasons: (1)
R in the original model represents patients who have recovered, and the virus cannot be detected. However, the coronavirus, when attached to a high-touch surface such as an express box, will have a relatively strong activity and transmission capacity to spread to new individuals within tens of hours [
30], during which time the virus does not disappear. (2) The incubation period of the coronavirus can be as long as 3–14 days [
31], which means that there is a lag in the time when the virus is checked positive, and the incubation time of the virus exceeds the total time assumed by the model. This indicates that the virus has a potential risk of transmission during the entire express box transport cycle.
Secondly, it was learned through a literature review that the activity of indirect transmission of coronaviruses on the surface of objects diminishes with time, and that this change in the possibility of decline depends on the influence of surrounding environmental factors [
32]. After the investigation of express box transportation, it was found that the main transport environment of express boxes is closed, and the factors that can have an impact on virus transmission in express box transportation are the following: (1) Disinfection, the preventive measures for the express field after the epidemic are mainly the disinfection of the transport environment before shipment, and disinfection is currently the key link to contain and interrupt the spread of COVID-19 [
33]; (2) The volume of the carriage in express box transport, which is a constraint affecting the range of virus transmission and the volume of express box transport; (3) Temperature, which can directly affect the active degree of the virus in express transport, which plays an important role in virus transmission [
1,
2,
3,
4,
5,
6,
7]; (4) Virus release intensity, the intensity of free transmission of the virus itself without interference, correlation with the basic regeneration number of virus transmission, which will directly determine the intensity of transmission of different viruses in the initial stage [
31]; (5) Humidity, where lower humidity increases the persistence of coronaviruses [
7,
8]. Additionally, it has been demonstrated that relative humidity is negatively correlated with the global spread of COVID-19, with a 0.19% decrease in the percentage of new cases for every 1 percentage point increase in relative humidity [
34]. If indoor relative humidity increases from 46.4% to 66.1%, the number of COVID-19 confirmations decreases by 14% [
35]. It is also known that coronaviruses can remain viable on plastic surfaces for up to 5 days in 40~50% humidity environments, and viral viability is rapidly lost at RH > 95% [
36]. In order to incorporate the above five factors into the courier box virus transmission model, this paper builds on the existing research on virus transmission trends in closed environments [
37]. The environmental influence
ρ, Equation (2), that affects the activity of express box virus transmission was constructed. The environmental impact value
ρ, of the express box virus, as a parameter that combines the impact of multiple virus transmission, can help researchers set different environmental conditions in the simulation to achieve the recovery of the real virus transmission environment.
Express box dynamic model:
The factors in Equation (2) have the following characteristics in this study:
T = Temperature. In this paper, through the investigation of the express transportation environment, we found that the average temperature in the express carriage is usually kept between is 15~25 °C, there are also special cases, such as in low temperature areas and night driving, the lowest 10 °C, and the highest temperature appears in the summer daytime, the temperature can reach 30 °C. Therefore, the range of values of temperature T in this model is set from 10 °C to 30 °C, and the virus propagation activity decreases as the temperature increases.
D = Disinfection. Standard disinfection of carriages as well as express cargo at the time of departure, which will determine the base number of viruses in transport, is divided into two cases in this paper, sterilized and unsterilized.
o = Virus release intensity. In this study, free propagation without intervention.
V = The volume of the carriage of the express box delivery vehicle.
H = Relative humidity. This paper draws on the above-mentioned literature to define the range of humidity in different environments and integrating the range of 40–60% of indoor health humidity and the relative humidity in the closed container truck can reach 95%, set the model minimum relative humidity of 35% (the virus has high activity in dry environment), and gradually increase the relative humidity. The virus activity decreases until the virus activity disappears rapidly when the RH is 95%.
Finally, according to the knowledge related to infectious disease kinetics, it is known that the infectious rate
ρ of the infected courier box (
I) and the susceptible box (
S) in the vehicle is proportional to both vehicle travel time and transmission density [
25], then combined with Equation (2), the express box virus transmission rate can be expressed as Equation (3) (
b is a constant coefficient proportional to that obtained by fitting the actual data). In combined Equations (1)–(3), can be found the number of individuals in the car infected with express boxes.
2.1. Calculation
2.1.1. The Model Simulation Values Are Set
This study based on the full investigation of the actual express transportation environment, the total time of express transportation was set as 3 days (the average of express transportation in China is <72 h). The viral transmission space was set as the loading volume
V = 50 m
3 of medium-sized vehicles of common express vehicles. The primary COVID-19 free dispersal intensity
o = 0.075. In this study, it was assumed that only one delivery box was attached to a sufficient number of highly viable viruses at the time of departure of the delivery vehicle,
I (
o) = 1. The temperature
T, inside the vehicle was set in the range of 10–30 °C. The base relative humidity
RH was set at 35% and gradually increased by 20% until it reached 95%. Similar numerical settings were made in the spatial geographic spread study with full consideration of realistic conditions (
Table 1). The above settings can be used to obtain the model calculations for the propagation of the express box virus under different conditions.
2.1.2. Effect of Temperature Change on Virus Transmission in Express Boxes
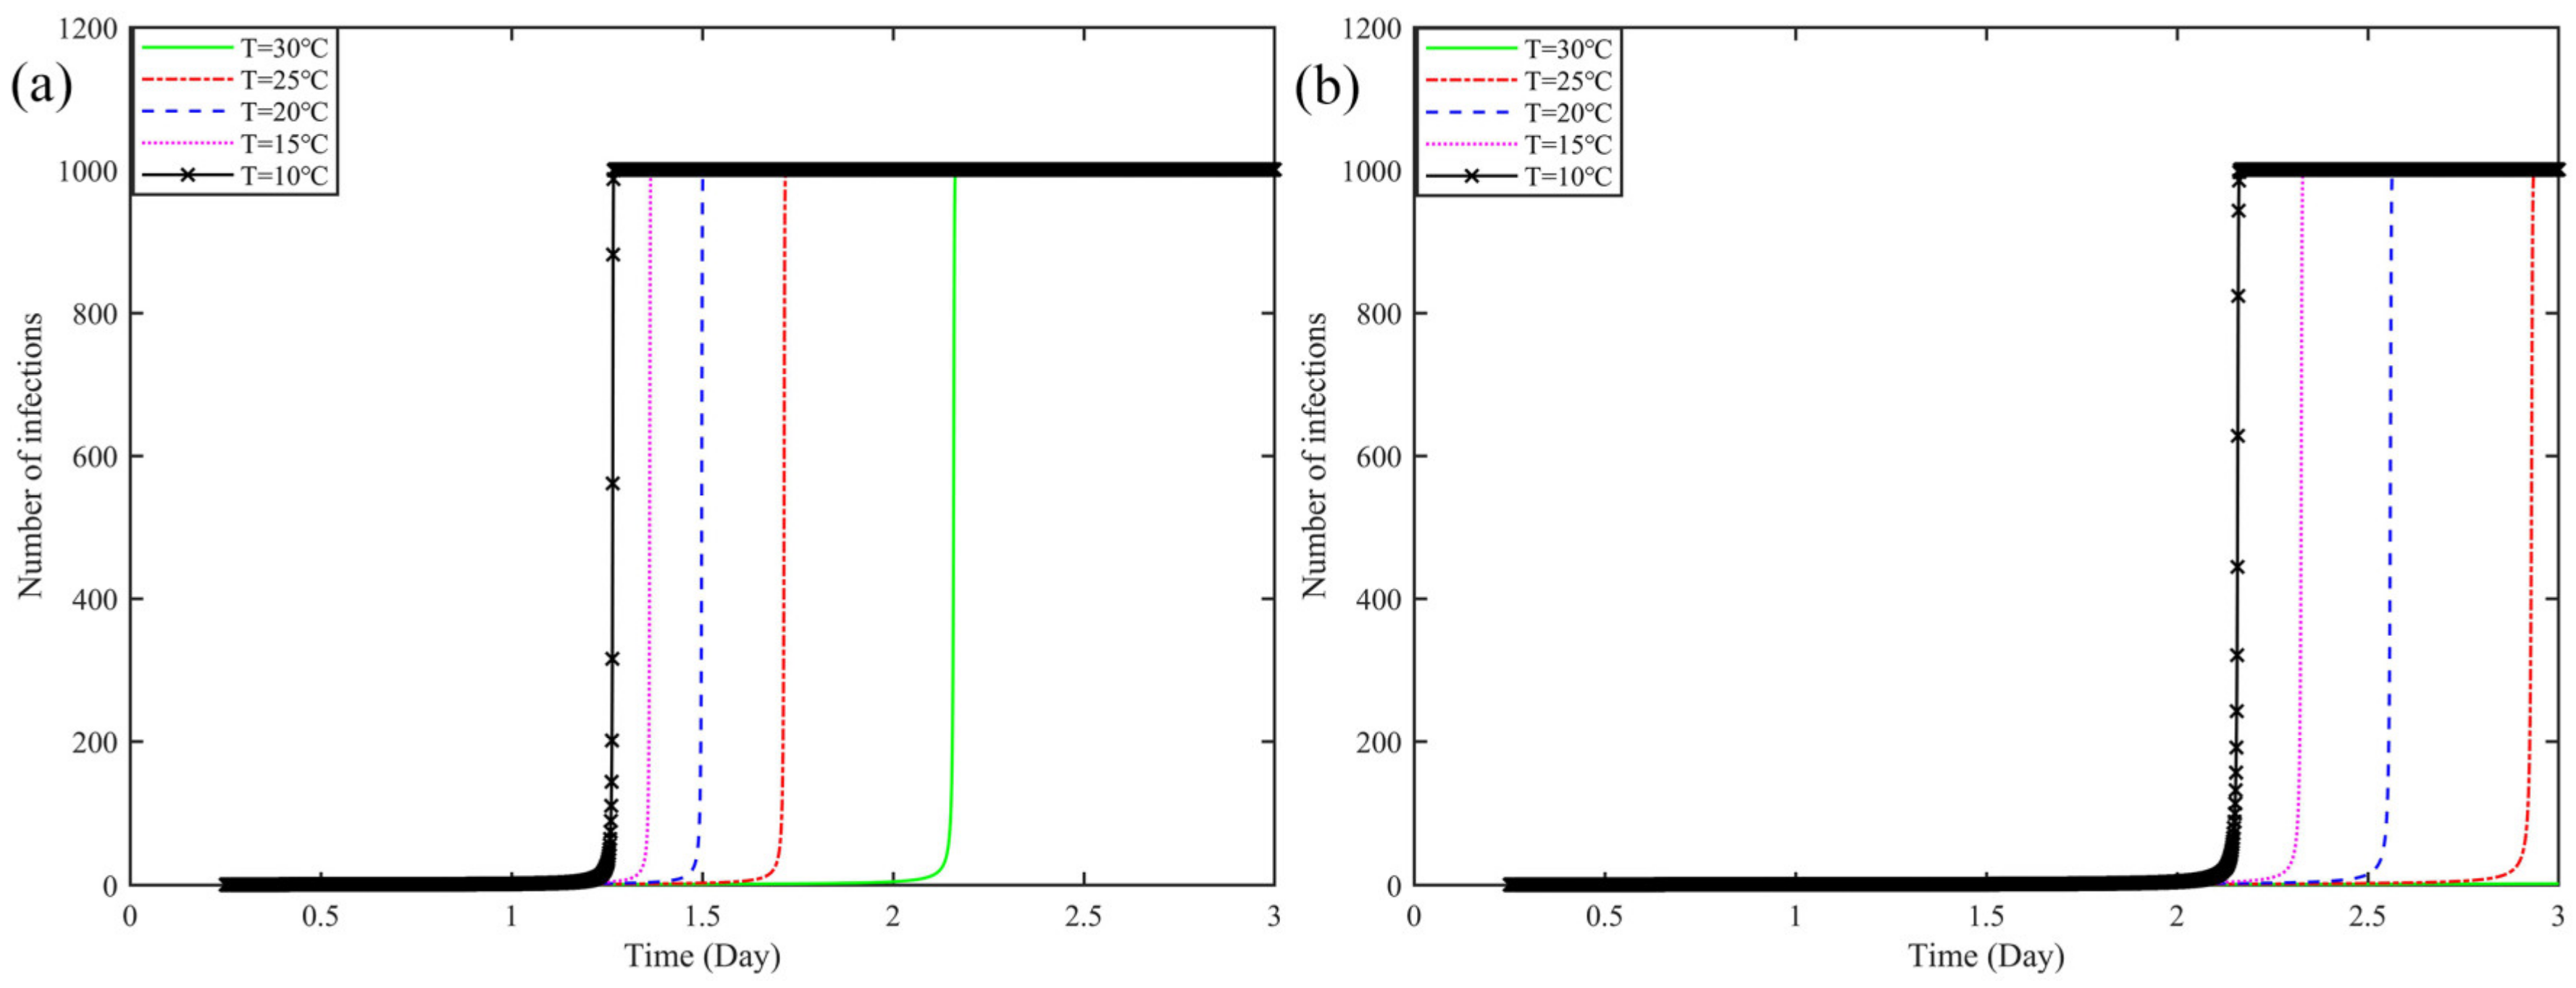
Figure 1 shows the effect of temperature change on virus transmission when loading 1000 pieces of express boxes.
Figure 1a shows the effect of the change in temperature inside the vehicle without being sterilized, and the effect on the change of virus transmission when
T was from 30 °C to 10 °C. It can be seen from the figure: With the increase of temperature
T value from 30 °C to 10 °C, the number of infected boxes at the same time are increasing, from the beginning of
T = 30 °C to infect 1000 cargoes requires 2.165 days (51.96 h), to
T = 10 °C, only requires 1.275 days (30.6 h). Compared to the former, shortened 20.36 h. It shows that the number of infected boxes in the car tends to decrease as the temperature increases.
Figure 1b shows that at the time of departure, the car and the box were sterilized, and the effect of the value of the car temperature on the change of virus transmission in the car when it was lowered from 30 °C to 10 °C. If the number of infected boxes ≤ 10 in 3 days, it will not show in the figure. When the above conditions are met, and the
T from 30 °C to 25 °C, the number of infected express boxes does not exceed 10, in a 3-day period. When the
T from 25 °C to 10 °C, the number of infected boxes gradually increased, from
T = 25 °C, when the infection of 1000 pieces requires 2.93 days (70.32 h), to
T = 10 °C, when the infection of 1000 pieces only requires 2.18 days (52.32 h), shortened 18 h.
After comparing
Figure 1a,b, it is clear that disinfection has a greater impact on virus transmission, when the temperature gradually drops from 30 °C to 10 °C. In the absence of disinfection, different temperature conditions infect the entire carriage, taking 30.6 h at the fastest, to 51.96 h at the slowest. With the disinfection, infecting the entire boxes takes 52.32 h at the fastest, and no more than 10 boxes infected in 3 days at the slowest. Further, we can learn from the graph, that the virus transmission rate only starts to rise significantly when the disinfection of the car and express box is done, and the temperature inside the car is below 25 °C.
2.1.3. Effect of Relative Humidity on Virus Transmission
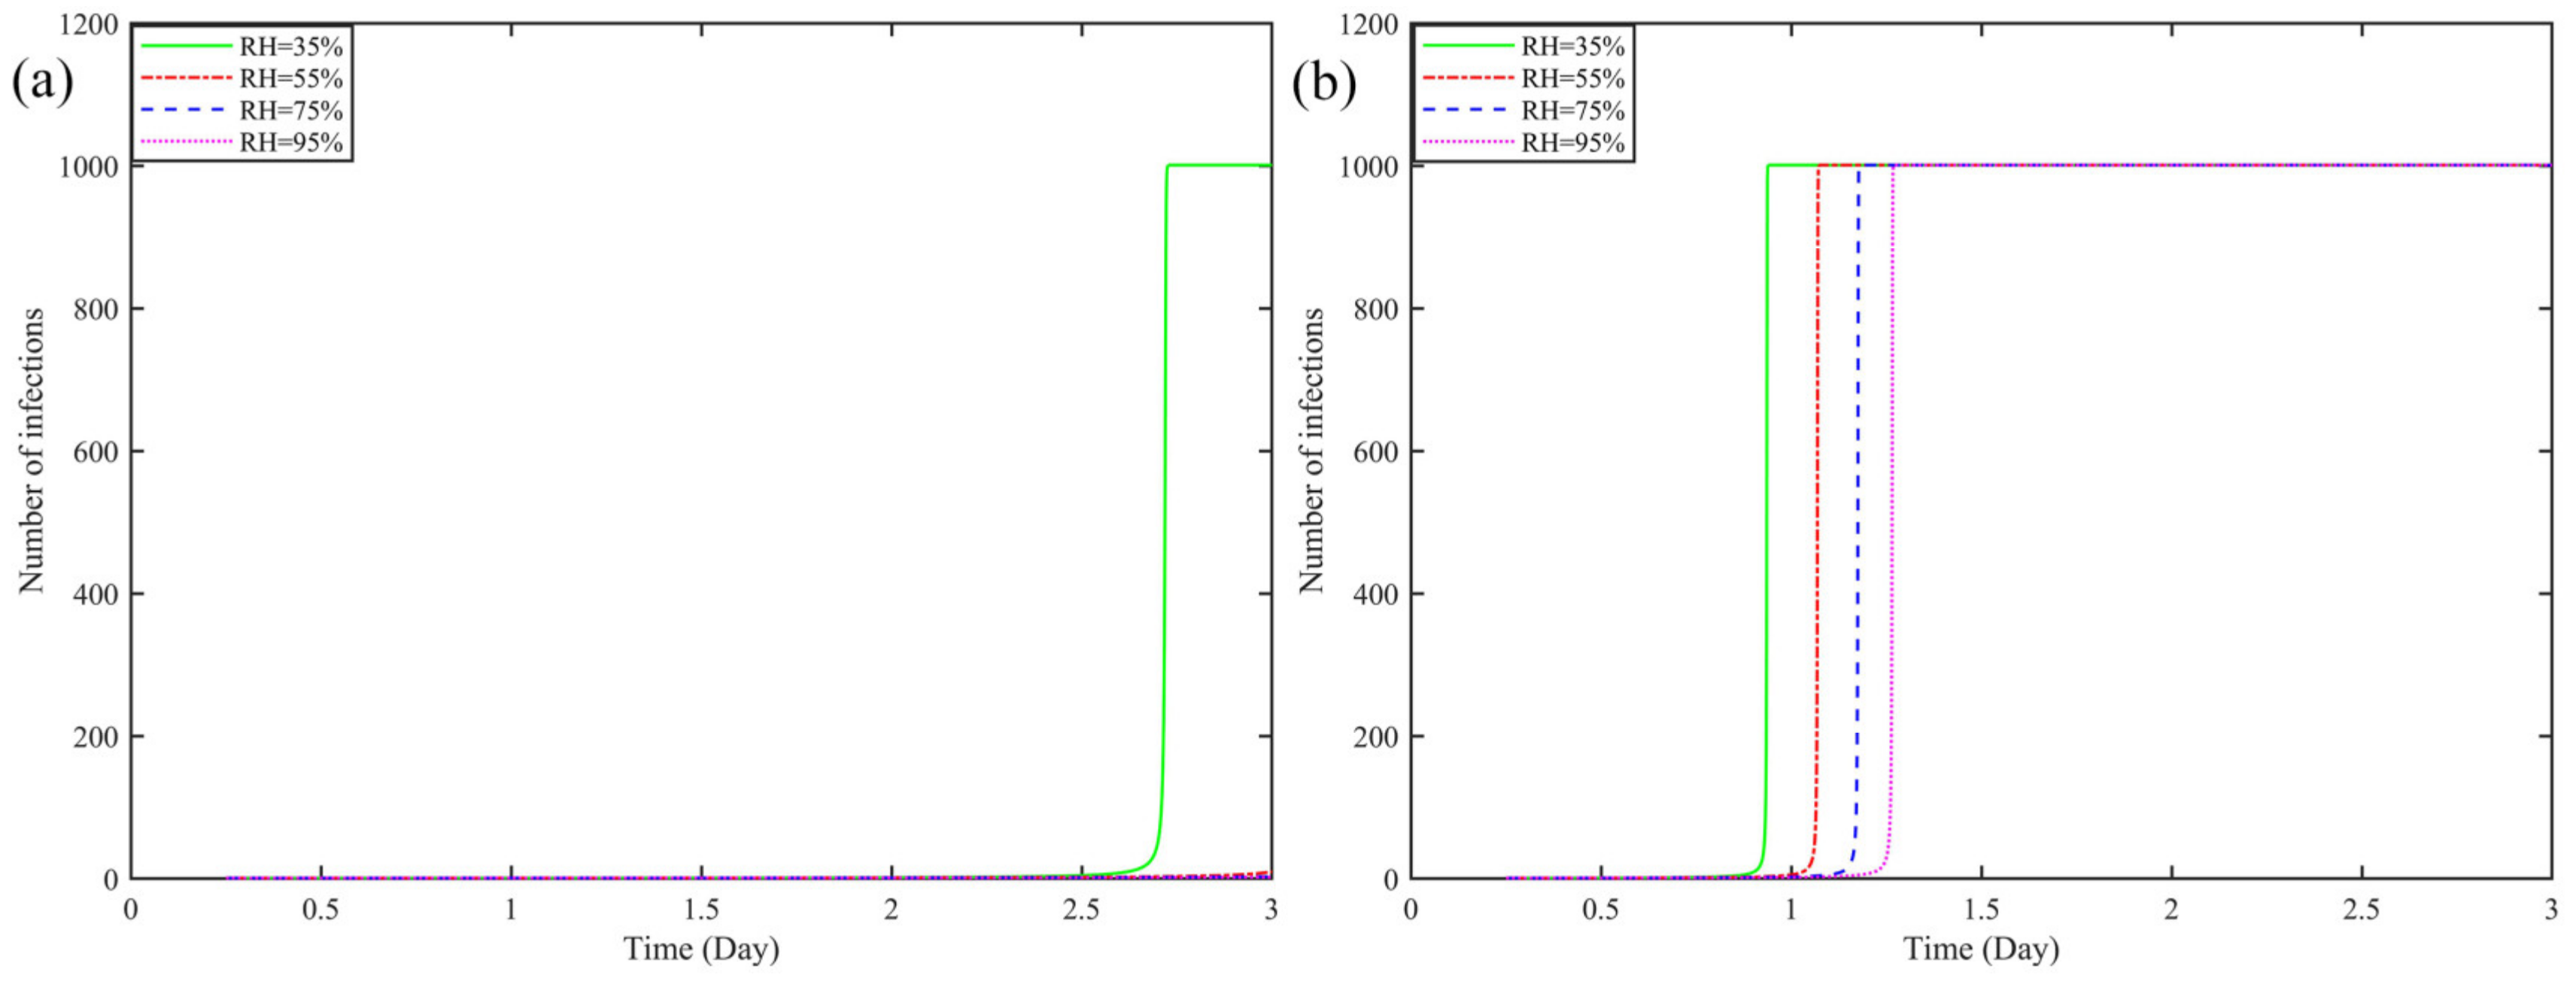
Figure 2 shows the effect of
RH change in the vehicle on virus transmission when loaded with 1000 pieces.
Figure 2a shows when the vehicle is disinfected and the temperature
T inside the vehicle is the least suitable for virus transmission during the driving process, when
T = 30 °C, and changes with the increase of
RH of ambient relative humidity (
RH = 55%, 75%, 95%, the number of infected boxes ≤ 10 in 3 days is not shown in the figure). As can be seen from
Figure 2b, the overall number of infections showed a linear decline as
RH increased. In this condition, the model assumes that the entire compartment with 1000 boxes is infected only when the relative humidity
RH = 35%, it takes 2.73 days (65.52 h) for the entire boxes to be infected, but with
RH ≥ 55%, the number of infected boxes does not exceed 10 in 3 days.
Figure 2b shows the trend of the effect of increasing
RH on the risk of virus transmission in the car, when the car is not disinfected and the temperature inside the car is optimal for virus transmission, T = 10 °C. It can be seen from
Figure 2b, that as
RH increases from 35% to 95%, all the boxes are infected, from the fastest need of ≈0.94 days (22.56 h), to the slowest need of ≈1.27 days (30.48 h), the time is reduced by 7.92 h. At
RH = 35%, it takes 2.73 days (65.52 h) in
Figure 2a to 0.94 days (22.56 h) and in
Figure 2b, a reduction of 42.96 h.
2.1.4. Effect of Number of Courier Boxes on Virus Transmission
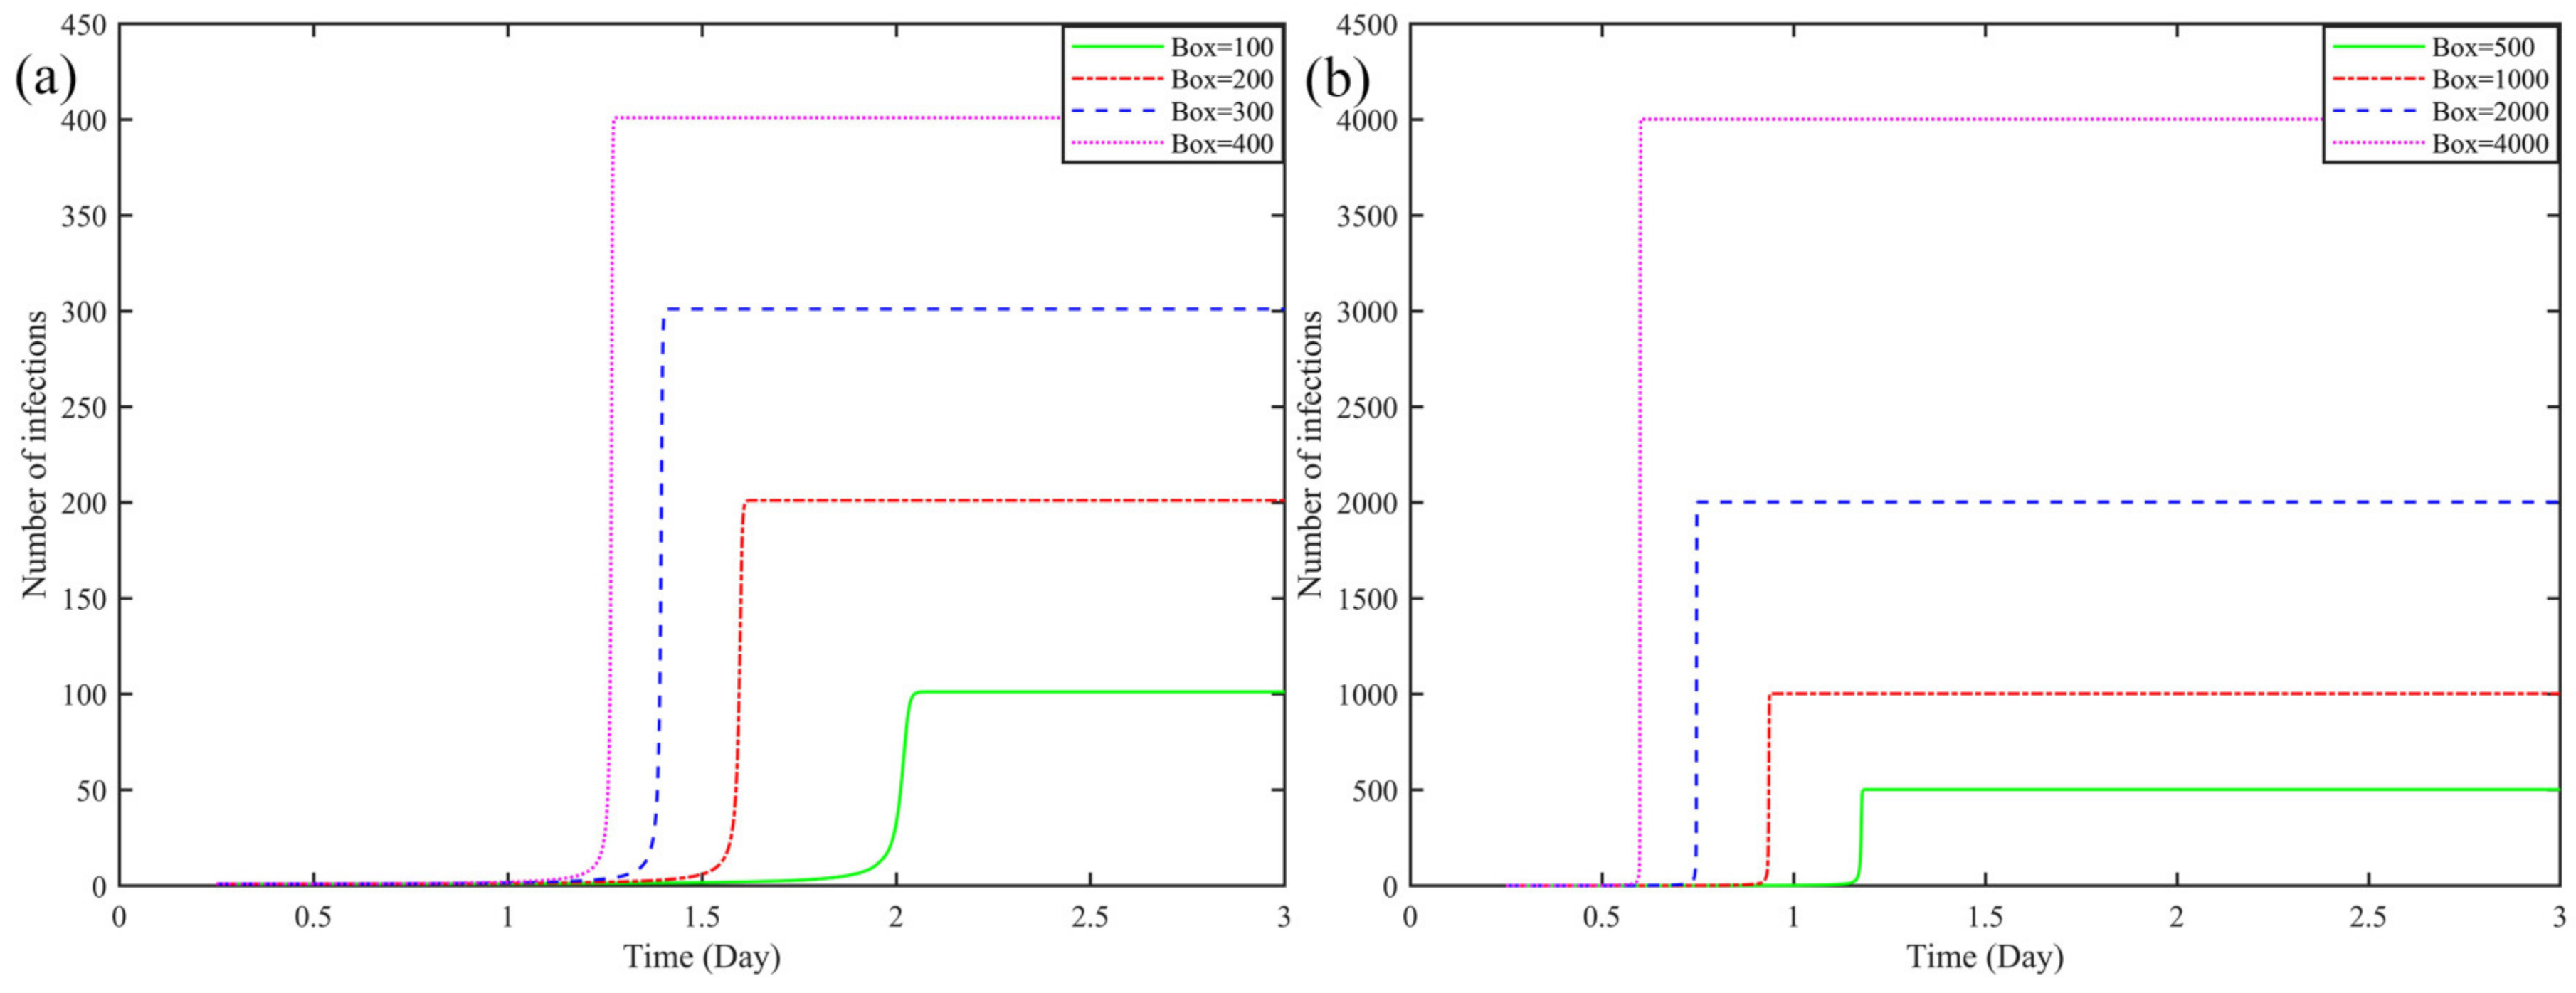
Figure 3 show the virus transmission time as the boxes increases when the carriage is not disinfected, and when the temperature and humidity inside the carriage are optimal for virus transmission,
T = 10 °C and
RH = 35%. As the number of boxes increases, the infected time accelerates, and the amount of boxes and the time are inversely proportional. From 49.44 h for infecting 100 boxes to 14.64 h for infecting 4000 boxes, shortened 34.8 h.
2.2. Analysis of Results
The corresponding simulation results can be further summarized through
Figure 1,
Figure 2 and
Figure 3 (
Table 2 and
Table 3). By analyzing
Table 2 and
Table 3, and combining them with the model, it can be found that the factors influencing the transmission pattern of COVID-19 in the express box have the following characteristics:
Disinfection. Disinfection directly affects the original number and transmission rate of viruses in the express box, its impact rate on the model ≥ 71%.
Temperature. As express transportation needs to experience day and night, different temperatures have a large impact rate on the virus, in the model the temperature impact rate ≥ 17.5%, per temperature change ± 5 °C.
Relative humidity. Each 20% increase in RH, has an effect rate of ≥23.4% on the model.
Boxes. From
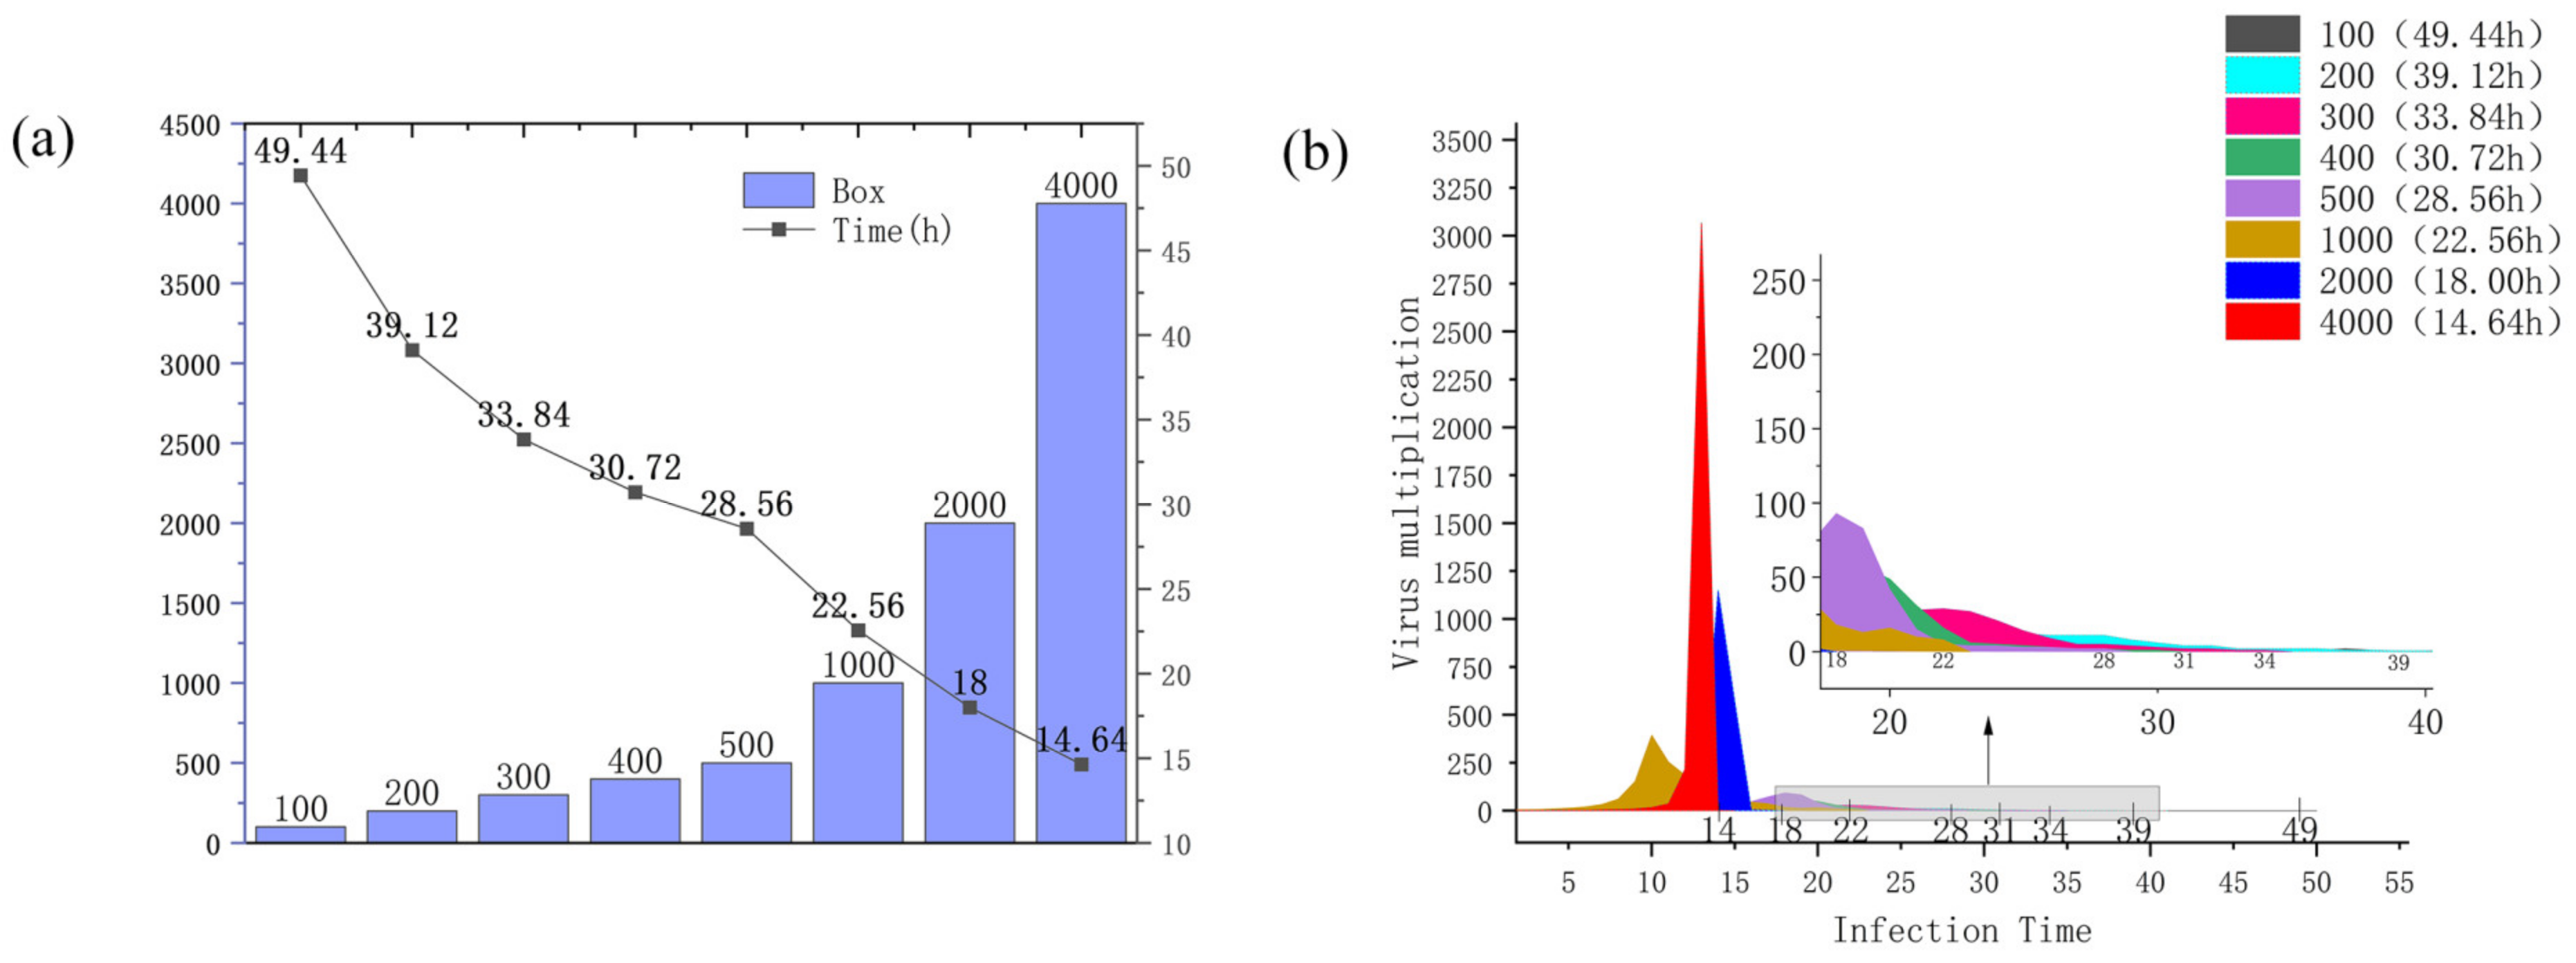
Figure 3a,b, it can be seen that when the number of express boxes is higher, the faster the infection time of courier in the transport vehicle, and the relationship between its change and the model is shown in
Figure 4 and
Figure 5. In addition, it can be seen from
Figure 4a,b, that as the number of boxes increases, the infection speed is accelerated, and the infection time is rapidly reduced. It takes 49.44 h to infect 100 boxes, but only 14.64 h to infect 4000. Among them, the transmission rate of the COVID-19 virus in boxes is more than 3000 times when the express boxes are 4000, which is nearly more than 2000 times higher than the transmission rate at 1000 boxes. The number of courier boxes is another important variable that affects the whole model.
Analysis of the Possibility of Preventing the Express Box Virus
As shown in
Figure 4b, we can see that in a very short period, the virus spreads from a smooth growth at the beginning to a sharp increase. Then, if it is possible to know that the virus only started to have a different propagation change at a certain node and set the prevention threshold according to this propagation node, and do the corresponding prevention work, it is of great significance to the research of controlling the spread of the express box virus. Through the calculation of the model, combined with
Figure 4b, we found that the number of infections increased exponentially when the virus infection rate was ≥50%, so the point when the virus infection rate reached ≥50% was selected as the critical prevention threshold point for the spread of this express box virus, resulting in
Figure 5. Subsequently, this prevention threshold is used as the node, and the time from courier dispatch to this node is called “safe time” (the growth rate of COVID-19 virus transmission in the transport box is ≤50%, and the total transport time is ≥90%), so that we can get the area with the low virus infection number. Finally, according to the proportion of the express boxes in the safe time to the total infection time, combined with the proportion of the boxes outside the safe time (virus outbreak area), we get
Table 4.
First, it is known from
Figure 5 that the virus rapid outbreak node decreases with the growth of boxes, which is inversely proportional to the cargo volume. It means that the larger the cargo volume is, the shorter the outbreak node time is. Secondly, it can be learned from
Table 4 that the ratio of infected cargo volume to total cargo volume after the virus outbreak is ≥90%, the number of infected express boxes in the safe area is small, and the safe area accounts for a long time. This shows that the spread of the express box virus can be effectively controlled by the time advantage.
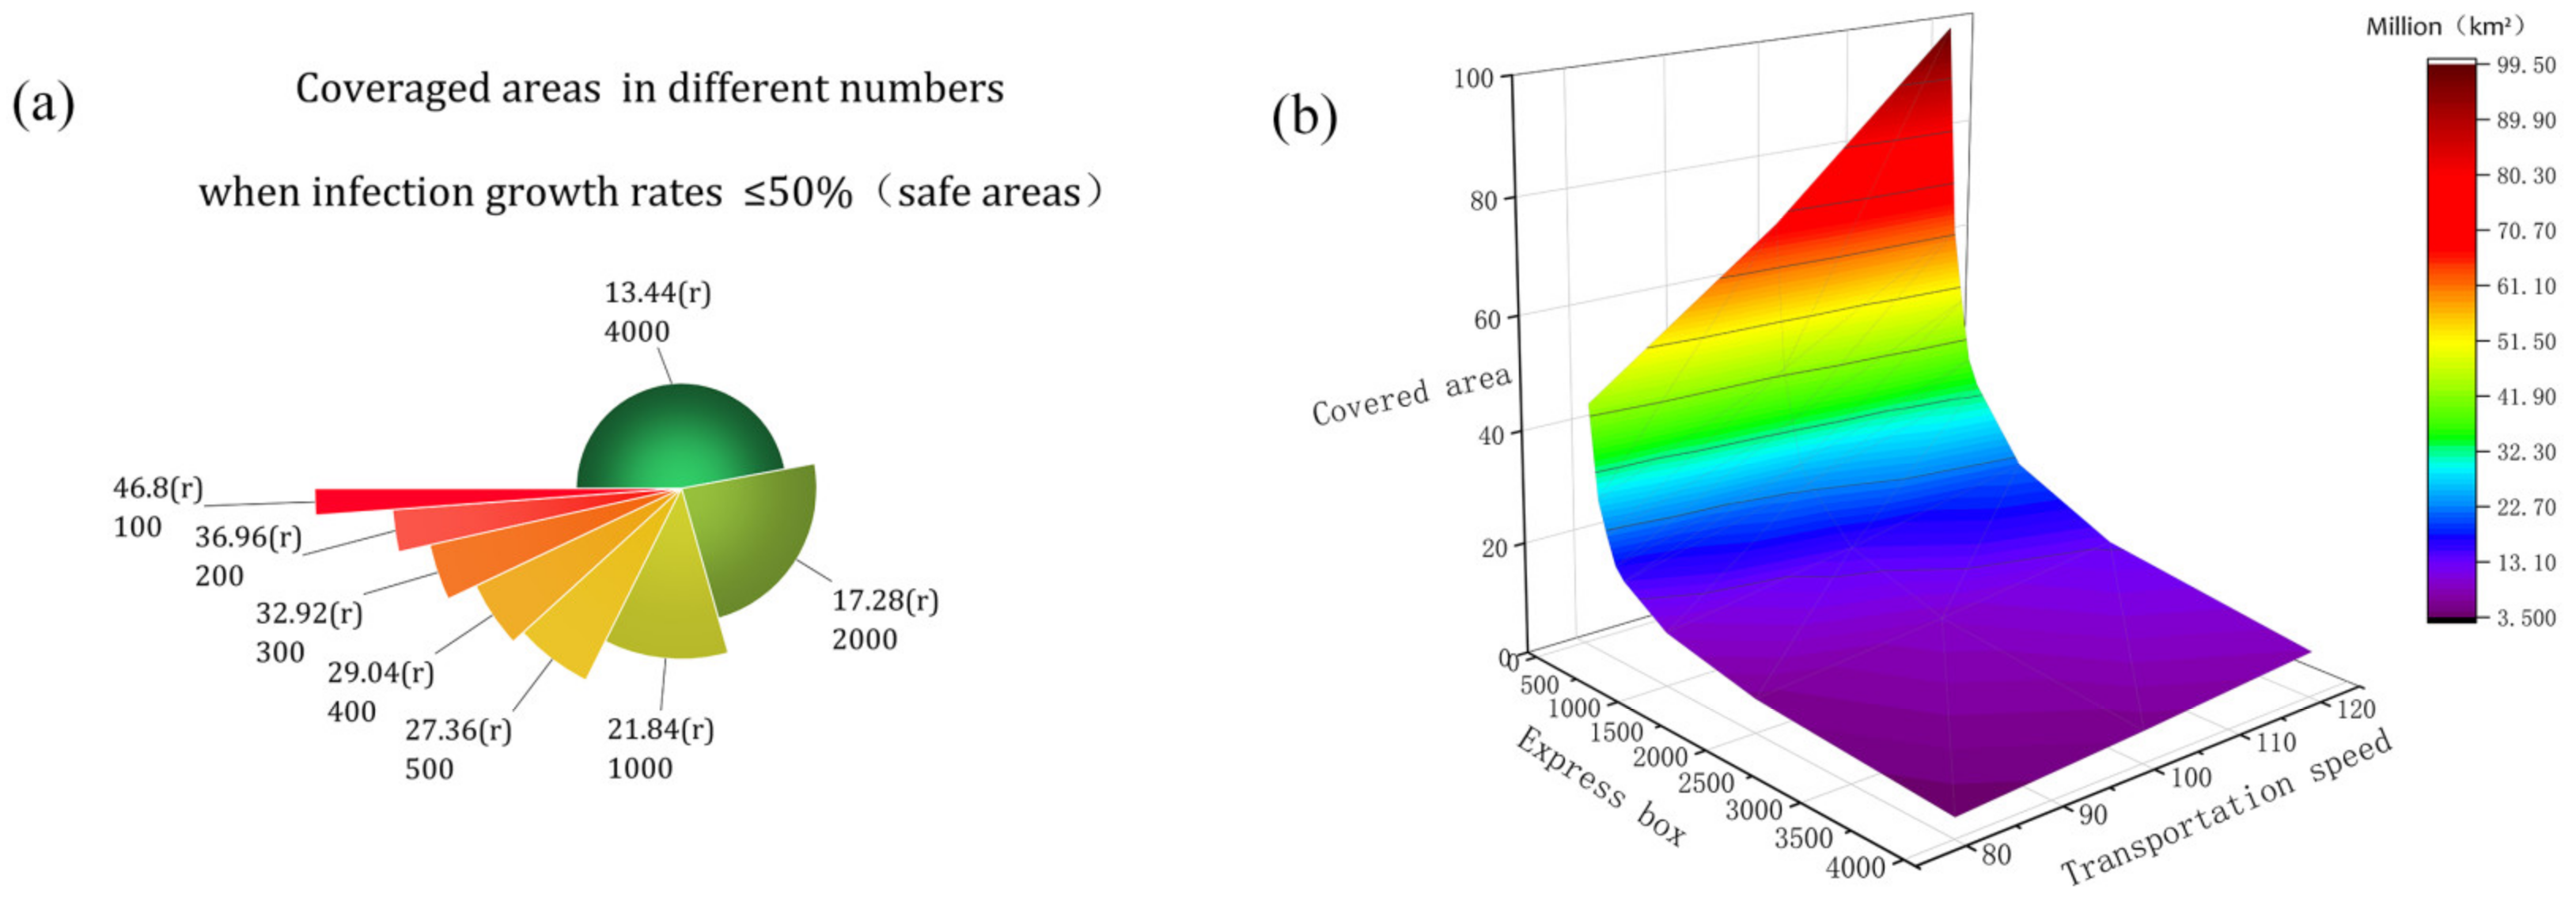
Secondly, based on this safe time, combined with the actual express box transportation, we can infer that the virus in the courier car compartment only starts to break out at the specific range covered by the car in a straight line, from which we can assume: the safe time before the virus outbreak as the radius (r) of the best prevention area in the spatial and geographical spread of the express box virus. Further, it is derived that the safety area for express box virus propagation is shown in
Figure 6a. Moreover, we know that vehicles travel different distances at different driving speeds, so in order to better express the relationship between courier transportation speed and the area of safety area it covers, we construct
Figure 6b. In this paper, we want to use
Figure 6a,b to derive the optimal area of prevention area in courier virus spatial and geographical propagation to improve the accuracy of prevention efforts.
Figure 6a,b shows that the optimal radius (r) for express box virus transmission prevention is shortening as the volume of shipments grows, and with it, the area of the optimal area for prevention and control is shrinking. When there are 100 boxes needing 46.8 (r), to 4000 boxes needing 13.4 (r), the radius difference is 33.4 (r). From
Figure 6b, it can be seen that under the same conditions with the acceleration of express transport speed, from 80 km/h to 120 km/h, the best area of prevention and control can be increased by more than double, indicating that improving driving speed in express transport vehicles can effectively increase the best area of prevention and control, reduce the risk of spatial and geographical transmission of the express box virus.
4. Discussion
First of all, after the survey and research on the courier field, it was found that the global courier volume showed a gradual upward trend, especially after 2020, when people’s willingness to purchase online increased due to various restrictive precautionary measures for COVID-19 enacted by many countries. Express boxes have the characteristics of large number, frequent contact with humans, and relatively strong cross-regional, which are likely to become an important channel for virus transmission, and there have been reports from countries that have tested positive for COVID-19 in express boxes. Therefore, facing the risk of infectious diseases that may come from courier boxes, this study wants to improve the perception of risk by analyzing the changes in the transmission of viruses from express boxes, and to promote to the health sector to strengthen preparedness and improve response measures [
38].
Second, for virus transmission in fomites like express boxes, we need to be clear, while direct transmission is important, the model suggests fomites can also transmit, which is important for exposures that are not in-person. Therefore, fomite transmission may be an important source of risk [
20]. Media, temperature, relative humidity, ventilation, and material type have an impact on the persistence of coronaviruses in fomite transmission, and the fact that viruses persist long enough on high contact surfaces suggests that the environment is an important influence on virus transmission [
22,
30]. In this paper, based on the study of coronavirus transmission in fomites, by establishing environmental impact values
ρ, we wanted to understand the trend of virus transmission between objects that are frequently touched in human daily life such as express boxes, and further predict the impact of virus transmission in express boxes by combining spatial geographic transmission. However, for modeling studies of virus transmission through fomites and thus infection of humans, we recommend reconsidering the candidacy impact factor because of the change in the primary environment (from a closed to an open environment) and it is possible that the probability of virus infection varies from person to person due to different protective measures for each person (wearing masks and hand disinfection), which requires additional settings on an experimental basis.
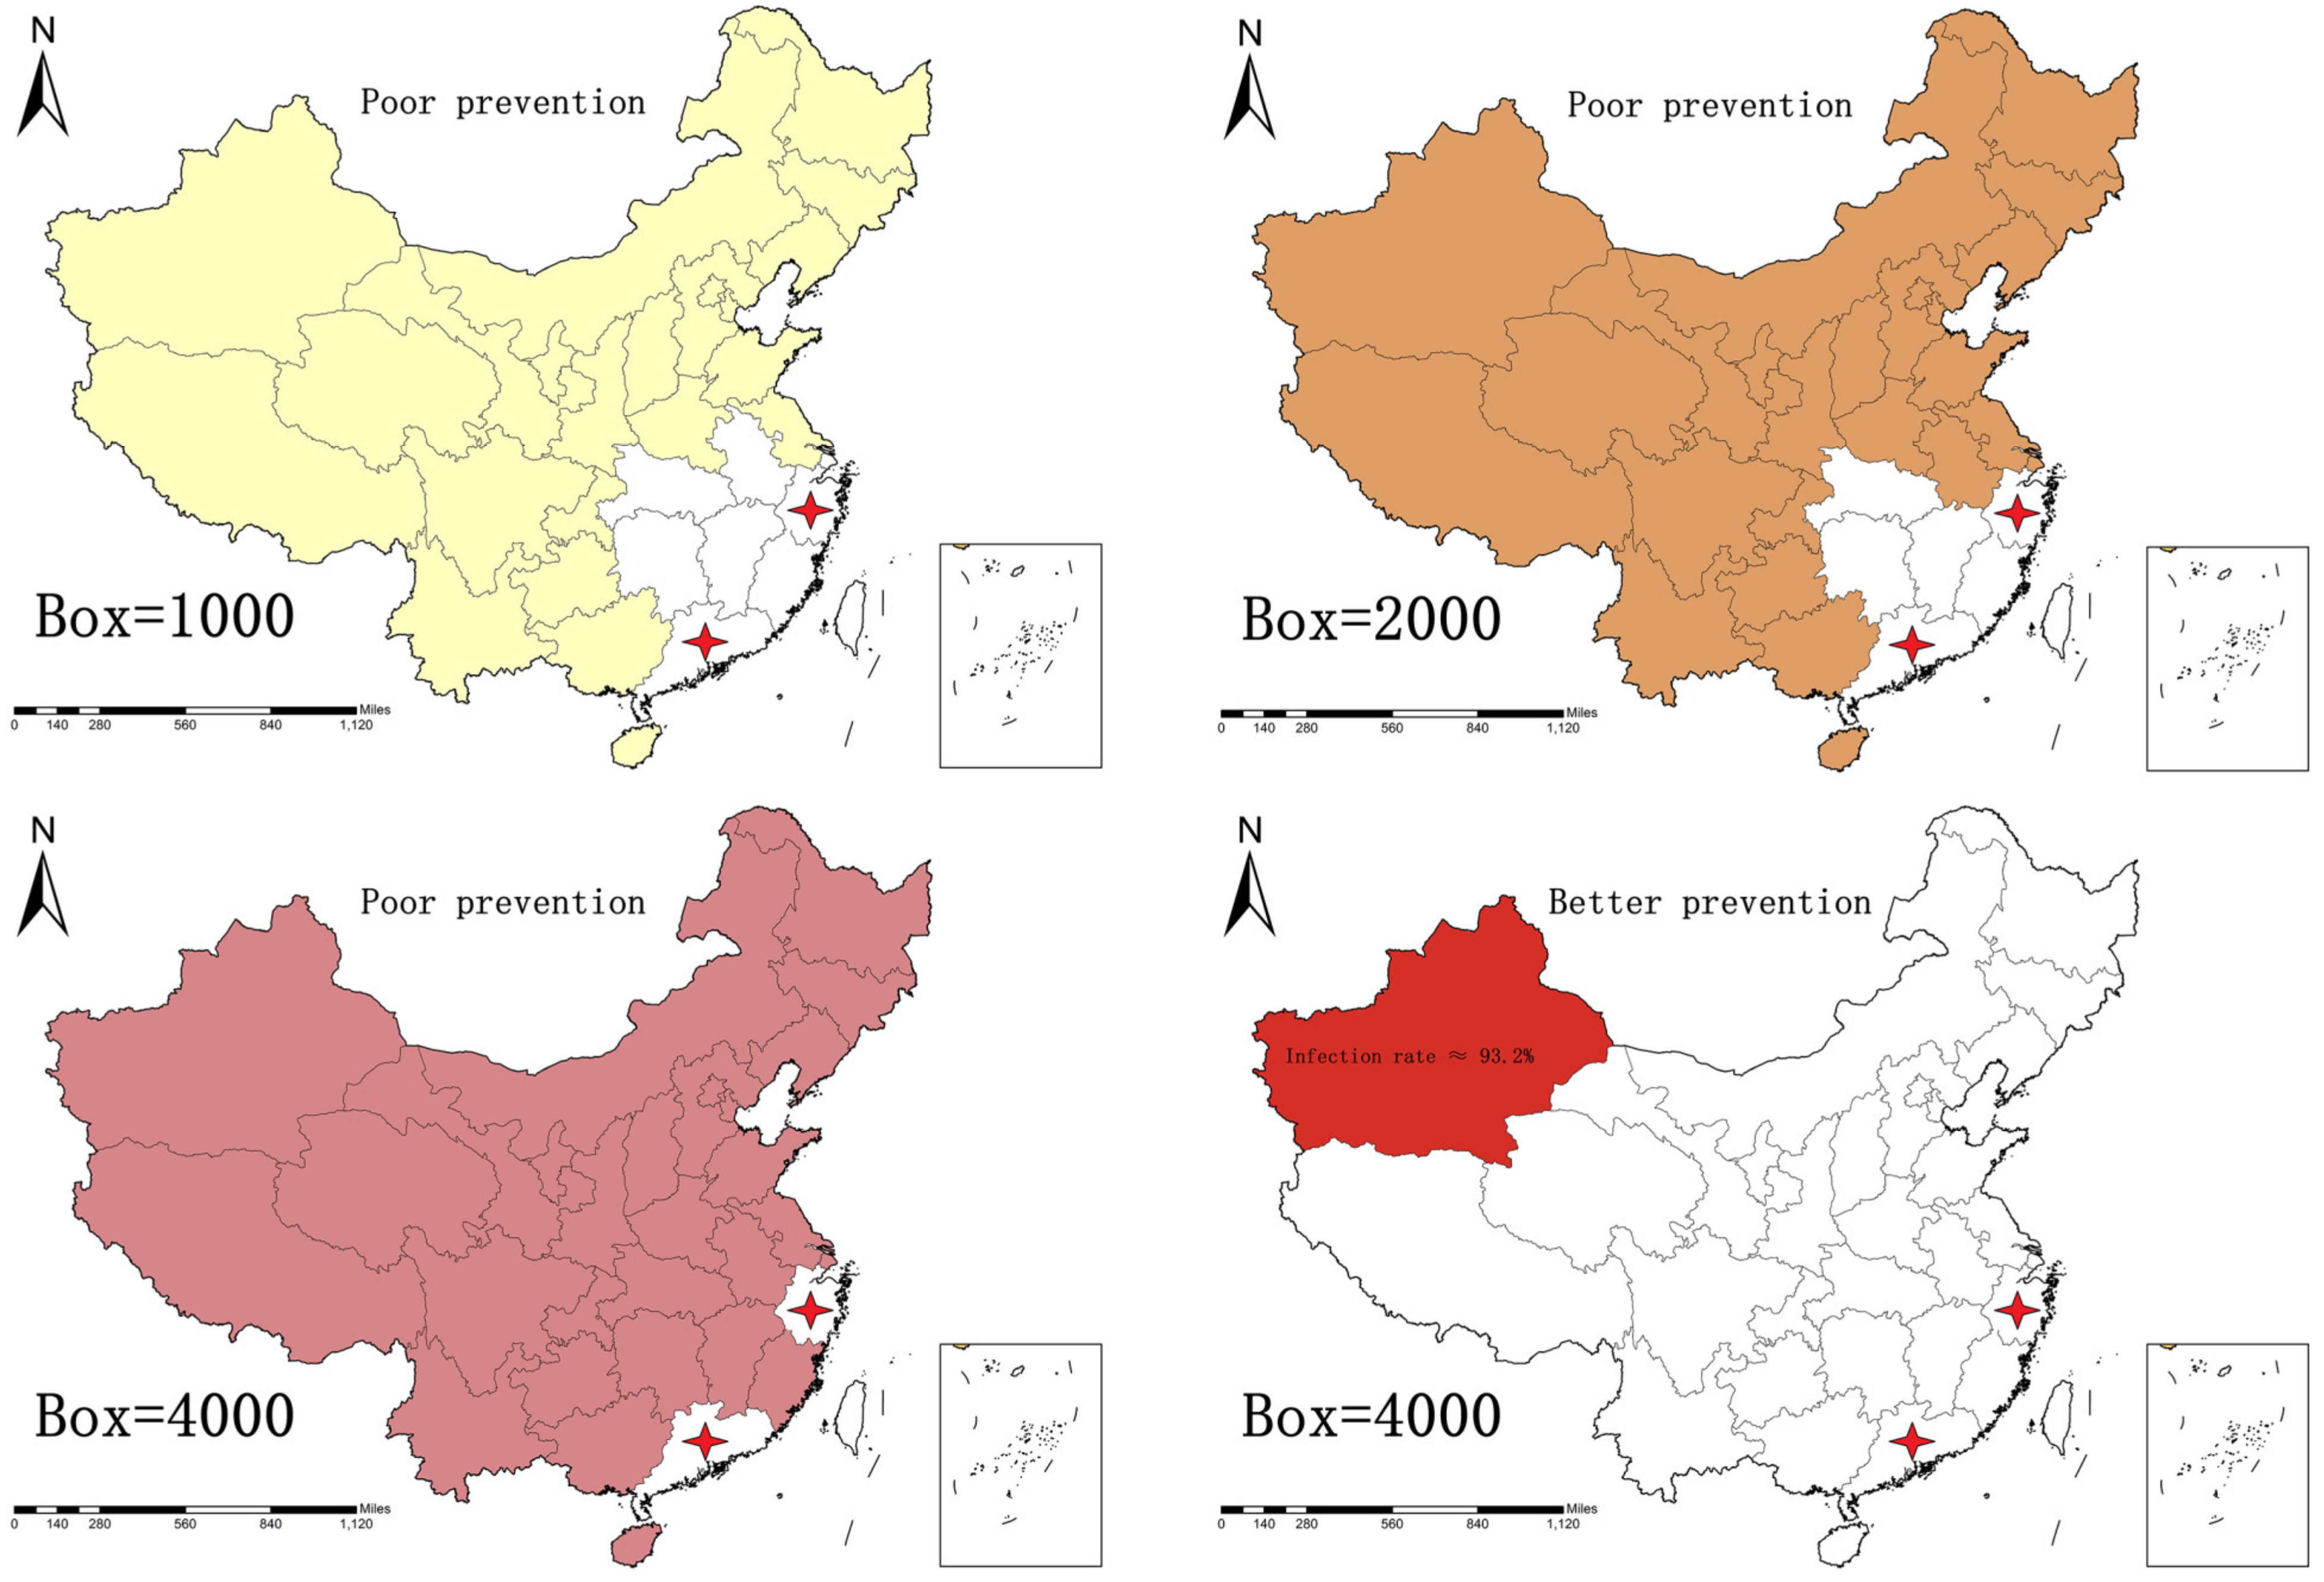
The practical significance of this study is that if the COVID-19 virus is found in the express boxes in a certain area, we can track the relevant batches of boxes, combined with the express box virus transmission model, infer the spatial and geographic range of infection by the express box virus, and make targeted prevention to improve the accuracy of virus prevention.
Admittedly, our work suffers from three major limitations: First, the comprehensive tests of environmental influences in this study need to be improved; for example, this paper sets out to study the changes of temperature and disinfection on virus transmission in express boxes with other factors held constant. As we know that the environment is a complex system, this study can only choose a constant value research method for the simulation test. Second, there is a deficiency for the combination of the express box virus model and Chinese spatial geography; this study sets the express box departure to the provincial point as the total transportation distance, and the infection of the express box in the carriage when it arrives at the province represents the infection of the whole province, and the study of the change of the number of express boxes in the carriage after the express is redistributed through the provincial transfer station needs to be further explored. Third, this paper takes values based on the initial COVID-19 virus release intensity, while for the continuously mutating virus, the virus release intensity keeps increasing, which will increase the risk of virus transmission and spread, which will require changes in future studies.
