
Meteorological Drought Variability and Its Impact on Wheat Yields across South Africa
 ,
,  ,
, 
 and
and 
Abstract
1. Introduction
- To examine and analyze the variability in short-term drought (SPI-3) occurrence and trends at all meteorological stations in the region over a time period of the past 20 years (2002–2021);
- To explore the impacts of short-term meteorological droughts (SPI-3) on wheat yield loss and its resistance using a standardized yield residual series (SYRS) and the crop drought resistance factor (CR) in all provinces in the region.
2. Materials and Methods
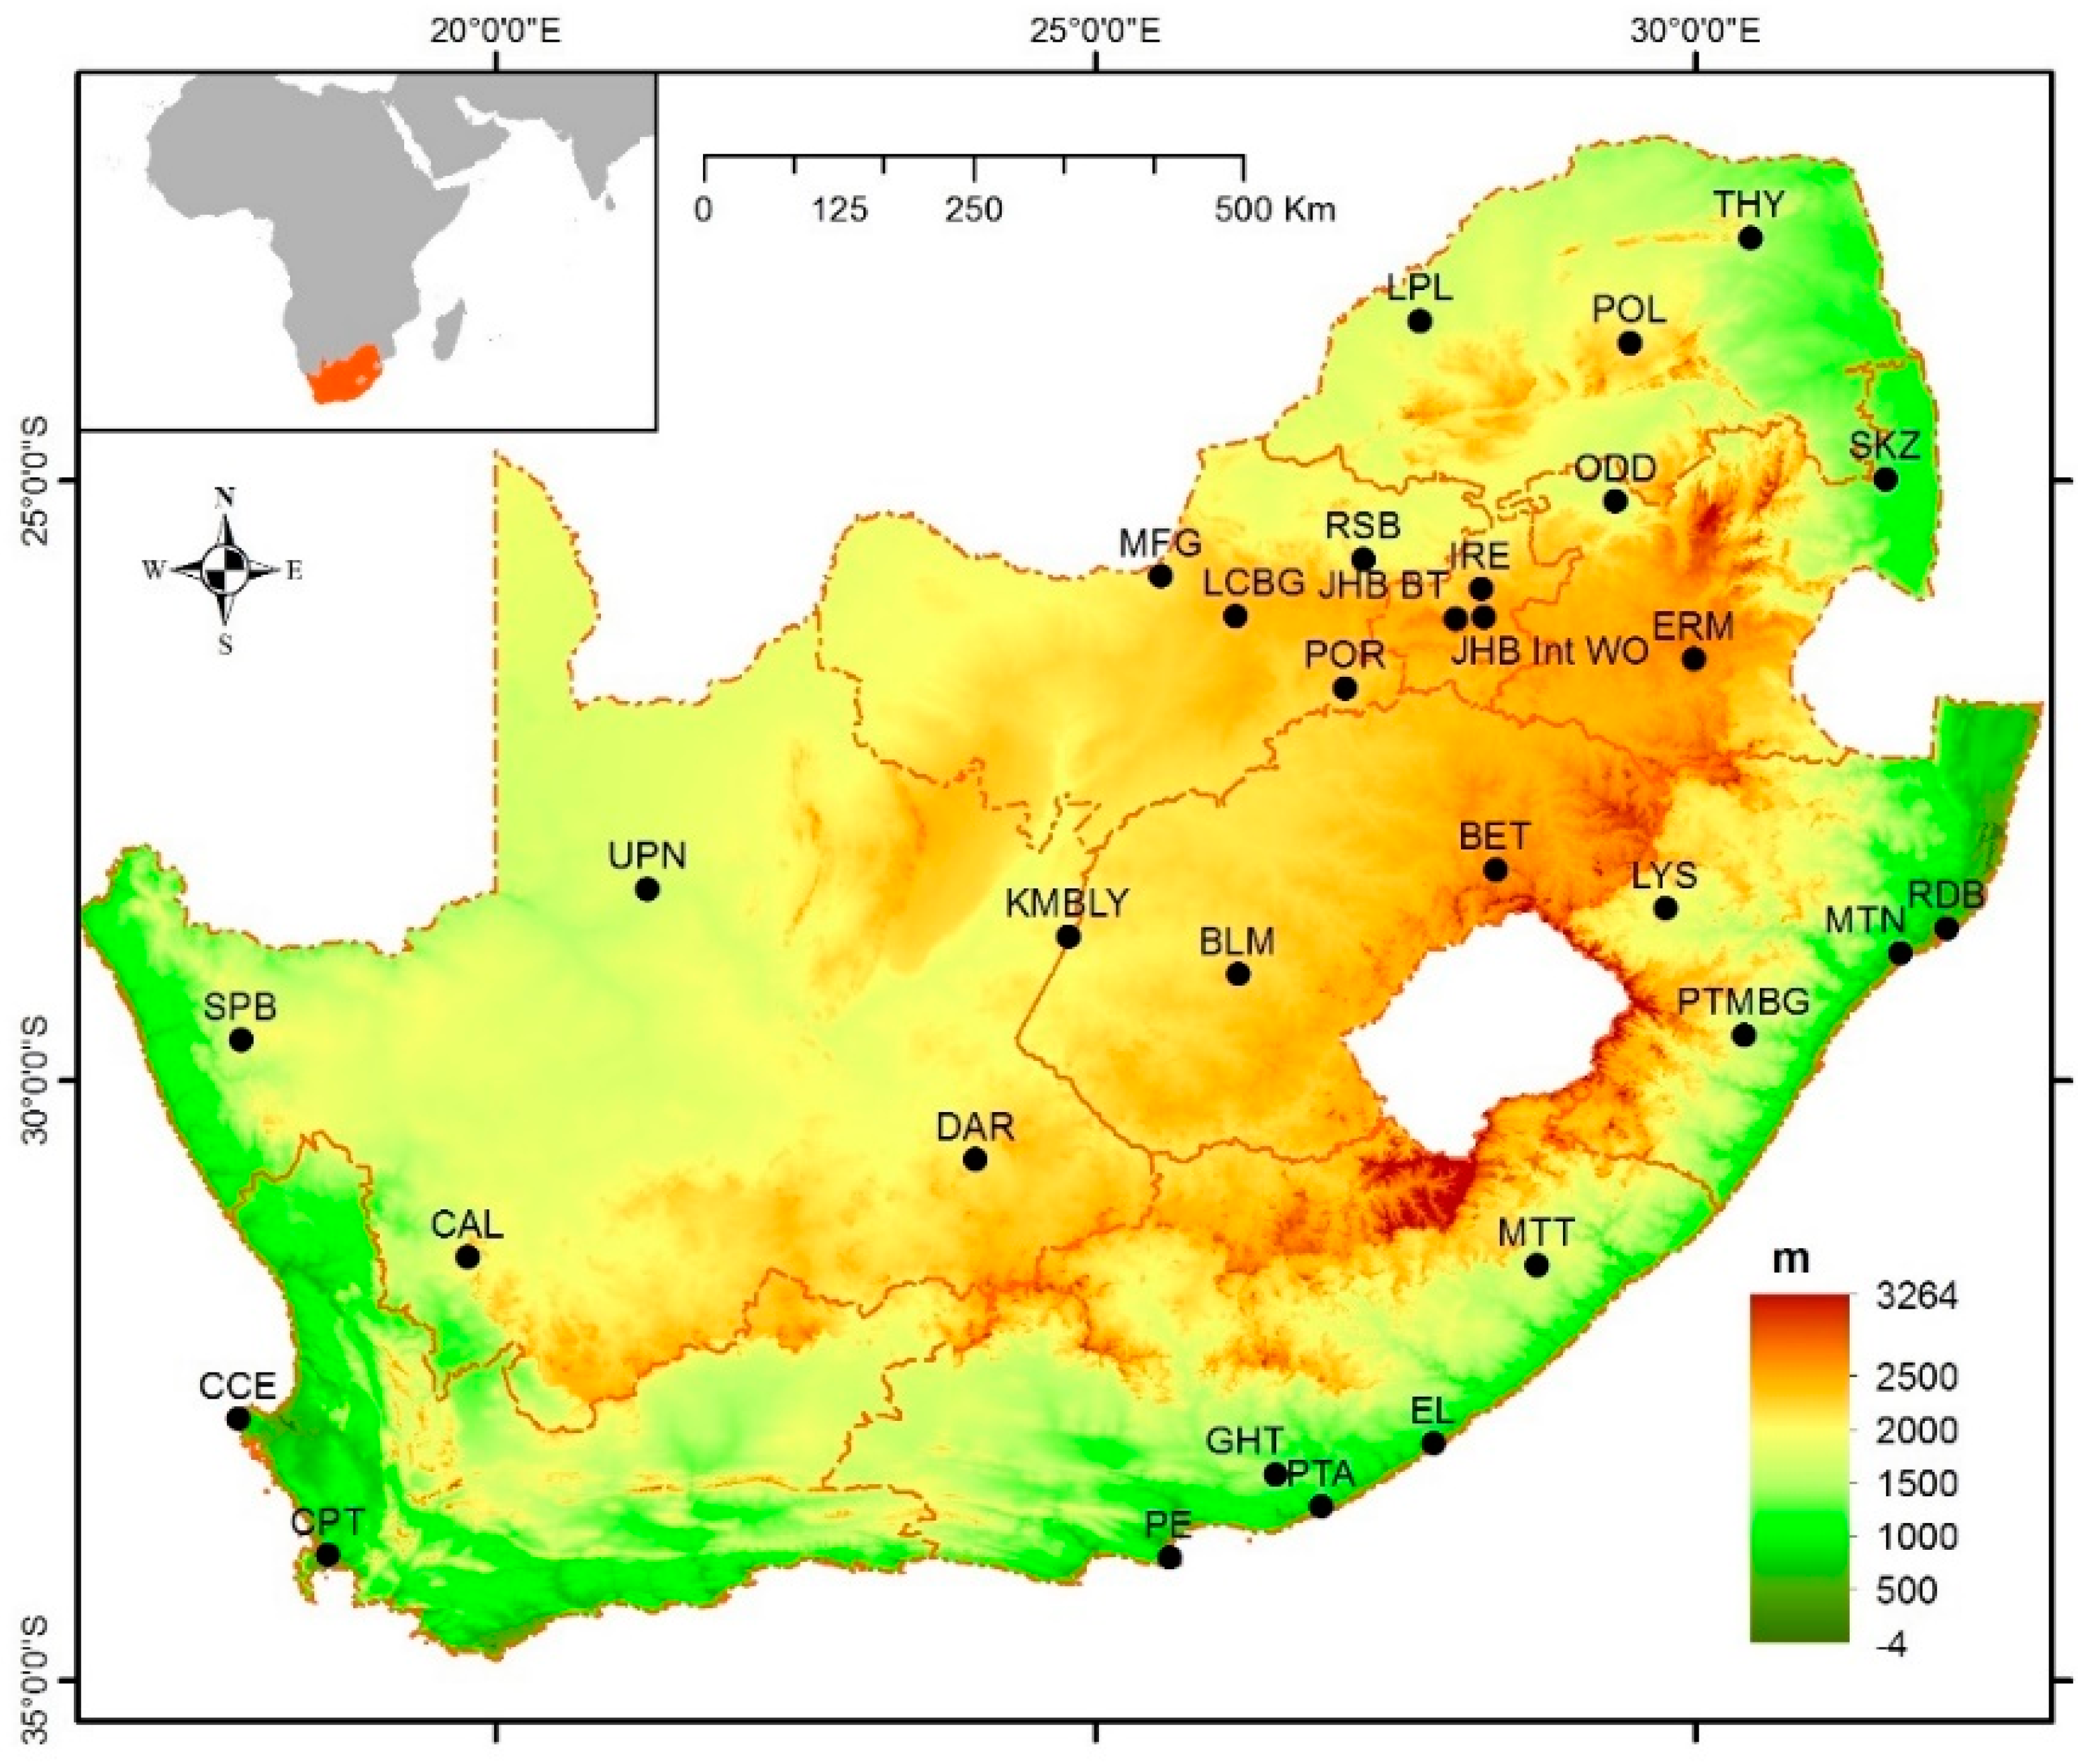
2.1. Study Area and Data Collection
2.2. Data Collection
2.3. Standard Precipitation Index (SPI)
2.4. Drought Analysis
2.4.1. Drought Trend and Characteristics
2.4.2. Drought Impact on the Agricultural Sector
2.4.3. Correlation Analysis between Crop Yields and Agricultural Drought Indices
3. Results
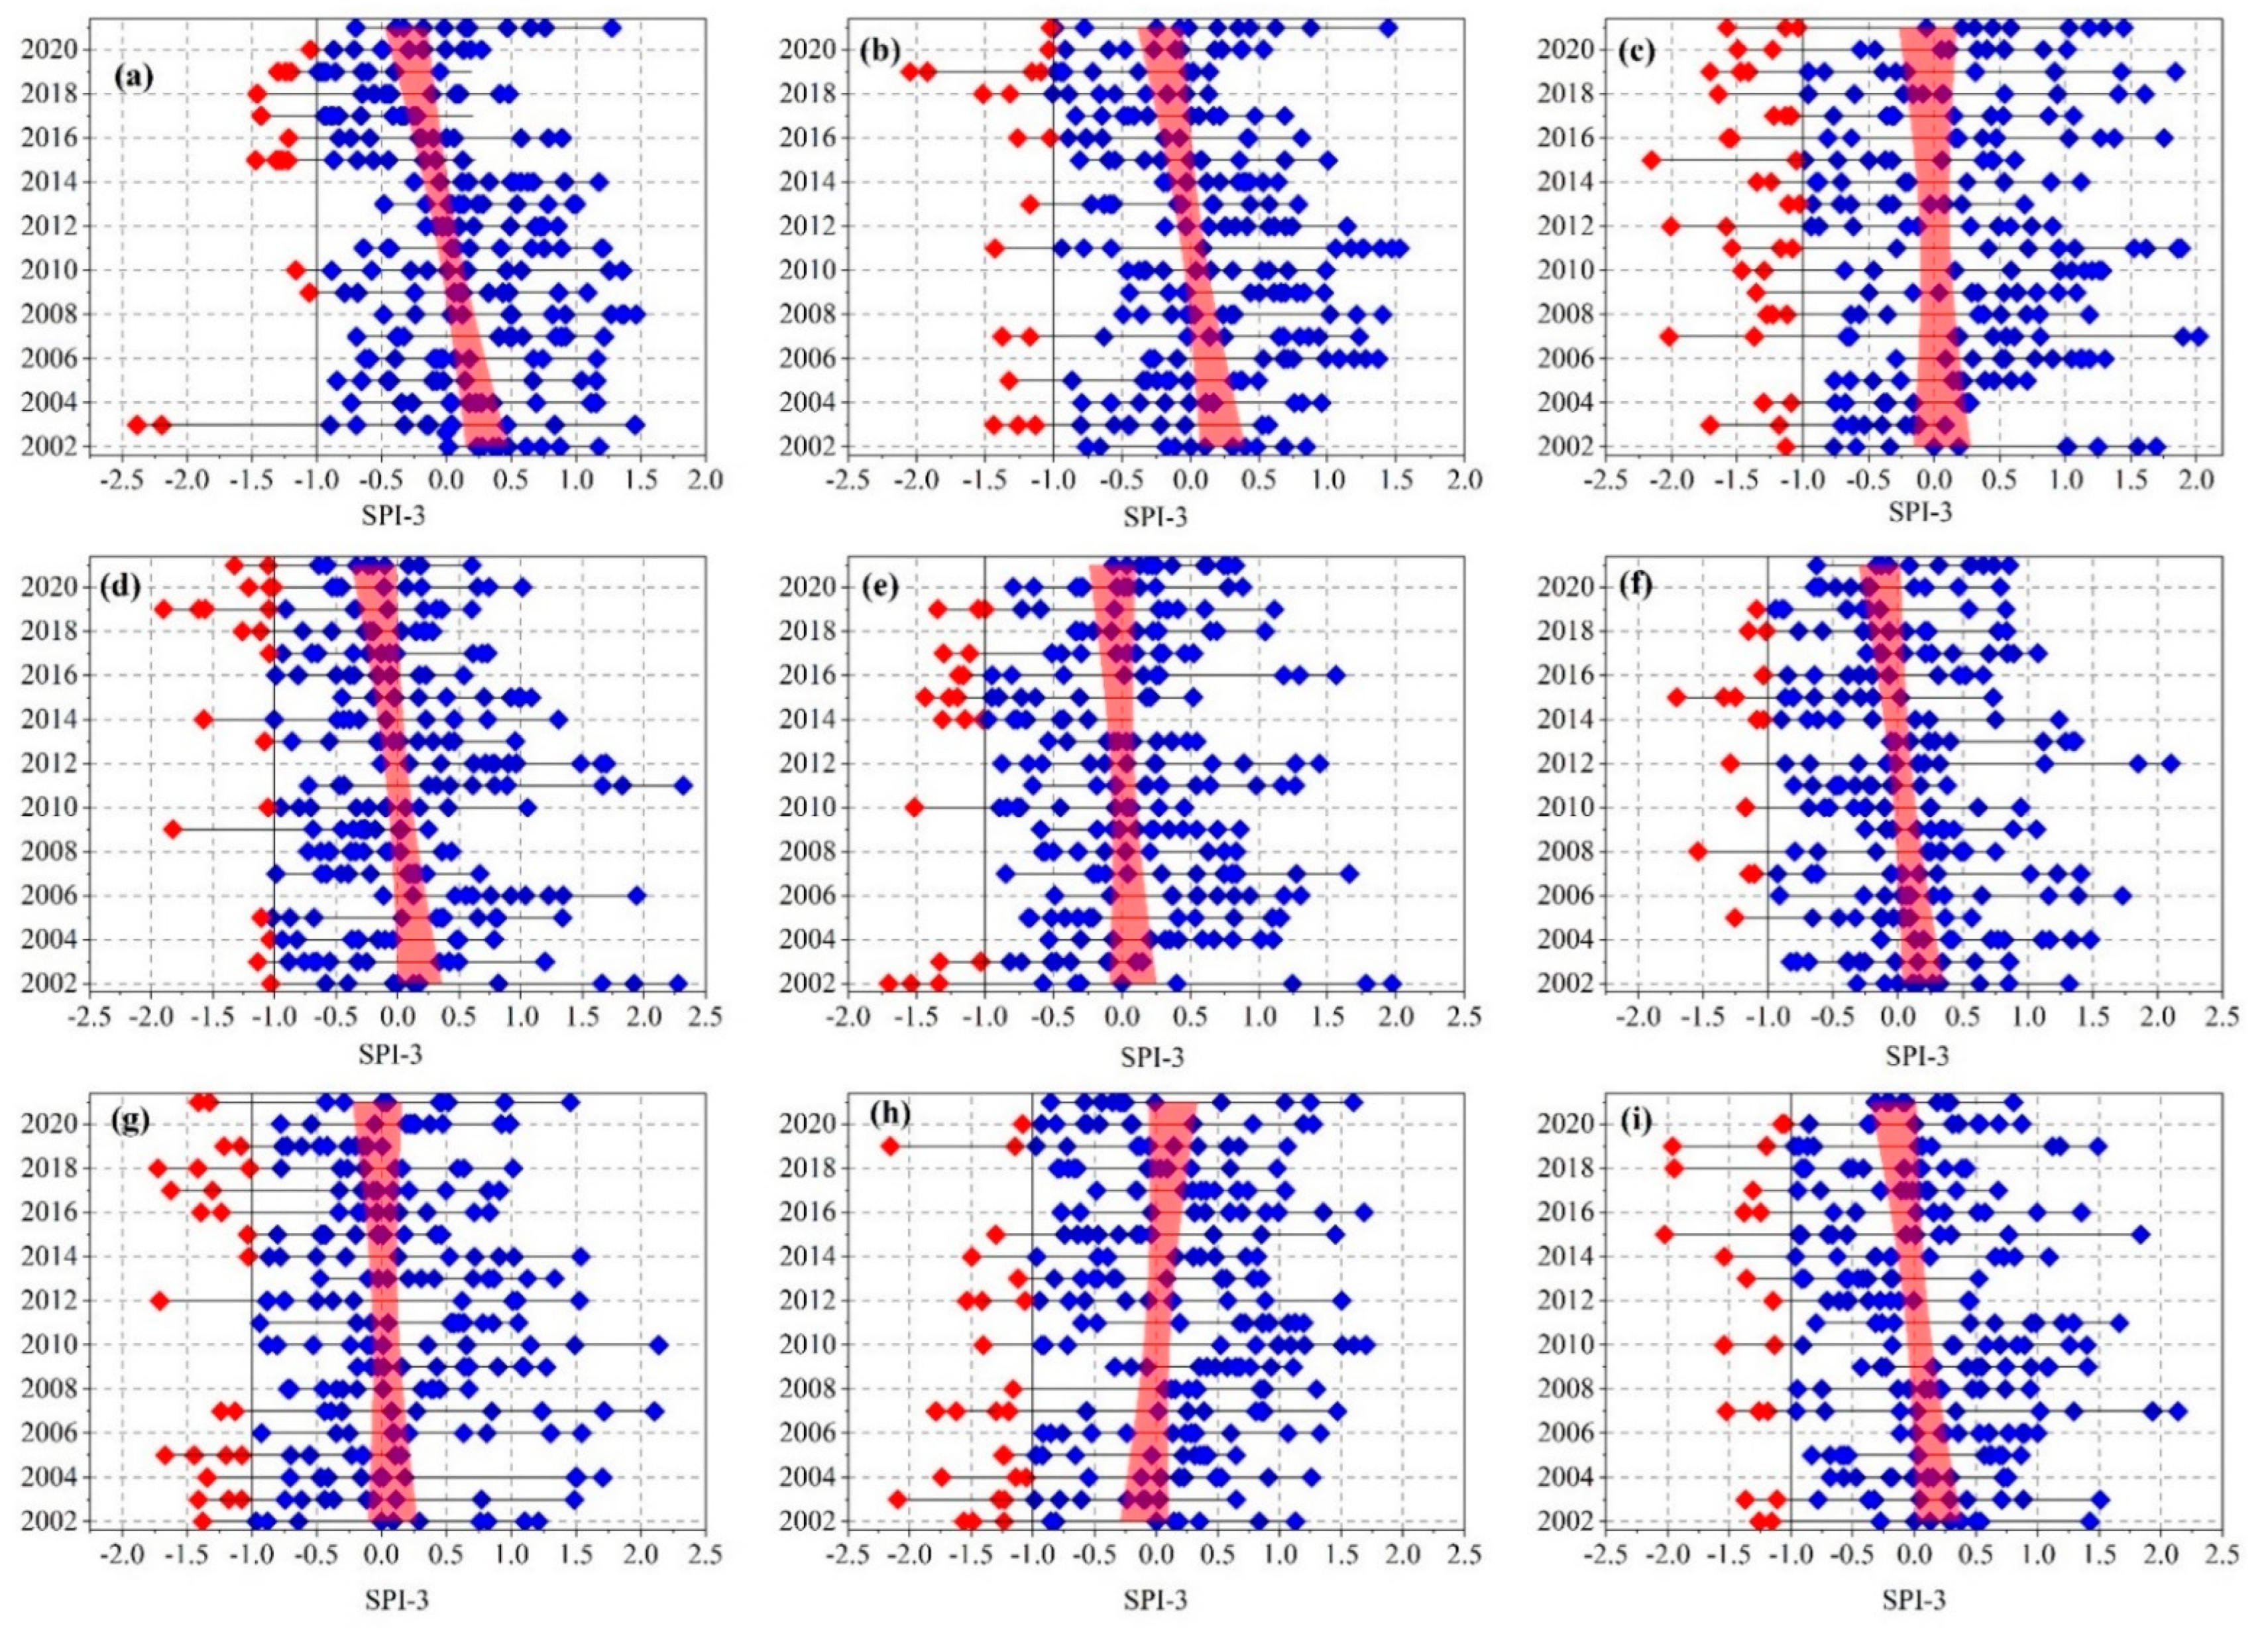
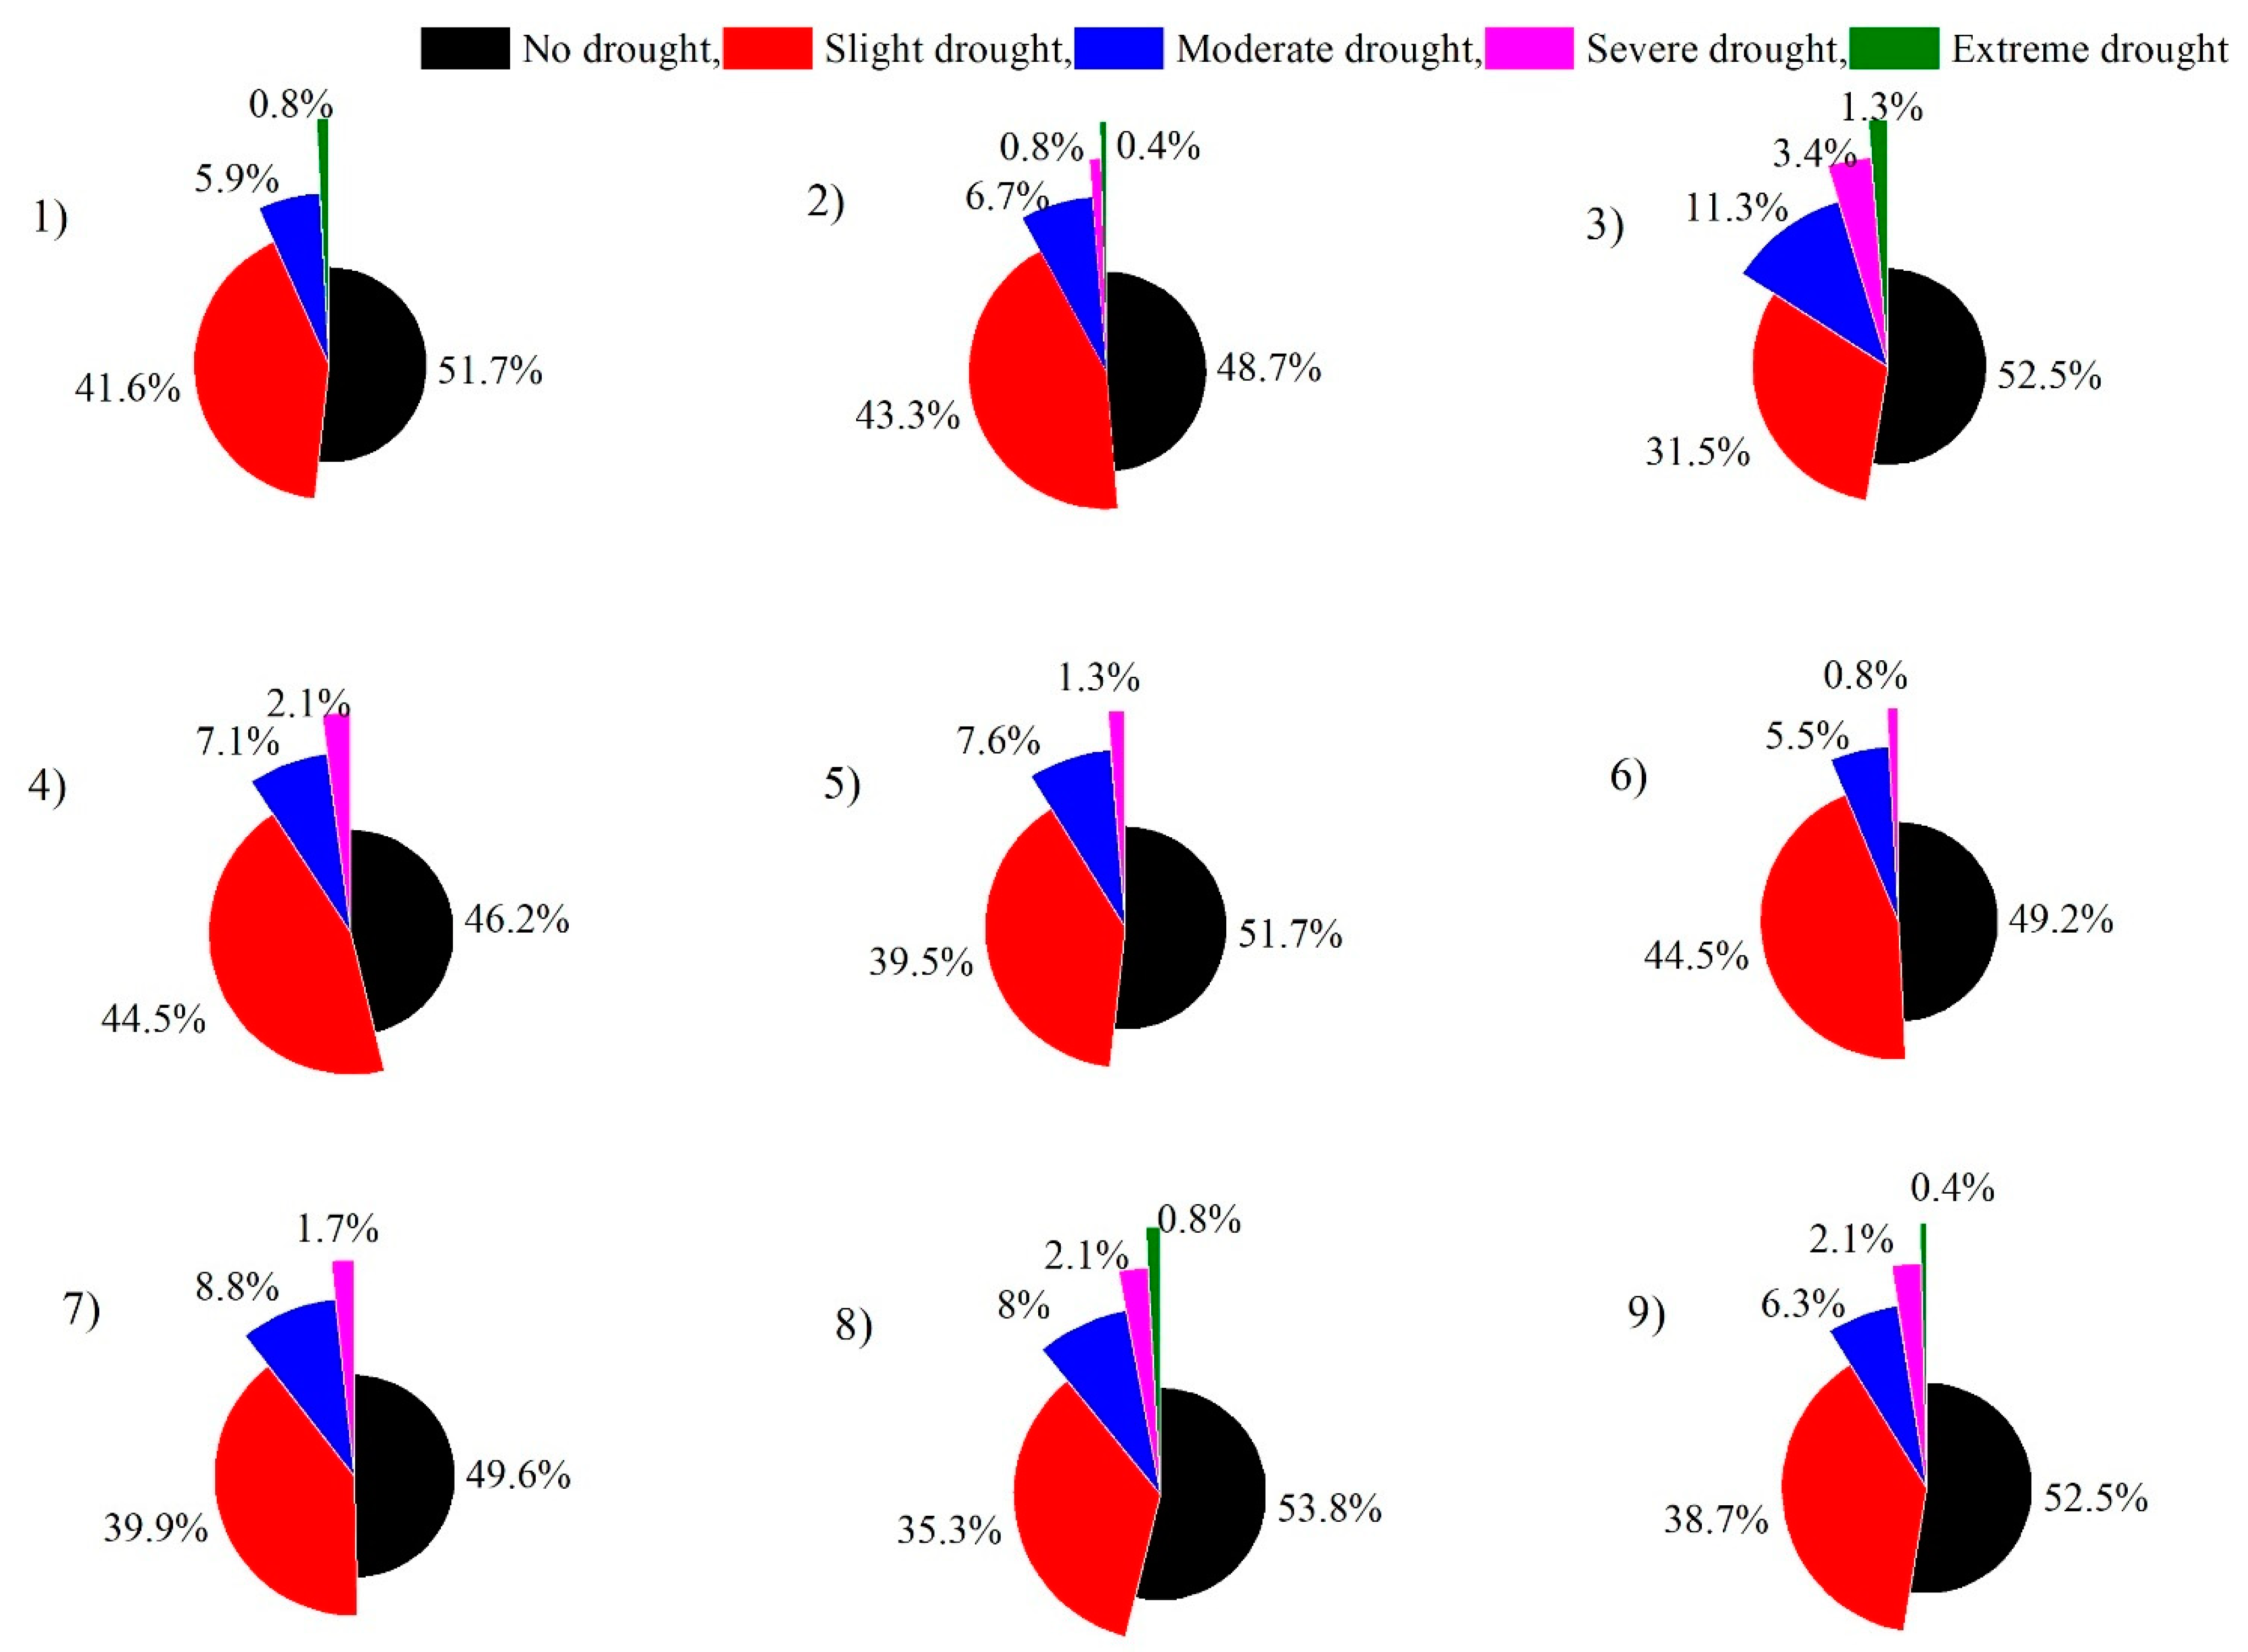
3.1. SPI Trend and Frequency on Regional and Provincial Scales
3.2. Impact of Drought on Wheat Production (SYRS)
3.3. Correlation between SYRS and SPI-3 on a Monthly Time Scale
3.4. Drought Resilience (CR) of Wheat on a Regional Scale
4. Discussion
4.1. Current and Future Drought across South Africa
4.2. Drought Impacts on Wheat and Its Resilience
4.3. Strategies for Drought Mitigation in South Africa and Future Steps
4.4. Limitations of Study
5. Conclusions
- The frequency of drought events revealed that ES-C experienced the highest percentage of drought, i.e., 53.7%, followed by NR-C, MP, and LPP provinces of the region.
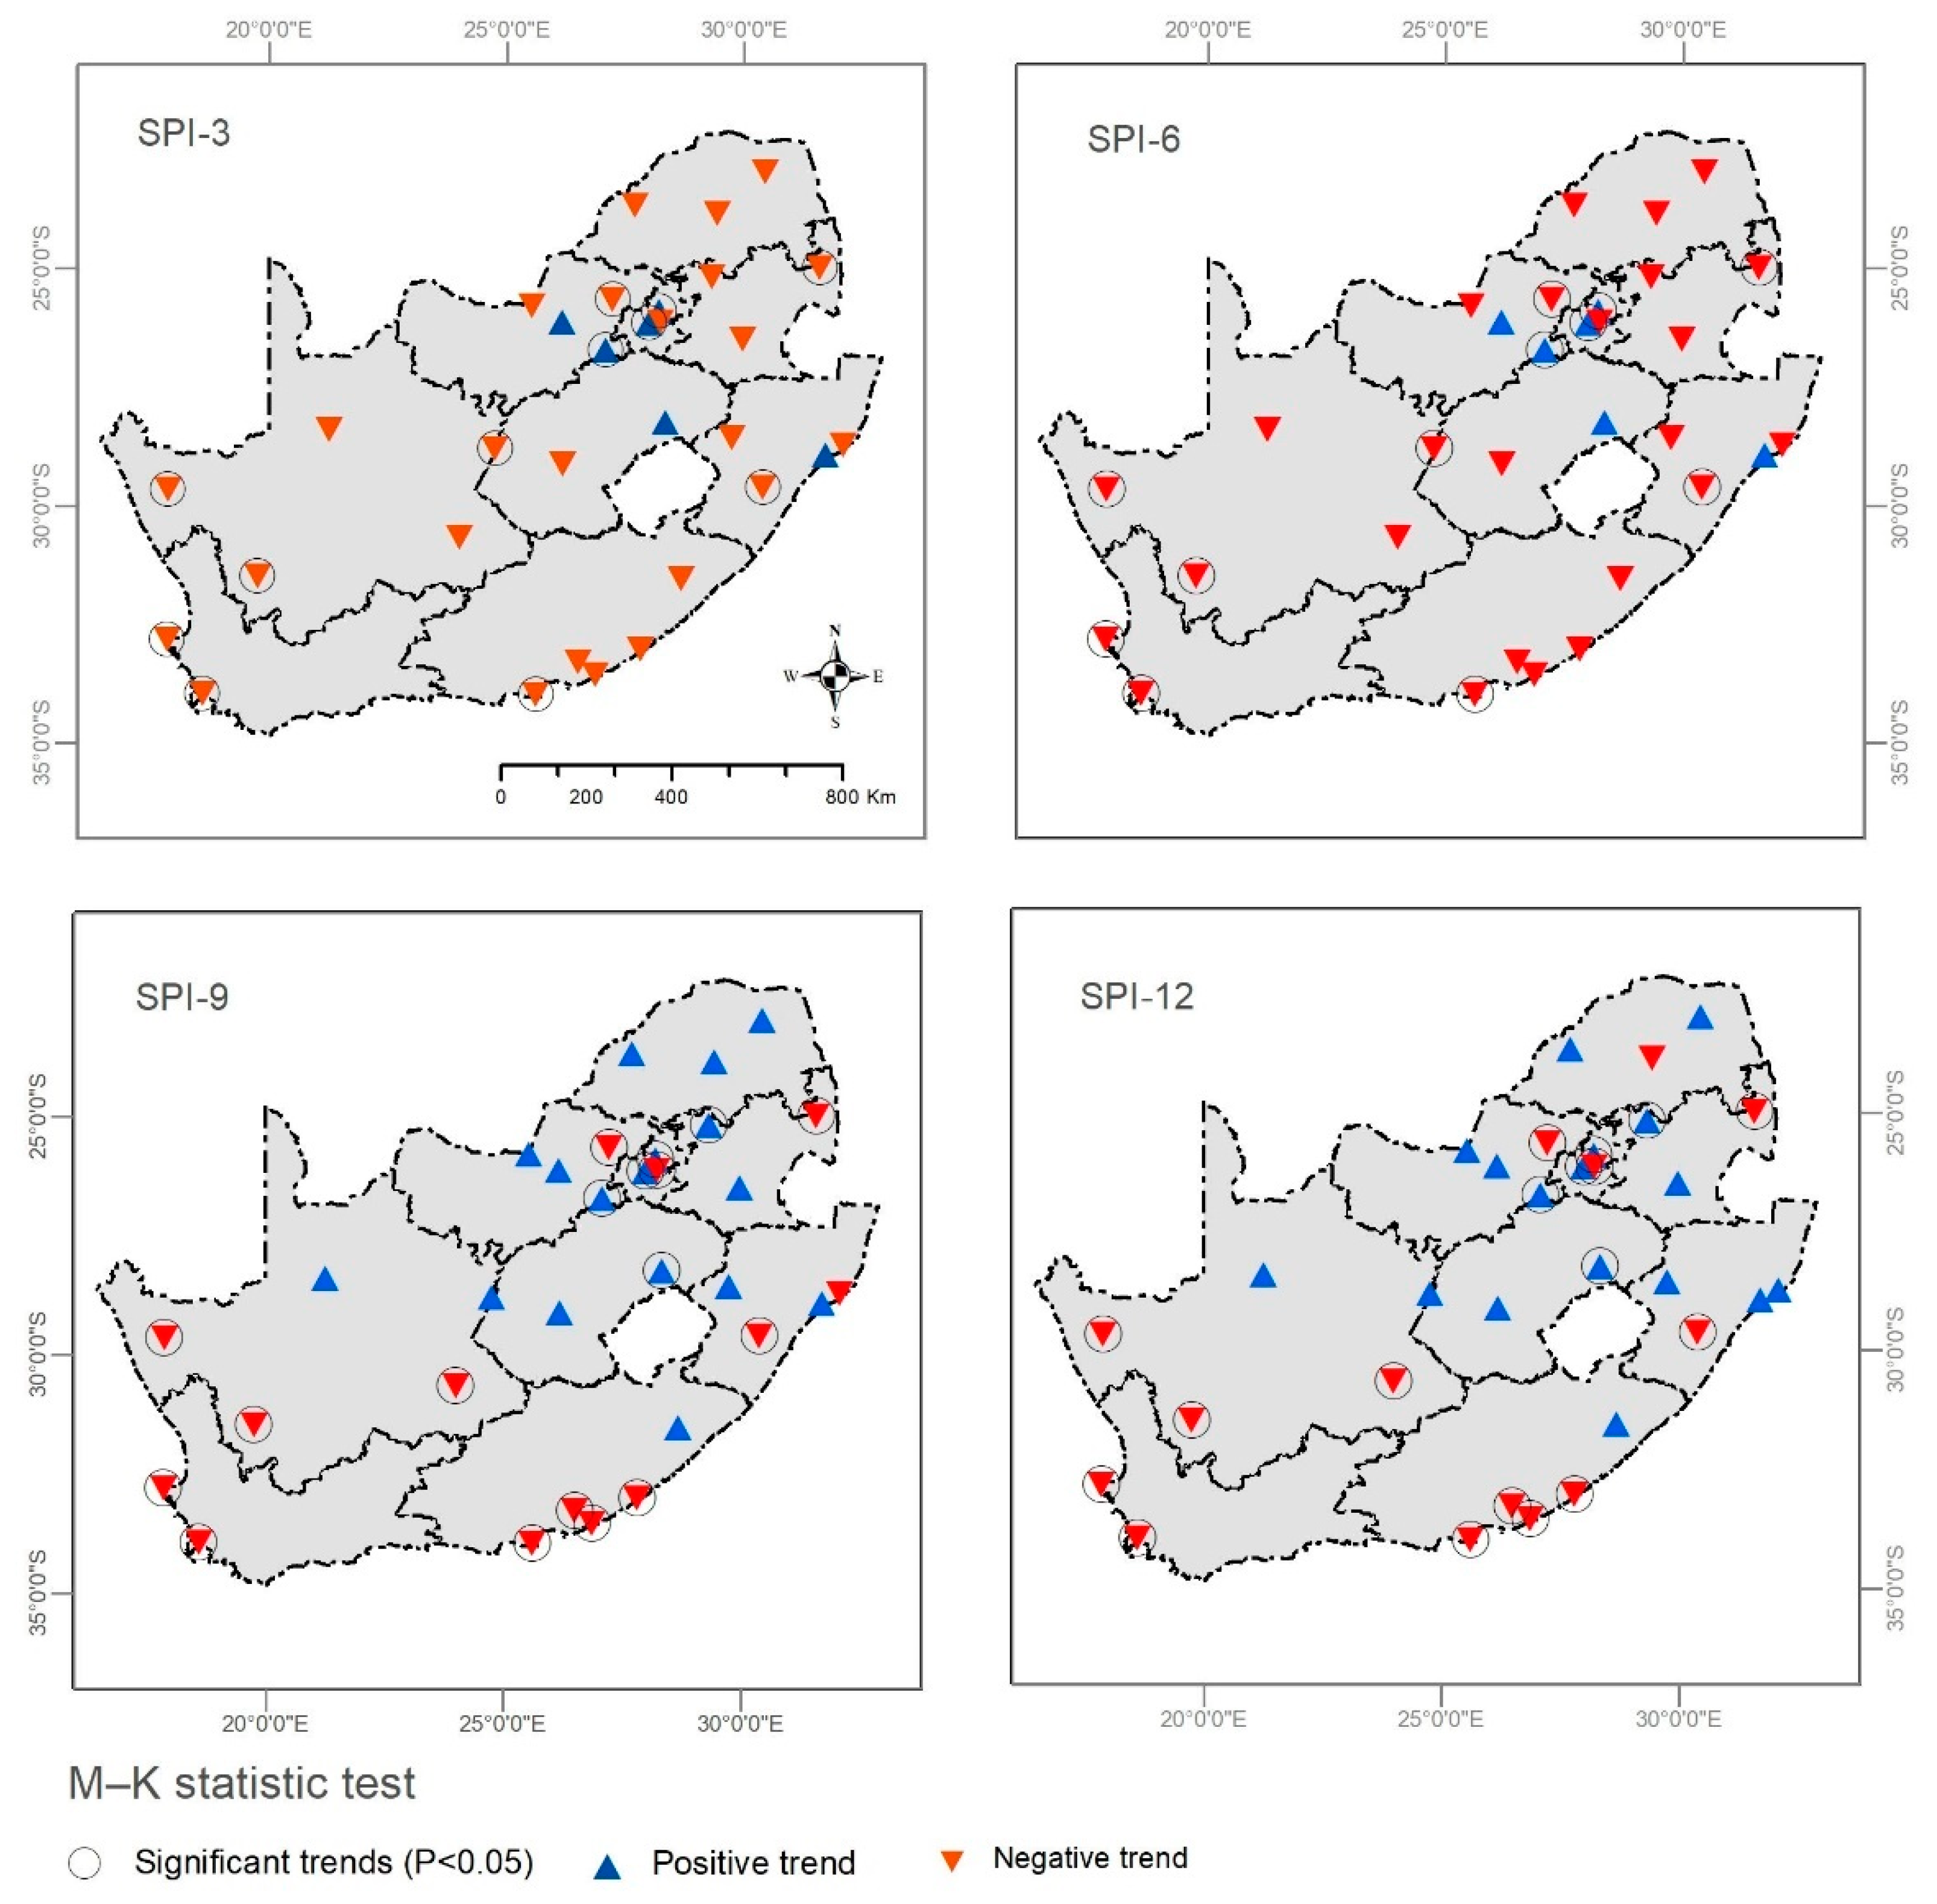
- SPI-3 trend analysis reveals a significant negative trend across many provinces in the region. Specifically, the western coastal provinces WES-C and NR-C have been more vulnerable to meteorological droughts over the past 20 years.
- Wheat yield loss analysis reveals that the highest SYRS = −2.52 was found in FS in 2019, followed by −2.37 in MP in 2003, −1.95 in NW in 2006, and −1.899 in GG and ES-C in 2003 and 2014, respectively. The most dreadful drought impacts on wheat yield were observed in the years 2015–2016, when all provinces experienced significant yield losses.
- Positive correlation results between the SYRS and wheat yield indicate that the WES-C province was highly influenced by drought during all stages of wheat growth, i.e., Apr–Nov. Historical drought spells in 2003, 2009, and 2010 and a low CR = 0.64 caused the province to be highly impacted by the negative impacts of droughts on yield loss.
- Some provinces in the region, including FS, ES-C, and KZN, were not found to be highly impacted by droughts, with negative correlations between the SYRS and SPI-3 during the wheat growth cycle from Apr to Nov.
- The WES-C and FS provinces of the region experienced the highest yield loss % during the SP-GP-HP of wheat growth stages with a CR of 0.65, indicating extremely low resilience. Overall, the growing period of wheat was found to be the most associated with yield loss, followed by the harvesting and sowing periods. Yield loss in the WES-C province is linked to the whole growing cycle in all months of wheat growth (Apr–Nov).
Author Contributions
Funding
Institutional Review Board Statement
Informed Consent Statement
Data Availability Statement
Acknowledgments
Conflicts of Interest
References
- Houghton, J.T.; Ding, Y.; Griggs, D.J.; Noguer, M.; van der Linden, P.J.; Dai, X.; Maskell, K.; Johnson, C. Climate Change 2001: The Scientific Basis: Contribution of Working Group I to the Third Assessment Report of the Intergovernmental Panel on Climate Change; Cambridge University Press: Cambridge, UK, 2001. [Google Scholar]
- Pörtner, H.-O.; Roberts, D.C.; Adams, H.; Adler, C.; Aldunce, P.; Ali, E.; Begum, R.A.; Betts, R.; Kerr, R.B.; Biesbroek, R. Climate change 2022: Impacts, adaptation and vulnerability. In IPCC Sixth Assessment Report; IPCC: Geneva, Switzerland, 2022. [Google Scholar]
- Zhongming, Z.; Linong, L.; Xiaona, Y.; Wangqiang, Z.; Wei, L. AR6 Climate Change 2021: The Physical Science Basis; IPCC: Geneva, Switzerland, 2021. [Google Scholar]
- Prentice, I.C.; Farquhar, G.; Fasham, M.; Goulden, M.L.; Heimann, M.; Jaramillo, V.; Kheshgi, H.; Le Quéré, C.; Scholes, R.J.; Wallace, D.W. The carbon cycle and atmospheric carbon dioxide. In Climate Change 2001: The Scientific Basis, Intergovernmental Panel on Climate Change; IPCC: Geneva, Switzerland, 2001. [Google Scholar]
- Gillett, N.P.; Graf, H.F.; Osborn, T.J. Climate change and the North Atlantic oscillation. Geophys. Monogr.-Am. Geophys. Union 2003, 134, 193–210. [Google Scholar]
- Kogan, F.N. Global drought watch from space. Bull. Am. Meteorol. Soc. 1997, 78, 621–636. [Google Scholar] [CrossRef]
- Kogan, F.; Guo, W.; Yang, W. Drought and food security prediction from NOAA new generation of operational satellites. Geomat. Nat. Hazards Risk 2019, 10, 651–666. [Google Scholar] [CrossRef]
- Alsafadi, K.; Mohammed, S.; Ayugi, B.; Sharaf, M.; Harsányi, E. Spatial–temporal evolution of drought characteristics over Hungary between 1961 and 2010. Pure Appl. Geophys. 2020, 177, 3961–3978. [Google Scholar] [CrossRef]
- Mekonen, A.A.; Berlie, A.B.; Ferede, M.B. Spatial and temporal drought incidence analysis in the northeastern highlands of Ethiopia. Geoenviron. Disasters 2020, 7, 10. [Google Scholar] [CrossRef]
- Zhao, L.; Lyu, A.; Wu, J.; Hayes, M.; Tang, Z.; He, B.; Liu, J.; Liu, M. Impact of meteorological drought on streamflow drought in Jinghe River Basin of China. Chin. Geogr. Sci. 2014, 24, 694–705. [Google Scholar] [CrossRef]
- Mckee, T.; Doesken, N.; Kleist, J. The relationship of drought frequency and duration to time scales. Appl. Climatol. 1993, 17, 179–183. [Google Scholar]
- Tsakiris, G.; Pangalou, D.; Vangelis, H. Regional Drought Assessment Based on the Reconnaissance Drought Index (RDI). Water Resour. Manag. 2007, 21, 821–833. [Google Scholar] [CrossRef]
- Vicente-Serrano, S.M.; Beguería, S.; López-Moreno, J.I. A Multiscalar Drought Index Sensitive to Global Warming: The Standardized Precipitation Evapotranspiration Index. J. Clim. 2010, 23, 1696–1718. [Google Scholar] [CrossRef]
- Alley, W.M. The palmer drought severity index as a measure of hydrologic drought. J. Am. Water Resour. Assoc. 1985, 21, 105–114. [Google Scholar] [CrossRef]
- Palmer, W.C. Keeping Track of Crop Moisture Conditions, Nationwide: The New Crop Moisture Index. Weatherwise 1968, 21, 156–161. [Google Scholar] [CrossRef]
- Vicente-Serrano, S.M.; Beguería, S.; Lorenzo-Lacruz, J.; Camarero, J.J.; López-Moreno, J.I.; Azorin-Molina, C.; Revuelto, J.; Morán-Tejeda, E.; Sanchez-Lorenzo, A. Performance of Drought Indices for Ecological, Agricultural, and Hydrological Applications. Earth Interact. 2012, 16, 1–27. [Google Scholar] [CrossRef]
- Du, J.; Fang, J.; Xu, W.; Shi, P. Analysis of dry/wet conditions using the standardized precipitation index and its potential usefulness for drought/flood monitoring in Hunan Province, China. Stoch. Environ. Res. Risk Assess. 2013, 27, 377–387. [Google Scholar] [CrossRef]
- Xu, X.; Gao, P.; Zhu, X.; Guo, W.; Ding, J.; Li, C. Estimating the responses of winter wheat yields to moisture variations in the past 35 years in Jiangsu Province of China. PLoS ONE 2018, 13, e0191217. [Google Scholar] [CrossRef] [PubMed]
- Mohammed, S.; Alsafadi, K.; Al-Awadhi, T.; Sherief, Y.; Harsanyie, E.; El Kenawy, A.M. Space and time variability of meteorological drought in Syria. Acta Geophys. 2020, 68, 1877–1898. [Google Scholar] [CrossRef]
- Asadi Zarch, M.A.; Sivakumar, B.; Sharma, A. Droughts in a warming climate: A global assessment of Standardized precipitation index (SPI) and Reconnaissance drought index (RDI). J. Hydrol. 2015, 526, 183–195. [Google Scholar] [CrossRef]
- Tirivarombo, S.; Osupile, D.; Eliasson, P. Drought monitoring and analysis: Standardised Precipitation Evapotranspiration Index (SPEI) and Standardised Precipitation Index (SPI). Phys. Chem. Earth Parts A/B/C 2018, 106, 1–10. [Google Scholar] [CrossRef]
- Blain, G.C. Revisiting the probabilistic definition of drought: Strengths, limitations and an agrometeorological adaptation. Bragantia 2012, 71, 132–141. [Google Scholar] [CrossRef]
- Okpara, J.N.; Afiesimama, E.A.; Anuforom, A.C.; Owino, A.; Ogunjobi, K.O. The applicability of Standardized Precipitation Index: Drought characterization for early warning system and weather index insurance in West Africa. Nat. Hazards 2017, 89, 555–583. [Google Scholar] [CrossRef]
- Guttman, N.B. Accepting the standardized precipitation index: A calculation algorithm 1. J. Am. Water Resour. Assoc. 1999, 35, 311–322. [Google Scholar] [CrossRef]
- Yerdelen, C.; Abdelkader, M.; Eris, E. Assessment of drought in SPI series using continuous wavelet analysis for Gediz Basin, Turkey. Atmos. Res. 2021, 260, 105687. [Google Scholar] [CrossRef]
- Jordaan, A.J.; Mlenga, D.H.; Mandebvu, B. Monitoring droughts in Eswatini: A spatiotemporal variability analysis using the Standard Precipitation Index. Jàmbá J. Disaster Risk Stud. 2019, 11, 1–11. [Google Scholar]
- Guenang, G.M.; Kamga, F.M. Computation of the standardized precipitation index (SPI) and its use to assess drought occurrences in Cameroon over recent decades. J. Appl. Meteorol. Climatol. 2014, 53, 2310–2324. [Google Scholar] [CrossRef]
- Harsányi, E.; Bashir, B.; Alsilibe, F.; Alsafadi, K.; Alsalman, A.; Széles, A.; Rahman, M.H.u.; Bácskai, I.; Juhász, C.; Ratonyi, T. Impact of agricultural drought on sunflower production across Hungary. Atmosphere 2021, 12, 1339. [Google Scholar] [CrossRef]
- Jiang, R.; Xie, J.; He, H.; Luo, J.; Zhu, J. Use of four drought indices for evaluating drought characteristics under climate change in Shaanxi, China: 1951–2012. Nat. Hazards 2015, 75, 2885–2903. [Google Scholar] [CrossRef]
- Araneda-Cabrera, R.J.; Bermúdez, M.; Puertas, J. Assessment of the performance of drought indices for explaining crop yield variability at the national scale: Methodological framework and application to Mozambique. Agric. Water Manag. 2021, 246, 106692. [Google Scholar] [CrossRef]
- WMO. State of the Climate in Africa. Available online: https://public.wmo.int/en/our-mandate/climate/wmo-statement-state-of-global-climate/Africa (accessed on 25 March 2022).
- Kurukulasuriya, P.; Mendelsohn, R.; Hassan, R.; Benhin, J.; Deressa, T.; Diop, M.; Eid, H.M.; Fosu, K.Y.; Gbetibouo, G.; Jain, S. Will African agriculture survive climate change? World Bank Econ. Rev. 2006, 20, 367–388. [Google Scholar] [CrossRef]
- Afshar, M.H.; Bulut, B.; Duzenli, E.; Amjad, M.; Yilmaz, M.T. Global spatiotemporal consistency between meteorological and soil moisture drought indices. Agric. For. Meteorol. 2022, 316, 108848. [Google Scholar] [CrossRef]
- Turco, M.; Jerez, S.; Donat, M.G.; Toreti, A.; Vicente-Serrano, S.M.; Doblas-Reyes, F.J. A Global Probabilistic Dataset for Monitoring Meteorological Droughts. Bull. Am. Meteorol. Soc. 2020, 101, E1628–E1644. [Google Scholar] [CrossRef]
- Sánchez, N.; González-Zamora, Á.; Martínez-Fernández, J.; Piles, M.; Pablos, M. Integrated remote sensing approach to global agricultural drought monitoring. Agric. For. Meteorol. 2018, 259, 141–153. [Google Scholar] [CrossRef]
- Ayugi, B.; Eresanya, E.O.; Onyango, A.O.; Ogou, F.K.; Okoro, E.C.; Okoye, C.O.; Anoruo, C.M.; Dike, V.N.; Ashiru, O.R.; Daramola, M.T. Review of meteorological drought in Africa: Historical trends, impacts, mitigation measures, and prospects. Pure Appl. Geophys. 2022, 179, 1365–1386. [Google Scholar] [CrossRef] [PubMed]
- Ngcamu, B.S.; Chari, F. Drought influences on food insecurity in Africa: A Systematic literature review. Int. J. Environ. Res. Public Health 2020, 17, 5897. [Google Scholar] [CrossRef] [PubMed]
- Abebe, S.; Solomon, A.; Suryabhagavan, K.V. Mapping the spatial and temporal variation of agricultural and meteorological drought using geospatial techniques, Ethiopia. Environ. Syst. Res. 2021, 10, 15. [Google Scholar] [CrossRef]
- Chikabvumbwa, S.R.; Salehnia, N.; Manzanas, R.; Abdelbaki, C.; Zerga, A. Assessing the effect of spatial–temporal droughts on dominant crop yield changes in Central Malawi. Environ. Monit. Assess. 2022, 194, 63. [Google Scholar] [CrossRef]
- Temam, D.; Uddameri, V.; Mohammadi, G.; Hernandez, E.A.; Ekwaro-Osire, S. Long-Term Drought Trends in Ethiopia with Implications for Dryland Agriculture. Water 2019, 11, 2571. [Google Scholar] [CrossRef]
- Kamali, B.; Abbaspour, K.C.; Wehrli, B.; Yang, H. Drought vulnerability assessment of maize in Sub-Saharan Africa: Insights from physical and social perspectives. Glob. Planet. Chang. 2018, 162, 266–274. [Google Scholar] [CrossRef]
- Ziervogel, G.; New, M.; Archer van Garderen, E.; Midgley, G.; Taylor, A.; Hamann, R.; Stuart-Hill, S.; Myers, J.; Warburton, M. Climate change impacts and adaptation in South Africa. Wiley Interdiscip. Rev. Clim. Chang. 2014, 5, 605–620. [Google Scholar] [CrossRef]
- Olorunfemi, F. Managing flood disasters under a changing climate: Lessons from Nigeria and South Africa. In NISER Research Seminar Series; NISER: Ibadan, Nigeria, 2011; pp. 1–44. [Google Scholar]
- Nesamvuni, E.; Lekalakala, R.; Norris, D.; Ngambi, J. Effects of climate change on dairy cattle, South Africa. Afr. J. Agric. Res. 2012, 7, 3867–3872. [Google Scholar] [CrossRef]
- Calzadilla, A.; Zhu, T.; Rehdanz, K.; Tol, R.S.; Ringler, C. Climate change and agriculture: Impacts and adaptation options in South Africa. Water Resour. Econ. 2014, 5, 24–48. [Google Scholar] [CrossRef]
- Wright, C.Y.; Kapwata, T.; Du Preez, D.J.; Wernecke, B.; Garland, R.M.; Nkosi, V.; Landman, W.A.; Dyson, L.; Norval, M. Major climate change-induced risks to human health in South Africa. Environ. Res. 2021, 196, 110973. [Google Scholar] [CrossRef]
- Shew, A.M.; Tack, J.B.; Nalley, L.L.; Chaminuka, P. Yield reduction under climate warming varies among wheat cultivars in South Africa. Nat. Commun. 2020, 11, 4408. [Google Scholar] [CrossRef] [PubMed]
- Otto, F.E.; Wolski, P.; Lehner, F.; Tebaldi, C.; Van Oldenborgh, G.J.; Hogesteeger, S.; Singh, R.; Holden, P.; Fučkar, N.S.; Odoulami, R.C. Anthropogenic influence on the drivers of the Western Cape drought 2015–2017. Environ. Res. Lett. 2018, 13, 124010. [Google Scholar] [CrossRef]
- Cullis, J.; Alton, T.; Arndt, C.; Cartwright, A.; Chang, A.; Gabriel, S.; Gebretsadik, Y.; Hartley, F.; de Jager, G.; Makrelov, K. An Uncertainty Approach to Modelling Climate Change Risk in South Africa; 929230934X; WIDER Working Paper: Helsinki, Finland, 2015. [Google Scholar]
- Meza, I.; Rezaei, E.E.; Siebert, S.; Ghazaryan, G.; Nouri, H.; Dubovyk, O.; Gerdener, H.; Herbert, C.; Kusche, J.; Popat, E. Drought risk for agricultural systems in South Africa: Drivers, spatial patterns, and implications for drought risk management. Sci. Total Environ. 2021, 799, 149505. [Google Scholar] [CrossRef] [PubMed]
- Mpandeli, S.; Nhamo, L.; Moeletsi, M.; Masupha, T.; Magidi, J.; Tshikolomo, K.; Liphadzi, S.; Naidoo, D.; Mabhaudhi, T. Assessing climate change and adaptive capacity at local scale using observed and remotely sensed data. Weather. Clim. Extrem. 2019, 26, 100240. [Google Scholar] [CrossRef]
- Lottering, S.J.; Mafongoya, P.; Lottering, R. The impacts of drought and the adaptive strategies of small-scale farmers in uMsinga, KwaZulu-Natal, South Africa. J. Asian Afr. Stud. 2021, 56, 267–289. [Google Scholar] [CrossRef]
- Dube, E.; Tsilo, T.J.; Sosibo, N.Z.; Fanadzo, M. Irrigation wheat production constraints and opportunities in South Africa. South Afr. J. Sci. 2020, 116, 1–6. [Google Scholar] [CrossRef]
- Conway, D.; van Garderen, E.A.; Deryng, D.; Dorling, S.; Krueger, T.; Landman, W.; Lankford, B.; Lebek, K.; Osborn, T.; Ringler, C.; et al. Climate and southern Africa’s water–energy–food nexus. Nat. Clim. Chang. 2015, 5, 837–846. [Google Scholar] [CrossRef]
- Kganvago, M.; Mukhawana, M.B.; Mashalane, M.; Mgabisa, A.; Moloele, S. Recent Trends of Drought Using Remotely Sensed and In-Situ Indices: Towards an Integrated Drought Monitoring System for South Africa. In Proceedings of the 2021 IEEE International Geoscience and Remote Sensing Symposium IGARSS, Brussels, Belgium, 11–16 July 2021; pp. 6225–6228. [Google Scholar]
- Theron, S.; Archer, E.; Midgley, S.; Walker, S. Agricultural perspectives on the 2015–2018 western cape drought, South Africa: Characteristics and spatial variability in the core wheat growing regions. Agric. For. Meteorol. 2021, 304, 108405. [Google Scholar] [CrossRef]
- Knight, J.; Rogerson, C.M. The Geography of South Africa; Springer: Berlin/Heidelberg, Germany, 2019. [Google Scholar]
- Engelbrecht, C.J.; Landman, W.A.; Engelbrecht, F.A.; Malherbe, J. A synoptic decomposition of rainfall over the Cape south coast of South Africa. Clim. Dyn. 2015, 44, 2589–2607. [Google Scholar] [CrossRef]
- SAG. South Africa at a Glance. Available online: https://www.gov.za/about-sa/south-africa-glance#:~:text=Mining%2C%20transport%2C%20energy%2C%20manufacturing%2C%20tourism%20and%20agriculture (accessed on 25 April 2022).
- McBride, C.M.; Kruger, A.C.; Dyson, L. Changes in extreme daily rainfall characteristics in South Africa: 1921–2020. Weather. Clim. Extrem. 2022, 38, 100517. [Google Scholar] [CrossRef]
- Franch, B.; Cintas, J.; Becker-Reshef, I.; Sanchez-Torres, M.J.; Roger, J.; Skakun, S.; Sobrino, J.A.; Van Tricht, K.; Degerickx, J.; Gilliams, S.; et al. Global crop calendars of maize and wheat in the framework of the WorldCereal project. GISci. Remote Sens. 2022, 59, 885–913. [Google Scholar] [CrossRef]
- Tadesse, W.; Bishaw, Z.; Assefa, S. Wheat production and breeding in Sub-Saharan Africa: Challenges and opportunities in the face of climate change. Int. J. Clim. Chang. Strateg. Manag. 2018, 11, 696–715. [Google Scholar] [CrossRef]
- RSA. Production Guideline for Wheat; agriculture, forestry and fisheries; Republic of South Africa: Bloemfontein, South Africa, 2016.
- Crop Estimate Committee. Available online: https://www.sagis.org.za/cec_reports.html (accessed on 23 April 2022).
- Laddimath, R.S.; Patil, N.S.; Rao, P.; Nagendra, N. Assessing the impacts of climate change on drought-prone regions in Bhima sub-basin (India) using the Standard Precipitation Index. J. Water Clim. Chang. 2022, 13, 817–838. [Google Scholar] [CrossRef]
- Zuo, D.-D.; Hou, W.; Zhang, Q.; Yan, P.-C. Sensitivity analysis of standardized precipitation index to climate state selection in China. Adv. Clim. Chang. Res. 2022, 13, 42–50. [Google Scholar] [CrossRef]
- Lloyd-Hughes, B.; Saunders, M.A. A drought climatology for Europe. Int. J. Climatol. A J. R. Meteorol. Soc. 2002, 22, 1571–1592. [Google Scholar] [CrossRef]
- Mathier, L.; Perreault, L.; Bobée, B.; Ashkar, F. The use of geometric and gamma-related distributions for frequency analysis of water deficit. Stoch. Hydrol. Hydraul. 1992, 6, 239–254. [Google Scholar] [CrossRef]
- Svoboda, M.; Hayes, M.; Wood, D. Standardized Precipitation Index: User Guide; World Meteorological Organization: Geneva, Switzerland, 2012. [Google Scholar]
- Kim, D.-W.; Byun, H.-R.; Choi, K.-S. Evaluation, modification, and application of the Effective Drought Index to 200-Year drought climatology of Seoul, Korea. J. Hydrol. 2009, 378, 1–12. [Google Scholar] [CrossRef]
- Mann, H.B. Nonparametric tests against trend. Econom. J. Econom. Soc. 1945, 13, 245–259. [Google Scholar] [CrossRef]
- Wasserstein, R.L.; Schirm, A.L.; Lazar, N.A. Moving to a world beyond “p < 0.05”. Am. Stat. 2019, 73, 1–19. [Google Scholar]
- Koudahe, K.; Koffi, D.; Kayode, J.; Awokola, S.; Adebola, A. Impact of climate variability on crop yields in southern Togo. Environ. Pollut. Clim. Chang. 2018, 2, 1–9. [Google Scholar]
- Li, Z.; Ali, Z.; Cui, T.; Qamar, S.; Ismail, M.; Nazeer, A.; Faisal, M. A comparative analysis of pre- and post-industrial spatiotemporal drought trends and patterns of Tibet Plateau using Sen slope estimator and steady-state probabilities of Markov Chain. Nat. Hazards 2022, 113, 547–576. [Google Scholar] [CrossRef]
- Zambreski, Z.T.; Lin, X.; Aiken, R.M.; Kluitenberg, G.J.; Pielke Sr, R.A. Identification of hydroclimate subregions for seasonal drought monitoring in the U.S. Great Plains. J. Hydrol. 2018, 567, 370–381. [Google Scholar] [CrossRef]
- Gebremichael, H.B.; Raba, G.A.; Beketie, K.T.; Feyisa, G.L. Temporal and spatial characteristics of drought, future changes and possible drivers over Upper Awash Basin, Ethiopia, using SPI and SPEI. Environ. Dev. Sustain. 2022, 1–39. [Google Scholar] [CrossRef]
- Nhamo, L.; Matchaya, G.; Mabhaudhi, T.; Nhlengethwa, S.; Nhemachena, C.; Mpandeli, S. Cereal production trends under climate change: Impacts and adaptation strategies in southern Africa. Agriculture 2019, 9, 30. [Google Scholar] [CrossRef]
- Liu, W.; Kogan, F. Monitoring regional drought using the vegetation condition index. Int. J. Remote Sens. 1996, 17, 2761–2782. [Google Scholar] [CrossRef]
- Mavromatis, T. Drought index evaluation for assessing future wheat production in Greece. Int. J. Climatol. A J. R. Meteorol. Soc. 2007, 27, 911–924. [Google Scholar] [CrossRef]
- Wu, H.; Hubbard, K.G.; Wilhite, D.A. An agricultural drought risk-assessment model for corn and soybeans. Int. J. Climatol. A J. R. Meteorol. Soc. 2004, 24, 723–741. [Google Scholar] [CrossRef]
- Mohammed, S.; Alsafadi, K.; Enaruvbe, G.O.; Bashir, B.; Elbeltagi, A.; Széles, A.; Alsalman, A.; Harsanyi, E. Assessing the impacts of agricultural drought (SPI/SPEI) on maize and wheat yields across Hungary. Sci. Rep. 2022, 12, 8838. [Google Scholar] [CrossRef]
- Sharma, A.; Goyal, M.K. Assessment of ecosystem resilience to hydroclimatic disturbances in India. Glob. Chang. Biol. 2018, 24, e432–e441. [Google Scholar] [CrossRef]
- Baudoin, M.-A.; Vogel, C.; Nortje, K.; Naik, M. Living with drought in South Africa: Lessons learnt from the recent El Niño drought period. Int. J. Disaster Risk Reduct. 2017, 23, 128–137. [Google Scholar] [CrossRef]
- Nicholson, S.E.; Kim, J. The relationship of the El Niño–Southern oscillation to African rainfall. Int. J. Climatol. A J. R. Meteorol. Soc. 1997, 17, 117–135. [Google Scholar] [CrossRef]
- Chikoore, H.; Jury, M.R. Intraseasonal variability of satellite-derived rainfall and vegetation over Southern Africa. Earth Interact. 2010, 14, 1–26. [Google Scholar] [CrossRef]
- Mahlalela, P.; Blamey, R.; Hart, N.; Reason, C. Drought in the Eastern Cape region of South Africa and trends in rainfall characteristics. Clim. Dyn. 2020, 55, 2743–2759. [Google Scholar] [CrossRef]
- Lakhraj-Govender, R.; Grab, S.W. Assessing the impact of El Niño–Southern Oscillation on South African temperatures during austral summer. Int. J. Climatol. 2019, 39, 143–156. [Google Scholar] [CrossRef]
- Botai, C.M.; Botai, J.O.; Adeola, A.M. Spatial distribution of temporal precipitation contrasts in South Africa. S. Afr. J. Sci. 2018, 114, 70–78. [Google Scholar] [CrossRef]
- Hoffman, M.T.; Carrick, P.; Gillson, L.; West, A. Drought, climate change and vegetation response in the succulent karoo, South Africa. S. Afr. J. Sci. 2009, 105, 54–60. [Google Scholar] [CrossRef]
- Rojas, O.; Vrieling, A.; Rembold, F. Assessing drought probability for agricultural areas in Africa with coarse resolution remote sensing imagery. Remote Sens. Environ. 2011, 115, 343–352. [Google Scholar] [CrossRef]
- Haile, G.G.; Tang, Q.; Leng, G.; Jia, G.; Wang, J.; Cai, D.; Sun, S.; Baniya, B.; Zhang, Q. Long-term spatiotemporal variation of drought patterns over the Greater Horn of Africa. Sci. Total Environ. 2020, 704, 135299. [Google Scholar] [CrossRef]
- Kasei, R.; Diekkrüger, B.; Leemhuis, C. Drought frequency in the Volta basin of West Africa. Sustain. Sci. 2010, 5, 89–97. [Google Scholar] [CrossRef]
- Amri, R.; Zribi, M.; Lili-Chabaane, Z.; Duchemin, B.; Gruhier, C.; Chehbouni, A. Analysis of vegetation behavior in a North African semi-arid region, using SPOT-VEGETATION NDVI data. Remote Sens. 2011, 3, 2568–2590. [Google Scholar] [CrossRef]
- Mbatha, N.; Xulu, S. Time Series Analysis of MODIS-Derived NDVI for the Hluhluwe-Imfolozi Park, South Africa: Impact of Recent Intense Drought. Climate 2018, 6, 95. [Google Scholar] [CrossRef]
- Musonda, B.; Jing, Y.; Iyakaremye, V.; Ojara, M. Analysis of long-term variations of drought characteristics using standardized precipitation index over Zambia. Atmosphere 2020, 11, 1268. [Google Scholar] [CrossRef]
- Hadri, A.; Saidi, M.E.M.; Boudhar, A. Multiscale drought monitoring and comparison using remote sensing in a Mediterranean arid region: A case study from west-central Morocco. Arab. J. Geosci. 2021, 14, 118. [Google Scholar] [CrossRef]
- Desbureaux, S.; Damania, R. Rain, forests and farmers: Evidence of drought induced deforestation in Madagascar and its consequences for biodiversity conservation. Biol. Conserv. 2018, 221, 357–364. [Google Scholar] [CrossRef]
- Uwimbabazi, J.; Jing, Y.; Iyakaremye, V.; Ullah, I.; Ayugi, B. Observed Changes in Meteorological Drought Events during 1981–2020 over Rwanda, East Africa. Sustainability 2022, 14, 1519. [Google Scholar] [CrossRef]
- Black, E.; Tarnavsky, E.; Maidment, R.; Greatrex, H.; Mookerjee, A.; Quaife, T.; Brown, M. The use of remotely sensed rainfall for managing drought risk: A case study of weather index insurance in Zambia. Remote Sens. 2016, 8, 342. [Google Scholar] [CrossRef]
- Reddy, S.S. IPCC Special Report Emission Scenarios: Summary for Plicy Makers: A Speical Report of Working Group III of Intergovernmental Panel of Climatic Change; Cambridge University: Cambridge, UK, 2000. [Google Scholar]
- Ding, Y.; Hayes, M.J.; Widhalm, M. Measuring economic impacts of drought: A review and discussion. Disaster Prev. Manag. Int. J. 2011, 20, 434–446. [Google Scholar] [CrossRef]
- Ziolkowska, J.R. Socio-Economic Implications of Drought in the Agricultural Sector and the State Economy. Economies 2016, 4, 19. [Google Scholar] [CrossRef]
- Rouault, M.; Richard, Y. Intensity and spatial extent of droughts in southern Africa. Geophys. Res. Lett. 2005, 32, L15702. [Google Scholar] [CrossRef]
- Rulinda, C.M.; Dilo, A.; Bijker, W.; Stein, A. Characterising and quantifying vegetative drought in East Africa using fuzzy modelling and NDVI data. J. Arid. Environ. 2012, 78, 169–178. [Google Scholar] [CrossRef]
- USDA. Wheat Production in South Africa. Available online: https://ipad.fas.usda.gov/highlights/2015/09/RSA/index.htm (accessed on 27 April 2022).
- Unganai, L.S.; Kogan, F.N. Drought monitoring and corn yield estimation in Southern Africa from AVHRR data. Remote Sens. Environ. 1998, 63, 219–232. [Google Scholar] [CrossRef]
- Senay, G.B.; Verdin, J. Characterization of yield reduction in Ethiopia using a GIS-based crop water balance model. Can. J. Remote Sens. 2003, 29, 687–692. [Google Scholar] [CrossRef]
- Rosenzweig, C.; Tubiello, F.N. Adaptation and mitigation strategies in agriculture: An analysis of potential synergies. Mitig. Adapt. Strateg. Glob. Chang. 2007, 12, 855–873. [Google Scholar] [CrossRef]
- Rosenzweig, C.; Karoly, D.; Vicarelli, M.; Neofotis, P.; Wu, Q.; Casassa, G.; Menzel, A.; Root, T.L.; Estrella, N.; Seguin, B. Attributing physical and biological impacts to anthropogenic climate change. Nature 2008, 453, 353–357. [Google Scholar] [CrossRef]
- Zhang, W.-f.; Dou, Z.-x.; He, P.; Ju, X.-T.; Powlson, D.; Chadwick, D.; Norse, D.; Lu, Y.-L.; Zhang, Y.; Wu, L. New technologies reduce greenhouse gas emissions from nitrogenous fertilizer in China. Proc. Natl. Acad. Sci. USA 2013, 110, 8375–8380. [Google Scholar] [CrossRef]
- Holland, J.M. The environmental consequences of adopting conservation tillage in Europe: Reviewing the evidence. Agric. Ecosyst. Environ. 2004, 103, 1–25. [Google Scholar] [CrossRef]
- Mishra, A.K.; Singh, V.P. A review of drought concepts. J. Hydrol. 2010, 391, 202–216. [Google Scholar] [CrossRef]
- Wilhite, D.A. National drought management policy guidelines: A template for action. In Integrated Drought Management Programme (IDMP) Tools and Guidelines Series; WMO: Geneva, Switzerland, 2014; Volume 1. [Google Scholar]
- Faiz, M.A.; Zhang, Y.; Zhang, X.; Ma, N.; Aryal, S.K.; Ha, T.T.V.; Baig, F.; Naz, F. A composite drought index developed for detecting large-scale drought characteristics. J. Hydrol. 2022, 605, 127308. [Google Scholar] [CrossRef]


| Station | Abbreviation | X | Y | Elevation (m) | R * (mm) | Province | Abbreviation |
|---|---|---|---|---|---|---|---|
| Betlehem | BET | −28.2496 | 28.3343 | 1688 | 58.25 | Free State | FS |
| Bloemfointein | BLM | −29.1204 | 26.1874 | 1354 | 43 | ||
| Calvinia | CAL | −31.4819 | 19.7617 | 975 | 14.54 | Western Cape | WES-C |
| Cape Columbine | CCE | −32.8278 | 17.8558 | 67 | 19.67 | ||
| Cape Town | CPT | −33.9631 | 18.6023 | 42 | 38.05 | ||
| Upington | UPN | −28.4111 | 21.2641 | 848 | 19.35 | ||
| De Aar | DAR | −30.6651 | 23.9927 | 1247 | 26.58 | Northern Cape | NR-C |
| Kimberley | KMBLY | −28.8061 | 24.7698 | 1198 | 33.52 | ||
| Springbok | SPB | −29.6694 | 17.8788 | 1006 | 17.24 | ||
| East London | EL | −33.0357 | 27.8161 | 125 | 64.01 | Eastern Cape | ES-C |
| Grahamstown | GHT | −33.2907 | 26.5026 | 642 | 42.11 | ||
| uMthatha | MTT | −31.5497 | 28.6739 | 742 | 54.68 | ||
| Port Alfred | PTA | −33.5595 | 26.8809 | 37 | 51.97 | ||
| Port Elizabeth | PE | −33.9864 | 25.6164 | 61 | 49.85 | ||
| Rusternburg | RSB | −25.6607 | 27.2322 | 1157 | 30.63 | North-West | NW |
| Lichtenburg | LCBG | −26.133 | 26.1644 | 1487 | 48.5 | ||
| Mafikeng | MFG | −25.8037 | 25.5428 | 1279 | 39.57 | ||
| Ladysmith | LYS | −28.5755 | 29.7503 | 1078 | 52.19 | KwaZulu Natal | KZN |
| Mntunzini | MTN | −28.9474 | 31.7079 | 65 | 92.8 | ||
| Pietermariesburg | PTMBG | −29.6278 | 30.4029 | 673 | 59.57 | ||
| Potchersroom | POR | −26.7359 | 27.0755 | 1351 | 43.94 | ||
| Richards Bay | RDB | −28.7378 | 32.0934 | 8 | 89.62 | ||
| JHB Bot Tuine | JHB BT | −26.1566 | 27.9991 | 1626 | 48.24 | Gauteng | GG |
| JHB Int WO | JHB Int WO | −26.143 | 28.2346 | 1694 | 58.63 | ||
| Irene | IRE | −25.9105 | 28.2106 | 1523 | 55.31 | ||
| Polokwane | POL | −23.8576 | 29.4517 | 1228 | 54.29 | Limpopo | LPP |
| Thohoyandou | THY | −22.9845 | 30.4583 | 618 | 59.11 | ||
| Lephalale | LPL | −23.6767 | 27.7051 | 840 | 31.92 | ||
| Skukuza | SKZ | −24.9926 | 31.588 | 271 | 42.98 | Mpumalanga | MP |
| Oudestad | ODD | −25.18 | 29.33 | 949 | 33.79 | ||
| Ermelo | ERM | −26.4977 | 29.9838 | 1737 | 58.96 |
| SPI Value | Category |
|---|---|
| −1.0 ≤ SPI ≤ 0 | Mild event |
| −1.49 < SPI ≤ −1.0 | Moderate event |
| −2.0 < SPI ≤ −1.5 | Severe event |
| SPI ≤ −2.0 | Extreme event |
| SYRS Values | SYRS Classes | CR Values | CR Classes |
|---|---|---|---|
| −0.5 < SYRS ≤ 0.5 | Normal conditions | CR > 1 | Resilient |
| −0.5 < SYRS ≤ −1.0 | Acceptable losses due to drought | 0.9 < CR < 1 | Slightly nonresilient |
| −1.0 < SYRS ≤ −1.5 | Moderate | 0.8 < CR < 0.9 | Moderately nonresilient |
| −1.5 < SYRS < −2.0 | High | CR < 0.8 | Severely nonresilient |
| SYRS ≤ −2.0 | Extreme |
| Station | SPI-3 | SPI-6 | SPI-9 | SPI-12 | ||||
|---|---|---|---|---|---|---|---|---|
| p | Sen’s * | p | Sen’s | p | Sen’s | p | Sen’s | |
| BET | 0.59 | 0.01 | 0.59 | 0.01 | 0 | 0.03 | 0 | 0.03 |
| BLM | 0.19 | −0.01 | 0.19 | −0.01 | 0.94 | 0 | 0.61 | 0 |
| CAL | 0.03 | −0.02 | 0.03 | −0.02 | 0 | −0.03 | 0 | −0.03 |
| CCE | 0 | −0.03 | 0 | −0.03 | <0.0001 | −0.04 | <0.0001 | −0.05 |
| CPT | <0.0001 | −0.04 | <0.0001 | −0.04 | <0.0001 | −0.05 | <0.0001 | −0.06 |
| DAR | 0.31 | −0.01 | 0.31 | −0.01 | 0.01 | −0.02 | 0.01 | −0.02 |
| EL | 0.14 | −0.01 | 0.14 | −0.01 | <0.0001 | −0.04 | <0.0001 | −0.04 |
| ERM | 0.92 | 0 | 0.92 | 0 | 0.4 | 0.01 | 0.29 | 0.01 |
| GHT | 0.18 | −0.01 | 0.18 | −0.01 | 0 | −0.03 | 0.01 | −0.03 |
| IRE | 0.01 | 0.02 | 0.01 | 0.02 | <0.0001 | 0.04 | < 0.0001 | 0.05 |
| JHB BT | 0 | 0.03 | 0 | 0.03 | <0.0001 | 0.05 | < 0.0001 | 0.05 |
| JHB Int WO | 0.08 | −0.02 | 0.08 | −0.02 | 0 | −0.03 | 0 | −0.03 |
| KMBLY | 0.04 | −0.02 | 0.04 | −0.02 | 0.35 | −0.01 | 0.44 | −0.01 |
| LYS | 0.31 | −0.01 | 0.31 | −0.01 | 0.94 | 0 | 0.66 | 0 |
| LPL | 0.85 | 0 | 0.85 | 0 | 0.71 | 0 | 0.61 | 0 |
| LCBG | 0.65 | 0 | 0.65 | 0 | 0.12 | 0.02 | 0.07 | 0.02 |
| MFG | 0.98 | 0 | 0.98 | 0 | 0.52 | −0.01 | 0.35 | −0.01 |
| MTT | 0.35 | −0.01 | 0.35 | −0.01 | 0.22 | −0.01 | 0.11 | −0.01 |
| MTN | 0.89 | 0 | 0.89 | 0 | 0.38 | −0.01 | 0.3 | −0.01 |
| ODD | 0.2 | −0.01 | 0.2 | −0.01 | 0.03 | −0.01 | 0.04 | −0.01 |
| PTMBG | <0.0001 | −0.05 | <0.0001 | −0.05 | <0.0001 | −0.08 | <0.0001 | −0.09 |
| POL | 0.25 | −0.01 | 0.25 | −0.01 | 0.12 | −0.01 | 0.08 | −0.02 |
| PTA | 0.05 | −0.02 | 0.05 | −0.02 | <0.0001 | −0.03 | 0 | −0.02 |
| PE | 0.03 | −0.02 | 0.03 | −0.02 | <0.0001 | −0.04 | <0.0001 | −0.04 |
| POR | <0.0001 | 0.04 | <0.0001 | 0.04 | <0.0001 | 0.06 | <0.0001 | 0.06 |
| RDB | 0.47 | −0.01 | 0.47 | −0.01 | 0.05 | −0.02 | 0.09 | −0.01 |
| RSB | <0.0001 | −0.05 | <0.0001 | −0.05 | <0.0001 | −0.07 | <0.0001 | −0.08 |
| SKZ | 0.01 | −0.03 | 0.01 | −0.03 | <0.0001 | −0.05 | <0.0001 | −0.05 |
| SPB | 0 | −0.04 | 0 | −0.04 | <0.0001 | −0.05 | <0.0001 | −0.06 |
| THY | 0.82 | 0 | 0.82 | 0 | 0.31 | 0.01 | 0.09 | 0.02 |
| UPN | 0.07 | −0.02 | 0.07 | −0.02 | 0.08 | −0.01 | 0.24 | −0.01 |
| Year | WES-C | NR-C | FS | ES-C | KZN | MP | LPP | GG | NW |
|---|---|---|---|---|---|---|---|---|---|
| 2002 | 0.96 | 0.08 | 0.19 | −0.85 | 0.5 | 1.35 | −0.55 | −0.12 | −0.62 |
| 2003 | −0.82 | 0.3 | −0.37 | 0.15 | −0.33 | −2.37 | 0.06 | −1.89 | 0.03 |
| 2004 | −1.28 | 0 | −0.58 | 0.37 | 1.77 | 0.52 | −1.01 | 0.74 | 0.36 |
| 2005 | −0.1 | 0.55 | −0.57 | 0.61 | −0.68 | 0.24 | −0.14 | 0.27 | 0.93 |
| 2006 | 0.49 | −0.11 | 0.47 | −1.79 | −1.72 | −0.02 | −0.55 | −1.59 | −1.95 |
| 2007 | 0.36 | −0.49 | 1.19 | 1.28 | −0.55 | −0.76 | 1.60 | 1.66 | −0.84 |
| 2008 | 0.16 | −0.01 | −0.2 | 1 | 0.29 | 0.86 | 1.32 | 1.09 | 2.52 |
| 2009 | −0.11 | −1.29 | 0.79 | 0.65 | −0.43 | 0.13 | 1.02 | 0.82 | 0.6 |
| 2010 | −0.98 | −0.77 | −0.91 | 0.25 | −0.79 | −1.09 | −0.01 | 0.59 | −0.29 |
| 2011 | 0.26 | 2.41 | −0.06 | 0.38 | 0.43 | 1.75 | 0.88 | 1 | −0.11 |
| 2012 | 1.39 | −1.78 | 0.27 | −0.39 | −1.56 | −1.09 | −1.82 | −1.63 | −0.45 |
| 2013 | 0.69 | 0.88 | 0.42 | −0.11 | 2.04 | 1.15 | −0.83 | −0.3 | 0.5 |
| 2014 | 0.42 | 0.35 | 1.1 | −1.89 | 1.62 | 0.47 | −1.64 | −0.27 | 0.27 |
| 2015 | −0.96 | −0.61 | −1.67 | −0.25 | −0.35 | −1.46 | −1.05 | −0.82 | −1.21 |
| 2016 | 1.25 | 0.28 | −0.91 | −0.39 | −0.47 | −0.43 | 0.53 | −0.77 | −0.89 |
| 2017 | −2 | 1.72 | 1.31 | −1.18 | 0.67 | 0.36 | 1.50 | −0.67 | 0.97 |
| 2018 | −0.08 | 0.48 | 0.29 | 2.34 | 0.59 | 0.52 | 0.74 | 0.68 | 0.32 |
| 2019 | −1.74 | −1.49 | −2.52 | −0.43 | −0.3 | −0.37 | −0.51 | −0.33 | −1 |
| 2020 | 0.96 | −0.59 | 0.49 | 0.49 | −0.41 | −0.04 | 0.23 | 0.63 | −0.31 |
| 2021 | 1.14 | 0.09 | 1.26 | −0.23 | −0.33 | 0.3 | 0.22 | 0.91 | 1.18 |
| Province | JAN | FEB | MAR | APR | MAY | JUN | JUL | AUG | SEP | OCT | NOV | DEC |
|---|---|---|---|---|---|---|---|---|---|---|---|---|
| WES-C | 0.16 | 0.3 | 0.53 | 0.4 | 0.48 | 0.38 | 0.55 | 0.55 | 0.52 | 0.32 | 0.1 | −0.05 |
| NR-C | 0.54 | 0.32 | 0.06 | −0.05 | 0.15 | 0.06 | 0.01 | −0.22 | −0.23 | −0.13 | −0.03 | −0.24 |
| FS | 0.39 | 0.38 | −0.11 | −0.33 | −0.6 | −0.3 | −0.24 | 0.03 | 0.13 | 0.54 | 0.5 | 0.54 |
| ES-C | −0.17 | 0.02 | 0.14 | −0.11 | −0.22 | −0.27 | −0.04 | −0.22 | −0.36 | −0.39 | −0.23 | −0.12 |
| KZN | −0.18 | 0.09 | −0.07 | 0.02 | −0.14 | −0.09 | 0.03 | −0.11 | −0.14 | −0.2 | −0.23 | −0.18 |
| MP | 0.31 | 0.25 | 0.39 | 0.32 | 0.41 | 0.12 | 0.15 | 0.12 | −0.15 | 0.14 | −0.06 | 0.22 |
| LPP | −0.05 | −0.18 | −0.19 | −0.22 | −0.2 | 0.12 | 0.53 | 0.59 | 0.25 | 0.04 | 0.25 | 0.05 |
| GG | 0.05 | −0.11 | −0.01 | 0.13 | 0.35 | 0.51 | 0.35 | −0.03 | −0.32 | 0.15 | 0.24 | 0.39 |
| NW | 0.24 | 0.14 | 0.26 | 0.12 | 0.05 | −0.04 | −0.05 | −0.24 | −0.45 | −0.12 | −0.12 | −0.06 |
| Western Cape (WES-C), CR = 0.65 | Northern Cape (NR-C), CR = 0.93 | Free State (FS), CR = 0.65 | |||||||||||||||
| Year | YL% | DE | GS | DS | DD | Year | YL% | DE | GS | DS | DD | Year | YL% | DE | GS | DS | DD |
| 2017 | −35 | 2016Aug–18Mar | GC | 13.3 | 20 | 2012 | −8.7 | - | n | n | n | 2019 | −34.5 | 2019Jul–20Jan | GP, HP | 6.1 | 7 |
| 2019 | −29.5 | 2018Aug–20Jan | GC | 14 | 18 | 2019 | −6.8 | 2019Jul–20Mar | GC | 8.8 | 10 | 2015 | −28.7 | 2015Feb–16Apr | SP, HP | 10.5 | 11 |
| 2004 | −29.3 | 2004Mar–4Jul | SP | 1.4 | 3 | 2009 | −6.4 | 2009May–9Jun | SP | 0.6 | 2 | 2010 | −20.4 | 2010Jul–10Oct | GP, HP | 3.9 | 4 |
| 2003 | −18.6 | 2003Mar–3Aug | SP, GP | 6.6 | 6 | 2004 | −17 | 2004Jun–4Dec | GP, HP | 2.3 | 5 | ||||||
| 2010 | −18.6 | 2010Mar–10Oct | GP, HP | 2.9 | 4 | 2005 | −15.9 | 2005Ju1–4Sept | GP | 1.9 | 3 | ||||||
| 2015 | −16.5 | 2015Feb–15dec | GC | 9.4 | 11 | 2003 | −10.8 | 2002Nov–4Mar | GC | 10.8 | 17 | ||||||
| Eastern Cape (ES-C), CR = 0.97 | KwaZulu−Natal (KZN), CR = 0.96 | Mpumalanga (MP), CR = 0.92 | |||||||||||||||
| Year | YL% | DE | GS | DS | DD | Year | YL% | DE | GS | DS | DD | Year | YL% | DE | GS | DS | DD |
| 2006 | −17.8 | - | GP-HP | w | w | 2006 | −8.4 | - | n | n | n | 2003 | −15.5 | 2003Sept–3Dec | GP, HP | 1.9 | 4 |
| 2014 | −14 | 2014Jul–4Dec | GP, HP | 4.2 | 6 | 2012 | −6.9 | 2012May–12Aug | SP, GP | 2.3 | 4 | 2015 | −7.5 | 2014Jun–15Aug | SP, GP | 12 | 15 |
| 2017 | −7.5 | 2016Oct–17Spet | SP, GP | 6 | 12 | 2010 | −3.4 | 2010Jul–10Nov | GP, HP | 4.7 | 5 | 2010 | −6 | 2010Ju1–11Aug | GP, HP | 3.1 | 5 |
| 2002 | −8.8 | - | GP, HP | w | w | 2012 | −5.7 | 2012Jun–12Aug | SP, GP | 2.8 | 3 | ||||||
| 2019 | −2.5 | 2019Oct–20Jan | GP, HP | 7.4 | 6 | 2007 | −4.2 | 2007Jan–12Jun | SP | 4.5 | 6 | ||||||
| Limpopo (LPP), CR = 0.79 | Gauteng (GG), CR = 0.85 | North−West (NW) CR = 0.97 | |||||||||||||||
| Year | YL% | DE | GS | DS | DD | Year | YL% | DE | GS | DS | DD | Year | YL% | DE | GS | DS | DD |
| 2012 | −20.3 | 2012Jan–12Aug | SP, GP | 6 | 8 | 2003 | −14.5 | 2003Sept–4Jan | GC | 6 | 5 | 2006 | −7.2 | − | n | n | n |
| 2014 | −18.3 | 2014Jun–14Nov | GP, HP | 3.7 | 6 | 2006 | −10.8 | 2006May–6Jul | SP, GP | 2.5 | 3 | 2015 | −4 | 2015Jan–15Jun | SP | 3.8 | 6 |
| 2004 | −17.6 | 2004Jun–05Oct | GC | 10.6 | 18 | 2012 | −10 | 2012Jan–12Aug | SP, GP | 6.5 | 8 | 2019 | −3.2 | 2019Jul–19Nov | GP, HP | 5.8 | 5 |
| 2015 | −14.2 | 2015Mar–15Aug | SP, GP | 2.4 | 6 | 2015 | −4.6 | 2015Feb–15Jul | SP, GP | 2.4 | 6 | ||||||
| 2005 | −10.2 | 2004Jun–05Oct | GC | 10.6 | 18 | ||||||||||||
| Basin | Country | Drought Indices | Period | Output and Impact | Reference |
|---|---|---|---|---|---|
| Eastern Cape province | South Africa | Rainfall trend | 1981–2018 | Drought was detected in all seasons since 2015 | Mahlalela et al. [86] |
| Karroo (Northern, Western, and Eastern Cape provinces) | South Africa | SPI | 1900–2000 | From 1900 to 1950, dry spell patterns were detected, whereas no visible precipitation or drought trends in 1951–2000 period | Hoffman et al. [89] |
| Africa | African countries | Remote sensing imagery (NDVI and HVI) | 1981–2009 | Impact of drought on agriculture | Rojas et al. [90] |
| Greater Horn of Africa | Ethiopia, Eritrea, Kenya, Rwanda, Somalia, Sudan, Uganda, Tanzania, Burundi, Djibouti, and South Sudan | SPEI | 1964–2015 | The previous 52 years saw rising trends in drought with different temporal and spatial patterns | Haile et al. [91] |
| West Africa (Volta Basin) | Benin, Togo, Mali, Ghana, Burkina Faso, and Ivory Coast | SPI | 1961–2003 | Frequency of droughts has increased since the 1970s | Kasei et al. [92] |
| Kairouan plain | Central Tunisia | SPOT VEGETATION NDVI | 1998–2010 | Reveals drought year in 2000–2001 and decadal persistent temporal fluctuations in agriculture | Amri et al. [93] |
| Hluhluwe–iMfolozi Park | KZN, South Africa | NDVI, EVI, BAI, and NDII | 2002–2017 | The indices show the vegetation experienced water stress, especially in 2003 and 2014–2016 | Mbatha and Xulu [94] |
| Zambia | Africa | SPI | 1981–2017 | Widespread floods in DJF (summer) seasons and drought periods in 1992, 1995, and 2005 | Musonda et al. [95] |
| Chichaoua–Mejjate | Morocco | SPI and NDVI | 2008–2017 | Trend in temporal persistent soaring drought with exception on 3-month SPI scale | Hadri et al. [96] |
| Africa | Madagascar | SPI | 1900–2013 | Result of drought-induced deforestation and loss of biodiversity | Desbureaux and Damania [97] |
| Africa | Rwanda | SPEI and SPI | 1981–2020 | Much variability in rainfall and temperature with a major decline in 2010–2017 and drought events in 2015, 2016, and 2017 | Uwimbabazi et al. [98] |
| Southern Africa | Zambia | Joint UK Land Environment Simulator (JULES) | 1995–2009 | Strong relationships exist between drought classifications in all spatial ranges in south, west, and east regions of Zambia | Black et al. [99] |
Publisher’s Note: MDPI stays neutral with regard to jurisdictional claims in published maps and institutional affiliations. |
© 2022 by the authors. Licensee MDPI, Basel, Switzerland. This article is an open access article distributed under the terms and conditions of the Creative Commons Attribution (CC BY) license (https://creativecommons.org/licenses/by/4.0/).
Share and Cite
Nxumalo, G.; Bashir, B.; Alsafadi, K.; Bachir, H.; Harsányi, E.; Arshad, S.; Mohammed, S. Meteorological Drought Variability and Its Impact on Wheat Yields across South Africa. Int. J. Environ. Res. Public Health 2022, 19, 16469. https://doi.org/10.3390/ijerph192416469
Nxumalo G, Bashir B, Alsafadi K, Bachir H, Harsányi E, Arshad S, Mohammed S. Meteorological Drought Variability and Its Impact on Wheat Yields across South Africa. International Journal of Environmental Research and Public Health. 2022; 19(24):16469. https://doi.org/10.3390/ijerph192416469
Chicago/Turabian StyleNxumalo, Gift, Bashar Bashir, Karam Alsafadi, Hussein Bachir, Endre Harsányi, Sana Arshad, and Safwan Mohammed. 2022. "Meteorological Drought Variability and Its Impact on Wheat Yields across South Africa" International Journal of Environmental Research and Public Health 19, no. 24: 16469. https://doi.org/10.3390/ijerph192416469
APA StyleNxumalo, G., Bashir, B., Alsafadi, K., Bachir, H., Harsányi, E., Arshad, S., & Mohammed, S. (2022). Meteorological Drought Variability and Its Impact on Wheat Yields across South Africa. International Journal of Environmental Research and Public Health, 19(24), 16469. https://doi.org/10.3390/ijerph192416469