

Multi-Dimensional Dynamics of Psychological Health Disparities under the COVID-19 in Japan: Fairness/Justice in Socio-Economic and Ethico-Political Factors


Abstract
1. Introduction
2. Health Inequality/Disparity: Political Philosophy and Positive Psychology
2.1. Inequality and Justice in Political Philosophy
2.2. Health Inequality and Social Factors
2.3. Positive Psychology and Justice on Psychological Health Disparity
3. Materials and Methods
3.1. Population, Questions, and Collection of Data
3.2. Data Analysis Method
4. Results 1: Psychological Health Inequalities concerning Objective Personal Economic Situations
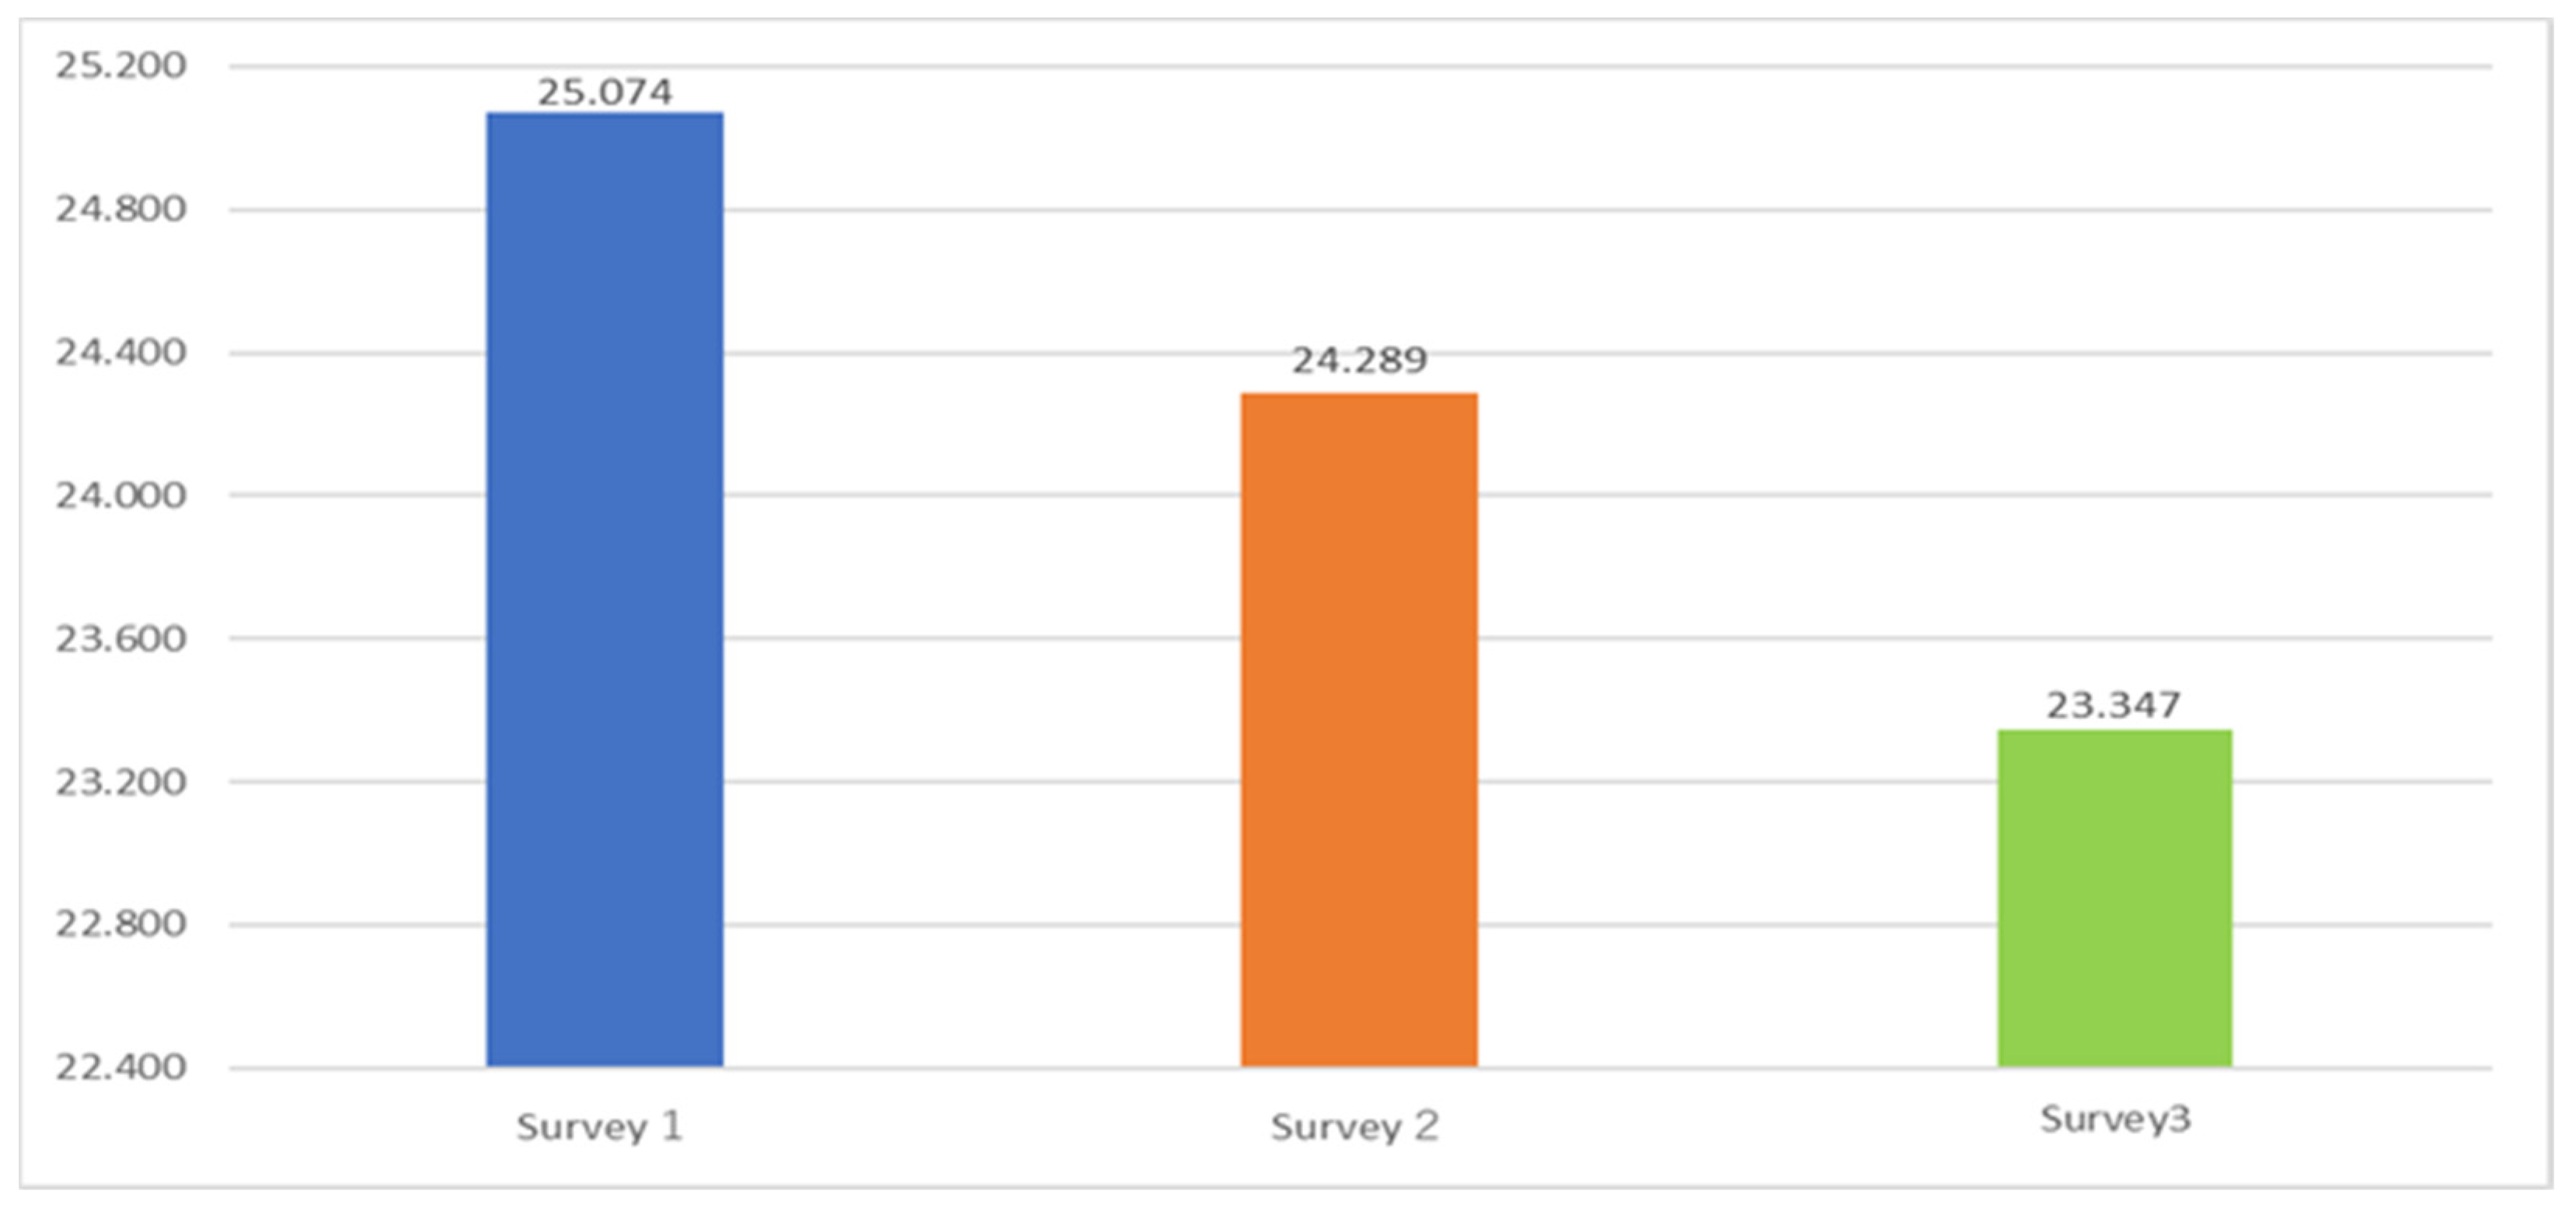
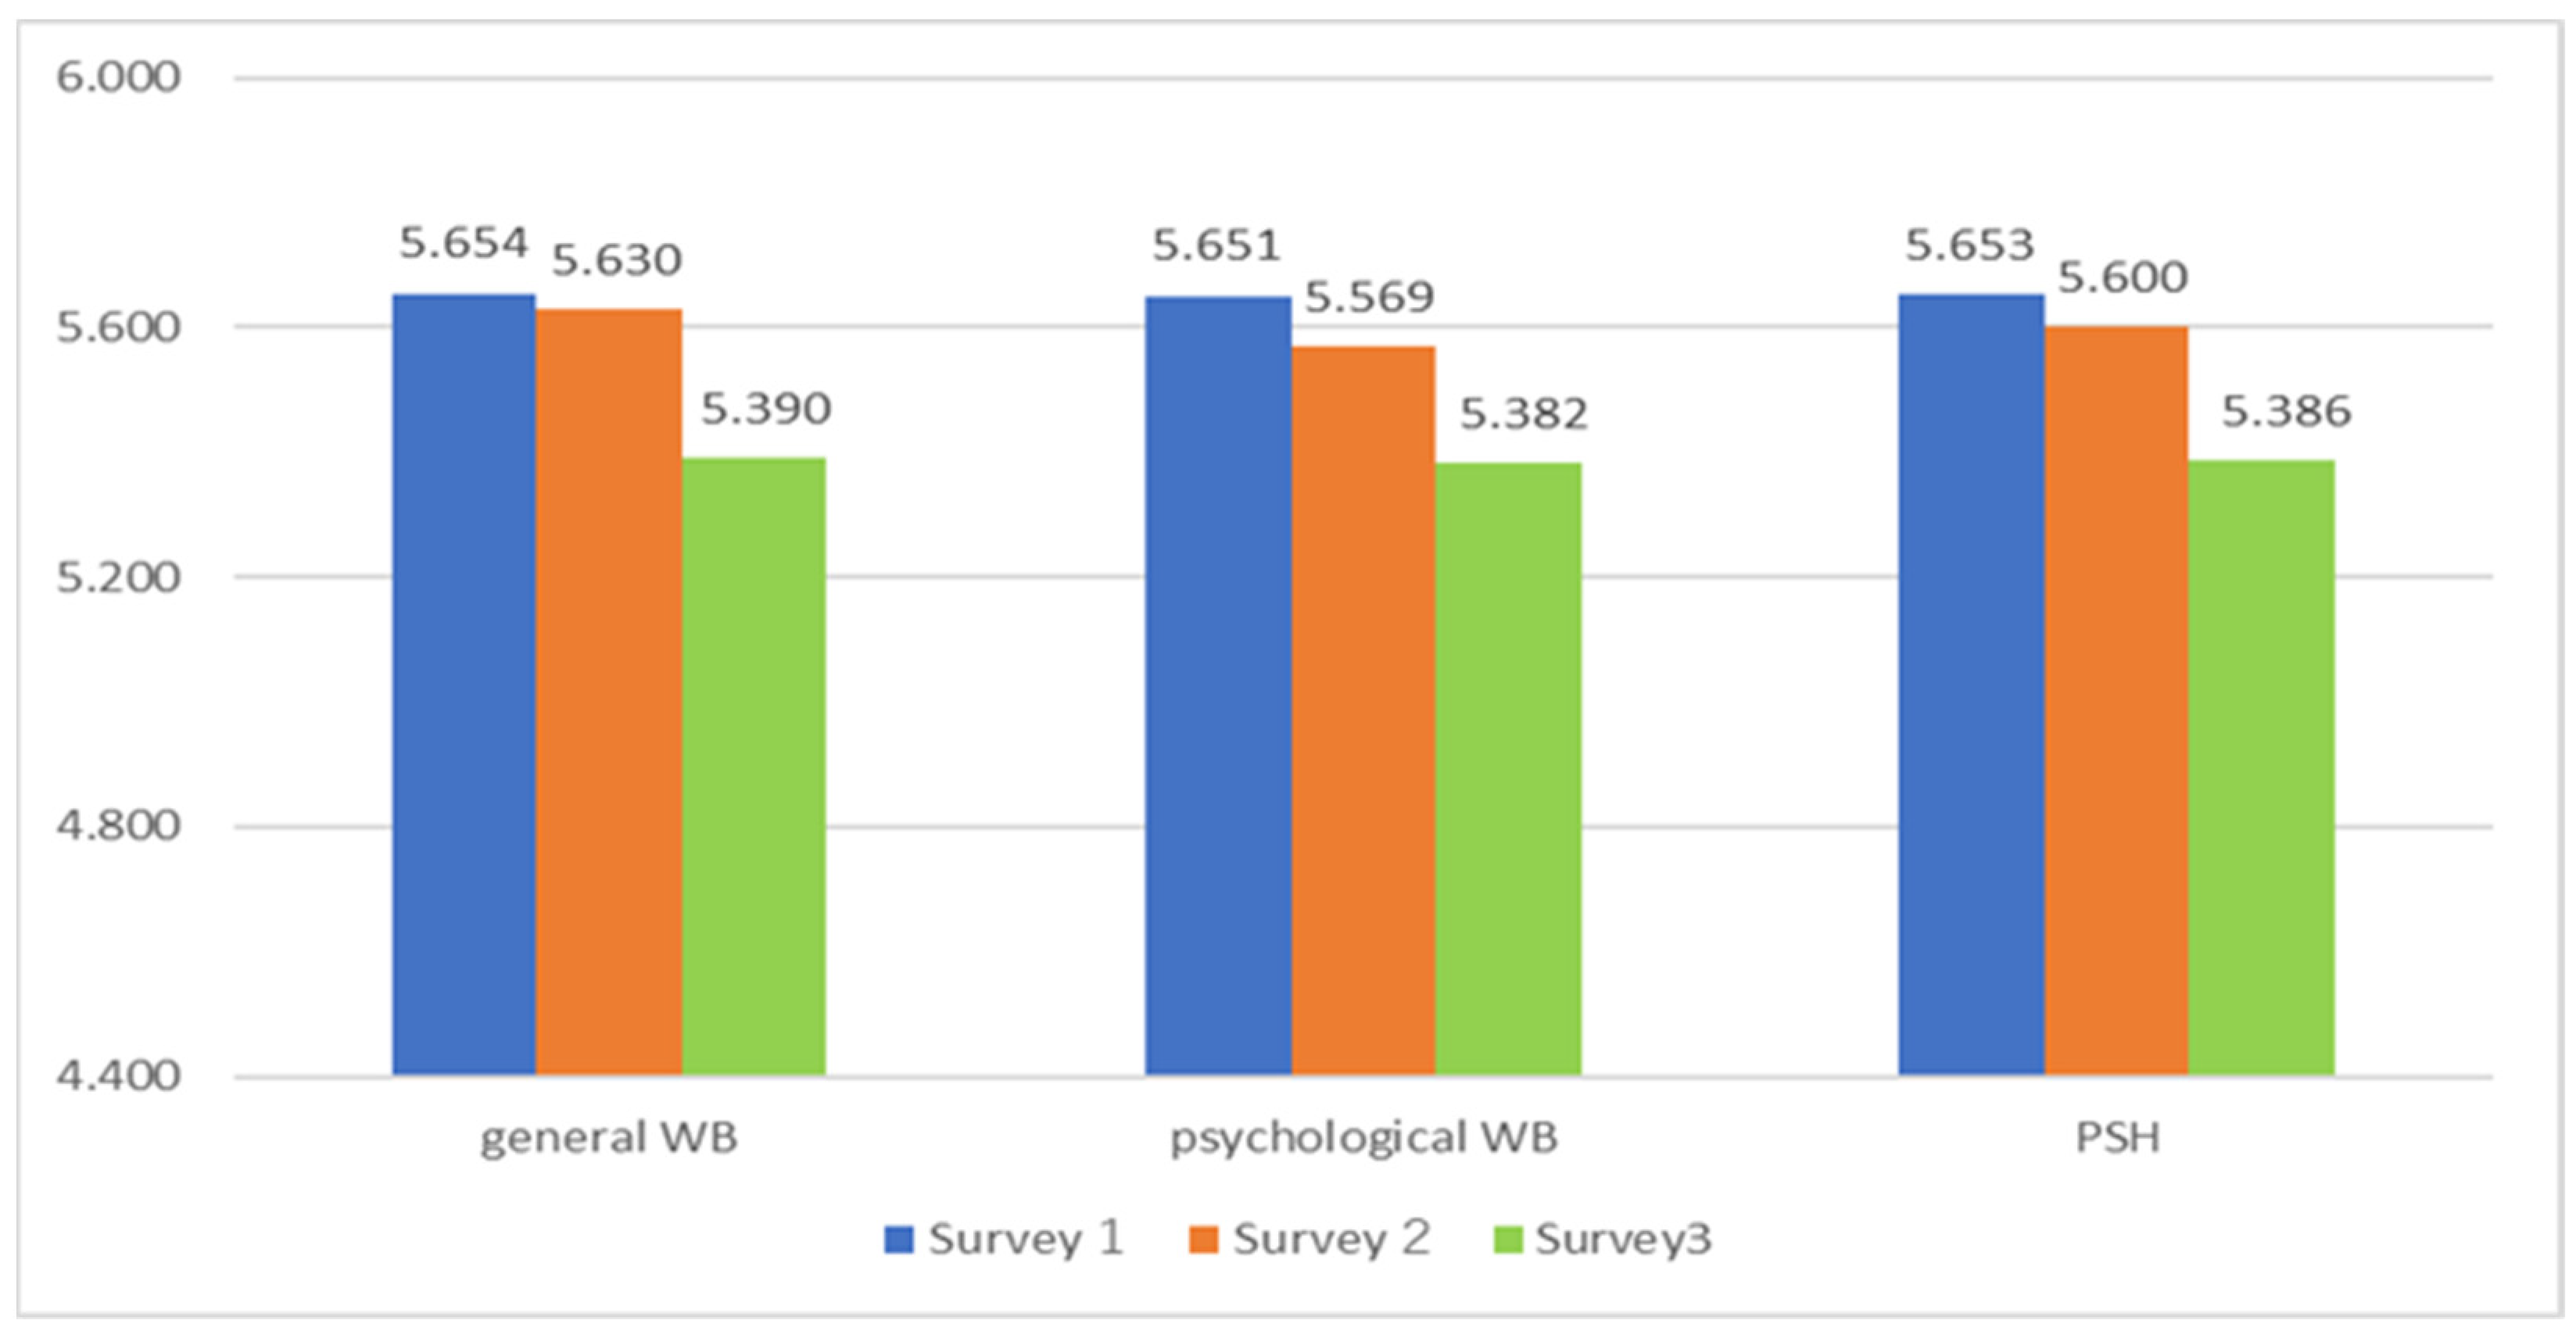
4.1. Decline and Polarization in WB during the COVID-19
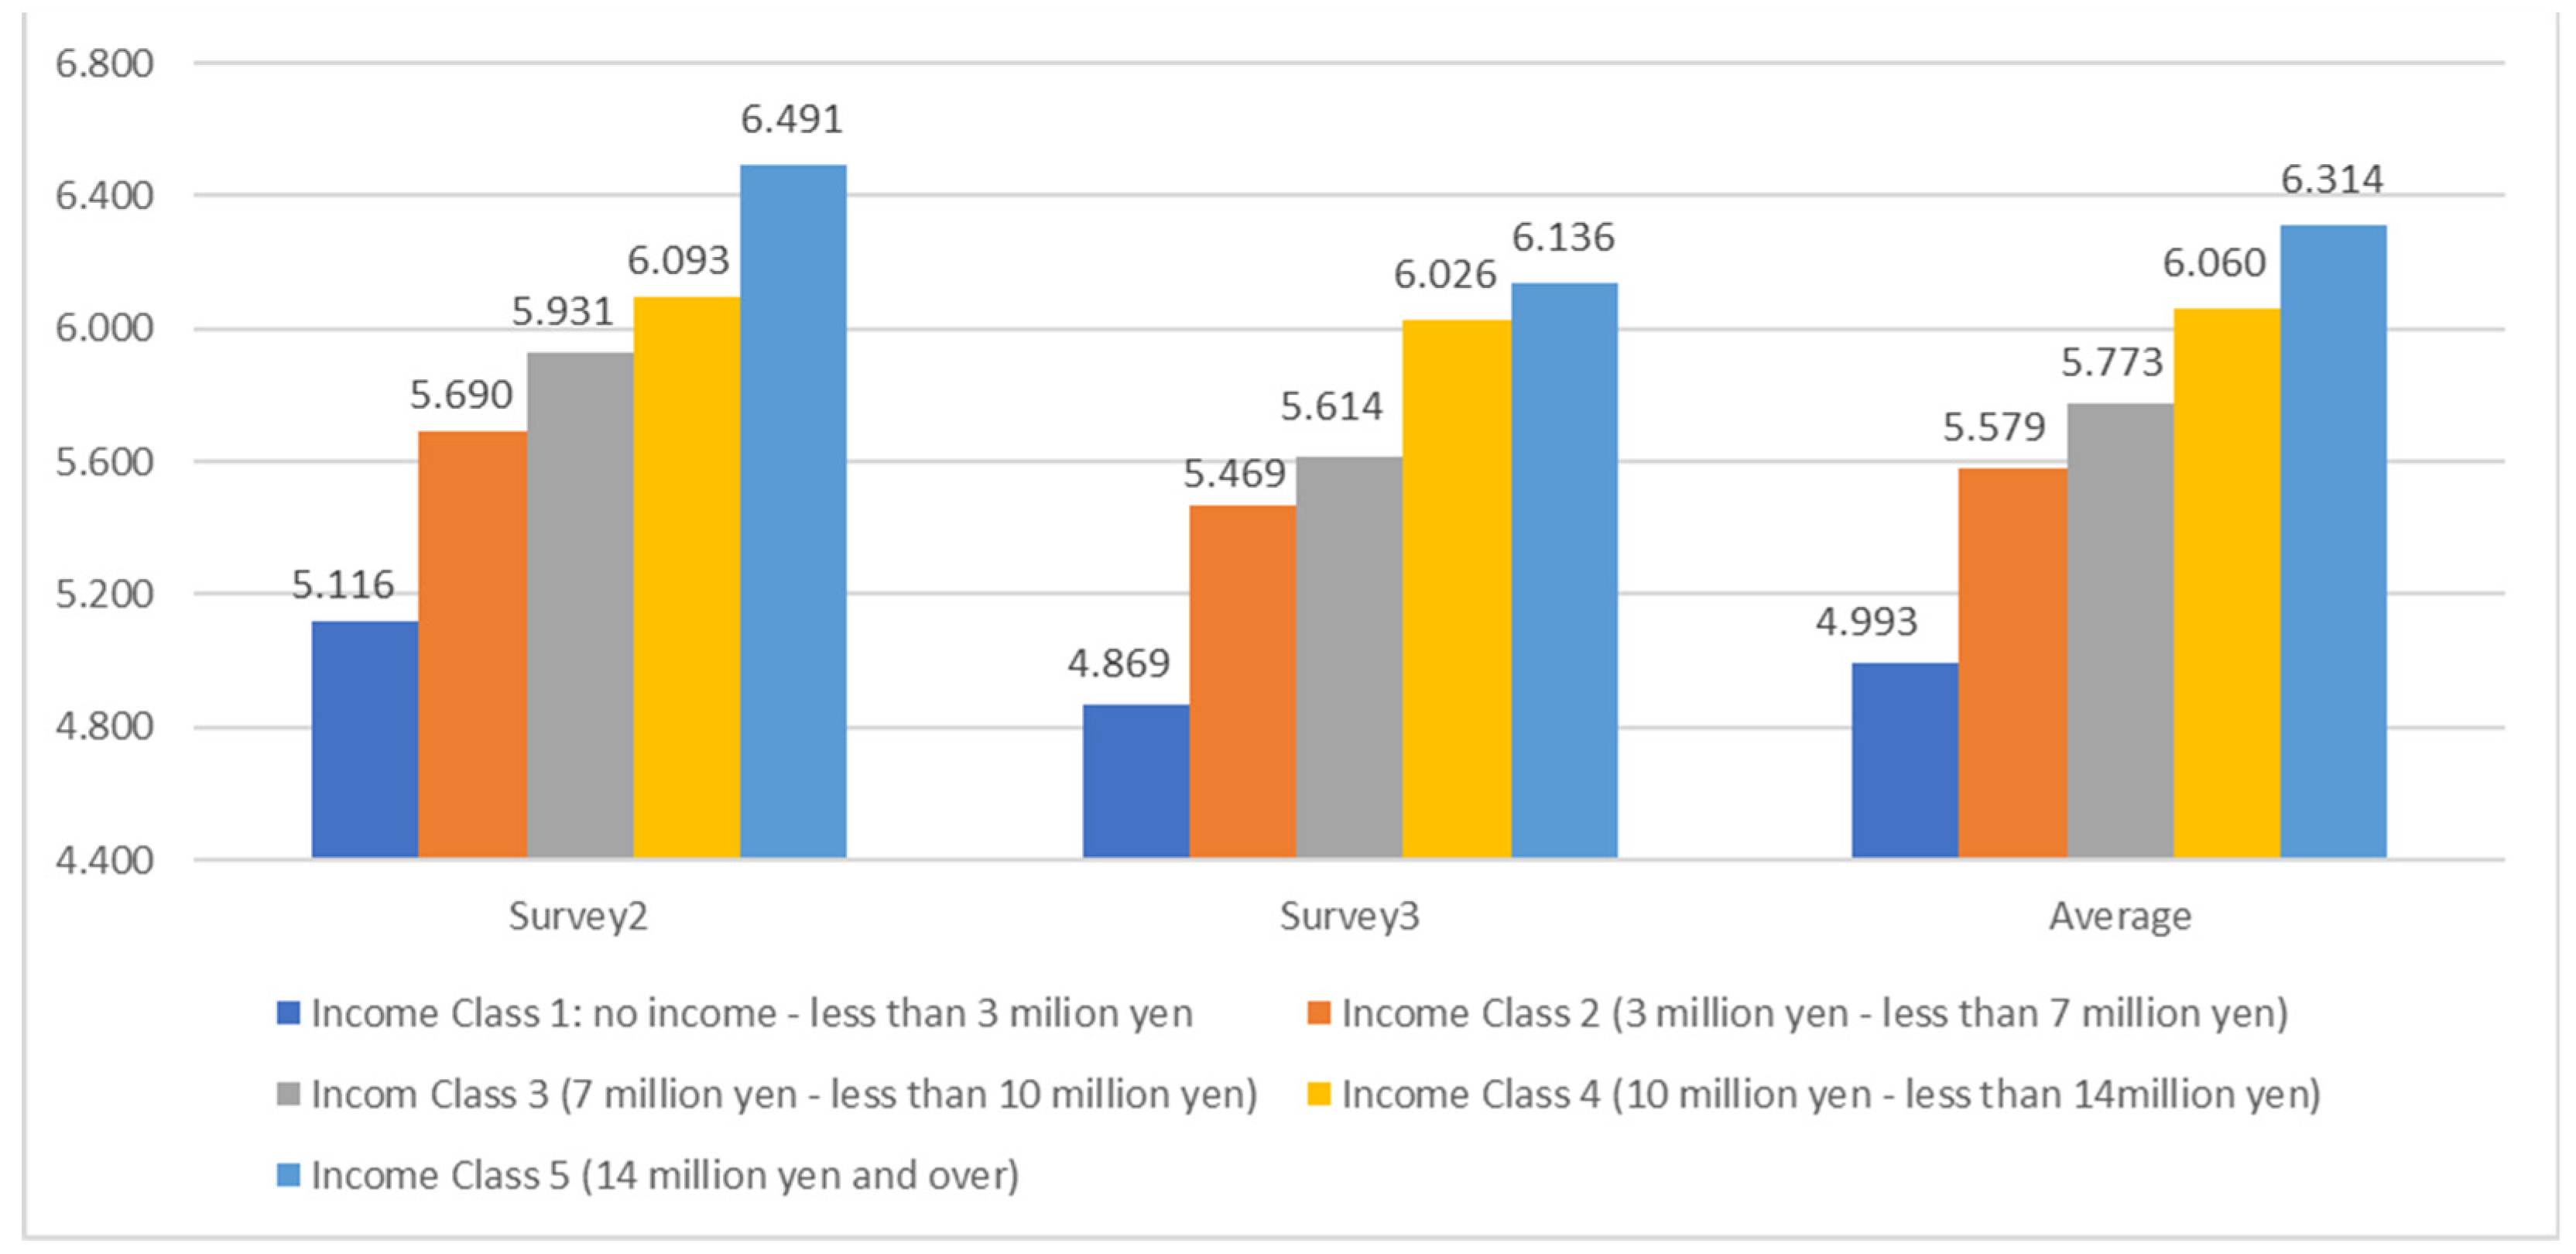
4.2. Income and Psychological Health
5. Results 2: Factors of Psychological Health Inequality
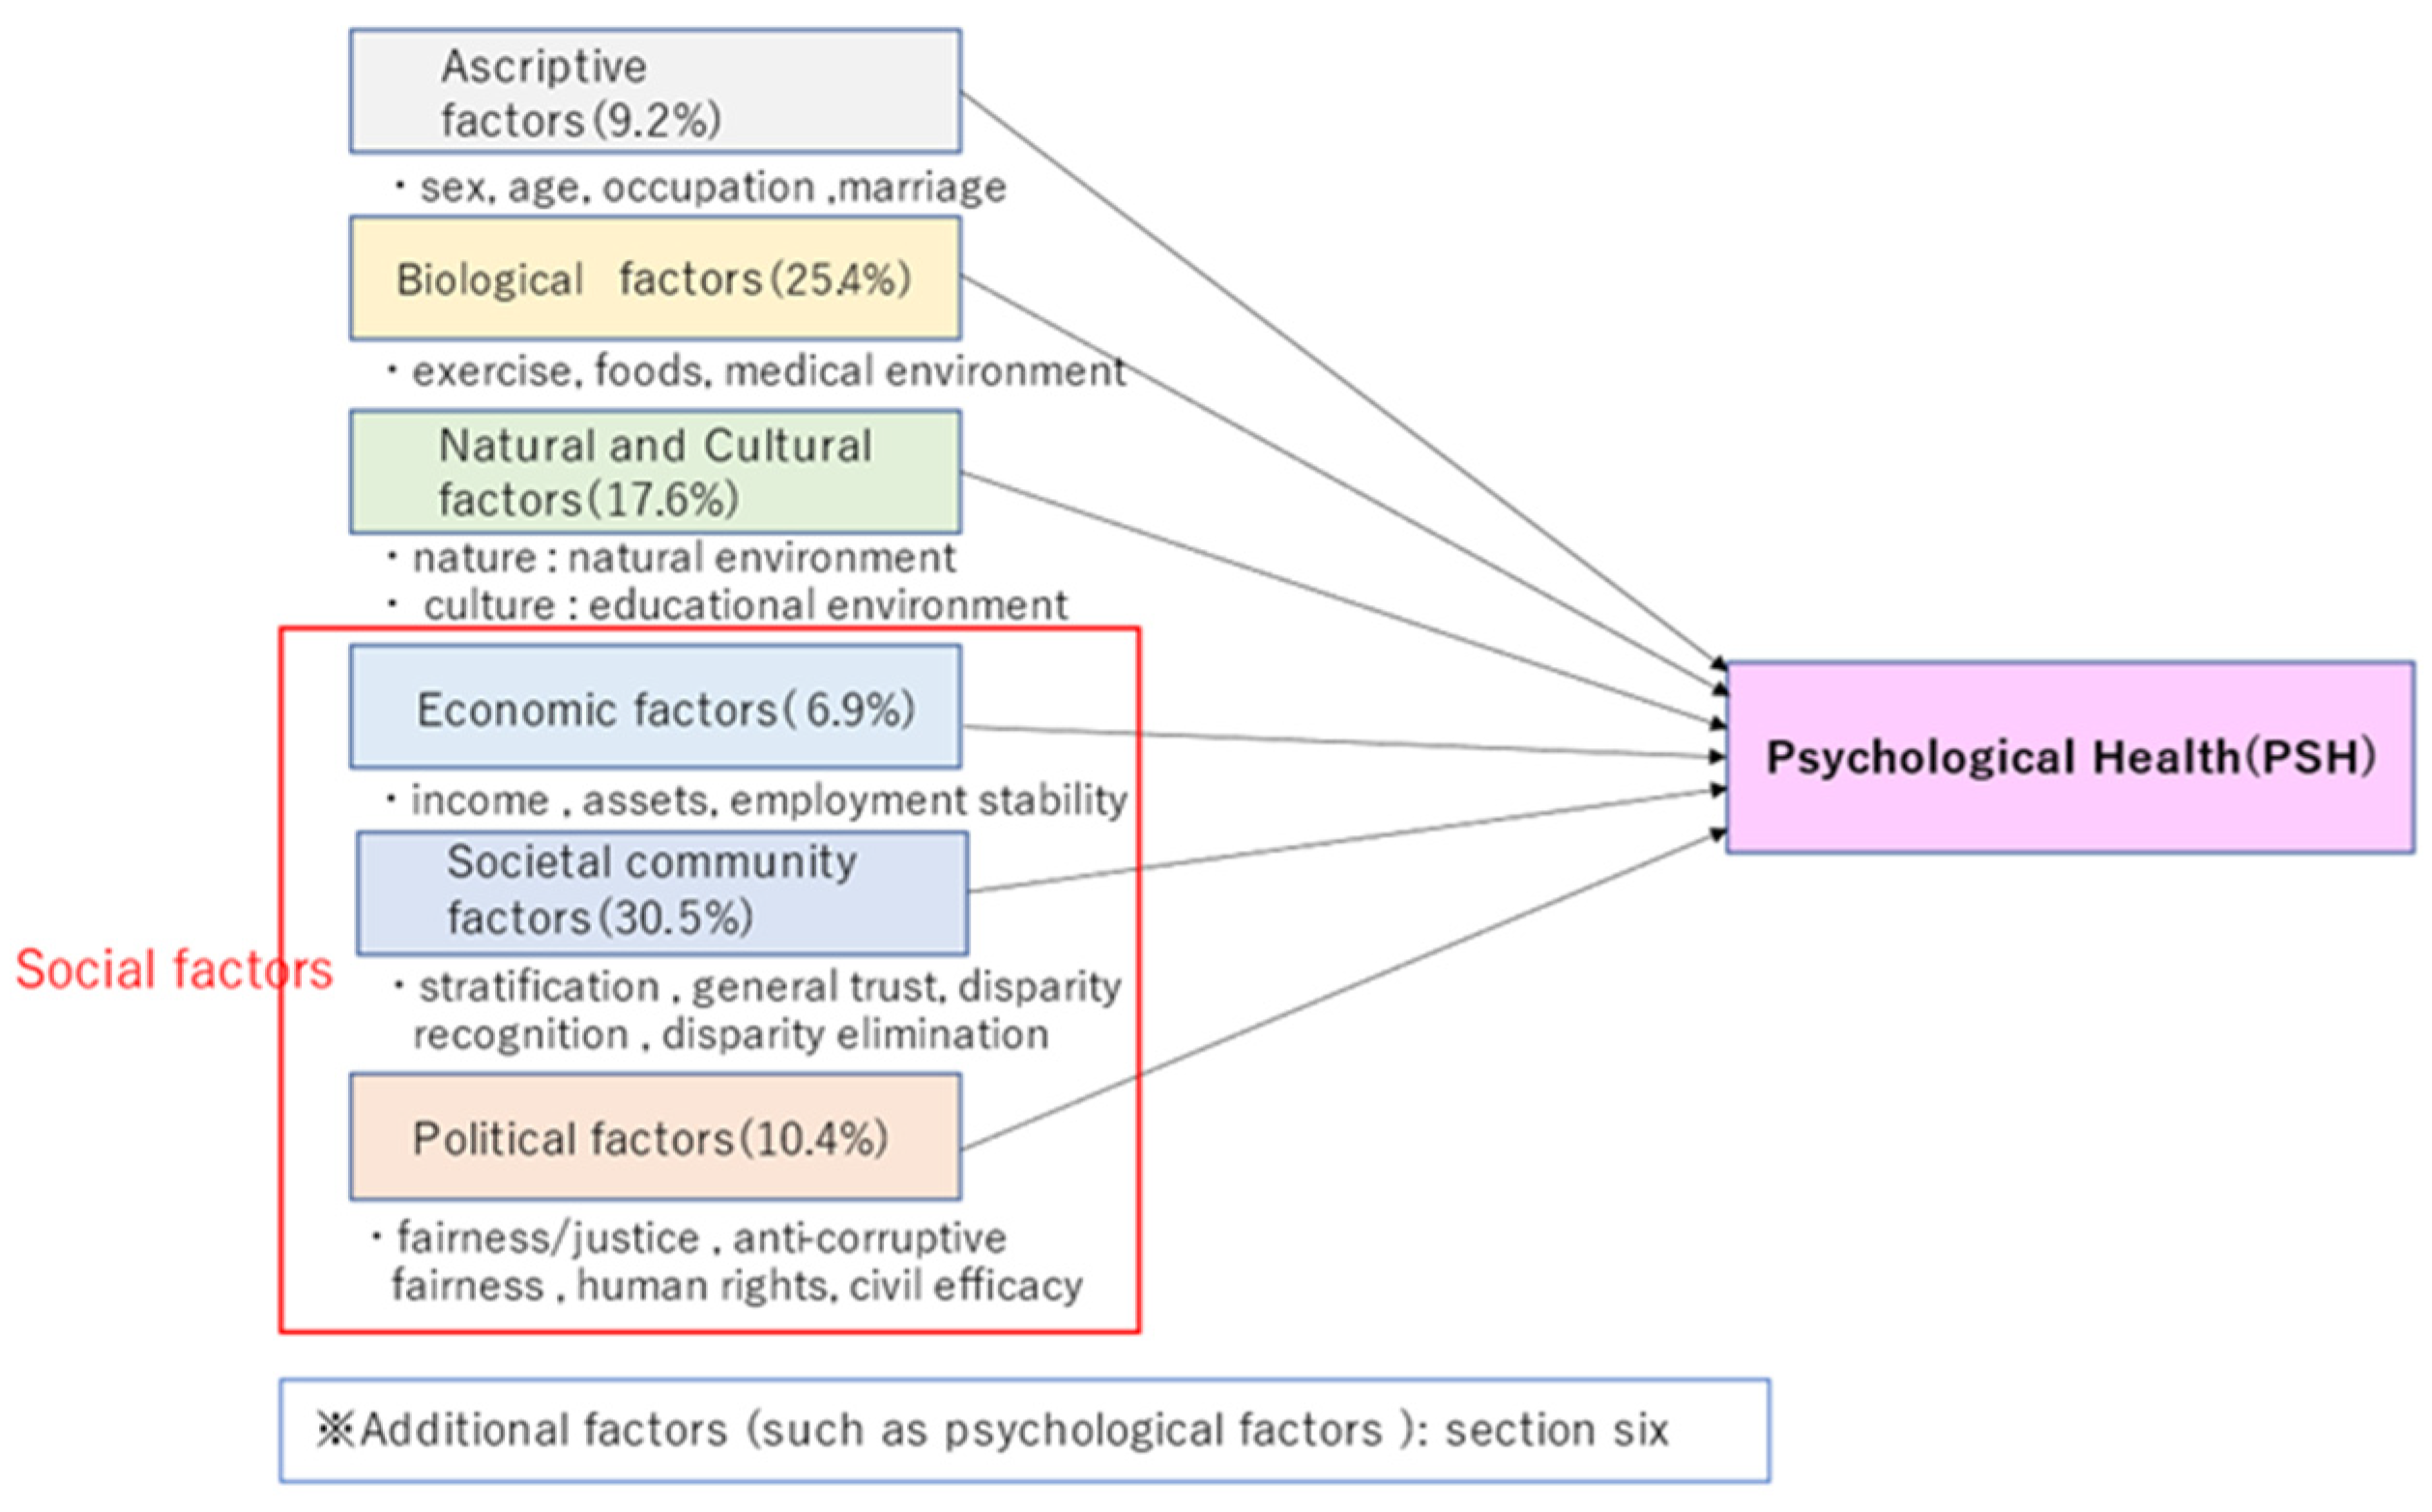
5.1. Correlations with Psychological Health Inequalities
- ascriptive factors: sex, age, occupation, marriage
- 2.
- biological factors: exercise, foods, medical environment
- 3.
- Natural and cultural factors: natural environment, educational environment
- 4.
- Economic factors: income, assets, employment stability
- 5.
- Societal community factors: stratification satisfaction, general trust, disparity recognition, disparity elimination
- 6.
- Political factors: fairness/justice, anti-corruptive fairness, human rights, and civil efficacy
5.2. Multiple Regression Analyses on Psychological Health
6. Results 3: Psychological Dynamics under COVID-19
6.1. Factors Concerning Mental Changes under COVID-19: Appearance of Disparity Recognition and Fairness/Justice
6.2. Factors Concerning Feeling Changes under COVID-19: Importance of Disparity Recognition, Fairness, and Justice
6.3. Pivotal Factors of Fair/Just Society and Distributive Justice in the COVID-19 Crisis
7. Discussions on Multi-Dimensional Dynamics of Health Disparities
7.1. Multi-Dimensional Inequalities/Disparities and Policy Implications
7.2. Philosophical Implications: Multi-Dimensional, Multi-Layered, and Ethical Fairness/Justice against Psychological Health Disparity
7.3. Dynamism in the COVID-19 Crisis: Critical Significance and Causality of Fairness and Justice
8. Limit of This Study
9. Summary and Implications: Protective Intervention on Multi-Dimensional Disparity for Fair/Just Society
10. Conclusions
Author Contributions
Funding
Institutional Review Board Statement
Informed Consent Statement
Data Availability Statement
Acknowledgments
Conflicts of Interest
Appendix A. Questions in the Three Surveys
Appendix A.1. Factors in Survey 1 and Survey 2
| Category | Factor | Survey 1 | Survey 2 | Answer |
| Ascriptive factors | sex | Please let us know your sex. | Please let us know your sex. | 1 (Male), 2 (Female) |
| age | Please let us know your age. | Please let us know your age. | ||
| occupation | Please let us know your occupation. | Please let us know your occupation. | See Appendix B, “Occupation” | |
| marriage | Are you married? | Are you married? | See Appendix B, “Marital status” | |
| Biological factors | exercise/foods | Do you think you are doing healthy exercise and eating? | 1 = not at all, 10 = very much | |
| exercise | Do you consider your exercise habits to be adequate? | |||
| foods | Do you consider yourself to eat healthily? | |||
| medical environment | Do you think the medical environment in your neighborhood, such as hospitals and pharmacies, is well-developed? | Do you think the medical environment in your neighborhood, such as hospitals and pharmacies, is well-developed? | ||
|
Natural and Cultural factors | natural environment | How rich and blessed do you feel about the natural environment surrounding you? | Do you think the natural environment surrounding you is good? | 1 = not at all, 10 = very much |
| educational environment | How well do you feel about your own educational or lifelong learning environment and the learning environment of the children around you? | Do you think your own educational or lifelong learning and the learning environment of children around you are fulfilling? | ||
| Economic factors | income | Do you think your income is sufficient for you to make a living now that COVID-19 has struck? | Do you think your income is sufficient to live your life? | 1 = not at all, 10 = very much |
| assets | Do you think you have sufficient assets (financial, house, land, car, etc.) to live your life now that COVID-19 has occurred? | Do you consider your assets (financial, house, land, car, etc.) sufficient for your life? | ||
| employment stability | Now that COVID-19 has occurred, do you consider your employment to be stable? | Do you feel that you have stability in your employment? | ||
| Societal community factors | stratification satisfaction | I think I am satisfied with my social status and stratification. | Are you satisfied with your social status and stratification? | 1 = not at all, 10 = very much |
| general trust | Do you find people generally trustworthy? | Do you find people generally trustworthy? | ||
| disparity recognition | How much disparity do you think exists in the society around you? | Do you think that there is a disparity in the society around you? | ||
| disparity elimination | Do you think that the society around you realizes the elimination of disparities (equal society) through social welfare and redistribution through taxes? | Do you think that the society around you realizes the elimination of disparity (equal society) through social welfare and redistribution through taxes? | ||
| Political factors | fairness/justice | I believe that fairness and justice are achieved in our country’s politics in terms of decision-making, the disparity between rich and poor, and so on. | Do you think that Japanese politics achieve fairness and justice in terms of decision-making, the disparity between rich and poor, and so on? | 1 = not at all, 10 = very much |
| Anti-corruptive fairness | I think that my government is corruption-free and fair. | Do you think that the Japanese government is corruption-free and fair? | ||
| human rights | I believe that fundamental human rights are respected in my country. | Do you think that fundamental human rights are respected in Japan? | ||
| civil efficacy | How much do you think you can change the society and politics around you in a desirable direction through your involvement? | Do you want to change the society and politics around you in a desirable direction through your involvement? |
| Contribution Optimism | contribution | Do you want to contribute to society? | 0 = not at all, 10 = completely |
| optimism | How optimistic would you say you are about your future? | ||
| Fair society Just society | fair society | All things to be considered, I think our current society is fair. | 0 = not at all, 10 = completely |
| just society | All things to be considered, I think our current society is just. | ||
| Fair/Just Society * | 1 | All things to be considered, I think our current society is fair. | 0 = not at all, 10 = completely |
| 2 | All things to be considered, I think our current society is unfair. | ||
| 3 | All things to be considered, I think our current society is just. | ||
| 4 | All things to be considered, I think our current society is unjust. | ||
| Distributive Justice ** | disparity of justice | Do you think the disparity in Japan is in the right/just state? | 0 = not at all, 10 = completely |
| welfare justice | Do you think that welfare is rightly/justly correcting the disparity in current society? | ||
| Made by the authors. Notes: * The score for Fair society/Just society is calculated as the “sum of the scores for the items 1, 2, 3 and 4” divided by 4. The score for item 2 and item 4 is calculated by the subtraction of 11 from the original figure. ** As for Distributive Justice, the score is calculated by “the sum of the scores for the disparity of justice, welfare justice, and disparity elimination” divided by 3. | |||
Appendix A.2. Changes
- Mental Changes (Survey 1)
| Item | Survey 1 |
| Mental change | Mental changes, such as anxiety and restlessness. |
- Feelings Changes (Survey 1 & 2)
| Item | Survey 1·2 |
| Increased light feelings | My mental state was lighter than usual. |
| Increased dark feelings | My mental state was darker than usual. |
| Increased anxiety | My mental state was more anxious than usual. |
| Increased depression | My mental state was more depressed than usual. |
| Note: For both Survey 1 and Survey 2, the multiple-choice from the ten items is applied. The table above lists the variables used in this paper alone. | |
Appendix A.3. PERMA Profiler, SWLS, I COPPE, and Revised HEMA—R
- SWLS
| Question | Answer in this survey | Original answer | |
| 1 | In most ways, my life is close to my ideal. | 1 = Strongly disagree, 10 = Strongly agree | 1 = strongly disagree, 2 = Disagree, 3 = Slightly disagree, 4 = Neither agree nor disagree, 5 = Slightly agree, 6 = Agree, 7 = Strongly agree |
| 2 | The conditions of my life are excellent. | ||
| 3 | I am satisfied with my life. | ||
| 4 | So far, I have gotten the important things I want in life. | ||
| 5 | If I could live my life over, I would change almost nothing. | ||
| Notes: For details, see the site on SWLS (http://labs.psychology.illinois.edu/~ediener/SWLS.html, accessed on 19 November 2022). | |||
- PERMA Profiler
| # | Label | Question | Answer in This Survey | Original Response Anchors |
| Block 1 | A1 | How much of the time do you feel you are making progress toward accomplishing your goals? | 1 = not at all, 10 = completely | 0 = never, 10 = always |
| E1 | How often do you become absorbed in what you are doing? | |||
| P1 | In general, how often do you feel joyful? | |||
| N1 | In general, how often do you feel anxious? | |||
| A2 | How often do you achieve the important goals you have set for yourself? | |||
| Block 2 | H1 | In general, how would you say your health is? | 0 = terrible, 10 = excellent | |
| Block 3 | M1 | In general, to what extent do you lead a purposeful and meaningful life? | 0 = not at all, 10 = completely | |
| R1 | To what extent do you receive help and support from others when you need it? | |||
| M2 | In general, to what extent do you feel that what you do in your life is valuable and worthwhile? | |||
| E2 | In general, to what extent do you feel excited and interested in things? | |||
| Lon | How lonely do you feel in your daily life? | |||
| Block 4 | H2 | How satisfied are you with your current physical health? | 0 = not at all, 10 = completely | |
| Block 5 | P2 | In general, how often do you feel positive? | 0 = never, 10 = always | |
| N2 | In general, how often do you feel angry? | |||
| A3 | How often are you able to handle your responsibilities? | |||
| N3 | In general, how often do you feel sad? | |||
| E3 | How often do you lose track of time while doing something you enjoy? | |||
| Block 6 | H3 | Compared to others of your same age and sex, how is your health? | 0 = terrible, 10 = excellent | |
| Block 7 | R2 | To what extent do you feel loved? | 0 = not at all, 10 = completely | |
| M3 | To what extent do you generally feel you have a sense of direction in your life? | |||
| R3 | How satisfied are you with your personal relationships? | |||
| P3 | In general, to what extent do you feel contented? | |||
| Block 8 | hap | Taking all things together, how happy would you say you are? | 0 = not at all, 10 = completely | |
| Notes: For details, see [95]. P = Positive emotions, E = Engagement, R = Relationships, M = Meaning, A = Accomplishment, H = Health, N = Negative emotions, Lon = Lonely, hap = happiness. | ||||
- I COPPE
| Label | Question | Answer in This Survey | Original Answer |
| OV_WB_PR | When it comes to the best possible life for you, on which number, do you stand now? | 1 = the worst your life can be 10 = the best your life can be | 0 = the worst your life can be 10 = the best your life can be |
| OV_WB_PA | When it comes to the best possible life for you, on which number, did you stand five years ago? | ||
| OV_WB_FU | When it comes to the best possible life for you, on which number, do you think you will stand five years from now? | ||
| IN_WB_PR | When it comes to relationships with important people in your life, on which number, do you stand now? | 1 = the worst your life can be 10 = the best your life can be | 0 = the worst your life can be 10 = the best your life can be |
| IN_WB_FU | When it comes to relationships with important people in your life, on which number, do you think you will stand five years from now? | ||
| CO_WB_PR | When it comes to the community where you live, on which number, do you stand now? | 1 = the worst your life can be 10 = the best your life can be | 0 = the worst your life can be 10 = the best your life can be |
| CO_WB_FU | When it comes to the community where you live, on which number, do you think you will stand five years from now? | ||
| OC_WB_PR | When it comes to your main occupation (employed, self-employed, volunteer, stay at home), on which number, do you stand now? | 1 = the worst your life can be 10 = the best your life can be | 0 = the worst your life can be 10 = the best your life can be |
| OC_WB_FU | When it comes to your main occupation (employed, self-employed, volunteer, stay at home), on which number, do you think you will stand five years from now? | ||
| PH_WB_PR | When it comes to your physical health, on which number, do you stand now? | 1 = the worst your life can be 10 = the best your life can be | 0 = the worst your life can be 10 = the best your life can be |
| PH_WB_FU | When it comes to your physical health, on which number, do you think you will stand five years from now? | ||
| PS_WB_PR | When it comes to your emotional and psychological well-being, on which number, do you stand now? | 1 = the worst your life can be 10 = the best your life can be | 0 = the worst your life can be 10 = the best your life can be |
| PS_WB_FU | When it comes to your emotional and psychological well-being, on which number, do you think you will stand five years from now? | ||
| EC_WB_PR | When it comes to your economic situation, on which number, do you stand now? | 1 = the worst your life can be 10 = the best your life can be | 0 = the worst your life can be 10 = the best your life can be |
| EC_WB_FU | When it comes to your economic situation, on which number, do you think you will stand five years from now? | ||
| Notes: For details, see [96]. OV_WB = Overall Well-Being, IN_WB = Interpersonal Well-Being, CO_WB = Community Well-Being, OC_WB = Occupational Well-Being, PH_WB = Physical Well-Being, PS_WB = Psychological Well-Being, EC_WB = Economic Well-Being. PR = Present, PA = Past, FU = Future. In the original survey, the treatment of PA (Past) is applied to variables from IN_WB to EC_WB; in our survey, this was not applied. In addition, there was OV_WB_PA in our survey, but this study did not use the question. In the original survey (above), PA (Past) denotes “a year ago”, and FU(Future) denotes “a year from now”; in our survey, these are modified to “five years ago” and “five years from now”, respectively. The reason for this modification (from one year to five years) is to ensure that respondents consider their situation well before (for the case of PA) or well after (for the case of FU) the outbreak of COVID-19. | |||
- Revised HEMA—R
| Question | Answer in This Survey | Original answer | |
| 1 | Seeking relaxation? | 1 = not at all, 10 = very much | 1 = not at all, 7 = very much |
| 2 | Seeking to develop a skill, learn, or gain insight into something? | ||
| 3 | Seeking to do what you believe in? | ||
| 4 | Seeking pleasure? | ||
| 5 | Seeking to pursue excellence or a personal ideal? | ||
| 6 | Seeking enjoyment? | ||
| 7 | Seeking to take it easy? | ||
| 8 | Seeking to use the best in yourself? | ||
| 9 | Seeking fun? | ||
| 10 | Seeking to contribute to others or the surrounding world? | ||
| Notes: For details, see [104]. In this survey, the response scale of 1 (not at all) to 10 (very much) is adopted. | |||
Appendix B. Respondents of the Three Surveys (after Data Screening)
| Survey 1 (%) | Survey 2 (%) | Survey 3 (%) | |
| Number of respondents | 4698 | 6855 | 2472 |
| Number of survey questions | 383 | 401 | 174 |
| Residence | |||
| 16 prefectures with big cities | 2783(59.2) | 1520(22.2) | 1207(48.8) |
| 32 prefectures without big cities | 1915(40.8) | 5335(77.8) | 1265(51.2) |
| Sex | |||
| Male | 2283(48.6) | 4404(64.2) | 1626(65.8) |
| Female | 2415(51.4) | 2451(35.8) | 846(34.2) |
| Age | |||
| 10’s | 790(16.8) | 36(0.5) | 7(0.3) |
| 20’s | 759(16.2) | 460(6.7) | 125(5.1) |
| 30’s | 785(16.7) | 1038(15.1) | 346(14.0) |
| 40’s | 783(16.7) | 1726(25.2) | 610(24.7) |
| 50’s | 777(16.5) | 1740(25.4) | 626(25.3) |
| 60’s | 804(17.1) | 1236(18.0) | 480(19.4) |
| 70’s and more | 619(9.0) | 278(11.2) | |
| Marital status | |||
| married | 2172(46.2) | 4074(59.4) | 1418(57.4) |
| unmarried | 2301(49.0) | 2242(32.7) | 846(34.2) |
| separation | 225(4.8) | 539(7.9) * | 208(8.4) ** |
| Occupation | |||
| executive of a company or association | 44(0.9) | 123(1.8) | 53(2.1) |
| office worker, staff of an association | 1386(29.5) | 2085(30.4) | 734(29.7) |
| Part-time employee, contract employee, dispatched labor | 206(4.4) | 1196(17.4) | 433(17.5) |
| Part-time worker, part-time job, home-based workers without an employment contract | 585(12.5) | 17(0.2) | 7(0.3) |
| civil servants | 140(3.0) | 253(3.7) | 68(2.8) |
| Self-employed, family employee, freelance | 286(6.1) | 818(11.9) | 294(11.9) |
| faculty member | 123(1.8) | 39(1.6) | |
| student | 795(16.9) | 95(1.4) | 26(1.1) |
| homemaker | 700(14.9) | 766(11.2) | 292(11.8) |
| pensioner | 147(3.1) | 603(8.8) | 267(10.8) |
| none | 365(7.8) | 690(10.1) | 240(9.7) |
| others | 44(0.9) | 86(1.3) | 19(0.8) |
| Education | |||
| currently attending high school | 351(7.5) | 43(0.6) | 7(0.3) |
| currently attending vocational college, specialized training college | 75(1.6) | 84(1.2) | 26(1.1) |
| currently attending junior college, college | 48(1.0) | 47(0.7) | 8(0.3) |
| university/college preparatory school | 14(0.3) | 4(0.1) | |
| currently attending university | 366(7.8) | 88(1.3) | 35(1.4) |
| currently attending a Master’s or Doctoral course | 22(0.5) | 19(0.3) | 3(0.1) |
| junior high school | 70(1.5) | 175(2.6) | 50(2.0) |
| high school | 997(21.2) | 2153(31.4) | 664(26.9) |
| vocational college, specialized training college | 370(7.9) | 638(9.3) | 240(9.7) |
| junior college, college | 404(8.6) | 598(8.7) | 217(8.8) |
| university | 1778(37.8) | 2657(38.8) | 1081(43.7) |
| more than a Master’s degree | 203(4.3) | 349(5.1) | 141(5.7) |
| Notes: * divorce 418 (6.1)/death 121 (1.8). ** divorce 161 (6.5)/death 47 (1.9). | |||
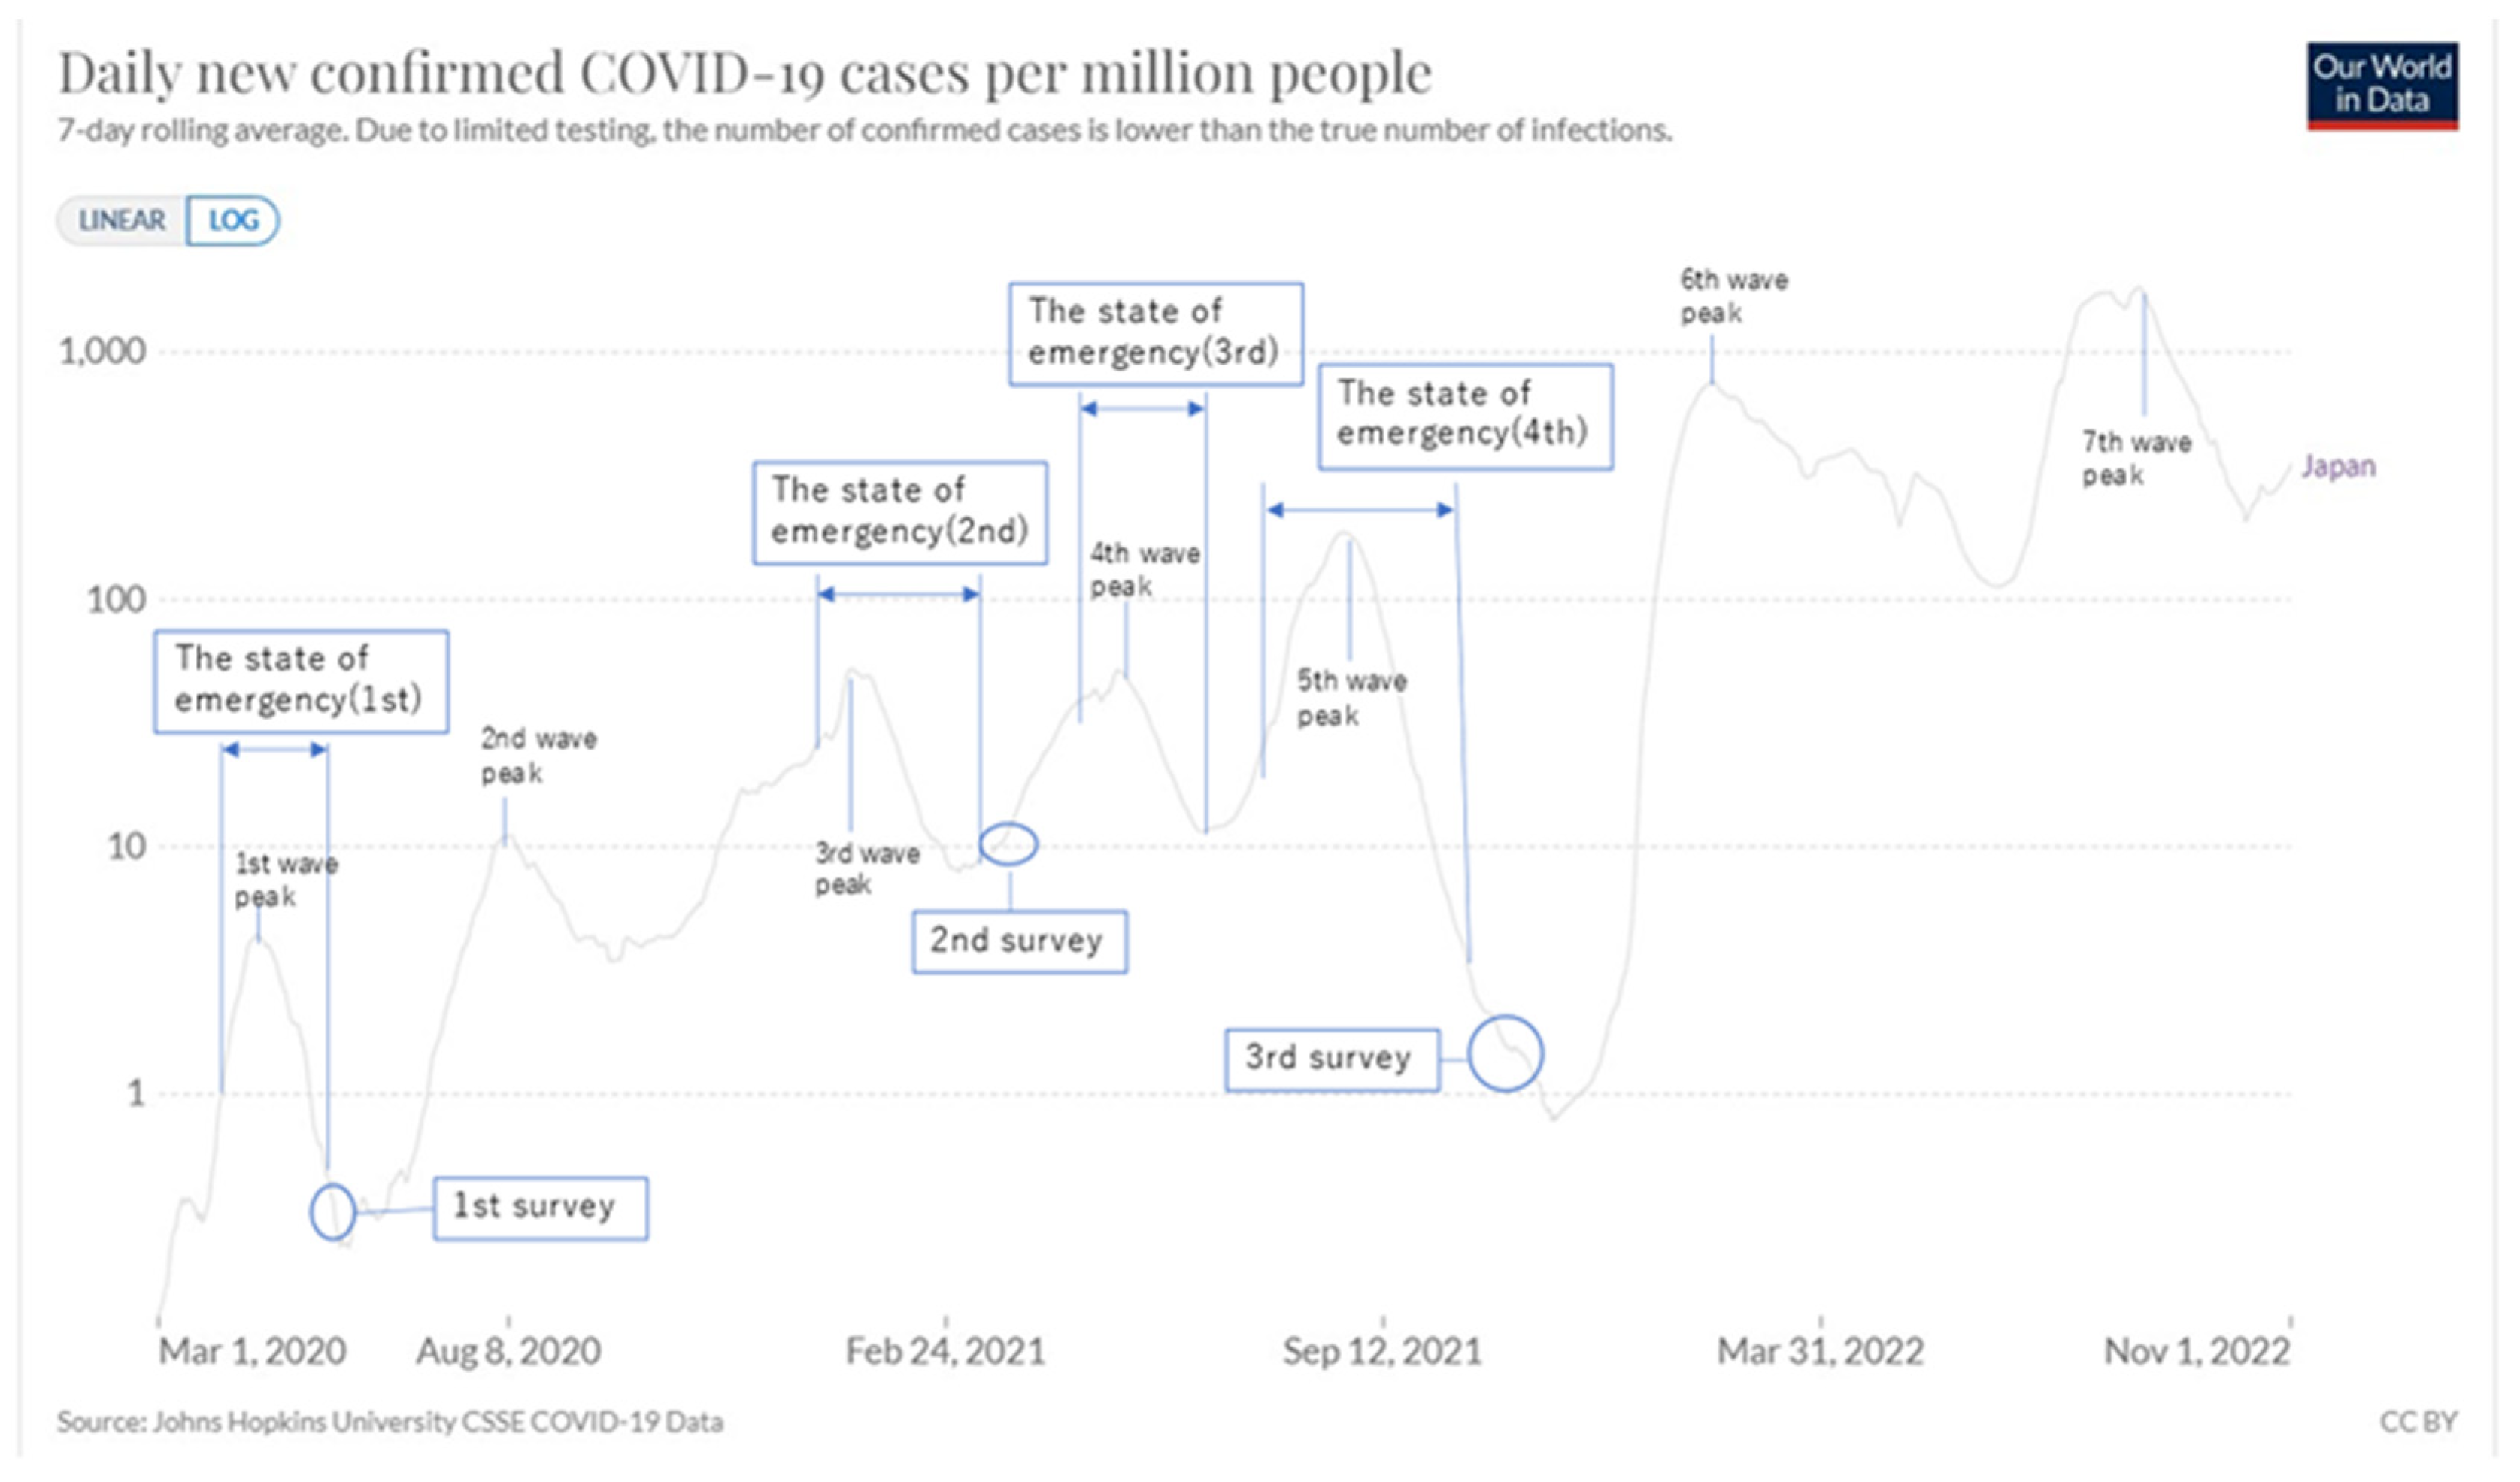
Appendix C. Situation of COVID-19 in Japan (January 2020-April 2022)
| Day/Month/Year | The Situation in Japan and in the World Where Relevant | |
| 14/01/2020 | WHO confirmed the new corona disease. | |
| 15/01/2020 | Infection was first confirmed in Japan. | |
| 31/01/2020 | The government designated the infectious disease caused by the new coronavirus as a “designated infectious disease”. | |
| 03/02/2020 | The cruise ship “Diamond Princess”, with confirmed passenger infection, arrived at Yokohama Port. | |
| 27/02/2020 | Prime Minister Abe announced the intention to request the temporary closure of all elementary, junior high, and high schools nationwide. | |
| 28/02/2020 | The Governor of Hokkaido independently issued a “State of Emergency”. | |
| 10/03/2020 | The government designated the coronavirus situation as a “historical emergency” for the first time. | 1st wave |
| 11/03/2020 | WHO declared a “pandemic”. | |
| 24/03/2020 | It was decided to postpone the Tokyo Olympics and Paralympics for about one year. | |
| 01/04/2020 | Prime Minister Abe announced a policy of distributing two cloth masks to households nationwide. | |
| 07/04/2020 | The “State of Emergency”(1st) based on the Act on Special Measures against the New Coronavirus was issued to the seven prefectures of Tokyo, Kanagawa, Saitama, Chiba, Osaka, Hyogo, and Fukuoka. (The declaration was effective until 6 May 2020.) | |
| 16/04/2020 | The area subject to a “State of Emergency” was expanded to the whole country (the declaration was to take effect until 6 May). | |
| Thirteen prefectures (Tokyo, Kanagawa, Saitama, Chiba, Osaka, Hyogo, Fukuoka, Hokkaido, Ibaraki, Ishikawa, Gifu, Aichi, and Kyoto) were designated as “Special Warning Prefectures”. | ||
| 16/04/2020 | Prime Minister Abe announced his intention to provide 100,000 yen per person to all citizens. | |
| 18/04/2020 | The number of infected people in Japan exceeded 10,000. | |
| 04/05/2020 | It was officially decided to extend the “State of Emergency“ until 31 May while keeping the area subject to it nationwide. | |
| 14/05/2020 | The “State of Emergency“ was lifted in 39 prefectures. | |
| Eight prefectures of Hokkaido, Tokyo, Kanagawa, Chiba, Saitama, Osaka, Hyogo, and Kyoto continued to declare a “State of Emergency.“ | ||
| 25/05/2020 | The State of Emergency was lifted nationwide. | |
| 02/06/2020 | The first survey started. | |
| 04/06/2020 | The first survey was completed. | |
| 16/07/2020 | The daily number of infected people in Japan exceeded 600. | 2nd wave |
| 26/07/2020 | The total number of infected people in Japan exceeded 30,000. | |
| 11/08/2020 | The total number of infected people in Japan exceeded 50,000. | |
| 16/09/2020 | The Abe Cabinet resigned, and the new Suga Cabinet was formed. | |
| 07/01/2021 | Tokyo, Saitama, Chiba, and Kanagawa declared a “State of Emergency“(2nd) (for the period until 7 February). | 3rd wave |
| 13/01/2021 | In addition to Tokyo and its neighboring three prefectures (Kanagawa, Saitama, and Chiba), The “State of Emergency“ was declared in seven prefectures: Osaka, Hyogo, Kyoto, Aichi, Gifu, Fukuoka, and Tochigi. | |
| It was decided to suspend the entry of foreigners completely. | ||
| 17/02/2021 | Advanced vaccination of the new coronavirus vaccine began for medical workers. | |
| 26/02/2021 | The “State of Emergency“ was lifted in six prefectures: Osaka, Hyogo, Kyoto, Aichi, Gifu, and Fukuoka. | |
| 21/03/2021 | The “State of Emergency” in Tokyo, Saitama, Chiba, and Kanagawa was lifted. | 4th wave |
| 24/03/2021 | The second survey started. | |
| 25/03/2021 | The second survey was completed. | |
| 05/04/2021 | The three prefectures of Osaka, Hyogo, and Miyagi were subjected to “Priority Measures to Prevent the Spread of Disease” for one month, from 5 April to 5 May. | |
| 12/04/2021 | Corona vaccination for the elderly began. | |
| The “Priority Measures to Prevent the Spread of Disease” was applied to the three prefectures of Tokyo, Kyoto, and Okinawa (until 5 May in Kyoto and Okinawa, and until 11 May in Tokyo). | ||
| 20/04/2021 | The four prefectures of Saitama, Chiba, Kanagawa, and Aichi were subjected to “Priority Measures to Prevent the Spread of Disease”. | |
| 23/04/2021 | The “Priority Measures to Prevent the Spread of Disease” was applied to Ehime. | |
| 25/04/2021 | The “State of Emergency“ (3rd) was declared in Tokyo, Osaka, Hyogo, and Kyoto (for the period until May 11). | |
| 07/05/2021 | It was decided to extend the “State of Emergency” to the four prefectures of Tokyo, Osaka, Hyogo, and Kyoto until 31 May. | |
| 09/05/2021 | The three prefectures of Hokkaido, Gifu, and Mie were subjected to “Priority Measures to Prevent the Spread of Disease”. | |
| 12/05/2021 | Aichi and Fukuoka declared a “State of Emergency.“ | |
| 16/05/2021 | Hokkaido, Okayama, and Hiroshima declared a “State of Emergency.“ | |
| The three prefectures of Gunma, Ishikawa, and Kumamoto were subjected to “Priority Measures to Prevent the Spread of the Disease”. | ||
| 23/05/2021 | A “State of Emergency“ was declared in Okinawa (for the period until 20 June). | |
| 28/05/2021 | It was decided to extend the deadline of 31 May for the “State of Emergency” declared in the nine prefectures of Hokkaido, Tokyo, Aichi, Osaka, Hyogo, Kyoto, Okayama, Hiroshima, and Fukuoka to 20 June. | |
| It was decided to extend the deadline for “Priority Measures to Prevent the Spread of Disease” in the five prefectures of Saitama, Chiba, Kanagawa, Gifu, and Mie until 20 June. | ||
| 20/06/2021 | The “State of Emergency” issued to 10 prefectures was lifted in 9 prefectures except for Okinawa. | |
| The seven prefectures of Hokkaido, Tokyo, Aichi, Osaka, Hyogo, Kyoto, and Fukuoka shifted from a “State of Emergency“ to“ priority measures to prevent the spread of the disease“ (for the period until 11 July.) | ||
| Priority Measures to Prevent the Spread of Disease in Gifu and Mie were lifted (Saitama, Chiba, and Kanagawa prefectures extended the period until 11 July). | ||
| 12/07/2021 | The “State of Emergency“(4th) was declared for Tokyo (for the period until 22 August). | 5th wave |
| The “State of Emergency” in Okinawa was extended until 22 August. | ||
| The “Priority Measures to Prevent the Spread of the Disease” in Saitama, Chiba, Kanagawa, and Osaka were extended until 22 August (lifted in Hokkaido, Aichi, Kyoto, Hyogo, and Fukuoka). | ||
| 23/07/2021 | The Tokyo Olympics began. | |
| 02/08/2021 | In addition to Tokyo and Okinawa, a “State of Emergency“ was declared in Saitama, Chiba, Kanagawa, and Osaka (for the period until 31 August). | |
| Five prefectures of Hokkaido, Ishikawa, Hyogo, Kyoto, and Fukuoka were subjected to “Priority Measures to Prevent the Spread of Disease“ (for the period until 31 August). | ||
| 08/08/2021 | The Tokyo Olympics came to a close. | |
| The eight prefectures of Fukushima, Ibaraki, Tochigi, Gunma, Shizuoka, Aichi, Shiga, and Kumamoto were subjected to “Priority Measures to Prevent the Spread of Disease” (for the period until 31 August). | ||
| 20/08/2021 | The “State of Emergency“ was declared in seven prefectures: Ibaraki, Tochigi, Gunma, Shizuoka, Kyoto, Hyogo, and Fukuoka. In addition, Tokyo, Okinawa, Saitama, Chiba, Kanagawa, and Osaka have been extended (the new period was until 12 September). | |
| “Priority Measures to Prevent the Spread of Disease” was applied to 10 prefectures: Miyagi, Yamanashi, Toyama, Gifu, Mie, Okayama, Hiroshima, Kagawa, Ehime, and Kagoshima (for the period until 12 September). | ||
| 24/08/2021 | The Tokyo Paralympic Games began. | |
| 27/08/2021 | The “State of Emergency“ was declared in Hokkaido, Miyagi, Gifu, Aichi, Mie, Shiga, Okayama, and Hiroshima (for the period until 12 September). | |
| The four prefectures of Kochi, Saga, Nagasaki, and Miyazaki were subjected to “Priority Measures to Prevent the Spread of Disease” (for the period until 12 September). | ||
| 05/09/2021 | The Tokyo Paralympic Games came to a close. | |
| 13/09/2021 | The “State of Emergency“ in 19 prefectures, including Tokyo and Osaka, was extended until 30 September. Miyagi Prefecture and Okayama Prefecture shifted to “Priority Measures to Prevent the Spread of the Disease. “ | |
| The six prefectures of Toyama, Yamanashi, Ehime, Kochi, Saga, and Nagasaki lifted their “Priority Measures to Prevent the Spread of Disease”. | ||
| “Priority Measures to Prevent the Spread of the Disease“ in Miyagi, Fukushima, Ishikawa, Okayama, Kagawa, Miyazaki, Kumamoto, and Kagoshima were extended until 30 September. | ||
| 28/09/2021 | The government decided to lift all 19 prefectures’ “State of Emergency” and eight prefectures’ “Priority Measures to Prevent the Spread of Disease” on 30 September. | |
| 30/09/2021 | The “State of Emergency” of 19 prefectures and the “Priority Measures to Prevent the Spread of Disease” of 8 prefectures were lifted. | |
| 04/10/2021 | The Suga cabinet resigned, and the new Kishida cabinet was formed. | |
| 26/10/2021 | The number of people who received the second dose of the new coronavirus vaccine exceeded 70% of the total population. | |
| The third survey started. | ||
| 28/10/2021 | The third survey was completed. | |
| 01/12/2021 | The third round of new coronavirus vaccination began nationwide for medical workers. | 6th wave |
| 09/01/2022 | “Priority Measures to Prevent the Spread of the Disease“ were applied to the three prefectures of Okinawa, Yamaguchi, and Hiroshima (for the period until 31 January). | |
| 21/01/2022 | “Priority Measures to Prevent the Spread of Disease“ were applied to 13 prefectures of Tokyo, Saitama, Chiba, Kanagawa, Gunma, Niigata, Aichi, Gifu, Mie, Kagawa, Nagasaki, Kumamoto, and Miyazaki (for the period until 13 February). | |
| 27/01/2022 | “Priority Measures to Prevent the Spread of Disease” were applied to 18 prefectures: Hokkaido, Aomori, Yamagata, Fukushima, Ibaraki, Tochigi, Ishikawa, Nagano, Shizuoka, Kyoto, Osaka, Hyogo, Shimane, Okayama, Fukuoka, Saga, Oita, and Kagoshima (for the period until 20 February). | |
| The period for the “Priority Measures to Prevent the Spread of Disease” in Okinawa, Yamaguchi, and Hiroshima was extended to 20 February. | ||
| 05/02/2022 | “Priority Measures to Prevent the Spread of Disease” was applied to Wakayama (for the period until 27 February 2022). | |
| 12/02/2022 | “Priority Measures to Prevent the Spread of the Disease“ were applied to Kochi (for the period until 6 March). | |
| 13/02/2022 | “Priority Measures to Prevent the Spread of the Disease“ in Tokyo, Saitama, Chiba, Kanagawa, Gunma, Niigata, Aichi, Gifu, Mie, Kagawa, Nagasaki, Kumamoto, and Miyazaki were extended until 6 March. | |
| 20/02/2022 | “Priority Measures to Prevent the Spread of Disease“ in Hokkaido, Aomori, Fukushima, Ibaraki, Tochigi, Ishikawa, Nagano, Shizuoka, Kyoto, Osaka, Hyogo, Okayama, Hiroshima, Fukuoka, Saga, and Kagoshima were extended until 6 March. | |
| “Priority Measures to Prevent the Spread of Disease” were lifted in Okinawa, Yamagata, Shimane, Yamaguchi, and Oita. | ||
| 06/03/2022 | “Priority Measures to Prevent the Spread of Disease” in Hokkaido, Aomori, Ibaraki, Tochigi, Gunma, Saitama, Chiba, Tokyo, Kanagawa, Ishikawa, Gifu, Shizuoka, Aichi, Kyoto, Osaka, Hyogo, Kagawa, and Kumamoto were extended until 21 March. | |
| “Priority Measures to Prevent the Spread of Disease“ in Fukushima, Niigata, Nagano, Mie, Wakayama, Okayama, Hiroshima, Kochi, Fukuoka, Saga, Nagasaki, Miyazaki, and Kagoshima were lifted. | ||
| 22/03/2022 | “Priority Measures to Prevent the Spread of Disease“ in Hokkaido, Aomori, Ibaraki, Tochigi, Gunma, Saitama, Chiba, Tokyo, Kanagawa, Ishikawa, Gifu, Shizuoka, Aichi, Kyoto, Osaka, Hyogo, Kagawa, and Kumamoto were lifted. | |
| Notes: The content of “State of Emergency” includes requests for cooperation in refraining from going out and restricting the use of facilities, as well as requests for cooperation necessary to prevent infection. The content of “Priority Measures to Prevent the Spread of Diseases” includes requests to restaurants to shorten their working hours until 8 p.m. and to inform customers of infection prevention measures such as wearing masks and prohibiting entry by those who do not comply with such measures, as well as requests to residents not to visit restaurants unnecessarily during the restricted hours. Source: Based on NHK Special site on New Corona Virus (https://www3.nhk.or.jp/news/special/coronavirus/chronology/, accessed on 19 November 2022). | ||
Appendix D. Multiple Regression Analysis of the Basic Factors (Surveys 1 and 2)
| PSH | Mental Change | |||
| Survey1 | Survey2 | Survey1 | ||
| R | 0.815 | 0.835 | 0.203 | |
| R2 | 0.664 | 0.697 | 0.041 | |
| adjusted R2 | 0.663 | 0.696 | 0.040 | |
| β | ||||
| Ascriptive factors(4) | Sex | 0.031** | 0.043** | |
| [13] | [5] | |||
| Age | −0.033* | 0.023** | 0.029* | |
| [11] | [13] | [7] | ||
| Occupation | 0.033** | 0.027** | ||
| [11] | [12] | |||
| Marriage | 0.052** | 0.031** | ||
| [10] | [10] | |||
| Biological factors(3/2) | Exercise/Foods | - | 0.296** | |
| - | [1] | |||
| Exercise | - | −0.060** | ||
| - | [2] | |||
| Foods | 0.155** | - | ||
| [2] | - | |||
| Medical environment | 0.078** | 0.106** | ||
| [8] | [5] | |||
| Natural and Cultural factors(2) | Natural environment | 0.114** | 0.088** | |
| [4] | [6] | |||
| Educational environment | 0.090** | 0.149** | ||
| [7] | [2] | |||
| Economic factors(3) | Income | 0.029* | ||
| [11] | ||||
| Assets | 0.061** | 0.046** | ||
| [9] | [7] | |||
| Employment stability | 0.036** | −0.039* | ||
| [9] | [6] | |||
| Societal community factors(4) | Stratification satisfaction | 0.322** | 0.137** | −0.087** |
| [1] | [4] | [1] | ||
| General trust | 0.126** | 0.144** | ||
| [3] | [3] | |||
| Disparity recognition | 0.034** | 0.053** | ||
| [14] | [4] | |||
| Disparity elimination | ||||
| Political factors(4) | Fairness/Justice | |||
| Anti-corruptive fairness | −0.076** | −0.048** | −0.058** | |
| [14] | [15] | [3] | ||
| Human rights | 0.103** | |||
| [6] | ||||
| Civil efficiency | 0.114** | 0.042** | ||
| [4] | [8] | |||
| Notes: ** p < 0.01, * p < 0.05. Independent variables: all basic factors, including Ascriptive factors. PSH and notes of other variables: see Table 1. Blank spaces indicate that the factor does not appear in the analysis. The figure in brackets indicates the order (from the highest) of the magnitude of each variable. “Exercise” and “Foods” are separately asked in Survey 1, while an integrated item, “exercise/Foods”, is asked in Survey 2. - indicates ‘no calculation.’ The italicized figures in parentheses indicate the number of variables in each category; as for biological factors, refer to Table 1. | ||||
Appendix E. Regression Analysis: Standardized Partial Regression Coefficients of the Basic Factors (Surveys 1 and 2)
Appendix E.1. Multiple Regression Analysis: Total Value of the Standardized Partial Regression Coefficients of Basic Variables for Each Category (Top 2 Items)
| PSH | Mental Change | |||
| Survey1 | Survey2 | Average | Survey1 | |
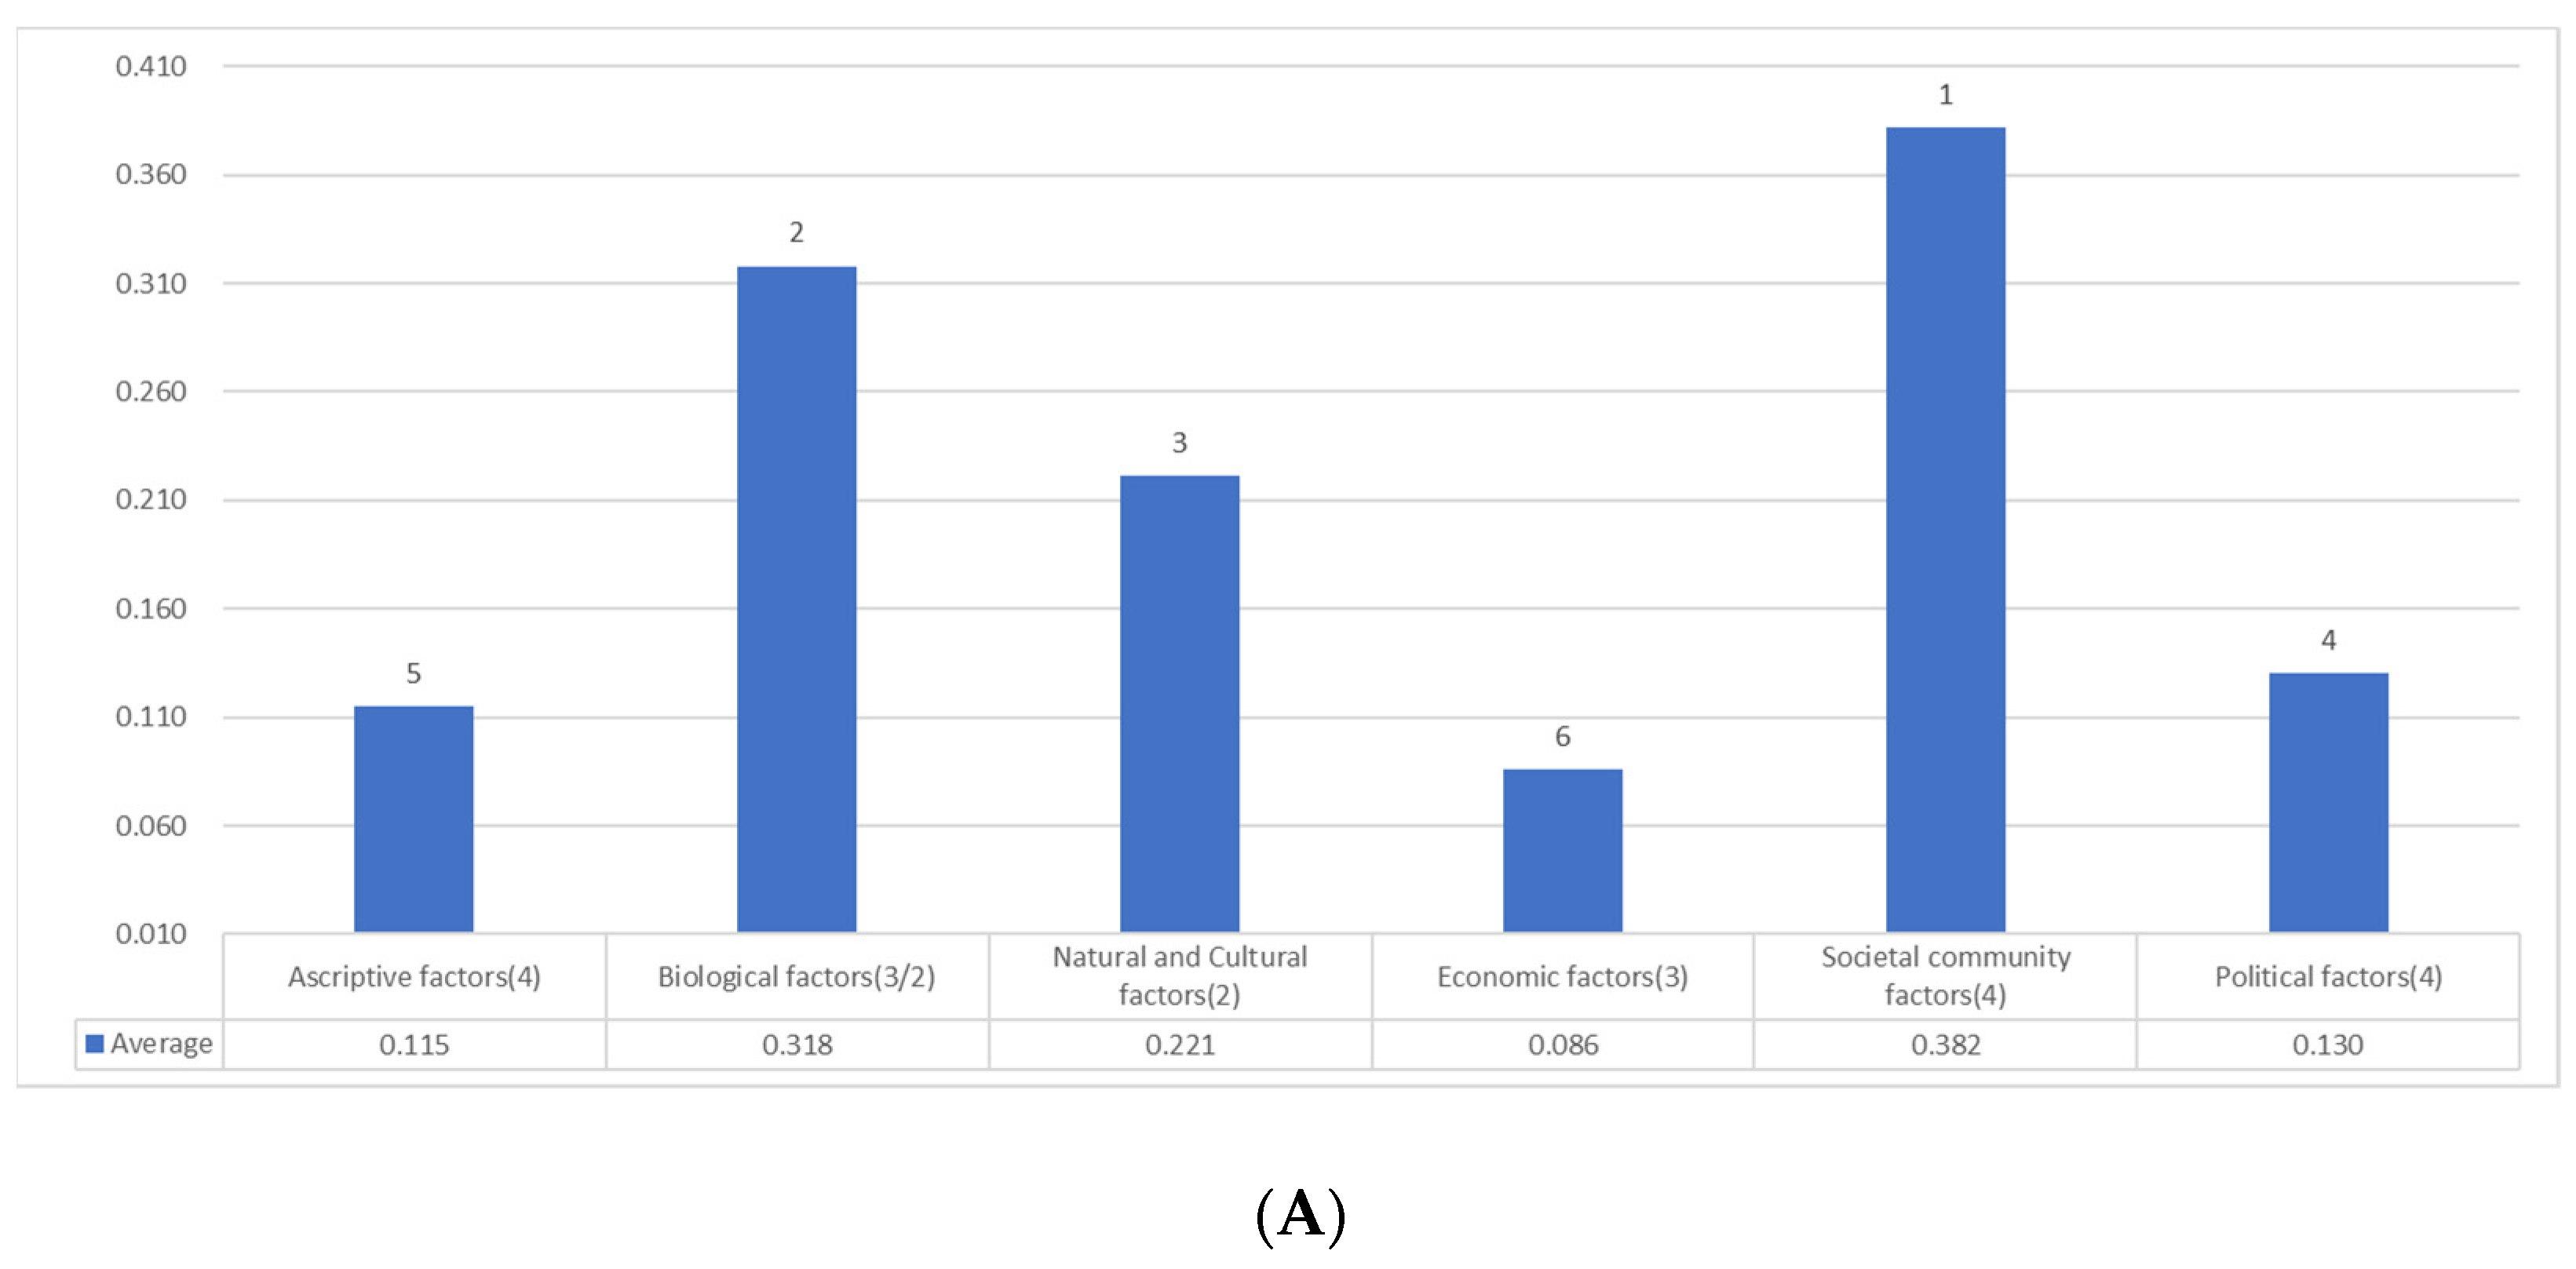
| Ascriptive factors(4) | 0.085(6.8%) | 0.058(5.3%) | 0.072(6.1%) | 0.072(19.5%) |
| [5] | [5] | [5] | [2] | |
| Biological factors(3/2) | 0.233(18.7%) | 0.402(36.5%) | 0.318(27.0%) | 0.060(16.3%) |
| [2] | [1] | [2] | [3]1 | |
| Natural and Cultural factors(2) | 0.204(16.3%) | 0.237(21.5%) | 0.221(18.8%) | |
| [3] | [3] | [3] | ||
| Economic factors(3) | 0.061(4.9%) | 0.082(7.4%) | 0.072(6.1%) | 0.039(10.6%) |
| [6]1 | [4] | [5] | [5]1 | |
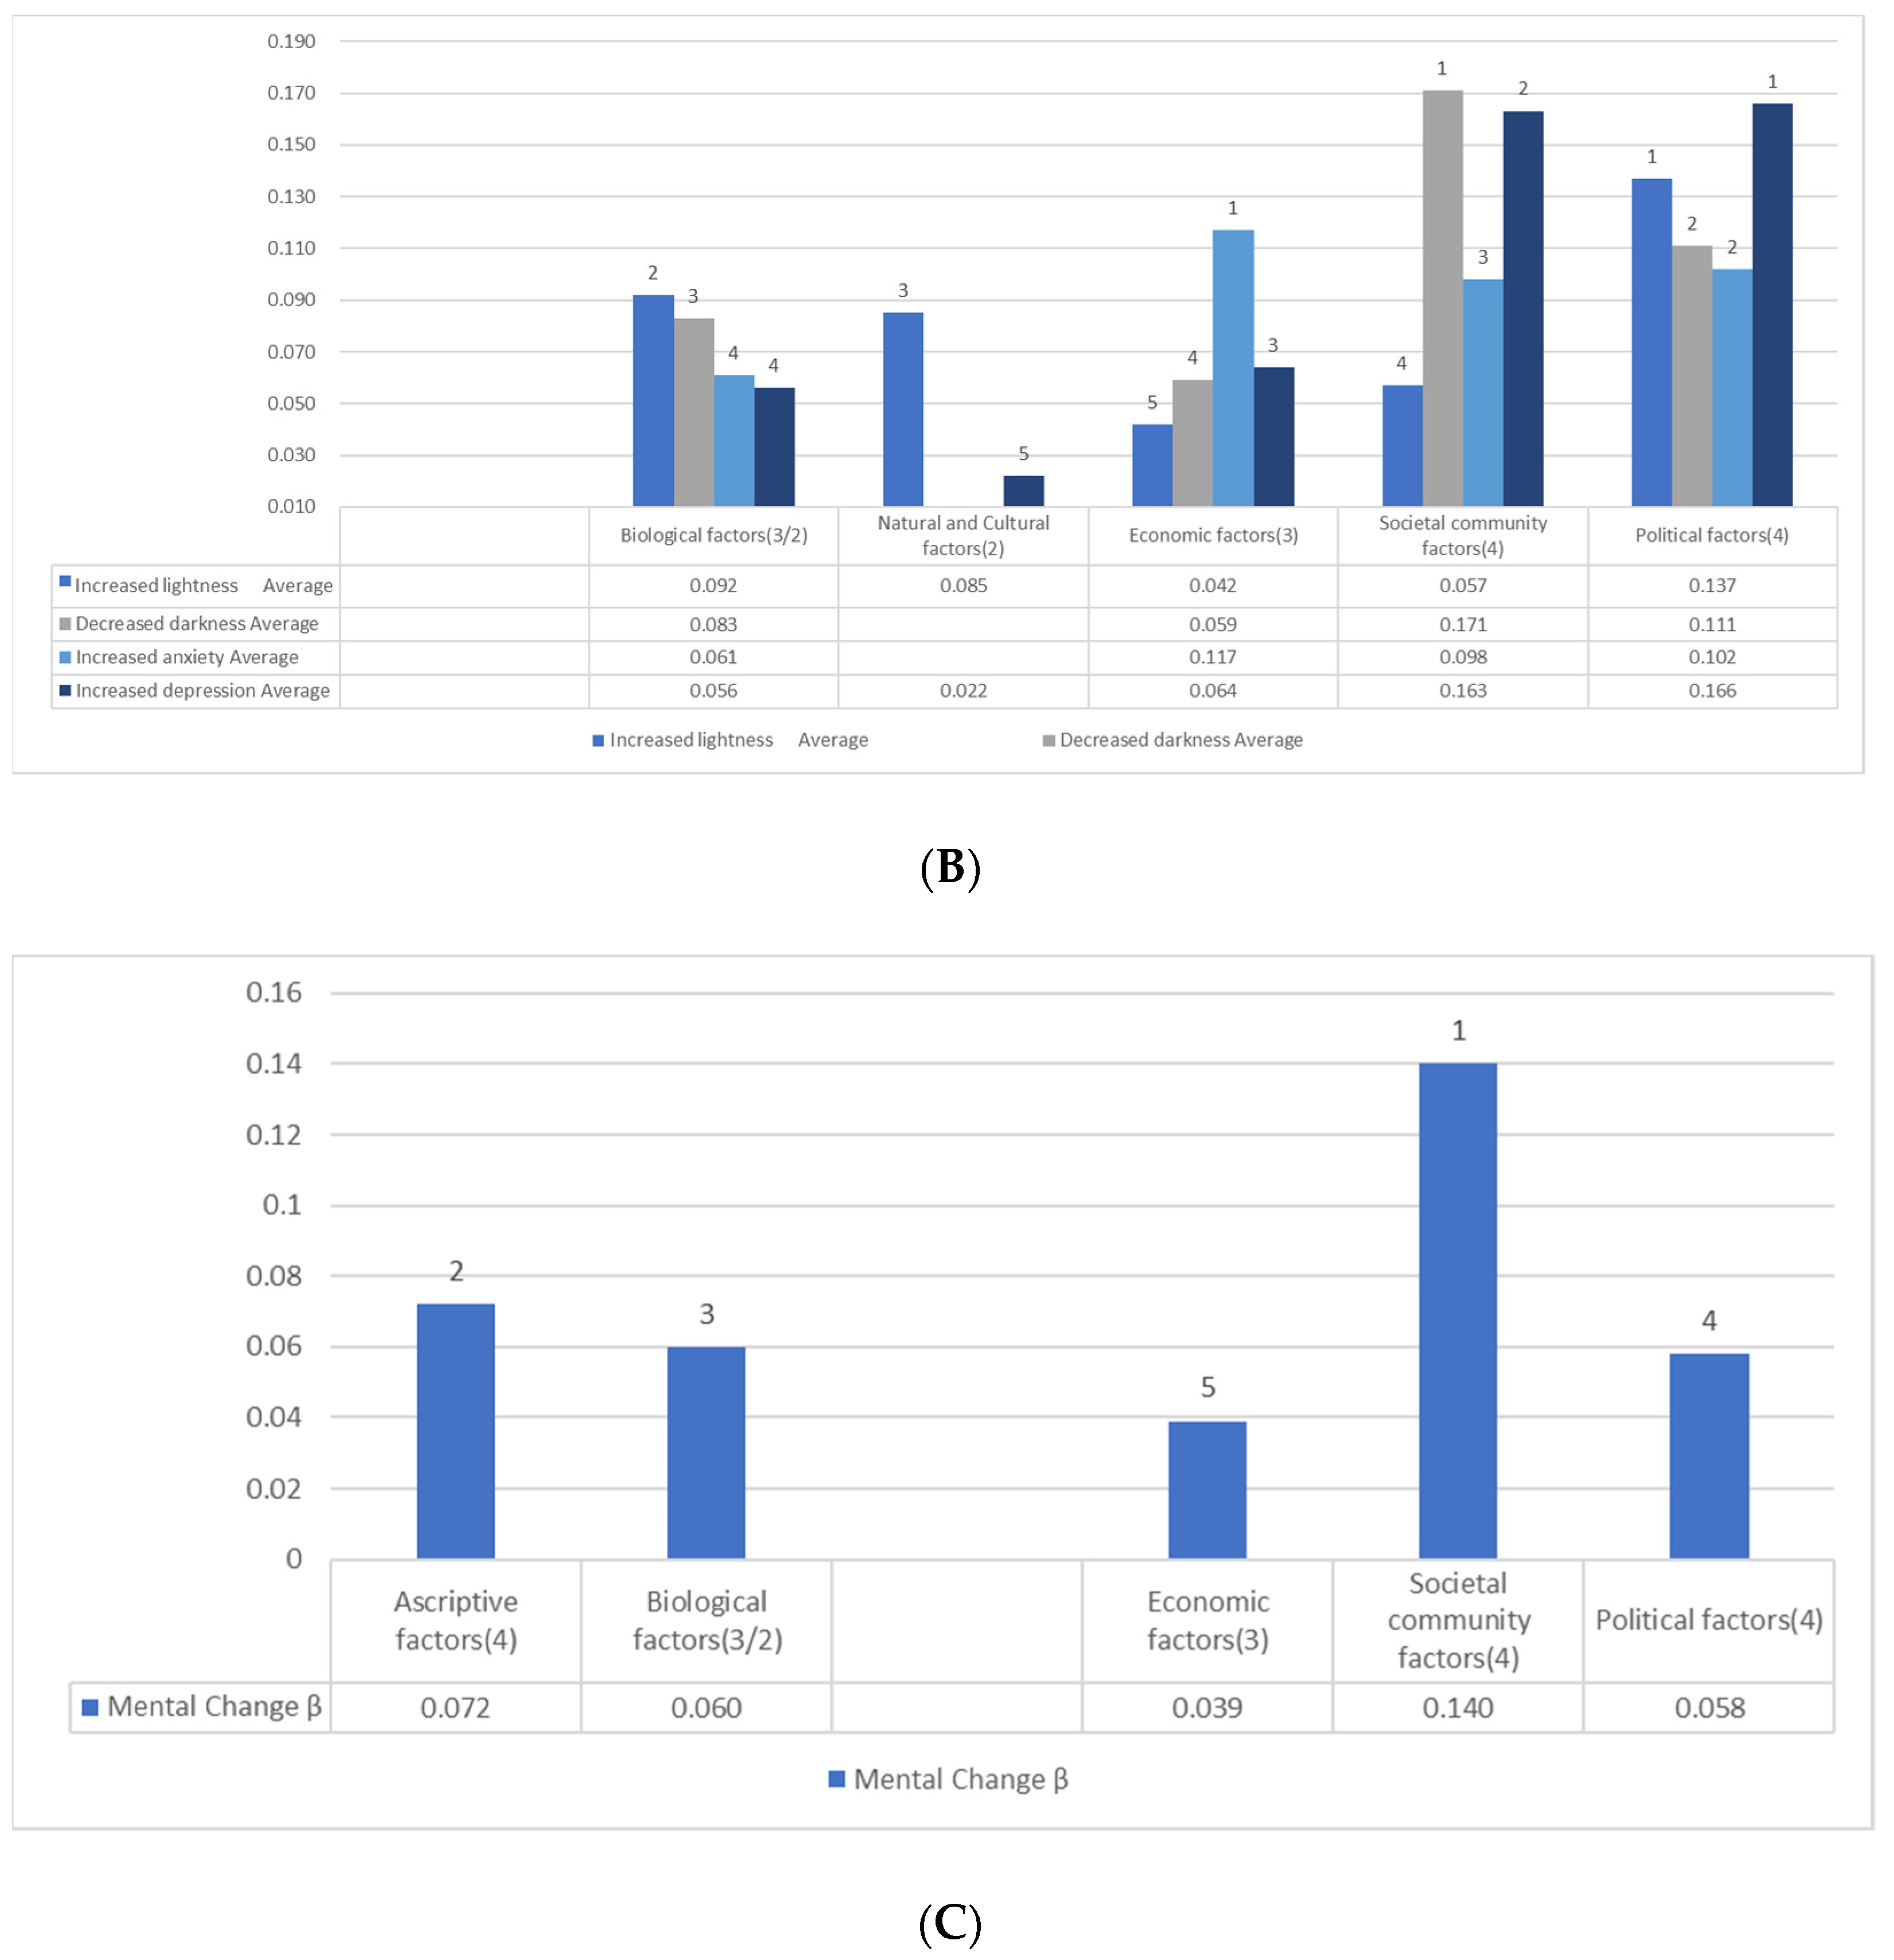
| Societal community factors(4) | 0.448(35.9%) | 0.281(25.5%) | 0.365(31.0%) | 0.140(37.9%) |
| [1] | [2] | [1] | [1] | |
| Political factors(4) | 0.217(17.4%) | 0.042(3.8%) | 0.130(11.0%) | 0.058(15.7%) |
| [4] | [6]1 | [4] | [4]1 | |
| Notes: See Table 4. | ||||
Appendix E.2. Logistic Regression Analysis: Total Value of the Partial Regression Coefficients of Basic Factors in Each Category (Top 2 Items)
| Light feelings increased | Dark feelings increased | Increased anxiety | Increased depression | |||||||||
| Survey1 | Survey2 | Average | Survey1 | Survey2 | Average | Survey1 | Survey2 | Average | Survey1 | Survey2 | Average | |
| Ascriptive factors(4) | 0.035 | 1.221 | 0.628 | 0.728 | 0.303 | 0.516 | 0.392 | 0.435 | 0.414 | 0.315 | 0.527 | 0.421 |
| Biological factors(3/2) | 0.088 (18.3%) | 0.096 (28.0%) | 0.092 (22.3%) | 0.111 (22.8%) | 0.054 (15.0%) | 0.083 (19.5%) | 0.075 (19.9%) | 0.047 (12.4%) | 0.061 (16.1%) | 0.060 (14.8%) | 0.051 (14.5%) | 0.056 (14.7%) |
| [3]1 | [3]1 | [2] | [3] | [3]1 | [3] | [4]1 | [4]1 | [4] | [4]1 | [3]1 | [4] | |
| Natural and Cultural factors(2) | 0.169 (35.1%) | 0.085 (20.5%) | 0.043 (12.3%) | 0.022 (5.7%) | ||||||||
| [1]1 | [3] | [5]1 | [5] | |||||||||
| Economic factors(3) | 0.083 (17.3%) | 0.042 (10.1%) | 0.066 (13.6%) | 0.051 (14.2%) | 0.059 (13.8%) | 0.125 (33.2%) | 0.109 (28.8%) | 0.117 (31.0%) | 0.082 (20.2%) | 0.045 (12.8%) | 0.064 (16.8%) | |
| [4]1 | [5] | [4]1 | [4]1 | [4] | [1] | [2] | [1] | [3]1 | [4]1 | [3] | ||
| Societal community factors(4) | 0.114 (33.2%) | 0.057 (13.8%) | 0.153 (31.4%) | 0.189 (52.6%) | 0.171 (40.4%) | 0.076 (20.2%) | 0.120 (31.7%) | 0.098 (25.9%) | 0.116 (28.6%) | 0.154 (43.9%) | 0.135 (35.7%) | |
| [2]1 | [4] | [2] | [1] | [1] | [3]1 | [1] | [3] | [2]2 | [1]3 | [1] | ||
| Political factors(4) | 0.141 (29.3%) | 0.133 (38.8%) | 0.137 (33.3%) | 0.157 (32.2%) | 0.065 (18.1%) | 0.111 (26.2%) | 0.101 (26.8%) | 0.103 (27.2%) | 0.102 (27.0%) | 0.148 (36.5%) | 0.058 (16.5%) | 0.103 (27.2%) |
| [2]1 | [1]1 | [1] | [1] | [2]1 | [2] | [2] | [3]1 | [2] | [1]4 | [2]1 | [2] | |
| Notes: See Table 6. | ||||||||||||
Appendix F. Logistic Regression Analysis: Emotional Change and Basic Factors (Surveys 1 and 2)
| Increased light feelings | Increased dark feelings | Increased anxiety | Increased depression | ||||||
| Survey1 | Survey2 | Survey1 | Survey2 | Survey1 | Survey2 | Survey1 | Survey2 | ||
| Cox-Snell R2 | 0.019 | 0.013 | 0.046 | 0.038 | 0.062 | 0.053 | 0.064 | 0.069 | |
| Nagelkerke R2 | 0.081 | 0.047 | 0.073 | 0.058 | 0.088 | 0.074 | 0.101 | 0.100 | |
| β | |||||||||
| Ascriptive factors(4) | Sex | −0.606** | 0.190* | 0.299** | 0.385** | 0.427** | 0.315** | 0.321** | |
| Age | −0.035** | −0.008** | −0.004† | 0.007** | 0.008** | −0.019** | |||
| Occupation | −0.615** | 0.538** | −0.206* | ||||||
| Marital status | |||||||||
| Biological factors(3/2) | Exercise/Foods | - | 0.096* | - | −0.054** | - | −0.047** | - | −0.051** |
| - | [3] | - | [4] | - | [5] | - | [5] | ||
| Exercise | - | - | −0.075** | - | −0.060** | - | |||
| - | - | [3] | - | [6] | - | ||||
| Foods | 0.088† | - | −0.041† | - | - | - | |||
| [3] | - | [7] | - | - | - | ||||
| Medical environment | −0.070** | ||||||||
| [3] | |||||||||
| Natural and Cultural factors(2) | Natural environment | 0.044* | |||||||
| [9] | |||||||||
| Educational environment | 0.169* | 0.039† | −0.043† | ||||||
| [1] | [8] | [7] | |||||||
| Economic factors(3) | Income | −0.066** | −0.051** | −0.069** | |||||
| [5] | [5] | [3] | |||||||
| Assets | −0.049* | −0.040† | −0.045* | ||||||
| [4] | [6] | [6] | |||||||
| Employment stability | 0.083† | −0.076** | −0.082** | ||||||
| [4] | [1] | [1] | |||||||
| Societal community factors(4) | Stratification satisfaction | 0.114** | −0.052* | −0.086** | −0.050** | −0.098** | |||
| [2] | [6] | [2] | [4] | [1] | |||||
| General trust | −0.052* | ||||||||
| [7] | |||||||||
| Disparity recognition | 0.101** | 0.103** | 0.076** | 0.070** | 0.064** | 0.056** | |||
| [1] | [1] | [1] | [2] | [4] | [3] | ||||
| Disparity elimination | −0.056** | ||||||||
| [3] | |||||||||
| Political factors(4) | Fairness/Justice | −0.070* | |||||||
| [3] | |||||||||
| Anti−corruptive fairness | −0.181** | −0.069** | −0.065** | −0.103** | −0.078** | ||||
| [5] | [4] | [3] | [1] | [2] | |||||
| Human rights | 0.141† | 0.058** | 0.062** | −0.071** | |||||
| [2] | [6] | [8] | [2] | ||||||
| Civil efficiency | 0.133** | −0.088** | 0.045* | −0.043** | 0.031† | −0.063* | 0.058** | ||
| [1] | [2] | [6] | [5] | [7] | [5] | [8] | |||
| Notes: ** p < 0.01, * p < 0.05, † < 0.1 Independent variables: all basic factors, including ascriptive factors. PSH and notes of other variables: see Table 1, Appendix D. | |||||||||
Appendix G. Logistic Regression Analysis: Emotional Change and Factors Including Additional Fairness/Justice Items
| Increased light feelings | Increased Dark feelings | Increased anxiety | Increased depression | ||
| Cox-Snell R2 | 0.013 | 0.038 | 0.055 | 0.070 | |
| Nagelkerke R2 | 0.047 | 0.058 | 0.075 | 0.102 | |
| β | |||||
| Ascriptive factors(4) | Sex | −0.606** | 0.299** | 0.430** | 0.305** |
| Age | −0.004† | 0.008** | −0.020** | ||
| Occupation | −0.615** | −0.214* | |||
| Marital status | |||||
| Biological factors(3/2) | Exercise/foods | 0.096* | −0.054** | −0.048** | −0.056** |
| [3] | [4] | [6] | [4] | ||
| Natural and Cultural factors(2) | Natural environment | 0.045* | |||
| [10] | |||||
| Educational environment | 0.041† | ||||
| [9] | |||||
| Economic factors(3) | Income | −0.051** | −0.084** | ||
| [5] | [2] | ||||
| Assets | −0.044* | ||||
| [6] | |||||
| Societal community factors(4) | Stratification Satisfaction | 0.114** | −0.086** | −0.053** | −0.101** |
| [2] | [2] | [4] | [1] | ||
| Disparity recognition | 0.103** | 0.053** | 0.031** | ||
| [1] | [4] | [7] | |||
| Political factors(4) | Anti-corruption fairness | −0.065** | −0.087** | ||
| [3] | [1] | ||||
| Human rights | −0.046* | ||||
| [5] | |||||
| Civil Efficacy | 0.133** | 0.045* | 0.030† | 0.049** | |
| [1] | [6] | [8] | [8] | ||
| Distributive Justice | −0.069** | −0.087** | |||
| [3] | [2] | ||||
| Fair/Just Society | −0.044† | −0.058* | |||
| [7] | [3] | ||||
| Notes: ** p < 0.01, * p < 0.05, † p < 0.1. Independent variables: all basic factors, including Ascriptive factors, Distributive Justice, and Fair/Just society. Notes of other variables: see Table 1, Appendix D. | |||||
Appendix H. Multiple Regression Analysis of All Factors, Including All the Additional Ones (Survey 2)
| PSH | ||
| R | 0.882 | |
| R2 | 0.778 | |
| adjusted R2 | 0.778 | |
| β | ||
| Ascriptive factors(4) | Sex | 0.021** |
| [12] | ||
| Age | ||
| Occupation | 0.021** | |
| [12] | ||
| Marital Status | 0.031** | |
| [10] | ||
| Biological factors(3/2) | Exercise/foods | 0.181** |
| [2] | ||
| Medical environment | 0.070** | |
| [7] | ||
| Natural and Cultural factors(2) | Natural environment | 0.036** |
| [9] | ||
| Educational environment | 0.063** | |
| [8] | ||
| Economic factors(3) | Income | 0.025** |
| [11] | ||
| Assets | ||
| Employment stability | ||
| Societal community factors(4) | Stratification satisfaction | 0.095** |
| [5] | ||
| General trust | 0.082** | |
| [6] | ||
| Disparity recognition | ||
| Disparity elimination | ||
| Political factors(4) | Fairness/Justice | |
| Anti-corruptive fairness | −0.041** | |
| [15] | ||
| Human rights | ||
| Civil efficiency | ||
| Hedonic | 0.120** | |
| [4] | ||
| Eudaimonic | 0.177** | |
| [3] | ||
| Contribution | ||
| Optimism | 0.268** | |
| [1] | ||
| Fair/Just Society | 0.016** | |
| [14] | ||
| Notes: ** p < 0.01, Independent variables: all basic factors, including Ascriptive factors, Hedonic, Eudaimonic, Contribution, Optimism, and Fair/Just society. PSH and notes of other variables: see Table 1, Appendix D. | ||
Appendix I. Logistic Regression Analysis of All Factors, Including All the Additional Ones (Survey 1 and 2)
| Light feelings increased | Dark feelings increased | Increased anxiety | Increased depression | ||||||
| Survey1 | Survey2 | Survey1 | Survey2 | Survey1 | Survey2 | Survey1 | Survey2 | ||
| Cox-Snell R2 | 0.019 | 0.020 | 0.049 | 0.059 | 0.063 | 0.074 | 0.075 | 0.089 | |
| Nagelkerke R2 | 0.079 | 0.074 | 0.078 | 0.090 | 0.089 | 0.102 | 0.118 | 0.130 | |
| β | |||||||||
| Ascriptive factors(4) | Sex | −0.641** | 0.206** | 0.295** | 0.394** | 0.408** | 0.372** | 0.315** | |
| Age | −0.321** | −0.083** | −0.004† | 0.057** | 0.007** | −0.020** | |||
| Occupation | −0.658** | 0.577** | |||||||
| Marital status | |||||||||
| Biological factors(3/2) | Exercise/foods | 0.037† | |||||||
| [10] | |||||||||
| Exercise | −0.063** | −0.038* | |||||||
| [5] | [8] | ||||||||
| Foods | 0.087† | ||||||||
| [3] | |||||||||
| Medical environment | −0.046* | ||||||||
| [6] | |||||||||
| Natural and Cultural factors(2) | Natural environment | −0.088† | 0.082** | 0.046* | 0.047* | 0.091** | |||
| [5] | [2] | [7] | [8] | [4] | |||||
| Educational environment | 0.168** | ||||||||
| [1] | |||||||||
| Economic factors(3) | Income | −0.062** | −0.069** | ||||||
| [4] | [6] | ||||||||
| Assets | −0.040* | ||||||||
| [8] | |||||||||
| Employment stability | 0.084† | −0.072** | −0.068** | ||||||
| [4] | [3] | [7] | |||||||
| Societal community factors(4) | Stratification satisfaction | −0.063** | −0.039* | −0.056** | |||||
| [8] | [9] | [6] | |||||||
| General trust | 0.043† | ||||||||
| [9] | |||||||||
| Disparity recognition | −0.068† | 0.081** | 0.033* | 0.034† | |||||
| [6] | [4] | [10] | [11] | ||||||
| Political factors(4) | Fairness/Justice | −0.051† | −0.079* | ||||||
| [6] | [6] | ||||||||
| Anti-corruptive fairness | −0.181** | −0.092** | −0.064** | −0.070** | −0.079** | −0.106** | |||
| [5] | [1] | [7] | [4] | [5] | [2] | ||||
| Human rights | 0.140** | 0.078** | 0.090** | −0.039† | |||||
| [2] | [2] | [5] | [9] | ||||||
| Civil efficiency | 0.137** | −0.055* | 0.057** | ||||||
| [3] | [5] | [12] | |||||||
| Physical health | −0.072** | −0.569** | −0.119** | −0.103** | −0.097** | ||||
| [6] | [1] | [3] | [3] | [2] | |||||
| Mental health | 0.268** | −0.072** | −0.235** | −0.184** | −0.238** | ||||
| [1] | [3] | [1] | [1] | [1] | |||||
| Hedonic | 0.127† | 0.131** | 0.126** | 0.074** | |||||
| [7] | [3] | [2] | [4] | ||||||
| Contribution | −0.136** | 0.149** | 0.148** | 0.083** | |||||
| [4] | [2] | [1] | [3] | ||||||
| Optimism | 0.143** | −0.074** | −0.118** | −0.071** | |||||
| [2] | [5] | [4] | [5] | ||||||
| Distributive Justice | −0.062* | −0.054† | |||||||
| [7] | [7] | ||||||||
| Fair/Just Society | −0.054† | ||||||||
| [7] | |||||||||
| Notes: ** p < 0.01, * p < 0.05, † p < 0.1, Independent variables: all basic factors, including Ascriptive factors, Physical health, Mental health, Hedonic, Contribution, Optimism, Distributive Justice, and Fair/Just society. Notes of other variables: see Table 1, Appendix D. | |||||||||
References
- Dionigi, A.; Casu Giulia Gremigni, P. Associations of Self-Efficacy, Optimism, and Empathy with Psychological Health in Healthcare Volunteers. Int. J. Environ. Res. Public Health 2020, 17, 6001. [Google Scholar] [CrossRef] [PubMed]
- Seligman, M.E.P.; Csikszentmihalyi, M. Positive Psychology: An Introduction. Am. Psychol. 2000, 55, 5–14. [Google Scholar] [CrossRef] [PubMed]
- Seligman, M.E.P. Authentic Happiness: Using the New Positive Psychology to Realize your Potential for Lasting Fulfillment; Free Press: New York, NY, USA, 2002. [Google Scholar]
- Seligman, M.E.P. Flourish: A Visionary New Understanding of Happiness and Well-Being; Atria: New York, NY, USA, 2012. [Google Scholar]
- Peterson, C. A Primer in Positive Psychology; Oxford University Press: New York, NY, USA, 2006. [Google Scholar]
- Park, N.; Peterson, C. It’s not just the economy: The psychological well-being of an electorate also matters for election outcomes. J. Posit. Psychol. 2019, 14, 127–132. [Google Scholar] [CrossRef]
- Waters, L.; Cameron, K.; Nelson-Coffey, S.K.; Crone, D.L.; Kern, M.L.; Lomas, T.; Oades, L.; Owens, R.L.; Pawelski, J.O.; Rashid, T.; et al. Collective well-being and posttraumatic growth during COVID-19: How positive psychology can help families, schools, workplaces, and marginalized communities. J. Posit. Psychol. 2021, 17, 761–789. [Google Scholar] [CrossRef]
- Jankowski, P.J.; Sandage, S.J.; Hill, P.C. Differentiation-based models of forgivingness, mental health and social justice commitment: Mediator effects for differentiation of self and humility. J. Posit. Psychol. 2013, 8, 412–424. [Google Scholar] [CrossRef]
- Bradshaw, E.L.; DeHaan, C.R.; Parker, P.D.; Curren, R.; Duineveld, J.J.; Di Domenico, S.I.; Ryan, R.M. The perceived conditions for living well: Positive perceptions of primary goods linked with basic psychological needs and wellness. J. Posit. Psychol. 2021. [Google Scholar] [CrossRef]
- Sanders, C.A.; Rose, H.; Booker, J.A.; King, L.A. Claiming the role of positive psychology in the fight against prejudice. J. Posit. Psychol. 2021. [Google Scholar] [CrossRef]
- Kobayashi, M. Political Philosophies and Positive Political Psychology: Inter-Disciplinary Framework for the Common Good. Front. Psychol. 2021, 12, 5253. [Google Scholar] [CrossRef]
- Kobayashi, M. Psychological Examination of Political Philosophies: Interrelationship Among Citizenship, Justice, and Well-Being in Japan. Front. Psychol. 2022, 12, 6121. [Google Scholar] [CrossRef]
- Dos Santos, L.M. How Does COVID-19 Pandemic Influence the Sense of Belonging and Decision-Making Process of Nursing Students: The Study of Nursing Students’ Experiences. Int. J. Environ. Res. Public Health 2020, 17, 5603. [Google Scholar] [CrossRef]
- Kim, H.R.; Yang, H.M. COVID-19 Fear, Health Behaviors, and Subjective Health Status of Call Center Workers. Int. J. Environ. Res. Public Health 2022, 19, 9005. [Google Scholar] [CrossRef] [PubMed]
- Bukchin-Peles, S.; Ronen, T. Linking Self-Control, Hope, Positivity Ratio, Anxiety and Handwashing Habits during the Coronavirus Outbreak. Int. J. Environ. Res. Public Health 2022, 19, 8859. [Google Scholar] [CrossRef] [PubMed]
- Waters, L.; Sara, B.; Algoe, S.B.; Dutton, J.; Emmons, R.; Fredrickson, B.L.; Heaphy, E.; Moskowitz, J.T.; Neff, K.; Niemiec, R.; et al. Positive psychology in a pandemic: Buffering, bolstering, and building mental health. J. Posit. Psychol. 2021, 17, 303–323. [Google Scholar] [CrossRef]
- Dennis, A.; Ogden, J.; Hepper, E.G. Evaluating the impact of a time orientation intervention on well-being during the COVID-19 lockdown: Past, present or future? J. Posit. Psychol. 2020, 17, 419–429. [Google Scholar] [CrossRef]
- Prinzing, M.M.; Zhou, J.; West, T.N.; Le Nguyen, K.D.; Wells, J.L.; Fredrickson, B.L. Staying “in sync” with others during COVID-19: Perceived positivity resonance mediates cross-sectional and longitudinal links between trait resilience and mental health. J. Posit. Psychol. 2022, 17, 440–455. [Google Scholar] [CrossRef]
- Counted, V.; Pargament, K.I.; Bechara, A.O.; Joynt, S.; Cowden, R.G. Hope and well-being in vulnerable contexts during the COVID-19 pandemic: Does religious coping matter? J. Posit. Psychol. 2022, 17, 70–81. [Google Scholar] [CrossRef]
- OECD. Growing Unequal? Income Distribution and Poverty in OECD Countries; OECD: Paris, France, 2008. [Google Scholar]
- OECD. In It Together: Why Less Inequality Benefits All; OECD: Paris, France, 2015. [Google Scholar]
- Scarpa, M.; Di Martino, S.; Prilleltensky, I. Mattering mediates between wellness and justice. Front. Psychol. 2021, 12, 744201. [Google Scholar] [CrossRef]
- Prilleltensky, I. Wellness as fairness. Am. J. Community Psychol. 2012, 49, 1–21. [Google Scholar] [CrossRef]
- Prilleltensky, I. Promoting well-being: Time for a paradigm shift in health and human services. Scand. J. Public Health 2005, 33, 53–60. [Google Scholar] [CrossRef]
- Andersen, M.M.; Dalton, S.O.; Lynch, J.; Johansen, C.; Holtug, N. Social Inequality in Health, Responsibility and Egalitarian Justice. J. Public Health 2013, 35, 4–8. [Google Scholar] [CrossRef]
- Knight, C.; Stemplowska, Z. Responsibility and Distributive Justice; Oxford University Press: Oxford, UK, 2014. [Google Scholar]
- Hirose, I. Egalitarianism; Routledge: New York, NY, USA, 2014. [Google Scholar]
- Nozick, R. Anarchy, State, and Utopia; Basic Books: New York, NY, USA, 1974. [Google Scholar]
- Rawls, J. A Theory of Justice; Belknap Press of Harvard University Press: Cambridge, MA, USA, 1971. [Google Scholar]
- Sandel, M. Justice: What’s the Right Thing to Do? Farrar, Straus and Giroux: New York, NY, USA, 2010. [Google Scholar]
- Wanless, D. Securing Our Future Health: Taking a Long-Term View: Final Report; HM Treasury: London, UK, 2002. [Google Scholar]
- Kondo, K. Society of Health Disparity: What Makes Mind Deteriorate; Igakushoin: Tokyo, Japan, 2022. (In Japanese) [Google Scholar]
- Wilkinson, R.G. The Impact of Inequality: How to Make Sick Societies Healthier; The New Press: New York, NY, USA, 2005. [Google Scholar]
- Wilkinson, R.; Pickett, S. The Inner Level: How More Equal Societies Reduce Stress, Restore Sanity and Improve Everyone’s Well-Being; Penguin Books: London, UK, 2019. [Google Scholar]
- Wilkinson, R.; Pickett, S. The Spirit Level: Why Greater Equality Makes Societies Stronger; Bloomsbury: London, UK, 2011. [Google Scholar]
- Marmot, M.G. The Health Gap: The Challenge of an Unequal World; Bloomsbury Pub Plc: New York, NY, USA, 2015. [Google Scholar]
- Kawachi, I.; Kennedy, B. The Health of Nations: Why Inequality Is Harmful to Your Health; The New Press: New York, NY, USA, 2006. [Google Scholar]
- Daniels, N.; Kennedy, B.; Kawachi, I. Is Inequality Bad for Our Health? Cohen, J., Rogers, J., Eds.; Beacon Press: Boston, MA, USA, 2001. [Google Scholar]
- Tod, A.M.; Hirst, J. (Eds.) Health and Inequality: Applying Public Health Research to Policy and Practice; Routledge: New York, NY, USA, 2014. [Google Scholar]
- Bartley, M. Health Inequality: An Introduction to Concepts, Theories, and Methods, 2nd ed.; Polity Press: Cambridge, UK, 2016. [Google Scholar]
- Asthana, S.; Halliday, J. What Works in Tackling Health Inequalities? (Studies in Poverty, Inequality and Social Exclusion); Policy Press: Bristol, UK, 2006. [Google Scholar]
- Marmot, M.; Wilkinson, R.G. (Eds.) Social Determinants of Health; Oxford University Press: New York, NY, USA, 2006. [Google Scholar]
- Kawachi, I.; Kennedy, B.P.; Wilkinson, R.G. The Society and Population Health Reader: Income Inequality and Health; New Press: New York, NY, USA, 1999. [Google Scholar]
- Putnam, R.D. Bowling Alone: The Collapse and Revival of American Community; Simon & Schuster: London, UK, 2001. [Google Scholar]
- WHO. Determinants of Health, Questions and Answers. 2017. Available online: https://www.who.int/news-room/questions-and-answers/item/determinants-of-health (accessed on 19 November 2022).
- Office of Disease Prevention and Health Promotion. Social Determinants of Health, Healthy People.gov. 2022. Available online: https://health.gov/healthypeople/priority-areas/social-determinants-health (accessed on 19 November 2022).
- Nowatzki, N.R. Wealth Inequality and Health: A Political Economy Perspective. Int. J. Health Serv. 2012, 42, 403–424. [Google Scholar] [CrossRef] [PubMed]
- Deaton, A. The Great Escape: Health, Wealth, and the Origins of Inequality (English Edition) Kindle-Version; Princeton University Press: Princeton, NJ, USA, 2013. [Google Scholar]
- Brown, F. Social Determinants of Health: Influence of Social Determinants on Environment and Health (English Edition) Kindle-Version; Amazon Services International, Inc.: Seattle, WA, USA, 2022. [Google Scholar]
- Cunningham, M. Social Determinant of Health: How Social Development Contributed to Social Health and Promote Your Health Status (English Edition) Kindle-Version; Amazon Services International, Inc.: Seattle, WA, USA, 2022. [Google Scholar]
- Buchbinder, M.; Rivkin-Fish, M.; Walker, R. (Eds.) Understanding Health Inequalities and Justice: New Conversations across the Disciplines (Studies in Social Medicine); University of North Carolina Press: Chapel Hill, NC, USA, 2016. [Google Scholar]
- Arrow, K. Some Ordinalist-Utilitarian Notes on Rawls’s Theory of Justice. J. Philos. 1973, 70, 245–263. [Google Scholar]
- Daniels, N. Just Health Care; Cambridge University Press: Cambridge, UK, 1985. [Google Scholar]
- Daniels, N. Just Health: Meeting Health Needs Fairly; Cambridge University Press: Cambridge, UK, 2008. [Google Scholar]
- Daniels, N.; Kennedy, B.; Kawachi, I. Why Justice is Good for our Health: The Social Determinants of Health Inequalities. Daedalus 1999, 128, 215–251. [Google Scholar] [PubMed]
- Donald, B.A. Health Disparities in the United States: Social Class, Race, Ethnicity, and the Social Determinants of Health; Johns Hopkins University Press: Baltimore, MD, USA, 2008. [Google Scholar]
- Fike, G. Health Disparities: Countering Health Disparities, Approach, and Solution; Independently Published: Chicago, IL, USA, 2019. [Google Scholar]
- Rose, P. Health Equity, Diversity, and Inclusion: Context, Controversies, and Solutions; Jones & Bartlett Learning: Burlington, UK, 2020. [Google Scholar]
- Braveman, P.A.; Kumanyika, S.; Fielding, J.; LaViest, T.; Borrell, L.N.; Manderscheid, R.; Troutman, A. Health Disparities and Health Equity: The Issue Is Justice. Am. J. Public Health 2011, 101, 149–155. [Google Scholar] [CrossRef] [PubMed]
- Braveman, P. What Are Health Disparities and Health Equity? We Need to Be Clear. Public Health Rep. 2014, 129, 5–8. [Google Scholar] [CrossRef]
- Braveman, P. Health difference, disparity, inequality, or inequity—What difference does it make what we call it?: An approach to conceptualizing and measuring health inequalities and health equity. In Understanding Health Inequalities and Justice; University of North Carolina Press: Chapel Hill, NC, USA, 2016. [Google Scholar]
- Whitehead, M. The Concepts and Principles of Equity and Health. Int. J. Health Serv. 1992, 223, 429–445. [Google Scholar] [CrossRef]
- Lee, H.; Kim, D.; Lee, S.A.; Fawcett, J. The Concepts of Health Inequality, Disparities and Equity in the Era of Population Health. Appl. Nurs. Res. 2020, 56, 151367. [Google Scholar] [CrossRef]
- Berkman, L.; Kawachi, I. (Eds.) Social Epidemiology; Oxford University Press: New York, NY, USA, 2000. [Google Scholar]
- Peterson, A.R.; Lupton, D. (Eds.) The New Public Health: Health and Self in the Age of Risk; Allen&Unwin: New South Wales, Australia, 1996. [Google Scholar]
- Tulchinsky, T.; Varaviskova (Eds.) The New Public Health. An Introduction for the 21st Century; Academic Press: San Diego, CA, USA, 2000. [Google Scholar]
- Baum, F. (Ed.) The New Public Health; Oxford University Press: New York, NY, USA, 2003. [Google Scholar]
- Lyubomirsky, S. The How of Happiness: A New Approach to Getting the Life You Want; Penguin Books: London, UK, 2008. [Google Scholar]
- Lyubomirsky, S. Award Speech at the 6th World Congress of International Positive Psychology Association; Frontiers Media S.A.: Lausanne, Switzerland, 2019. [Google Scholar]
- Lunda, C.; Flishera, A.J.; Kakuma, R.; Corrigall, J.; Joska, J.A.; Swartz, L.; Patel, V. Poverty and Common Mental Disorders in Low and Middle Income Countries: A Systematic Review. Soc. Sci. Med. 2010, 71, 517–528. [Google Scholar] [CrossRef]
- Tampubolon, G.; Hanandita, W. Poverty and Mental Health in Indonesia. Soc. Sci. Med. 2014, 106, 20–27. [Google Scholar] [CrossRef]
- Lund, C. Poverty and Mental Health: Towards a Research Agenda for Low and Middle-income Countries. Commentary on Tampubolon and Hanandita (2014). Soc. Sci. Med. 2014, 111, 134–136. [Google Scholar] [CrossRef]
- Jeste, D.V.; Pender, V.B. Social Determinants of Mental Health: Recommendations for Research, Training, Practice, and Policy. JAMA Psychiatry 2022, 79, 283–284. [Google Scholar] [CrossRef] [PubMed]
- Todman, L.C.; Taylor, J.S.J.D. The Social Determinants of Mental Health: From Awareness to Action; CreateSpace Independent Publishing Platform: Scotts Valley, CA, USA, 2010. [Google Scholar]
- Compton, M.D.; Michael, T. The Social Determinants of Mental Health; American Psychiatric Association Publishing Inc.: Washington, DC, USA, 2014. [Google Scholar]
- Alegría, M.; NeMoyer, A.; Falgàs Bagué, I.; Wang, Y.; Alvarez, K. Social Determinants of Mental Health: Where We Are and Where We Need to Go. Curr. Psychiatry Rep. 2018, 20, 95. [Google Scholar] [CrossRef] [PubMed]
- Silva, M.; Loureiro, A.; Cardoso, G. Social determinants of mental health: A review of the evidence. Eur. J. Psychiat. 2016, 30, 259–292. [Google Scholar]
- Allen, J.; Balfour, R.; Bell, R.; Marmot, M. Social determinants of mental health. Int Rev Psychiatry 2014, 26, 392–407. [Google Scholar] [CrossRef] [PubMed]
- Hausman, D.M. Benevolence, Justice, Well-Being and the Health Gradient. Public Health Ethics 2009, 2, 235–243. [Google Scholar] [CrossRef]
- Hausman, D.M.; Asada, Y.; Hedemann, T. Health Inequalities and Why They Matter. Health Care Anal. 2002, 10, 177–191. [Google Scholar] [CrossRef]
- Hausman, D.M. What’s Wrong with Health Inequalities? J. Political Philos. 2007, 15, 46–66. [Google Scholar] [CrossRef]
- MacKay, D.; Sreenivasan, G. Stanford Encyclopedia of Philosophy’Justice, Inequality, and Health’. 2021. Available online: https://plato.stanford.edu/entries/justice-inequality-health/ (accessed on 28 October 2022).
- Angell, M. Pockets of poverty. In Is Inequality Bad for Our Health? Beacon Press: Boston, MA, USA, 2001. [Google Scholar]
- Marmor, T. Politics of Medicare; Routledge: London, UK, 2000. [Google Scholar]
- Emanuel, E. Political Problems. In Is Inequality Bad for Our Health? Daniels, N., Kennedy, B., Kawachi, I., Eds.; Beacon Press: Boston, MA, USA, 2001. [Google Scholar]
- Fishman, J.; MacKay, D. Rawlsian Justice and the Social Determinants of Health. J. Appl. Philos. 2019, 36, 608–625. [Google Scholar] [CrossRef]
- Johannes, K. A Social Division of Responsibility for Health. Les Ateliers De L’éthique (Ethics Forum) 2018, 13, 105–122. [Google Scholar]
- Johannes, K. Justice in the Social Distribution of Health. Soc. Theory Pract. 2019, 45, 397–425. [Google Scholar]
- Segall, S. Is Health Care (still) Special? J. Political Philos. 2007, 15, 342–361. [Google Scholar] [CrossRef]
- Segall, S. Health, Luck, and Justice; Princeton University Press: Princeton, NJ, USA, 2010. [Google Scholar]
- Eyal, N.; Hurst, S.A.; Norheim, O.F.; Wikler, D. Inequalities in Health: Concepts, Measures, and Ethics; Oxford University Press: Oxford, UK, 2013. [Google Scholar]
- Anand, S.; Peter, F.; Sen, A. Public Health, Ethics, and Equity; Oxford University Press: Oxford, UK, 2004. [Google Scholar]
- Dawes, D.E. The Political Determinants of Health; Johns Hopkins University Press: Baltimore, MD, USA, 2020. [Google Scholar]
- Diener, E. The Science of Well-Being: The Collected Works of Ed Diener; Springer Science + Business Media: Berlin, Germany, 2009. [Google Scholar]
- Butler, J.; Kern, M.L. The PERMA-Profiler: A brief multidimensional measure of flourishing. Int. J. Wellbeing 2016, 6, 1–48. [Google Scholar] [CrossRef]
- Prilleltensky, I.; Diets, S.; Prilleltensky, O.; Myers, N.D.; Rubenstein, C.L.; Jin, Y.; McMahon, A. Assessing multi-dimensional well-being: Development and validation of the I COPPE scale. J. Community Psychol. 2015, 43, 199–226. [Google Scholar] [CrossRef]
- Serafini, G.; Parmigiani, B.; Amerio, A.; Aguglia, A.; Sher, L.; Amore, M. The psychological impact of COVID-19 on the mental health in the general population. QJM Mon. J. Assoc. Physicians 2020, 113, 531–537. [Google Scholar] [CrossRef] [PubMed]
- Gloster, A.T.; Lamnisos, D.; Lubenko, J.; Presti, G.; Squatrito, V.; Constantinou, M.; Nicolaou, C.; Papacostas, S.; Aydın, G.; Chong, Y.Y.; et al. Impact of COVID-19 pandemic on mental health: An international study. PLoS ONE 2020, 15, e0244809. Available online: https://journals.plos.org/plosone/article?id=10.1371/journal.pone.0244809 (accessed on 19 November 2022). [CrossRef] [PubMed]
- COVID-19 Mental Disorders Collaborators. Global prevalence and burden of depressive and anxiety disorders in 204 countries and territories in 2020 due to the COVID-19 pandemic COVID-19 Mental Disorders Collaborators. Lancet 2021, 398, 1700–1712. [Google Scholar] [CrossRef] [PubMed]
- Kikuchi, H.; Machida, M.; Nakamura, I.; Saito, R.; Odagiri, Y.; Kojima, T.; Watanabe, H.; Fukui, K.; Inoue, S. Changes in Psychological Distress During the COVID-19 Pandemic in Japan: A Longitudinal Study. J. Epidemiol. 2020, 30, 522–528. [Google Scholar] [CrossRef]
- Ueda, M.; Nordström, R.; Matsubayashi, T. Suicide and mental health during the COVID-19 pandemic in Japan. J. Public Health 2022, 44, 541–548. [Google Scholar] [CrossRef]
- Yamamoto, T.; Uchiumi, C.; Suzuki, N.; Yoshimoto, J.; Murillo-Rodriguez, E. The Psychological Impact of ‘Mild Lockdown’ in Japan during the COVID-19 Pandemic: A Nationwide Survey under a Declared State of Emergency. Int. J. Environ. Res. Public Health 2020, 17, 9382. [Google Scholar] [CrossRef]
- Hunt, S.M. Subjective Health Indicators and Health Promotion. Health Promot. Int. 1988, 3, 23–34. [Google Scholar] [CrossRef]
- Huta, V. Eudaimonic and hedonic orientations: Theoretical considerations and research findings. In Handbook of Eudaimonic Well-Being; Springer: New York, NY, USA, 2016. [Google Scholar]
- Hiyoshi, A.; Fukuda, Y.; Shipleya, M.J.; Brunnera, E.J. Health Inequalities in Japan: The Role of Material, Psychosocial, Social Relational and Behavioural Factors. Soc. Sci. Med. 2014, 104, 201–209. [Google Scholar] [CrossRef]
- Kondo, K.; Kawachi, I. (Eds.) Health Inequalities in Japan: An Empirical Study of Older People (Modernity and Identity in Asia Series); Trans Pacific Press: Boston, MA, USA, 2010. [Google Scholar]
- Kanchanachhitra, C.; Tangcharoensathien, V. Health Inequality across Prefectures in Japan. Lancet 2017, 390, 1471–1473. [Google Scholar] [CrossRef] [PubMed]
- Saito, J. How Does Inequality in Japan Compare with Others? 2022. Available online: https://www.jcer.or.jp/english/how-does-inequality-in-japan-compare-with-others (accessed on 19 November 2022).
- Rawls, J. Justice as Fairness; Kelly, E., Ed.; Belknap Press of Harvard University Press: Cambridge, MA, USA, 2001. [Google Scholar]
- Garcia, J.; Gustavson, A.R. The Science of Self-Report. 1 January 1997. Available online: https://www.psychologicalscience.org/observer/the-science-of-self-report (accessed on 28 October 2022).
- Mizushima, J. Response to the corona disaster and social justice in European countries. In Afuta Korona no Kousei Shakai (Fair Society after the COVID-19); Akashi Shoten: Tokyo, Japan, 2022. (In Japanese) [Google Scholar]
- Marmot, M.; Goldblatt, P.; Allen, J.; Institute of Health Equity. Fair Society, Healthy Lives. October 2010. Available online: https://www.instituteofhealthequity.org/resources-reports/fair-society-healthy-lives-the-marmot-review (accessed on 19 November 2022).
- Carr, C.L. On Fairness; Routledge: New York, NY, USA, 2000. [Google Scholar]
- Kobayashi, M. Multidimensional integrative theory of fair society. In Kouseishakai no Bijon (The Vision for a Fair Society); Akashi Shoten: Tokyo, Japan, 2021. (In Japanese) [Google Scholar]


| PSH | Mental Change | Increased Light Feelings | Increased Dark Feelings | Increased Anxiety | Increased Depression | ||||||||||||
|---|---|---|---|---|---|---|---|---|---|---|---|---|---|---|---|---|---|
| Survey1 (N = 4698) | Survey2 (N = 6855) | Average | Survey1 (N = 4698) | Survey1 (N = 4698) | Survey2 (N = 6855) | Average | Survey1 (N = 4698) | Survey2 (N = 6855) | Average | Survey1 (N = 4698) | Survey2 (N = 6855) | Average | Survey1 (N = 4698) | Survey2 (N = 6855) | Average | ||
| r | r | r | |||||||||||||||
| Ascriptive factors(4) | Sex | 0.053** [19] | 0.006 | △ | 0.059** [16] | 0.025† [15] | −0.052** [12] | 0.014 [12] | 0043** [17] | 0.072** [12] | 0.058 [14] | 0.109** [9] | 0.089** [9] | 0.099 [9] | 0.083** [15] | 0.099** [15] | 0.091 [15] |
| Age | 0.033* [20] | 0.124** [18] | 0.079 [18] | 0.048** [19] | −0.085** [1] | 0.015 | △ | −0.035* [18] | −0.037** [19] | −0.036 [17] | 0.084** [13] | 0.033** [16] | 0.058 [15] | 0.038** [19] | −0.133** [12] | −0.047 [17] | |
| Occupation | 0.239** [16] | 0.194** [17] | 0.217 [15] | −0.050** [18] | 0.023 | −0.022† [16] | △ | 0.003 | −0.050** [16] | △ | −0.032* [19] | −0.016 | △ | −0.050** [18] | −0.069** [18] | −0.060 [16] | |
| Marriage | 0.161** [17] | 0.231** [16] | 0.196 [16] | −0.005 | −0.044* [11] | −0.001 | △ | −0.025† [19] | −0.057** [14] | −0.041 [16] | 0.016 | −0.011 | △ | −0.023 | −0.088** [17] | △ | |
| Biological factors(3/2) | Exercise/Foods | (0.466**) | 0.705** [1] | (0.585) [4] | (−0.115**) | (0.051**) | 0.073** [3] | (0.062) [6] | (−0.113**) | −0.098** [8] | (−0.106) [7] | (−0.123**) | −0.087** [10] | (−0.105) [7] | (−0.134**) | −0.155** [5] | (−0.145) [9] |
| Exercise | 0.375** [13] | −0.135** [3] | 0.043** [12] | −0.110** [12] | −0.166** [1] | −0.159** [7] | |||||||||||
| Foods | 0.556** [4] | −0.096** [11] | 0.058** [7] | −0.115** [10] | −0.079** [14] | −0.110** [12] | |||||||||||
| Medical environment | 0.480** [10] | 0.565** [8] | 0.523 [8] | −0.075** [13] | 0.061** [5] | 0.066** [7] | 0.063 [5] | −0.112** [11] | −0.053** [15] | −0.083 [12] | −0.047** [16] | −0.044** [14] | −0.04 6[16] | −0.093** [13] | −0.125** [14] | −0.109 [13] | |
| Natural and Cultural factors(2) | Natural environment | 0.536** [8] | 0.610** [5] | 0.573 [5] | −0.061** [15] | 0.042** [14] | 0.058** [10] | 0.050 [10] | −0.067** [15] | −0.042** [17] | −0.055 [15] | −0.036** [18] | −0.021† [17] | −0.028 [17] | −0.059** [16] | −0.134** [11] | −0.097 [14] |
| Educational environment | 0.549** [5] | 0.684** [2] | 0.617 [2] | −0.112** [9] | 0.078** [2] | 0.067** [6] | 0.073 [1] | −0.124** [8] | −0.098** [7] | −0.111 [6] | −0.103** [10] | −0.077** [12] | −0.090 [10] | −0.144** [10] | −0.164** [4] | −0.154 [7] | |
| Economic factors(3) | Income | 0.539** [7] | 0.591** [7] | 0.565 [7] | −0.128** [6] | 0.058** [7] | 0.069** [4] | 0.064 [4] | −0.141** [1] | −0.132** [2] | −0.137 [1] | −0.148** [5] | −0.145** [2] | −0.146 [2] | −0.167** [4] | −0.170** [3] | −0.168 [2] |
| Assets | 0.541** [6] | 0.598** [6] | 0.570 [6] | −0.135** [3] | 0.066** [3] | 0.069** [4] | 0.065 [3] | −0.139** [3] | −0.129** [3] | −0.134 [2] | −0.147** [6] | −0.142** [3] | −0.145 [3] | −0.161** [6] | −0.174** [2] | −0.167 [3] | |
| Employment stability | 0.462** [11] | 0.553** [9] | 0.508 [11] | −0.126** [7] | 0.059** [6] | 0.064** [8] | 0.067 [2] | −0.125** [7] | −0.120** [5] | −0.123 [4] | −0.154** [4] | −0.130** [4] | −0.142 [4] | −0.167** [5] | −0.146** [8] | −0.156 [6] | |
| Societal community factors(4) | Stratification satisfaction | 0.692** [1] | 0.638** [4] | 0.665 [1] | −0.151** [1] | 0.058** [7] | 0.075** [2] | 0.029 [11] | −0.141** [1] | −0.133** [1] | −0.137 [1] | −0.124** [8] | −0.120** [6] | −0.122 [6] | −0.157** [8] | −0.192** [1] | −0.175 [1] |
| General trust | 0.564** [2] | 0.640** [3] | 0.602 [3] | −0.103** [10] | 0.042** [13] | 0.061** [9] | 0.052 [9] | −0.124* [9] | −0.067** [13] | −0.096 [9] | −0.091** [11] | −0.064** [13] | −0.078 [13] | −0.146** [9] | −0.154** [6] | −0.150 [8] | |
| Disparity recognition | 0.086** [18] | 0.239** [15] | 0.163 [17] | 0.053** [17] | 0.014 | 0.020 | △ | 0.062** [16] | 0.092** [9] | 0.077 [13] | 0.067** [15] | 0.099** [8] | 0.083 [12] | 0.055** [17] | 0.026* [19] | 0.041 [18] | |
| Disparity elimination | 0.310** [15] | 0.429** [12] | 0.370 [13] | −0.095** [12] | 0.022 | 0.049** [13] | △ | −0.079** [14] | −0.090** [10] | −0.085 [11] | −0.091** [12] | −0.118** [7] | −0.104 [8] | −0.121** [11] | −0.142** [9] | −0.132 [10] | |
| Political factors(4) | Fairness/Justice | 0.419** [12] | 0.365** [13] | 0.392 [12] | −0.134** [5] | 0.023 | 0.044** [14] | △ | −0.135** [5] | −0.110** [6] | −0.123 [5] | −0.156** [3] | −0.129** [5] | −0.142 [4] | −0.188** [1] | −0.135** [10] | −0.161 [4] |
| Anti−corruptive fairness | 0.338** [14] | 0.314** [14] | 0.326 [14] | −0.141** [2] | −0.008 | 0.043** [15] | △ | −0.132** [6] | −0.123** [4] | −0.128 [3] | −0.158** [2] | −0.169** [1] | −0.164 [1] | −0.184** [2] | −0.131** [13] | −0.158 [5] | |
| Human rights | 0.560** [3] | 0.483** [11] | 0.522 [9] | −0.074** [14] | 0.064** [4] | 0.056** [11] | 0.060 [8] | −0.105** [13] | −0.089** [11] | −0.097 [8] | −0.045** [17] | −0.083** [11] | −0.064 [14] | −0.085** [14] | −0.154** [6] | −0.119 [12] | |
| Civil efficiency | 0.493** [9] | 0.551** [10] | 0.522 [9] | −0.122** [8] | 0.045* [10] | 0.077** [1] | 0.061 [7] | −0.138** [4] | −0.039** [18] | −0.089 [10] | −0.132** [7] | −0.042** [15] | −0.087 [11] | −0.172** [3] | −0.090* *[16] | −0.131 [11] | |
| PSH | 1.000 | 1.000 | 1.000 | −0.157** | 0.070** | 0.105** | 0.088 | −0.177** | −0.140** | −0.159 | −0.124** | −0.094** | −0.109 | −0.200** | −0.226** | −0.213 | |
| Increased light feelings | 0.070** | 0.105** | 0.088 | −0.133** | 1.000 | 1.000 | 1.000 | −0.067** | −0.077** | −0.072 | −0.081** | −0.104** | −0.093 | −0.069** | −0.092** | −0.081 | |
| Increased dark feelings | −0.177** | −0.140** | −0.159 | 0.247** | −0.067** | −0.077** | −0.072 | 1.000 | 1.000 | 1.000 | 0.425** | 0.294** | 0.360 | 0.455** | 0.309** | 0.382 | |
| Increased Anxiety | −0.124** | −0.094** | −0.109 | 0.237** | −0.081** | −0.104** | −0.092 | 0.425** | 0.294** | 0.360 | 1.000 | 1.000 | 1.000 | 0.432** | 0.195** | 0.314 | |
| Increased Depression | −0.200** | −0.226** | −0.213 | 0.255** | −0.069** | −0.092** | −0.081 | 0.455** | 0.309** | 0.382 | 0.432** | 0.195** | 0.314 | 1.000 | 1.000 | 1.000 | |
| Physical change | −0.145** | 0.457** | −0.081** | 0.140** | 0.134** | 0.169** | |||||||||||
| Mental change | −0.157** | 1.000 | −0.133** | 0.247** | 0.237** | 0.255** | |||||||||||
| Fair society | 0.428** | 0.050** | −0.119** | −0.140** | −0.165** | ||||||||||||
| Just society | 0.426** | 0.049** | −0.111** | −0.127** | −0.156** | ||||||||||||
| Fair/Just society | 0.243** | 0.033** | −0.125** | −0.144** | −0.148** | ||||||||||||
| Distributive justice | 0.472** | 0.057** | −0.117** | −0.150** | −0.168** | ||||||||||||
| Contribution | 0.505** | 0.588** | 0.547 | −0.046* | 0.045** | 0.042** | 0.044 | −0.022 | 0.014 | 0.018 | 0.035* | −0.057** | −0.080** | −0.068 | |||
| Optimism | 0.624** | 0.752** | 0.688 | −0.145** | 0.046** | 0.100** | 0.073 | −0.168** | −0.135** | −0.152 | −0.154** | −0.126** | −0.140 | −0.204** | −0.206** | −0.205 | |
| PSH | Mental Change | Increased Light Feelings | Increased Dark Feelings | Increased Anxiety | Increased Depression | |||||||||||
|---|---|---|---|---|---|---|---|---|---|---|---|---|---|---|---|---|
| Survey1 | Survey2 | Average | Survey1 | Survey1 | Survey2 | Average | Survey1 | Survey2 | Average | Survey1 | Survey2 | Average | Survey1 | Survey2 | Average | |
| Ascriptive factors(4) | 0.122 (4.8%) | 0.183 (6.2%) | 0.153 (5.6%) | 0.052 (8.4%) | 0.051 (15.4%) | 0.037 (10.5%) | 0.044 (12.8%) | 0.034 (5.6%) | 0.054 (10.5%) | 0.044 (7.9%) | 0.075 (12.3%) | 0.061 (11.7%) | 0.068 (12.0%) | 0.057 (7.9%) | 0.097 (12.0%) | 0.077 (10.1%) |
| [6] | [6] | [6] | [6] | [5] | [6] | [6] | [6] | [6] | [6] | [5] | [5] | [5] | [6] | [6] | [6] | |
| Biological factors(3/2) | 0.470 (18.7%) | 0.635 (21.4%) | 0.553 (20.2%) | 0.102 (16.5%) | 0.054 (16.3%) | 0.070 (19.8%) | 0.062 (18.1%) | 0.112 (18.5%) | 0.076 (14.8%) | 0.094 (16.8%) | 0.097 (16.0%) | 0.066 (12.7%) | 0.082 (14.4%) | 0.121 (16.8%) | 0.140 (17.4%) | 0.131 (17.1%) |
| [3] | [2] | [2] | [4] | [4] | [1] | [4] | [3] | [4] | [4] | [3] | [4] | [4] | [3] | [3] | [3] | |
| Natural and Cultural factors(2) | 0.543 (21.6%) | 0.647 (21.9%) | 0.595 (21.7%) | 0.117 (18.9%) | 0.060 (18.1%) | 0.063 (17.8%) | 0.062 (18.1%) | 0.096 (15.8%) | 0.070 (13.6%) | 0.083 (14.8%) | 0.070 (11.5%) | 0.049 (9.4%) | 0.060 (10.5%) | 0.102 (14.1%) | 0.149 (18.5%) | 0.126 (16.4%) |
| [1] | [1] | [1] | [3] | [2] | [3] | [4] | [5] | [5] | [5] | [6] | [6] | [6] | [5] | [2] | [4] | |
| Economic factors(3) | 0.514 (20.4%) | 0.581 (19.6%) | 0.548 (20.0%) | 0.130 (21.0%) | 0.061 (18.4%) | 0.067 (18.9%) | 0.064 (18.7%) | 0.135 (22.2%) | 0.127 (24.8%) | 0.131 (23.4%) | 0.150 (24.7%) | 0.139 (26.7%) | 0.145 (25.6%) | 0.165 (22.9%) | 0.163 (20.2%) | 0.164 (21.5%) |
| [2] | [3] | [3] | [1] | [1] | [2] | [1] | [1] | [1] | [1] | [1] | [1] | [1] | [1] | [1] | [1] | |
| Societal community factors(4) | 0.413 (16.4%) | 0.487 (16.4%) | 0.450 (16.4%) | 0.101 (16.3%) | 0.050 (15.1%) | 0.062 (17.5%) | 0.056 (16.4%) | 0.102 (16.8%) | 0.096 (18.7%) | 0.099 (17.7%) | 0.093 (15.3%) | 0.100 (19.2%) | 0.097 (17.1%) | 0.120 (16.6%) | 0.129 (16.0%) | 0.125 (16.3%) |
| [5] | [4] | [4] | [5] | [6] | [4] | [2] | [4] | [2] | [3] | [4] | [3] | [3] | [4] | [4] | [5] | |
| Political factors(4) | 0.453 (18.0%) | 0.428 (14.5%) | 0.441 (16.1%) | 0.118 (19.0%) | 0.055 (16.6%) | 0.055 (15.5%) | 0.055 (16.1%) | 0.128 (21.1%) | 0.090 (17.5%) | 0.109 (19.5%) | 0.123 (20.2%) | 0.106 (20.3%) | 0.115 (20.3%) | 0.157 (21.7%) | 0.128 (15.9%) | 0.143 (18.7%) |
| [4] | [5] | [5] | [2] | [3] | [5] | [3] | [2] | [3] | [2] | [2] | [2] | [2] | [2] | [5] | [2] | |
| PSH | Mental Change | ||
|---|---|---|---|
| Survey1 | Survey2 | Survey1 | |
| R | 0.815 | 0.835 | 0.203 |
| R2 | 0.664 | 0.697 | 0.041 |
| adjusted R2 | 0.663 | 0.696 | 0.040 |
| 1 | Stratification | Exercise/Foods | Stratification |
| (0.322**) | (0.296**) | (−0.087**) | |
| 2 | Foods | Educational environment | Exercise |
| (0.155**) | (0.149**) | (−0.060**) | |
| 3 | General trust | General trust | Anti-corruptive fairness |
| (0.126**) | (0.144**) | (−0.058**) | |
| 4 | Natural environment | Stratification | Disparity recognition |
| (0.114**) | (0.137**) | (0.053**) | |
| 5 | Civil efficacy | Medical environment | Sex |
| (0.114**) | (0.106**) | (0.043*) | |
| 6 | Human rights | Natural environment | Employment stability |
| (0.103**) | (0.088**) | (−0.039*) | |
| 7 | Educational environment | Assets | Age |
| (0.090**) | (0.046**) | (0.029*) | |
| 8 | Medical environment | Civil efficacy | |
| (0.078**) | (0.042**) | ||
| 9 | Assets | Employment stability | |
| (0.061**) | (0.036**) | ||
| 10 | Marital status | Marital status | |
| (0.052**) | (0.031**) | ||
| PSH | Mental Change | |||
|---|---|---|---|---|
| Survey1 | Survey2 | Average | Survey1 | |
| Ascriptive factors(4) | 0.149(11.4%) | 0.081(6.8%) | 0.115(9.2%) | 0.072(19.5%) |
| [5]4 | [5]3 | [5] | [2]2 | |
| Biological factors(3/2) | 0.233(17.8%) | 0.402(33.8%) | 0.318(25.4%) | 0.060(16.3%) |
| [2]2 | [1]2 | [2] | [3]1 | |
| Natural and Cultural factors(2) | 0.204(15.5%) | 0.237(19.9%) | 0.221(17.6%) | |
| [3]2 | [3]2 | [3] | ||
| Economic factors(3) | 0.061(4.6%) | 0.111(9.3%) | 0.086(6.9%) | 0.039(10.6%) |
| [6]1 | [4]3 | [6] | [5]1 | |
| Societal community factors(4) | 0.448(34.1%) | 0.315(26.5%) | 0.382(30.5%) | 0.140(37.9%) |
| [1]2 | [2]3 | [1] | [1]2 | |
| Political factors(4) | 0.217(16.5%) | 0.042(3.5%) | 0.130(10.4%) | 0.058(15.7%) |
| [4]2 | [6]1 | [4] | [4]1 | |
| Increased Light Feelings | Increased Dark Feelings | Increased Anxiety | Increased Depression | |||||||||
|---|---|---|---|---|---|---|---|---|---|---|---|---|
| Survey1 | Survey2_1 | Survey2_2 | Survey1 | Survey2_1 | Survey2_2 | Survey1 | Survey2_1 | Survey2_2 | Survey1 | Survey2_1 | Survey2_2 | |
| Cox-Snell R2 | 0.019 | 0.013 | 0.013 | 0.046 | 0.038 | 0.038 | 0.062 | 0.053 | 0.055 | 0.064 | 0.069 | 0.070 |
| Nagelkerke R2 | 0.081 | 0.047 | 0.047 | 0.073 | 0.058 | 0.058 | 0.088 | 0.074 | 0.075 | 0.101 | 0.100 | 0.102 |
| 1 | Educational environment | Civil efficacy | Civil efficacy | Disparity recognition | Disparity recognition | Disparity recognition | Employment stability | Anti-corruptive fairness | Anti-corruptive fairness | Employment stability | Stratification | Stratification |
| (0.169*) | (0.133**) | (0.133**) | (0.101*) | (0.103**) | (0.103**) | (−0.076**) | (−0.103**) | (−0.087**) | (−0.082**) | (−0.098**) | (−0.101**) | |
| 2 | Human rights | Stratification | Stratification | Civil efficacy | Stratification | Stratification | Disparity recognition | Disparity recognition | Income | Anti-corruptive fairness | Human rights | Distributive justice |
| (0.141†) | (0.114**) | (0.114**) | (−0.088**) | (−0.086**) | (−0.086**) | (0.076 | (0.070**) | (−0.084**) | (−0.078**) | (−0.071**) | (−0.087**) | |
| 3 | Foods | Exercise/Foods | Exercise/Foods | Medical environment | Anti-corruptive fairness | Anti-corruptive fairness | Exercise | Income | Distributive justice | Fairness/Justice | Disparity recognition | Fair/just society |
| (0.088†) | (0.096*) | (0.096*) | (−0.070**) | (−0.065**) | (−0.065**) | (−0.075**) | (−0.069**) | (−0.069**) | (−0.070*) | (0.056**) | (−0.058*) | |
| 4 | Employment stability | Anti-corruptive fairness | Exercise/Foods | Exercise/Foods | Assets | Stratification | Stratification | Disparity recognition | Disparity elimination | Exercise/Foods | ||
| (0.083†) | (−0.069**) | (−0.054**) | (−0.054**) | (−0.049*) | (−0.050**) | (−0.053**) | (0.064**) | (−0.056) | (−0.056**) | |||
| 5 | Anti-corruptive fairness | Income | Income | Income | Civil efficacy | Exercise/Foods | Disparity recognition | Civil efficacy | Exercise/Foods | Human rights | ||
| (−0.181**) | (−0.066**) | (−0.051**) | (−0.084**) | (−0.043**) | (−0.047**) | (0.053**) | (−0.063**) | (−0.051**) | (−0.046*) | |||
| 6 | Stratification | Civil efficacy | Civil efficacy | Human rights | Assets | Exercise/Foods | Exercise | Assets | Assets | |||
| (−0.052**) | (−0.045*) | (0.045*) | (0.058**) | (−0.040†) | (−0.048**) | (−0.060**) | (−0.045*) | (−0.044**) | ||||
| 7 | Foods | Civil efficacy | Fair/just society | General trust | Educational environment | Disparity recognition | ||||||
| (−0.041†) | (0.031†) | (−0.044†) | (−0.052*) | (−0.043†) | (0.031**) | |||||||
| 8 | Educational environment | Civil efficacy | Human rights | Civil efficacy | Civil efficacy | |||||||
| (0.039†) | (0.049**) | (0.062**) | (0.058**) | (0.049*) | ||||||||
| 9 | Natural environment | Educational environment | ||||||||||
| (0.044†) | (0.041†) | |||||||||||
| 10 | Natural environment | |||||||||||
| (0.045*) | ||||||||||||
| Ascriptive factors | ||||||||||||
| 1 | Age | Occupation | Occupation | Occupation | Sex | Sex | Sex | Sex | Sex | Sex | Sex | Sex |
| (−0.035**) | (−0.615**) | (−0.615**) | (0.538**) | (0.299**) | (0.299**) | (0.385**) | (0.427**) | (0.430**) | (0.315**) | (0.321**) | (0.305**) | |
| 2 | Sex | Sex | Sex | Age | Age | Age | Age | Age | Occupation | Occupation | ||
| (−0.606**) | (−0.606**) | (0.190*) | (−0.004†) | (−0.004†) | (0.007**) | (0.008**) | (0.008**) | (−0.206*) | (−0.214**) | |||
| 3 | Age | Age | Age | |||||||||
| (−0.008**) | (−0.019) | (−0.020**) | ||||||||||
| Increased Light Feelings | Increased Dark Feelings | Increased Anxiety | Increased Depression | |||||||||
|---|---|---|---|---|---|---|---|---|---|---|---|---|
| Survey1 | Survey2 | Average | Survey1 | Survey2 | Average | Survey1 | Survey2 | Average | Survey1 | Survey2 | Average | |
| Ascriptive factors(4) | 0.035 | 1.221 | 0.628 | 0.736 | 0.303 | 0.520 | 0.392 | 0.435 | 0.414 | 0.315 | 0.546 | 0.431 |
| Biological factors(3/2) | 0.088 (18.3%) | 0.096 (28.0%) | 0.092 (22.3%) | 0.111 (22.7%) | 0.054 (15.0%) | 0.083 (19.5%) | 0.075 (19.9%) | 0.047 (12.4%) | 0.061 (16.1%) | 0.060 (11.3%) | 0.051 (12.5%) | 0.056 (11.8%) |
| [3]1 | [3]1 | [2] | [3]2 | [3]1 | [3] | [4]1 | [4]1 | [4] | [4]1 | [3]1 | [4] | |
| Natural and Cultural factors(2) | 0.169 (35.1%) | 0.085 (20.5%) | 0.043 (10.6%) | 0.022 (4.6%) | ||||||||
| [1]1 | [3] | [5]1 | [5] | |||||||||
| Economic factors(3) | 0.083 (17.3%) | 0.042 (10.1%) | 0.066 (13.5%) | 0.051 (14.2%) | 0.059 (13.8%) | 0.125 (33.2%) | 0.109 (28.8%) | 0.117 (31.0%) | 0.082 (15.4%) | 0.045 (11.1%) | 0.064 (13.5%) | |
| [4]1 | [5] | [4]1 | [4]1 | [4] | [1]2 | [2]2 | [1] | [3]1 | [4]1 | [3] | ||
| Societal community factors(4) | 0.114 (33.2%) | 0.057 (13.8%) | 0.153 (31.4%) | 0.189 (52.6%) | 0.171 (40.4%) | 0.076 (20.2%) | 0.120 (31.7%) | 0.098 (25.9%) | 0.116 (21.8%) | 0.210 (51.6%) | 0.163 (34.8%) | |
| [2]1 | [4] | [2]2 | [1]2 | [1] | [3]1 | [1]2 | [3] | [2]2 | [1]3 | [2] | ||
| Political factors(4) | 0.141 (29.3%) | 0.133 (38.8%) | 0.137 (33.3%) | 0.157 (32.0%) | 0.065 (18.1%) | 0.111 (26.2%) | 0.101 (26.8%) | 0.103 (27.2%) | 0.102 (27.0%) | 0.273 (51.4%) | 0.058 (14.3%) | 0.166 (35.3%) |
| [2]1 | [1]1 | [1] | [1]2 | [2]1 | [2] | [2]2 | [3]1 | [2] | [1]4 | [2]1 | [1] | |
Publisher’s Note: MDPI stays neutral with regard to jurisdictional claims in published maps and institutional affiliations. |
© 2022 by the authors. Licensee MDPI, Basel, Switzerland. This article is an open access article distributed under the terms and conditions of the Creative Commons Attribution (CC BY) license (https://creativecommons.org/licenses/by/4.0/).
Share and Cite
Kobayashi, M.; Ishido, H.; Mizushima, J.; Ishikawa, H. Multi-Dimensional Dynamics of Psychological Health Disparities under the COVID-19 in Japan: Fairness/Justice in Socio-Economic and Ethico-Political Factors. Int. J. Environ. Res. Public Health 2022, 19, 16437. https://doi.org/10.3390/ijerph192416437
Kobayashi M, Ishido H, Mizushima J, Ishikawa H. Multi-Dimensional Dynamics of Psychological Health Disparities under the COVID-19 in Japan: Fairness/Justice in Socio-Economic and Ethico-Political Factors. International Journal of Environmental Research and Public Health. 2022; 19(24):16437. https://doi.org/10.3390/ijerph192416437
Chicago/Turabian StyleKobayashi, Masaya, Hikari Ishido, Jiro Mizushima, and Hirotaka Ishikawa. 2022. "Multi-Dimensional Dynamics of Psychological Health Disparities under the COVID-19 in Japan: Fairness/Justice in Socio-Economic and Ethico-Political Factors" International Journal of Environmental Research and Public Health 19, no. 24: 16437. https://doi.org/10.3390/ijerph192416437
APA StyleKobayashi, M., Ishido, H., Mizushima, J., & Ishikawa, H. (2022). Multi-Dimensional Dynamics of Psychological Health Disparities under the COVID-19 in Japan: Fairness/Justice in Socio-Economic and Ethico-Political Factors. International Journal of Environmental Research and Public Health, 19(24), 16437. https://doi.org/10.3390/ijerph192416437