
Atmospheric Air Pollution by Stationary Sources in Ulan-Ude (Buryatia, Russia) and Its Impact on Public Health

 , , ,
, , ,
Abstract
1. Introduction
2. Materials and Methods
3. Results
4. Discussion
5. Conclusions
- In Ulan-Ude, there has been a 3.71-fold increase in air pollution over the period of 2011–2020. In 2011–2012, the degree of air pollution was assessed as “High”, and from 2013 to 2020—as “Very High”. Priority pollutants whose concentrations exceed MAC are benzo(a)pyrene, PM2.5, PM10, suspended solids, and nitrogen dioxide.
- The main stationary sources of atmospheric air pollution are large enterprises of the fuel and energy complex, autonomous heat supply sources of small enterprises, and individual households (which make the greatest contribution to the air pollution). There has been an increase in the number of households with autonomous sources of heating.
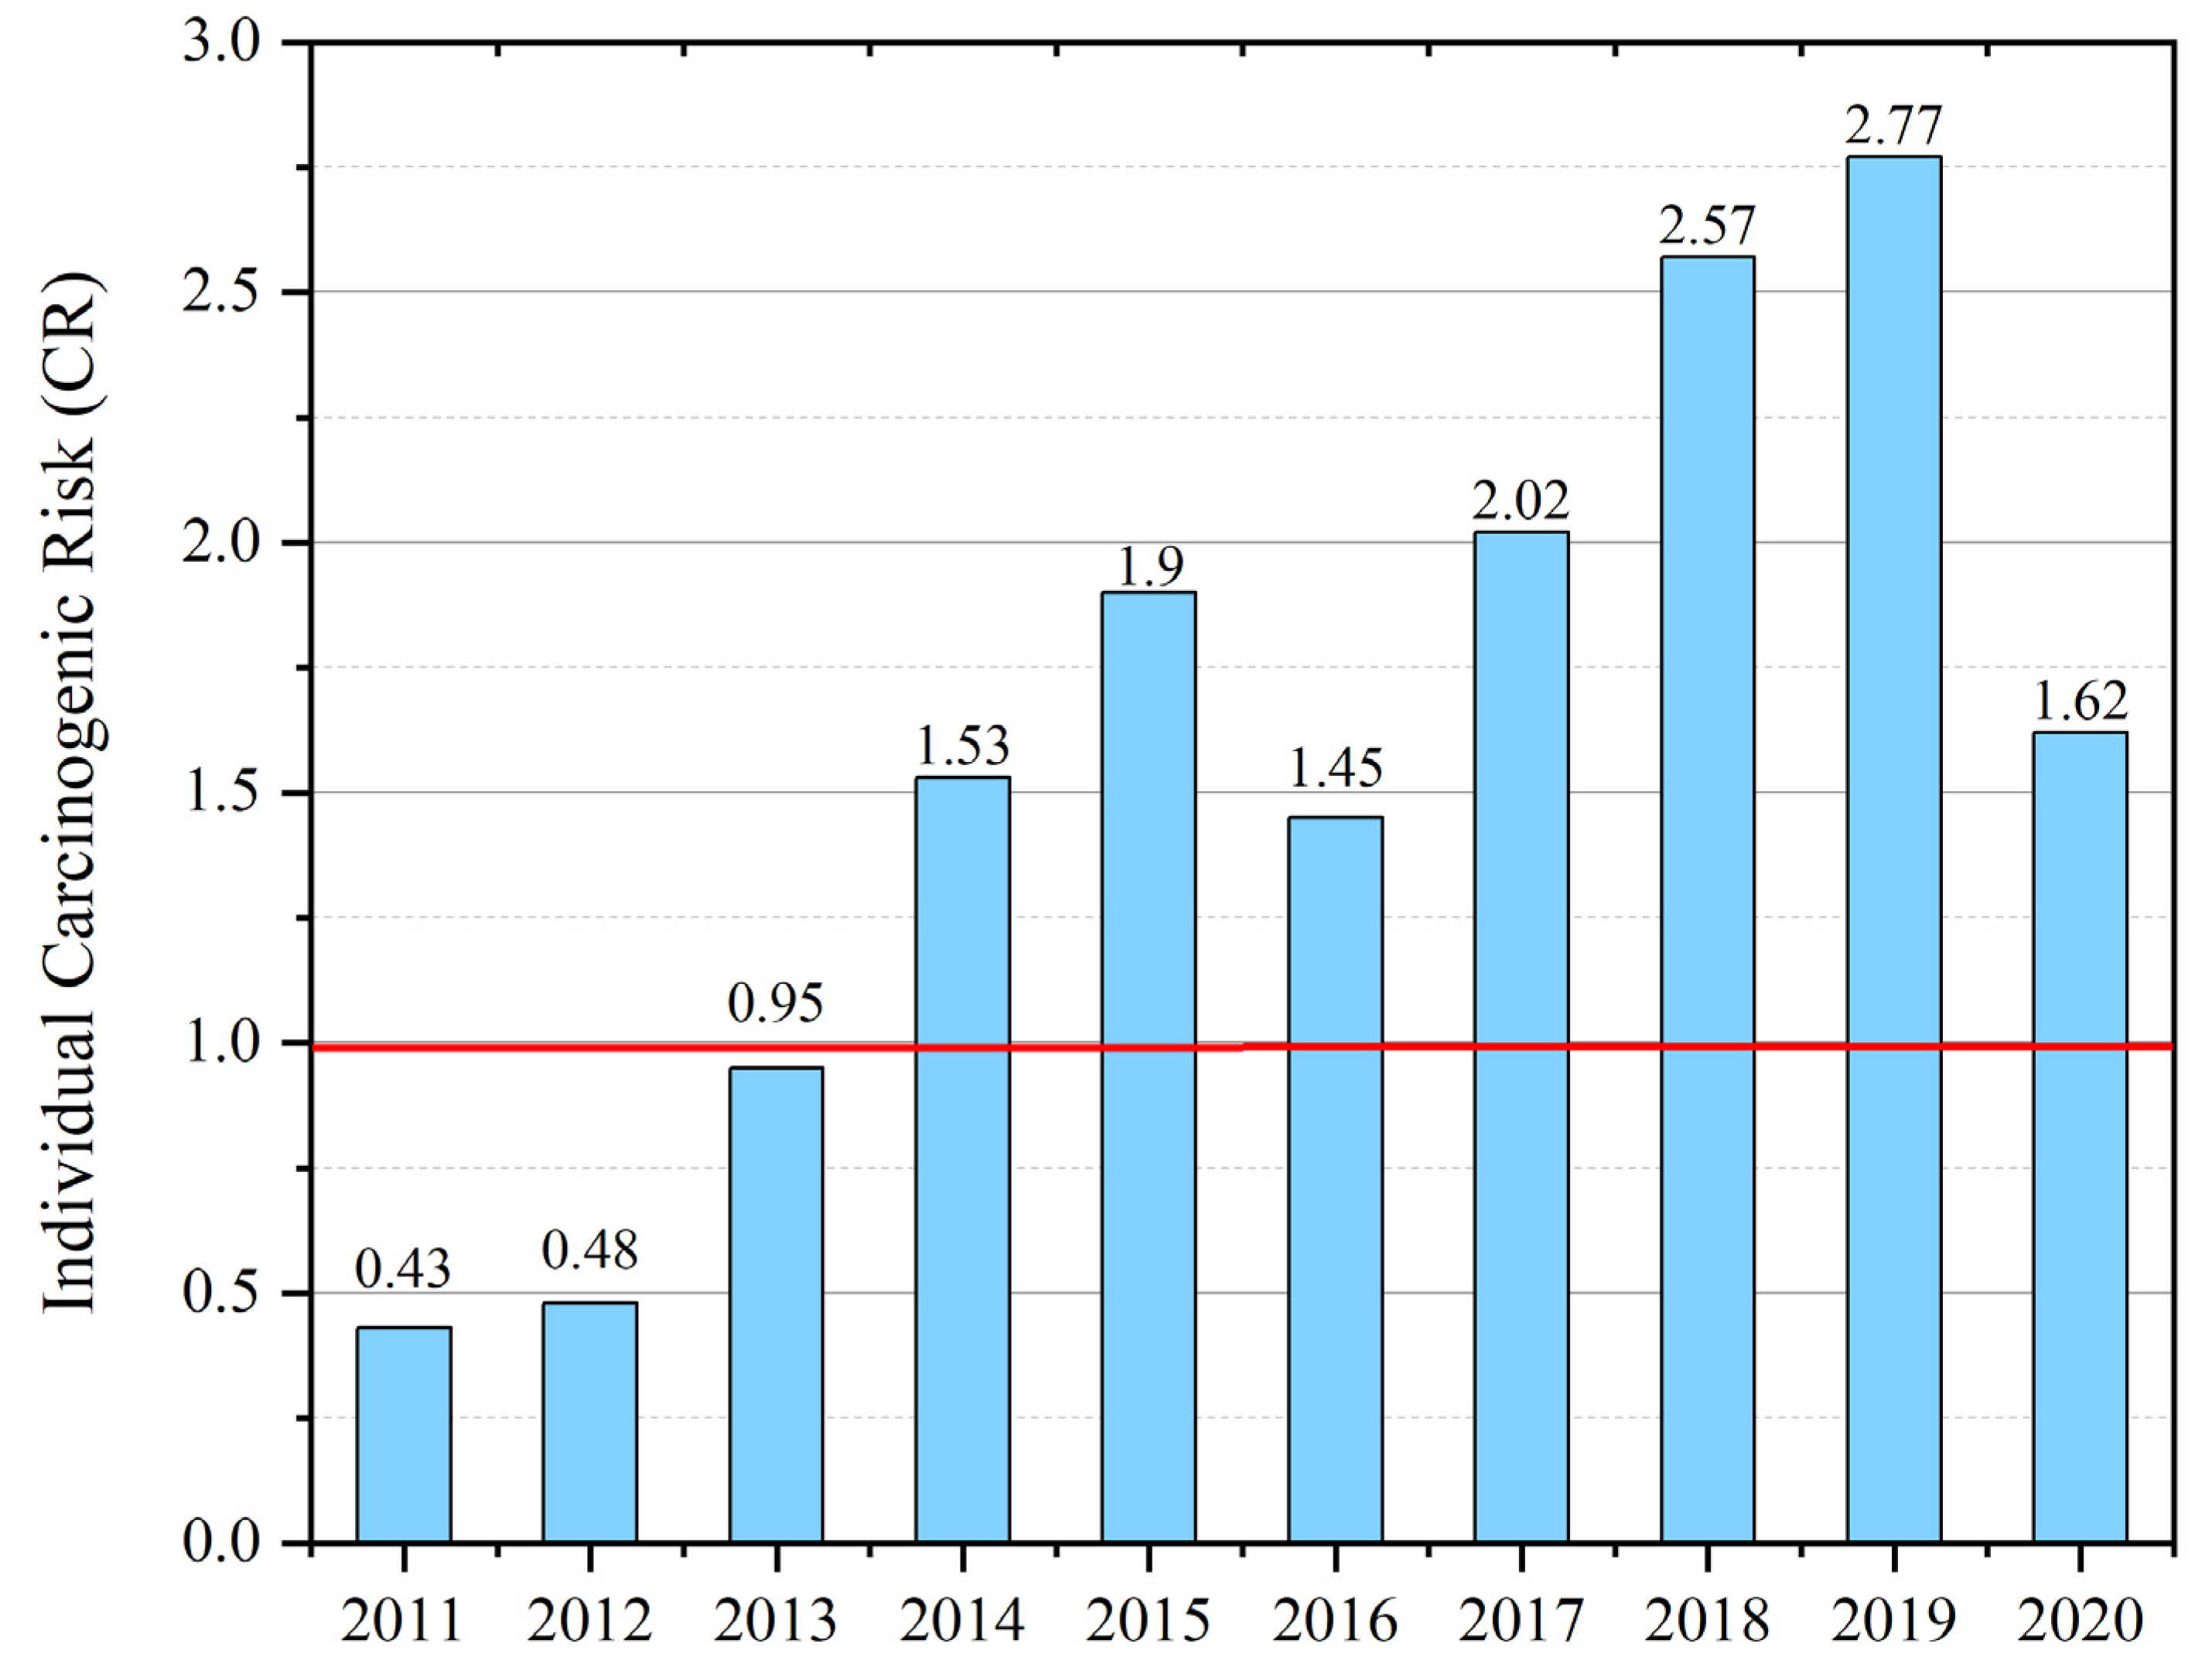
- Chronic inhalation exposure to pollutants may cause health disorders of the population of Ulan-Ude from the respiratory organs, immune system, disorders of fetal development, neoplasms, diseases of the vision, blood diseases, and increased mortality. The concentrations of pollutants in the atmospheric air have been found to present elevated levels of non-carcinogenic risk to public health, exceeding permissible values from 1.1 to 12 times. The level of individual carcinogenic risk exceeds the permissible level for the population of Ulan-Ude by 1.62 times. Priority pollutants in the atmosphere of Ulan-Ude whose concentrations create unacceptable levels of risk to public health are benzo(a)pyrene, suspended solids, nitrogen dioxide, PM2.5, PM10, formaldehyde, and black carbon.
- The levels of morbidity in Ulan-Ude were higher than the average for Buryatia by the main disease classes: respiratory organs by 1.19 times, endocrine system by 1.25 times, circulatory system by 1.11 times, eye diseases by 1.06 times, neoplasms by 1.47 times, congenital anomalies, and deformations and chromosomal aberrations by 1.63 times. There is an increase in the incidence of risk-related diseases of the respiratory organs and circulatory system. A strong correlation was found between this growth of morbidity and atmospheric air pollution in Ulan-Ude.
Author Contributions
Funding
Institutional Review Board Statement
Informed Consent Statement
Data Availability Statement
Conflicts of Interest
References
- State Report on the State and Protection of the Environment of the Russian Federation in 2019, State Report; Ministry of Natural Resources of Russia: Moscow, Russia, 2019; p. 890.
- Turbinsky, V.V.; Korotaeva, O.D. Assessment of the danger of the joint harmful effects of atmospheric pollutants and industrial emissions on public health. In Proceedings of the Social and Hygienic Monitoring and Occupational Pathology Issues in the Siberian Federal District, Novosibirsk, Russia, 14–15 October 2010; pp. 225–230. [Google Scholar]
- State of Global Air. Air Pollution and Health in Cities. Available online: https://www.stateofglobalair.org/resources/health-in-cities (accessed on 23 September 2022).
- On the State of Sanitary and Epidemiological Wellbeing of the Population in the Russian Federation in 2021, State Report; Federal Service for Supervision of Consumer Rights Protection and Human Welfare: Moscow, Russia, 2022; p. 340.
- Davalos, A.D.; Luben, T.J.; Herring, A.H.; Sacks, J.D. Current approaches used in epidemiologic studies to examine short-term multipollutant air pollution exposures. Ann. Epidemiol. 2017, 27, 145–153.e1. [Google Scholar] [CrossRef] [PubMed]
- On the Classifications and Criteria Used in the Medical and Social Expert Assessment of Citizens by Federal State Medical and Social Expert Assessment Institutions; Order No. 585n; Ministry of Labor and Social Development of Russia: Moscow, Russia, 27 August 2019.
- Air Quality and Health, World Health Organization. Available online: https://www.who.int/teams/environment-climate-change-and-health/air-quality-and-health/policy-progress/sustainable-development-goals-air-pollution (accessed on 23 September 2022).
- Rakhmanin, Y.A. Health Effects of Particulate Matter: Policy Implications for Countries in Eastern Europe, Caucasus and Central Asia. Available online: https://apps.who.int/iris/handle/10665/344854 (accessed on 23 September 2022).
- Rakhmanin, Y.A. Updating the problems of human ecology and environmental hygiene and ways to solve them. Hyg. Sanit. 2012, 91, 4–8. [Google Scholar]
- Chudinova, O.N. Impact of Anthropogenic Air Pollution on the Public Health in Trans-Baikal Territory (Case Study of Ulan-Ude); VSGTU Press: Ulan-Ude, Russia, 2010; p. 225. [Google Scholar]
- Tumureeva, N.N.; Sanzhieva, S.E. Assessment of the impact of motor vehicle emissions on air quality and health of the population of Ulan-Ude. Buryat State Univ. Bull. 2015, 4, 237–242. [Google Scholar]
- Zhao, H.; Gui, K.; Ma, Y.; Wang, Y.; Wang, Y.; Wang, H.; Zheng, Y.; Li, L.; Zhang, L.; Zhang, Y.; et al. Multi-Year Variation of Ozone and Particulate Matter in Northeast China Based on the Tracking Air Pollution in China (TAP) Data. Int. J. Environ. Res. Public Health 2022, 19, 3830. [Google Scholar] [CrossRef] [PubMed]
- Sun, X.; Zhang, R.; Wang, G. Spatial-Temporal Evolution of Health Impact and Economic Loss upon Exposure to PM2. 5 in China. Int. J. Environ. Res. Public Health 2022, 19, 1922. [Google Scholar] [CrossRef] [PubMed]
- Im, U.; Brandt, J.; Geels, C.; Hansen, K.M.; Christensen, J.H.; Andersen, M.S.; Solazzo, E.; Kioutsioukis, I.; Alyuz, U.; Balzarini, A.; et al. Assessment and economic valuation of air pollution impacts on human health over Europe and the United States as calculated by a multi-model ensemble in the framework of AQMEII3. Atmos. Chem. Phys. 2018, 18, 5967–5989. [Google Scholar] [CrossRef]
- Dolgushina, N.A.; Kuvshinova, I.A. Air pollution and non-cancenogenic risk assessment in industrial cities of Chelyabinsk region. Hum. Ecol. 2019, 26, 17–22. [Google Scholar] [CrossRef]
- Golikov, R.A.; Surzhikov, D.V.; Kislitsyna, V.V.; Shtaiger, V.A. The impact of environmental pollution on public health (a review). Sci. Rev. Med. Sci. 2017, 5, 20–31. [Google Scholar]
- Tulchinsky, T.H.; Varavikova, E.A. Chapter 9—Environmental and Occupational Health. In The New Public Health, 3rd ed.; Tulchinsky, T.H., Varavikova, E.A., Eds.; Academic Press: San Diego, CA, USA, 2014; pp. 471–533. [Google Scholar]
- On the State and Protection of the Environment of the Republic of Buryatia in 2018, State Report; Ministry of Natural Resources of Buryatia: Ulan-Ude, Russia, 2019.
- Pashkevich, M.A.; Barkan, M.V.; Sharikov, Y.V. Environmental Problems of Megacities and Industrial Agglomerations, Textbook; Saint Petersburg Mining University Press: Saint Petersburg, Russia, 2010. [Google Scholar]
- Dambaev, T.T.; Tyskineeva, I.E.; Madeeva, E.V. Characteristics of the state of atmospheric air in the city of Ulan-Ude. In Proceedings of the Major Aspects of Technosphere Safety, Maksimikha, Buryatia, Russia, 15–18 September 2015; pp. 31–33. [Google Scholar]
- Korytny, L.M.; Bashalkhanova, L.B.; Maksyutova, E.V.; Sorokovoi, A.A. Ecosystem Functions of the Atmosphere in the Sustainable Development of Urbanized Territories (a Case Study of the City of Ulan-Ude). Geogr. Nat. Resour. 2022, 43, 134–140. [Google Scholar] [CrossRef]
- Korytnyi, L.M.; Bashalkhanova, L.B.; Veselova, V.N. Atmospheric Pollution as a Factor of Environmental Hazard in the Baikal Region Cities. Russ. Meteorol. Hydrol. 2019, 44, 704–711. [Google Scholar] [CrossRef]
- Ayusheeva, S.N.; Botoeva, N.B.; Mikheeva, A.S. Analysis of the impact of economic activity on atmospheric air quality in Ulan-Ude. IOP Conf. Ser. Earth Environ. Sci. 2019, 320, 012009. [Google Scholar] [CrossRef]
- Climate Change, Newsletter, Rosgidromet. Available online: https://www.meteorf.ru/upload/pdf_download/doklad_klimat2020.pdf (accessed on 23 September 2022).
- Zhamsueva, G.S.; Zayakhanov, A.S.; Lomukhin, Y.L.; Barannikov, G.E.; Butukhanov, V.P. Study of dynamics of atmospheric pollution by SO2 and CO over the city of Ulan-Ude. Atmos. Ocean. Opt. 1997, 10, 126–128. [Google Scholar]
- Air Quality Index (AQI) and PM2.5 Air Pollution in Russia. Available online: https://www.iqair.com/russia (accessed on 23 September 2022).
- Grigoryeva, L.O.; Dmitrieva, A.V.; Ayurova, O.Z.; Konovalov, P.V.; Ton, S.H.A. Features of atmospheric air pollution in Ulan-Ude. IOP Conf. Ser. Earth Environ. Sci. 2021, 867, 012089. [Google Scholar] [CrossRef]
- Grigoryeva, L.; Dmitrieva, A.; Ayurova, O.; Hertuev, V.; Markhaev, D. Analysis of the impact of vehicles on air pollution in Ulan-Ude. E3S Web Conf. 2021, 273, 04004. [Google Scholar] [CrossRef]
- Vologzhina, S.Z. Assessment of air pollution in Ulan-Ude. Proc. Irkutsk. State Univ. Earth Sci. Ser. 2011, 4, 48–59. [Google Scholar]
- Federal State Statistics Service in Buryatia. Available online: https://burstat.gks.ru (accessed on 23 September 2022).
- Basic Indicators of Environmental Protection, Statistical Bulletin, Rosstat. Available online: https://rosstat.gov.ru/compendium/document/13294 (accessed on 23 September 2022).
- All-Russian Research Institute of Hydrometeorological Information—World Data Center. Available online: http://meteo.ru/data (accessed on 23 September 2022).
- On the State and Protection of the Environment of the Republic of Buryatia in 2019, State Report; Ministry of Natural Resources of Buryatia: Ulan-Ude, Russia, 2020.
- Dambiev, T.T.; Tyskineeva, I.E.; Kushnarev, S.N. Features of atmospheric air pollution in Ulan-Ude. VSGUTU Bull. 2014, 5, 76–79. [Google Scholar]
- Snitsarenko, N.I. Climate of Ulan-Ude; Snitsarenko, N.I., Shver, T.A., Eds.; Gidrometeoizdat: Leningrad, Russia, 1983; p. 240. [Google Scholar]
- SanPiN 2.1.6.1032-01; Hygienic Requirements to Quality Assurance of Atmospheric Air in Inhabited Areas. Chief State Sanitary Physician of the Russian Federation: Moscow, Russia, 2001.
- On the State of Sanitary and Epidemiological Wellbeing of the Population in the Republic of Buryatia in 2021, State Report; Federal Service for Supervision of Consumer Rights Protection and Human Welfare in Burtyatia: Ulan-Ude, Russia, 2022.
- GOST 17.2.4.07-90 (State Standard); Nature Protection: Atmosphere: Methods for Determining the Pressure and Temperature of Gas-Dust Streams Emerging from Stationary Contamination Sources. Standartinform: Moscow, Russia, 2008.
- GOST 17.2.4.06-90 (State Standard); Nature Protection: Atmosphere: Methods for Determining the Velocity and Flow Rate of Gas-Dust Streams Emerging from Stationary Contamination Sources. IPK Izdatelstvo standartov: Moscow, Russia, 2003.
- DKIN.413411.002; Methods of Measurement of Mass Concentration of Pollutants in Exhaust Gases of Fuel Combustion Facilities Using Gas Analyzers AGM-505. OOO “NPTS Analitekh”: Nizhny Novgorod, Russia, 2011.
- GOST 33007–2014 (State Standard); Scrubber and Duster Equipment. Methods for Determination of Dust Load of Gas Streams. General Technical Requirements and Control Methods. Standartinform: Moscow, Russia, 2015.
- Method FR.1.31.2015.20718 (PND F 13.1.76-15); Measurement of Benzo(a)pyrene in the Industrial Emissions. Federal Information Fund on Uniformity of Measurements: Moscow, Russia, 2018.
- On Approval of Methodological Recommendations for Voluntary Inventory of Greenhouse Gas Emissions in the Constituent Entities of the Russian Federation; Order No. 15-r; Ministry of Natural Resources of Russia: Moscow, Russia, 16 April 2015.
- Russian State Register of Measuring Instruments. Available online: https://www.rostest.ru/GosreestrSI.php (accessed on 23 September 2022).
- On the State of Sanitary and Epidemiological Welfare of the Population in the Republic of Buryatia in 2020, State Report, Rospotrebnadzor. Available online: https://03.rospotrebnadzor.ru/content/222/12877/ (accessed on 23 September 2022).
- Outcomes in the Healthcare System of Buryatia (2015–2020), Report; Ministry of Health of Buryatia: Ulan-Ude, Russia, 2021.
- Khankhareev, S.S.; Bagayeva, E.E.; Madeeva, E.V.; Tkacheva, M.V.; Govorina, Y.V. The management of atmospheric air quality based on health risk assessment methodology (case study of Ulan-Ude, Buryatia). Public Health Environ. 2013, 5, 7–9. [Google Scholar]


| No | Operator | Type | Location |
|---|---|---|---|
| 1 | Buryat Center for Hydrometeorology and Environmental Monitoring | Monitoring stations | Prospekt 50-letiya Oktyabrya (ASK-A No.1) |
| 2 | Ulitsa Revolutsii 1905 (ASK-A No.6) | ||
| 3 | Ulitsa Babushkina, section No.16 (ASK-A No.2) | ||
| 4 | Rospotrebnadzor | Monitoring sites | Ulitsa Sovetskaya, 43; near school No.3 (Site 1) |
| 5 | Ulitsa Mokhovaya, 1; near kindergarten “Pchelka”, influence zone of CHPP-1 (Site 2) | ||
| 6 | Ulitsa Rodiny, 2; square in the influence zone of the boiler house of Zagorsk (Site 3) | ||
| 7 | Prospekt Stroitelei, 20; near school No. 49 (Site 4) | ||
| 8 | Ulitsa Klyuchevskaya, 45B; near the Head Office of Rospotrebnadzor in Buryatia (Site 5) | ||
| 9 | Ulitsa Zabaikalskaya, 2, Silikatny; influence zone of the settlement’s enterprises (Site 6) | ||
| 10 | Ulitsa Stroitelei, 19A, Zarechny; near kindergarten “Zorka” (Site 7) |
| Pollutant | Years | Change by 2020 % | Note | |||||||||
|---|---|---|---|---|---|---|---|---|---|---|---|---|
| 2011 | 2012 | 2013 | 2014 | 2015 | 2016 | 2017 | 2018 | 2019 | 2020 | |||
| Nitrogen dioxide | 1 | 1.10 | 1.10 | 1.13 | 1.05 | 1 | 0.93 | 1 | 0.95 | 1.08 | 7.5 | vs. 2011 year |
| Suspended matter | 1.5 | 1.7 | 1.7 | 1.9 | 1.76 | 1.77 | 1.75 | 1.88 | 1.48 | 1.30 | −13.3 | |
| Carbon monoxide | 0.5 | 0.50 | 0.50 | 0.43 | 0.20 | 0.13 | 0.17 | 0.17 | 0.19 | 0.17 | −66.7 | |
| Sulfur dioxide | 0.1 | 0.10 | 0.10 | 0.17 | 0.18 | 0.2 | 0.26 | 0.36 | 0.29 | 0.20 | 100.0 | |
| Formaldehyde | 2 | 2.30 | 2.30 | 1.78 | 1.10 | 1.1 | 1.00 | 1.30 | 1.2 | 0.50 | −75.0 | |
| Phenol | 0.8 | 0.90 | 0.90 | 0.80 | 0.66 | 1 | 1 | 1 | 0.56 | 1.00 | 25.0 | |
| Benzo(a)pyrene | 2.8 | 2.8 | 4 | 7.7 | 7.22 | 6.8 | 7.6 | 10.2 | 11.95 | 10.30 | 367.9 | |
| Nitrogen oxide | 0.2 | 0.20 | 0.20 | 0.56 | 0.36 | 0.23 | 0.32 | 0.42 | 0.41 | 0.20 | 0 | |
| Ozone | − | − | − | − | 1.53 | 1.23 | 0.9 | 1.07 | 1.17 | 0.73 | −52.1 | vs. 2015 year |
| Ammonia | − | − | − | − | 0.20 | 0.35 | 0.2 | 0.10 | 0.02 | 0.02 | −90.0 | vs. 2015 year |
| Black carbon | − | − | − | − | 1.04 | 0.86 | 0.28 | 0.34 | 0.48 | 0.38 | −63.5 | vs. 2015 year |
| PM10 | − | − | − | − | − | − | 1.2 | 1.13 | 1.07 | 1.50 | 25.0 | vs. 2017 year |
| PM2.5 | − | − | − | − | − | − | 1.34 | 1.37 | 1.34 | 1.76 | 31.3 | vs. 2017 year |
| API5 | 10.0 | 12.4 | 14.6 | 27.3 | 25.2 | 22.9 | 25.6 | 38.0 | 46.3 | 37.1 | 371 | vs. 2011 year |
| Degree of air pollution | High | High | Very high | Very high | Very high | Very high | Very high | Very high | Very high | Very high | ||
| No. | Type of Stationary Source | Mass (Thousand Tons) | wt.% |
|---|---|---|---|
| 1 | Large heating networks (fuel and energy complex) | 18.0 | 21.5 |
| 2 | Autonomous sources (enterprises and small businesses) | 2.0 | 2.4 |
| 3 | Individual households | 63.8 | 76.1 |
| 4 | Total | 83.8 | 100 |
| Area | Pollutant | |||||
|---|---|---|---|---|---|---|
| Benzo(a)pyrene | Nitrogen Oxides (NOX) | Sulfur Dioxide (SO2) | Particulate Matter | Carbon Monoxide (CO) | Total | |
| kg | Thousand Tons | |||||
| Ulan-Ude | 10.29 | 0.22 | 7.33 | 25.87 | 5.85 | 39.27 |
| Ulan-Ude suburb, located in Tarbagataisky District | 1.04 | 0.02 | 0.74 | 2.61 | 0.59 | 3.96 |
| Ulan-Ude suburb, located in Ivolginsky District | 3.53 | 0.07 | 2.52 | 8.88 | 2.01 | 13.48 |
| Ulan-Ude suburb, located in Zaigraevsky District | 1.84 | 0.04 | 1.31 | 4.63 | 1.05 | 7.03 |
| Total | 16.7 | 0.36 | 11.9 | 41.99 | 9.5 | 63.75 |
| Disease Classes | Ulan-Ude | Buryatia | Excess Rate (Ulan-Ude vs. Buryatia | ||
|---|---|---|---|---|---|
| Cases, per 100,000 People | % of Total Morbidity | Cases, per 100,000 People | % of Total Morbidity | ||
| Respiratory organs | 34,154.29 | 44.31 | 28,648.46 | 44.77 | 1.19 |
| Congenital anomalies, deformities, and chromosomal abnormalities | 151.53 | 0.20 | 92.74 | 0.14 | 1.63 |
| Diseases of the eye | 3149.95 | 4.09 | 2977.82 | 4.65 | 1.06 |
| Circulatory system | 2837.52 | 3.68 | 2551.25 | 3.99 | 1.11 |
| Blood and hematopoietic organs | 383.85 | 0.50 | 462.3 | 0.72 | 0.83 |
| Neoplasms | 1073.08 | 1.39 | 731.89 | 1.14 | 1.47 |
| Endocrine system | 1673.95 | 2.17 | 1338.39 | 2.09 | 1.25 |
| Others | 33,653.46 | 43.66 | 27,182.58 | 42.5 | 1.24 |
| Total | 77,077.63 | 100.00 | 63,985.43 | 100.00 | 1.20 |
| Disease Classes | Year | |||||||||
|---|---|---|---|---|---|---|---|---|---|---|
| 2011 | 2012 | 2013 | 2014 | 2015 | 2016 | 2017 | 2018 | 2019 | 2020 | |
| Respiratory diseases | 32,359.0 | 33,397.4 | 34,231.0 | 34,771.6 | 32,409.9 | 33,925.6 | 33,569.7 | 34,956.3 | 35,842.1 | 36,080.3 |
| Congenital anomalies, deformities, and chromosomal abnormalities | 206.7 | 193.1 | 211.0 | 217.3 | 89.5 | 120.2 | 124.7 | 120.9 | 116.6 | 115.3 |
| Diseases of the eye | 4127.7 | 3529.2 | 3116 | 3937.1 | 3445.2 | 2735.6 | 2880.8 | 2638.3 | 2725.4 | 2364.2 |
| Circulatory system | 2491.7 | 2351.8 | 2549.8 | 2560.7 | 2669.9 | 3140.1 | 3174.1 | 3221.6 | 3515.8 | 2699.7 |
| Blood and hematopoietic organs | 338.3 | 387.5 | 405.5 | 389.8 | 391.0 | 408.6 | 436.8 | 424.1 | 396.9 | 260.0 |
| Neoplasms | 1085.8 | 1197.1 | 1114.0 | 1219.1 | 1058.6 | 1073.7 | 1037.8 | 969.3 | 1078.5 | 896.9 |
| Endocrine system | 1756.7 | 1687.9 | 1661.5 | 1854.1 | 1620.7 | 1727.5 | 1838.5 | 1456.4 | 1803.9 | 1332.3 |
| Others | 38,095.5 | 38,209.50 | 34,916.3 | 38,096.3 | 29,526.0 | 30,417.6 | 31,912.1 | 31,065.2 | 31,038.7 | 33,257.4 |
| Total morbidity | 80,461.4 | 80,953.5 | 78,205.1 | 83,046.0 | 71,210.8 | 73,548.9 | 74,974.5 | 74,852.1 | 76,517.9 | 77,006.1 |
Publisher’s Note: MDPI stays neutral with regard to jurisdictional claims in published maps and institutional affiliations. |
© 2022 by the authors. Licensee MDPI, Basel, Switzerland. This article is an open access article distributed under the terms and conditions of the Creative Commons Attribution (CC BY) license (https://creativecommons.org/licenses/by/4.0/).
Share and Cite
Gomboev, B.O.; Dambueva, I.K.; Khankhareev, S.S.; Batomunkuev, V.S.; Zangeeva, N.R.; Tsydypov, V.E.; Sharaldaev, B.B.; Badmaev, A.G.; Zhamyanov, D.T.-D.; Bagaeva, E.E.; et al. Atmospheric Air Pollution by Stationary Sources in Ulan-Ude (Buryatia, Russia) and Its Impact on Public Health. Int. J. Environ. Res. Public Health 2022, 19, 16385. https://doi.org/10.3390/ijerph192416385
Gomboev BO, Dambueva IK, Khankhareev SS, Batomunkuev VS, Zangeeva NR, Tsydypov VE, Sharaldaev BB, Badmaev AG, Zhamyanov DT-D, Bagaeva EE, et al. Atmospheric Air Pollution by Stationary Sources in Ulan-Ude (Buryatia, Russia) and Its Impact on Public Health. International Journal of Environmental Research and Public Health. 2022; 19(24):16385. https://doi.org/10.3390/ijerph192416385
Chicago/Turabian StyleGomboev, Bair O., Irina K. Dambueva, Sergey S. Khankhareev, Valentin S. Batomunkuev, Natalya R. Zangeeva, Vitaly E. Tsydypov, Bayanzhargal B. Sharaldaev, Aldar G. Badmaev, Daba Ts.-D. Zhamyanov, Elena E. Bagaeva, and et al. 2022. "Atmospheric Air Pollution by Stationary Sources in Ulan-Ude (Buryatia, Russia) and Its Impact on Public Health" International Journal of Environmental Research and Public Health 19, no. 24: 16385. https://doi.org/10.3390/ijerph192416385
APA StyleGomboev, B. O., Dambueva, I. K., Khankhareev, S. S., Batomunkuev, V. S., Zangeeva, N. R., Tsydypov, V. E., Sharaldaev, B. B., Badmaev, A. G., Zhamyanov, D. T.-D., Bagaeva, E. E., Madeeva, E. V., Motoshkina, M. A., Ayusheeva, V. G., Rygzynov, T. S., Tsybikova, A. B., Ayurzhanaev, A. A., Sodnomov, B. V., Banzaraktcaev, Z. E., Alekseev, A. V., ... Norboeva, B. S. (2022). Atmospheric Air Pollution by Stationary Sources in Ulan-Ude (Buryatia, Russia) and Its Impact on Public Health. International Journal of Environmental Research and Public Health, 19(24), 16385. https://doi.org/10.3390/ijerph192416385