


Ecological Risk Assessment and Source Apportionment of Heavy Metals in the Soil of an Opencast Mine in Xinjiang
Abstract
1. Introduction
2. Methods
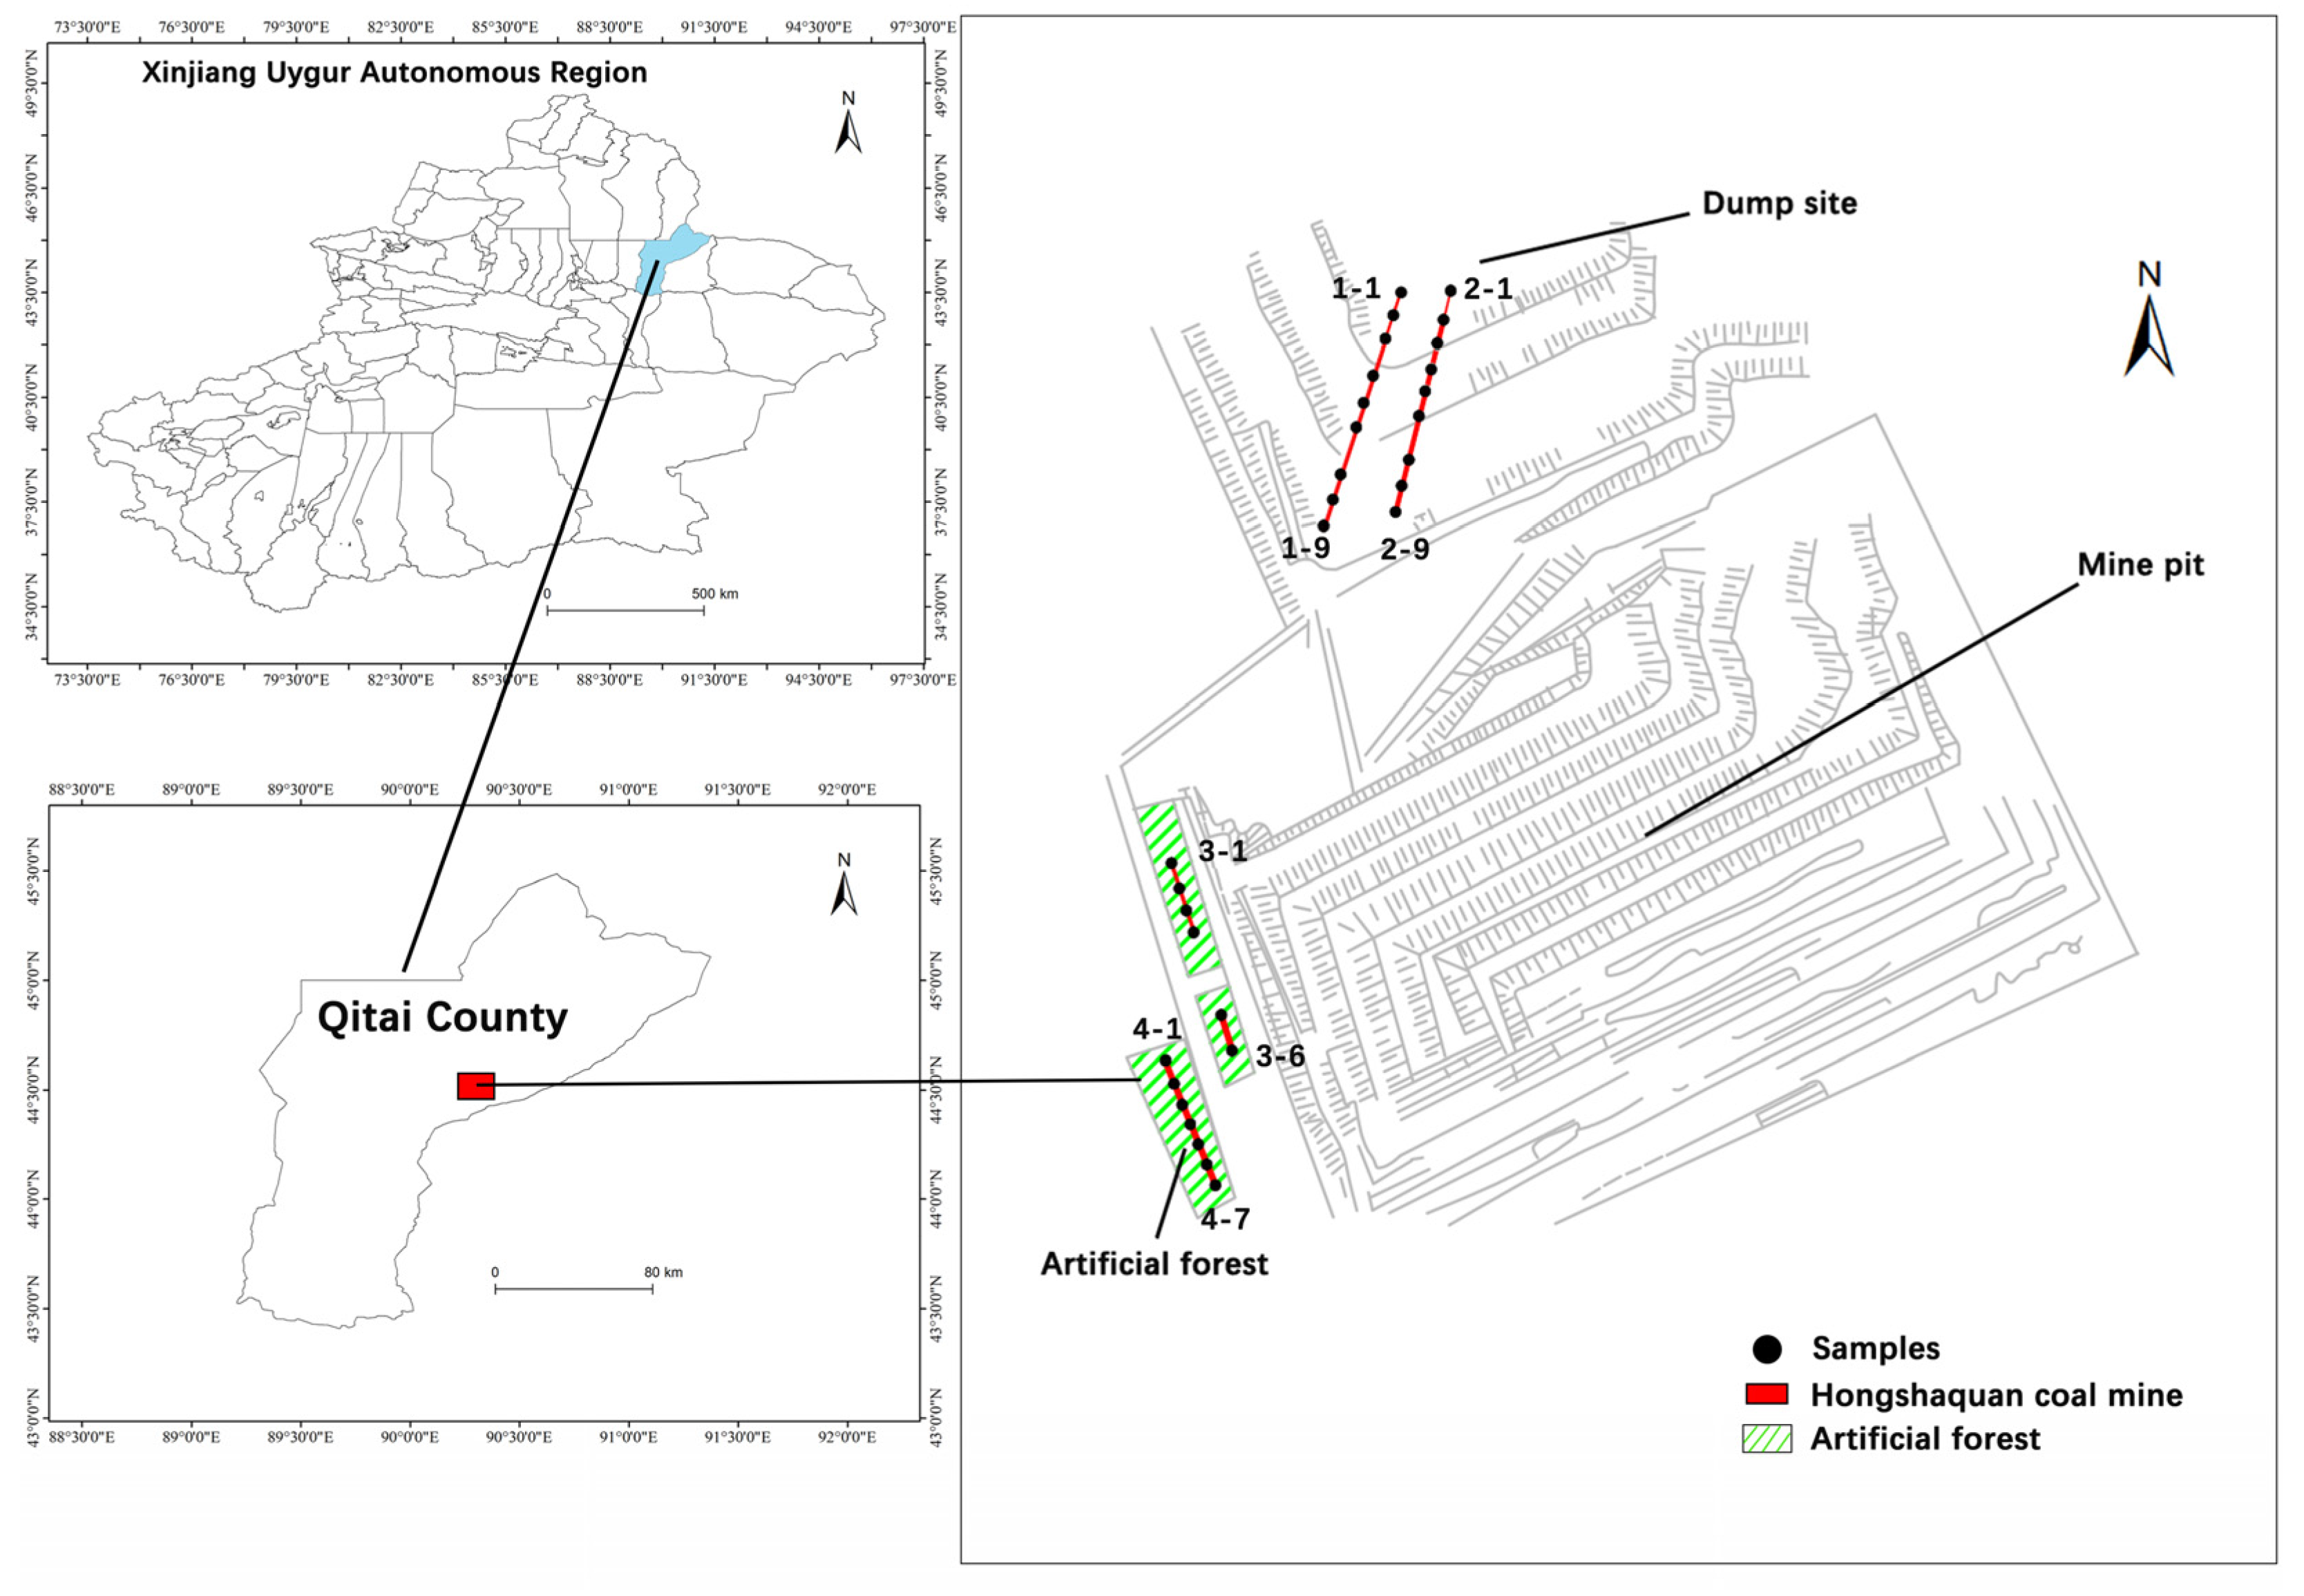
2.1. Study Area
2.2. Soil Sample Collection and Analysis
2.3. Pollution Index Method and Geoaccumulation Index Method
2.4. Potential Ecological Risk Index Method
2.5. Health Risk Assessment
3. Results
3.1. Distribution of Soil Heavy Metals in Mining Areas
3.2. Pollution Factors and Ground Accumulation Index Evaluation Results
3.3. Potential Ecological Risk Assessment
3.4. Health Ecological Risk Assessment
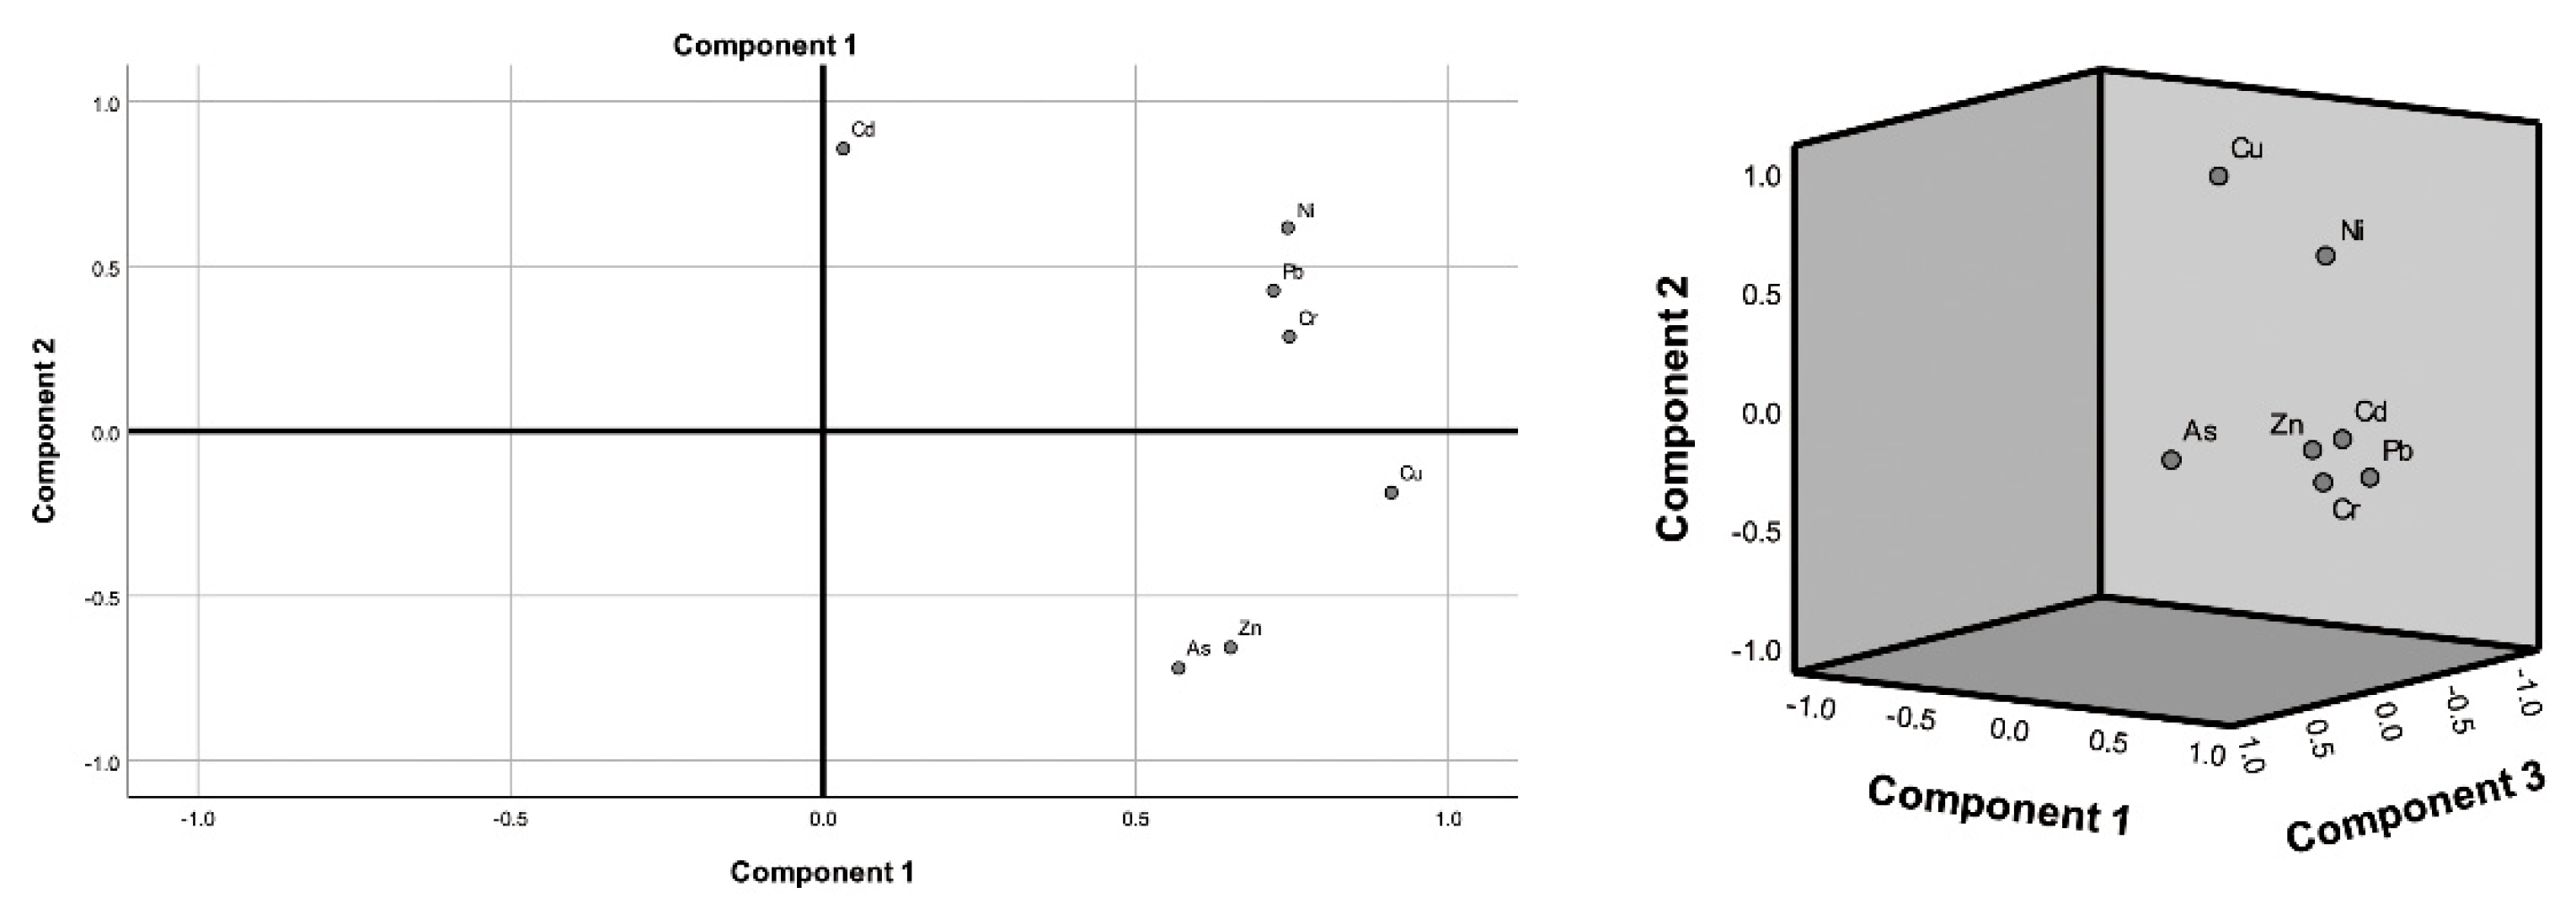
3.5. Source Analysis of Heavy Metals
4. Discussion
5. Conclusions
Supplementary Materials
Author Contributions
Funding
Institutional Review Board Statement
Informed Consent Statement
Data Availability Statement
Acknowledgments
Conflicts of Interest
References
- Potra, A.; Dodd, J.W.; Ruhl, L.S. Distribution of trace elements and Pb isotopes in stream sediments of the Tri-State mining district (Oklahoma, Kansas, and Missouri), USA. Appl. Geochem. 2017, 82, 25–37. [Google Scholar] [CrossRef]
- Mendoza, E.O.; Cuadrado, W.; Yallico, L.; Zárate, R.; Quispe-Melgar, H.R.; Limaymanta, C.H.; Sarapura, V.; Bao-Cóndor, D. Heavy metals in soils and edible tissues of Lepidium meyenii (maca) and health risk assessment in areas influenced by mining activity in the Central region of Peru. Toxicol. Rep. 2021, 8, 1461–1470. [Google Scholar] [CrossRef] [PubMed]
- She, W.; Guo, L.; Gao, J.; Zhang, C.; Wu, S.; Jiao, Y.; Zhu, G. Spatial Distribution of Soil Heavy Metals and Associated Environmental Risks near Major Roads in Southern Tibet, China. Int. J. Environ. Res. Public Health 2022, 19, 8380. [Google Scholar] [CrossRef] [PubMed]
- Abdusalam, A. Pollution Characteristics and Health Risk Assessment of Soil Heavy Metals in East Junggar Region; Xinjiang University: Ürümqi, China, 2018. [Google Scholar]
- Hu, Z.; Fu, Y.; Xiao, W.; Zhao, Y.; Wei, T. Ecological restoration plan for abandoned underground coal mine site in Eastern China. Int. J. Min. Reclam. Environ. 2015, 29, 316–330. [Google Scholar] [CrossRef]
- Lin, C.; Liu, H.; Guo, M.; Zhao, Y.; Su, X.; Zhang, P.; Zhang, Y. Plasmon-induced broad spectrum photocatalytic overall water splitting: Through non-noble bimetal nanoparticles hybrid with reduced graphene oxide. Colloids Surf. A Physicochem. Eng. Asp. 2022, 646, 128962. [Google Scholar] [CrossRef]
- Geng, Q.; Wang, H.; Wang, J.; Hong, J.; Sun, W.; Wu, Y.; Wang, Y. Boosting the Capacity of Aqueous Li-Ion Capacitors via Pinpoint Surgery in Nanocoral-Like Covalent Organic Frameworks. Small Methods 2022, 6, 2200314. [Google Scholar] [CrossRef]
- Chen, R.; Han, L.; Liu, Z.; Zhao, Y.; Li, R.; Xia, L.; Fan, Y. Assessment of Soil-Heavy Metal Pollution and the Health Risks in a Mining Area from Southern Shaanxi Province, China. Toxics 2022, 10, 385. [Google Scholar] [CrossRef]
- Zhu, D.; Wei, Y.; Zhao, Y.; Wang, Q.; Han, J. Heavy Metal Pollution and Ecological Risk Assessment of the Agriculture Soil in Xunyang Mining Area, Shaanxi Province, Northwestern China. Bull. Environ. Contam. Toxicol. 2018, 101, 178–184. [Google Scholar] [CrossRef]
- Xie, Y.; Zhou, Y.; Gao, C.; Liu, L.; Zhang, Y.; Chen, Y.; Shao, Y. Construction of AgBr/BiOBr S-scheme heterojunction using ion exchange strategy for high-efficiency reduction of CO2 to CO under visible light. Sep. Purif. Technol. 2022, 303, 122288. [Google Scholar] [CrossRef]
- Zhang, L.; Wang, J.; Feng, Y. Life cycle assessment of opencast coal mine production: A case study in Yimin mining area in China. Environ. Sci. Pollut. Res. 2018, 25, 8475–8486. [Google Scholar] [CrossRef]
- Zhang, L.; Wang, J.; Bai, Z.; Lv, C. Effects of vegetation on runoff and soil erosion on reclaimed land in an opencast coal-mine dump in a less area. Catena 2015, 128, 44–53. [Google Scholar] [CrossRef]
- Abdusalam, A.; Wang, H.; Yang, S.; Sawut, M.; Yakup, Z.; He, Z. Spatial variabilities and distributions of heavy metal contents in opencast mine soils. Soils 2018, 50, 376–384. [Google Scholar]
- Heidari, M.; Darijani, T.; Alipour, V. Heavy metal pollution of road dust in a city and its highly polluted suburb; quantitative source apportionment and source-specific ecological and health risk assessment. Chemosphere 2021, 273, 129656. [Google Scholar] [CrossRef]
- Li, R.; Yuan, Y.; Li, C.; Sun, W.; Yang, M.; Wang, X. Environmental Health and Ecological Risk Assessment of Soil Heavy Metal Pollution in the Coastal Cities of Estuarine Bay Case Study of Hangzhou Bay, China. Toxics 2020, 8, 75. [Google Scholar] [CrossRef]
- Lu, J.; Lu, H.; Wang, W.; Feng, S.; Lei, K. Ecological risk assessment of heavy metal contamination of mining area soil based on land type changes: An information network environ analysis. Ecol. Model. 2021, 455, 109633. [Google Scholar] [CrossRef]
- Sheng, X.; Zhaohui, Z.; Zhihui, W. Effects of heavy metals on moss diversity and analysis of moss indicator species in Nancha manganese mining area, Southwestern China. Glob. Ecol. Conserv. 2021, 28, e01665. [Google Scholar] [CrossRef]
- González-Valoys, A.C.; Esbrí, J.M.; Campos, J.A.; Arrocha, J.; García-Noguero, E.M.; Monteza-Destro, T.; Martínez, E.; Jiménez-Ballesta, R.; Gutiérrez, E.; Vargas-Lombardo, M.; et al. Ecological and Health Risk Assessments of an Abandoned Gold Mine (Remance, Panama): Complex Scenarios Need a Combination of Indices. Int. J. Environ. Res. Public Health 2021, 18, 9369. [Google Scholar] [CrossRef] [PubMed]
- Wang, J.; Su, J.; Li, Z.; Liu, B.; Cheng, G.; Jiang, Y.; Li, Y.; Zhou, S.; Yuan, W. Source apportionment of heavy metal and their health risks in soil-dustfall-plant system nearby a typical non-ferrous metal mining area of Tongling, Eastern China. Environ. Pollut. 2019, 254, 113089. [Google Scholar] [CrossRef]
- Li, J.; Li, D.; Liao, Y. Evaluation of heavy metals pollution in soil of dump in a abandoned mining area, Northern Guangdong. Mod. Min. 2017, 33, 234–238. [Google Scholar]
- Xiang, L.; Liu, P.H.; Jiang, X.F.; Chen, P.J. Health risk assessment and spatial distribution characteristics of heavy metal pollution in rice samples from a surrounding hydrometallurgy plant area in No. 721 uranium mining, East China. J. Geochem. Explor. 2019, 207, 106360. [Google Scholar] [CrossRef]
- Zhou, L.; Zhao, X.; Meng, Y.; Fei, Y.; Teng, M.; Song, F.; Wu, F. Identification priority source of soil heavy metals pollution based on source-specific ecological and human health risk analysis in a typical smelting and mining region of South China. Ecotoxicol. Environ. Saf. 2022, 242, 113864. [Google Scholar] [CrossRef] [PubMed]
- Mamut, A.; Eziz, M.; Mohammad, A. Pollution and Ecological Risk Assessment of Heavy Metals in Farmland Soils in Yanqi County, Xinjiang, Northwest China. Eurasian Soil Sci. 2018, 51, 985–993. [Google Scholar] [CrossRef]
- Obiri-Nyarko, F.; Duah, A.A.; Karikari, A.Y.; Agyekum, W.A.; Manu, E.; Tagoe, R. Assessment of heavy metal contamination in soils at the Kpone landfill site, Ghana: Implication for ecological and health risk assessment. Chemosphere 2021, 282, 131007. [Google Scholar] [CrossRef]
- Liu, E.; Wang, X.; Liu, H.; Liang, M.; Zhu, Y.; Li, Z. Chemical speciation, pollution and ecological risk of toxic metals in readily washed off road dust in a megacity (Nanjing), China. Ecotoxicol. Environ. Saf. 2019, 173, 381–392. [Google Scholar] [CrossRef]
- Liu, D.; Zhao, Y.; Zhou, D.; Zhang, J. Ecological risk assessment of heavy metals pollution in a tungsten mine soil in south of Jiangxi Province. Environ. Chem. 2017, 36, 1556–1567. [Google Scholar]
- Cui, L.; Wang, X.; Li, J.; Gao, X.; Zhang, J.; Liu, Z. Ecological and health risk assessments and water quality criteria of heavy metals in the Haihe River. Environ. Pollut. 2021, 290, 117971. [Google Scholar] [CrossRef] [PubMed]
- Duan, Q.; Lee, J.; Liu, Y.; Chen, H.; Hu, H. Distribution of Heavy Metal Pollution in Surface Soil Samples in China: A Graphical Review. Bull. Environ. Contam. Toxicol. 2016, 97, 303–309. [Google Scholar] [CrossRef]
- Zhan, R.; Hu, D.; Zhen, L.; Rong, T. Pollution evaluation and source analysis of heavy metals in facility vegetable land soils of Tianzhen County of Shanxi Province. Environ. Pollut. Control. 2021, 43, 1573–1577. [Google Scholar]
- Xia, J.; Long, J.; Gao, Y.; Chen, Y.; Meng, J.; Zhou, Y.; Chen, S. Ecological risk assessment and source analysis of heavy metal pollutions in sediments of the Chaohu Lake. Earth Environ. 2020, 48, 220–227. [Google Scholar]
- Dong, L.; Hu, W.; Huang, B.; Liu, G.; Qu, M.; Kuang, R. Source appointment of heavy metals in suburban farmland soils based on positive matrix factorization. China Environ. Sci. 2015, 35, 2103–2111. [Google Scholar]
- Wu, Q.; Hu, W.; Wang, H.; Liu, P.; Wang, X.; Huang, B. Spatial distribution, ecological risk and sources of heavy metals in soils from a typical economic development area, Southeastern China. Sci. Total Environ. 2021, 780, 146557. [Google Scholar] [CrossRef]
- Zhang, H.; Zhang, F.; Song, J.; Tan, M.L.; Johnson, V.C. Pollutant source, ecological and human health risks assessment of heavy metals in soils from coal mining areas in Xinjiang, China. Environ. Res. 2021, 202, 111702. [Google Scholar] [CrossRef] [PubMed]
- Marrugo-Negrete, J.; Pinedo-Hernndez, J.; Dez, S. Assessment of heavy metal pollution, spatial distribution and origin in agricultural soils along the Sinú River Basin, Colombia. Environ. Res. 2017, 154, 380–388. [Google Scholar] [CrossRef]
- Zhang, Z.; Lu, Y.; Li, H.; Tu, Y.; Liu, B.; Yang, Z. Assessment of heavy metal contamination, distribution and source identification in the sediments from the Zijiang River, China. Sci. Total Environ. 2018, 645, 235–243. [Google Scholar] [CrossRef]
- Mamat, Z.; Haximu, S.; Zhang, Z.Y.; Aji, R. An ecological risk assessment of heavy metal contamination in the surface sediments of Bosten Lake, northwest China. Environ. Sci. Pollut. Res. 2016, 23, 7255–7265. [Google Scholar] [CrossRef]
- Hakanson, L. An ecological risk index for aquatic pollution control.a sedimentological approach. Water Res. 1980, 14, 975–1001. [Google Scholar] [CrossRef]
- Chabukdhara, M.; Nema, A.K. Heavy metals assessment in urban soil around industrial clusters in Ghaziabad, India: Probabilistic health risk approach. Ecotoxicol. Environ. Saf. 2013, 87, 57–64. [Google Scholar] [CrossRef] [PubMed]
- Jiang, C.; Zhao, Q.; Zheng, L.; Chen, X.; Li, C.; Ren, M. Distribution, source and health risk assessment based on the Monte Carlo method of heavy metals in shallow groundwater in an area affected by mining activities, China. Ecotoxicol. Environ. Saf. 2021, 224, 112679. [Google Scholar] [CrossRef] [PubMed]
- Li, Z.; Ma, Z.; van der Kuijp, T.J.; Yuan, Z.; Huang, L. A review of soil heavy metal pollution from mines in China: Pollution and health risk assessment. Sci. Total Environ. 2014, 468–469, 843–853. [Google Scholar] [CrossRef]
- Liang, Y.; Yi, X.; Dang, Z.; Wang, Q.; Luo, H.; Tang, J. Heavy Metal Contamination and Health Risk Assessment in the Vicinity of a Tailing Pond in Guangdong, China. Int. J. Environ. Res. Public Health 2017, 14, 1557. [Google Scholar] [CrossRef]
- Gao, Y.; Guo, X.; Li, C.; Ding, H.; Tang, L.; Ji, H. Characteristics of PM2.5 in Miyun, the northeastern suburb of Beijing: Chemical composition and evaluation of health risk. Environ. Sci. Pollut. Res. 2015, 22, 16688–16699. [Google Scholar] [CrossRef]
- Chen, H.; Teng, Y.; Lu, S.; Wang, Y.; Wu, J.; Wang, J. Source apportionment and health risk assessment of trace metals in surface soils of Beijing metropolitan, China. Chemosphere 2016, 144, 1002–1011. [Google Scholar] [CrossRef] [PubMed]
- Chen, M.; Li, F.; Tao, M.; Hu, L.; Shi, Y.; Liu, Y. Distribution and ecological risks of heavy metals in river sediments and overlying water in typical mining areas of China. Mar. Pollut. Bull. 2019, 146, 893–899. [Google Scholar] [CrossRef] [PubMed]
- Yan, B.; Xu, D.M.; Chen, T.; Yan, Z.A.; Li, L.L.; Wang, M.H. Leachability characteristic of heavy metals and associated health risk study in typical copper mining-impacted sediments. Chemosphere 2020, 239, 124748. [Google Scholar] [CrossRef]
- Hu, X.; Zhang, Y.; Luo, J.; Wang, T.; Lian, H.; Ding, Z. Bioaccessibility and health risk of arsenic, mercury and other metals in urban street dusts from a mega-city, Nanjing, China. Environ. Pollut. 2011, 159, 1215–1221. [Google Scholar] [CrossRef] [PubMed]
- Ferreira-Baptista, L.; De Miguel, E. Geochemistry and risk assessment of street dust in Luanda, Angola: A tropical urban environment. Atmos. Environ. 2005, 39, 4501–4512. [Google Scholar] [CrossRef]
- Aguilera, A.; Bautista, F.; Gutiérrez-Ruiz, M.; Ceniceros-Gómez, A.E.; Cejudo, R.; Goguitchaichvili, A. Heavy metal pollution of street dust in the largest city of Mexico, sources and health risk assessment. Environ. Monit. Assess. 2021, 193, 193. [Google Scholar] [CrossRef] [PubMed]
- Fakhri, Y.; Alipour, M.; Mousavi Khaneghah, A. Refer to “Health risk assessment of heavy metals in Cyprinus carpio (Cyprinidae) from the upper Mekong River” by Zhang et al. (2019). Environ. Sci. Pollut. Res. 2021, 28, 4891–4892. [Google Scholar] [CrossRef] [PubMed]
- Zhou, L.Y.; Yue, H.; Li, X.; Mo, G.; Kang, L.P.; Guo, L.P. Bioaccessibility of heavy metal in wild Artemisia annua and its health risk assessment. China J. Chin. Mater. Med. 2015, 40, 1904–1907. [Google Scholar]
- Chen, X.; Lu, X.; Yang, G. Sources identification of heavy metals in urban topsoil from inside the Xi’an Second Ringroad, NW China using multivariate statistical methods. Catena 2012, 98, 73–78. [Google Scholar] [CrossRef]
- Song, H.; Li, J.; Li, L.; Dong, J.; Hou, W.; Yang, R.; Zhang, S.; Zu, S.; Ma, P.; Zhao, W. Heavy Metal Pollution Characteristics and Source Analysis in the Dust Fall on Buildings of Different Heights. Int. J. Environ. Res. Public Health 2022, 19, 11376. [Google Scholar] [CrossRef] [PubMed]
- Ji, Z.; Zhang, H.; Zhang, Y.; Chen, T.; Long, Z.; Li, M.; Pei, Y. Distribution, ecological risk and source identification of heavy metals in sediments from the Baiyangdian Lake, Northern China. Chemosphere 2019, 237, 124425. [Google Scholar] [CrossRef] [PubMed]
- Liang, J.; Feng, C.; Zeng, G.; Gao, X.; Zhong, M.; Li, X.; Li, X.; He, X.; Fang, Y. Spatial distribution and source identification of heavy metals in surface soils in a typical coal mine city, Lianyuan, China. Environ. Pollut. 2017, 225, 681–690. [Google Scholar] [CrossRef] [PubMed]
- Chen, X.; Lei, M.; Zhang, S.; Zhang, D.; Guo, G.; Zhao, X. Apportionment and Spatial Pattern Analysis of Soil Heavy Metal Pollution Sources Related to Industries of Concern in a County in Southwestern China. Int. J. Environ. Res. Public Health 2022, 19, 7421. [Google Scholar] [CrossRef]
- Jin, B.; Wang, J.; Lou, W.; Wang, L.; Xu, J.; Pan, Y.; Peng, J.; Liu, D. Pollution, Ecological Risk and Source Identification of Heavy Metals in Sediments from the Huafei River in the Eastern Suburbs of Kaifeng, China. Int. J. Environ. Res. Public Health 2022, 19, 11259. [Google Scholar] [CrossRef]
- Liu, W.; Yang, J.J.; Wang, J.; Wang, G.; Cao, Y.E. Contamination Assessment and Sources Analysis of Soil Heavy Metals in Opencast Mine of East Junggar Basin in Xinjiang. Huanjing Kexue 2016, 37, 1938–1945. [Google Scholar]
- Teng, Y.; Wu, J.; Lu, S.; Wang, Y.; Jiao, X.; Song, L. Soil and soil environmental quality monitoring in China: A review. Environ. Int. 2014, 69, 177–199. [Google Scholar] [CrossRef]


| Area | Number of Points | Numbering | Longitude & Latitude | |
|---|---|---|---|---|
| Longitude | Latitude | |||
| Dump site | 18 | 1-1–1-9 | E 90°16′40″ | N 44°30′42″ |
| 2-1–2-9 | ||||
| Artificial forest | 13 | 3-1–3-6 | E 90°16′50″ | N 44°30′10″ |
| 4-1–4-7 | ||||
| Zn | Ni | Cu | Cr | Pb | As | Cd | |
|---|---|---|---|---|---|---|---|
| Maximum | 71.12 | 15.43 | 23.87 | 18.43 | 34.09 | 10.14 | 0.16 |
| Minimum | 32.70 | 0.06 | 9.84 | 0.10 | 21.98 | 4.64 | 0.07 |
| SD | 7.64 | 4.25 | 2.56 | 5.49 | 3.50 | 1.20 | 0.02 |
| Average | 45.04 | 6.19 | 15.40 | 8.33 | 27.78 | 6.75 | 0.10 |
| CV (%) | 16.97 | 68.55 | 16.61 | 65.89 | 12.60 | 17.76 | 17.16 |
| Soil background in Xinjiang, China | 68.80 | 26.40 | 35.80 | 39.60 | 13.50 | 9.09 | 0.12 |
| China Standard Value (pH > 7.5) | 300 | 190 | 100 | 250 | 170 | 25 | 0.6 |
| Exceeding the background value ratio (%) | 0 | 0 | 0 | 0 | 100 | 3.23 | 16.7 |
| Area | Potential Ecological Risk Coefficient of Single Element | Comprehensive Potential Ecological Risk Coefficient RI | ||||||
|---|---|---|---|---|---|---|---|---|
| Zn | Ni | Cu | As | Pb | Cd | Cr | ||
| Dump site | 0.65 | 0.72 | 2 | 7.69 | 10.63 | 25.83 | 0.02 | 47.55 |
| Artificial forest | 0.66 | 1.07 | 2.36 | 7.06 | 9.82 | 26.54 | 0.27 | 47.78 |
| HQskin | HQinhalation | HQuptake | Non-Cancer Risk Index (Hi) | |||||
|---|---|---|---|---|---|---|---|---|
| Children | Adults | Children | Adults | Children | Adults | Children | Adults | |
| Dump site | ||||||||
| Zn | 1.19 × 10⁻⁶ | 2.24 × 10⁻⁵ | 2.37 × 10⁻⁹ | 9.25 × 10⁻⁹ | 2.12 × 10⁻⁵ | 1.57 × 10⁻⁵ | 2.24 × 10⁻⁵ | 3.81 × 10⁻⁵ |
| Ni | 1.68 × 10⁻⁶ | 2.18 × 10⁻⁵ | 1.01 × 10⁻⁶ | 2.70 × 10⁻⁶ | 4.06 × 10⁻⁵ | 2.07 × 10⁻⁵ | 4.33 × 10⁻⁵ | 4.52 × 10⁻⁵ |
| Cu | 1.89 × 10⁻⁶ | 3.73 × 10⁻⁵ | 1.58 × 10⁻⁸ | 6.46 × 10⁻⁸ | 5.07 × 10⁻⁵ | 3.93 × 10⁻⁵ | 5.26 × 10⁻⁵ | 7.67 × 10⁻⁵ |
| Cr | 7.91 × 10⁻⁵ | 1.99 × 10⁻⁴ | 1.66 × 10⁻⁶ | 8.63 × 10⁻⁷ | 1.41 × 10⁻⁴ | 1.40 × 10⁻⁵ | 2.22 × 10⁻⁴ | 2.14 × 10⁻⁴ |
| Pb | 8.68 × 10⁻⁵ | 1.58 × 10⁻³ | 1.30 × 10⁻⁷ | 4.90 × 10⁻⁷ | 1.16 × 10⁻³ | 8.33 × 10⁻⁴ | 1.25 × 10⁻³ | 2.42 × 10⁻³ |
| As | 9.02 × 10⁻⁵ | 1.70 × 10⁻³ | 3.30 × 10⁻³ | 2.45 × 10⁻³ | 3.39 × 10⁻³ | 4.15 × 10⁻³ | ||
| Cd | 1.59 × 10⁻⁵ | 2.93 × 10⁻⁴ | 1.58 × 10⁻⁷ | 6.05 × 10⁻⁷ | 1.42 × 10⁻⁵ | 1.03 × 10⁻⁵ | 3.02 × 10⁻⁵ | 3.04 × 10⁻⁴ |
| Artificial forest | ||||||||
| Zn | 1.20 × 10⁻⁶ | 2.19 × 10⁻⁵ | 2.40 × 10⁻⁹ | 9.03 × 10⁻⁹ | 2.14 × 10⁻⁵ | 1.53 × 10⁻⁵ | 2.26 × 10⁻⁵ | 3.72 × 10⁻⁵ |
| Ni | 1.98 × 10⁻⁶ | 4.57 × 10⁻⁵ | 1.19 × 10⁻⁶ | 5.66 × 10⁻⁶ | 4.77 × 10⁻⁵ | 4.33 × 10⁻⁵ | 5.09 × 10⁻⁵ | 9.47 × 10⁻⁵ |
| Cu | 2.26 × 10⁻⁶ | 3.98 × 10⁻⁵ | 1.89 × 10⁻⁸ | 6.90 × 10⁻⁸ | 6.05 × 10⁻⁵ | 4.19 × 10⁻⁵ | 6.27 × 10⁻⁵ | 8.18 × 10⁻⁵ |
| Cr | 2.64 × 10⁻⁴ | 7.64 × 10⁻³ | 5.52 × 10⁻⁶ | 3.31 × 10⁻⁵ | 4.71 × 10⁻⁴ | 5.36 × 10⁻⁴ | 7.40 × 10⁻⁴ | 8.21 × 10⁻³ |
| Pb | 8.13 × 10⁻⁵ | 1.52 × 10⁻³ | 1.22 × 10⁻⁷ | 4.71 × 10⁻⁷ | 1.09 × 10⁻³ | 8.01 × 10⁻⁴ | 1.17 × 10⁻³ | 2.32 × 10⁻³ |
| As | 8.43 × 10⁻⁵ | 1.67 × 10⁻³ | 3.08 × 10⁻³ | 2.41 × 10⁻³ | 3.17 × 10⁻³ | 4.08 × 10⁻³ | ||
| Cd | 1.72 × 10⁻⁵ | 3.26 × 10⁻⁴ | 1.71 × 10⁻⁷ | 6.72 × 10⁻⁷ | 1.53 × 10⁻⁵ | 1.14 × 10⁻⁵ | 3.27 × 10⁻⁵ | 3.38 × 10⁻⁴ |
| Area | Zn | Ni | Cu | Cr | Pb | As | Cd |
|---|---|---|---|---|---|---|---|
| Dump site | |||||||
| Zn | 1 | ||||||
| Ni | 0.074 | 1 | |||||
| Cu | 0.689 ** | 0.537 * | 1 | ||||
| Cr | 0.176 | 0.740 ** | 0.653 ** | 1 | |||
| Pb | 0.227 | 0.758 ** | 0.473 * | 0.438 | 1 | ||
| As | 0.830 ** | −0.026 | 0.580 * | 0.116 | 0.184 | 1 | |
| Cd | −0.421 | 0.507 * | −0.122 | 0.079 | 0.416 | −0.492 * | 1 |
| Artificial forest | |||||||
| Zn | 1 | ||||||
| Ni | 0.427 | 1 | |||||
| Cu | 0.109 | 0.772 ** | 1 | ||||
| Cr | 0.690 ** | 0.487 | −0.029 | 1 | |||
| Pb | 0.588 * | 0.277 | −0.109 | 0.544 | 1 | ||
| As | 0.451 | 0.264 | 0.025 | 0.624 * | 0.013 | 1 | |
| Cd | 0.284 | 0.494 | −0.03 | 0.637 * | 0.463 | 0.236 | 1 |
| Dump Site | 1 | 2 | Artificial Forest | 1 | 2 | 3 |
|---|---|---|---|---|---|---|
| Cu | 0.909 | −0.187 | Cr | 0.904 | −0.243 | 0.156 |
| Cr | 0.746 | 0.286 | Zn | 0.793 | −0.129 | 0.073 |
| Ni | 0.743 | 0.617 | Ni | 0.724 | 0.654 | −0.120 |
| Pb | 0.720 | 0.426 | Cd | 0.700 | −0.144 | −0.275 |
| Cd | 0.032 | 0.857 | Pb | 0.647 | −0.351 | −0.551 |
| As | 0.569 | −0.719 | Cu | 0.239 | 0.953 | −0.037 |
| Zn | 0.651 | −0.657 | As | 0.571 | −0.092 | 0.780 |
| Total | 3.202 | 2.361 | Total | 3.264 | 1.565 | 1.033 |
| Variance (%) | 45.74 | 33.73 | Variance (%) | 46.62 | 22.35 | 14.75 |
| Cumulative (%) | 45.74 | 79.47 | Cumulative (%) | 46.62 | 68.98 | 83.74 |
Publisher’s Note: MDPI stays neutral with regard to jurisdictional claims in published maps and institutional affiliations. |
© 2022 by the authors. Licensee MDPI, Basel, Switzerland. This article is an open access article distributed under the terms and conditions of the Creative Commons Attribution (CC BY) license (https://creativecommons.org/licenses/by/4.0/).
Share and Cite
Fan, T.; Pan, J.; Wang, X.; Wang, S.; Lu, A. Ecological Risk Assessment and Source Apportionment of Heavy Metals in the Soil of an Opencast Mine in Xinjiang. Int. J. Environ. Res. Public Health 2022, 19, 15522. https://doi.org/10.3390/ijerph192315522
Fan T, Pan J, Wang X, Wang S, Lu A. Ecological Risk Assessment and Source Apportionment of Heavy Metals in the Soil of an Opencast Mine in Xinjiang. International Journal of Environmental Research and Public Health. 2022; 19(23):15522. https://doi.org/10.3390/ijerph192315522
Chicago/Turabian StyleFan, Tingyu, Jinhong Pan, Xingming Wang, Shun Wang, and Akang Lu. 2022. "Ecological Risk Assessment and Source Apportionment of Heavy Metals in the Soil of an Opencast Mine in Xinjiang" International Journal of Environmental Research and Public Health 19, no. 23: 15522. https://doi.org/10.3390/ijerph192315522
APA StyleFan, T., Pan, J., Wang, X., Wang, S., & Lu, A. (2022). Ecological Risk Assessment and Source Apportionment of Heavy Metals in the Soil of an Opencast Mine in Xinjiang. International Journal of Environmental Research and Public Health, 19(23), 15522. https://doi.org/10.3390/ijerph192315522