
The Functional Form of the Relationship between Body Height, Body Mass Index and Change of Direction Speed, Agility in Elite Female Basketball and Handball Players


Abstract
1. Introduction
2. Materials and Methods
2.1. Participants
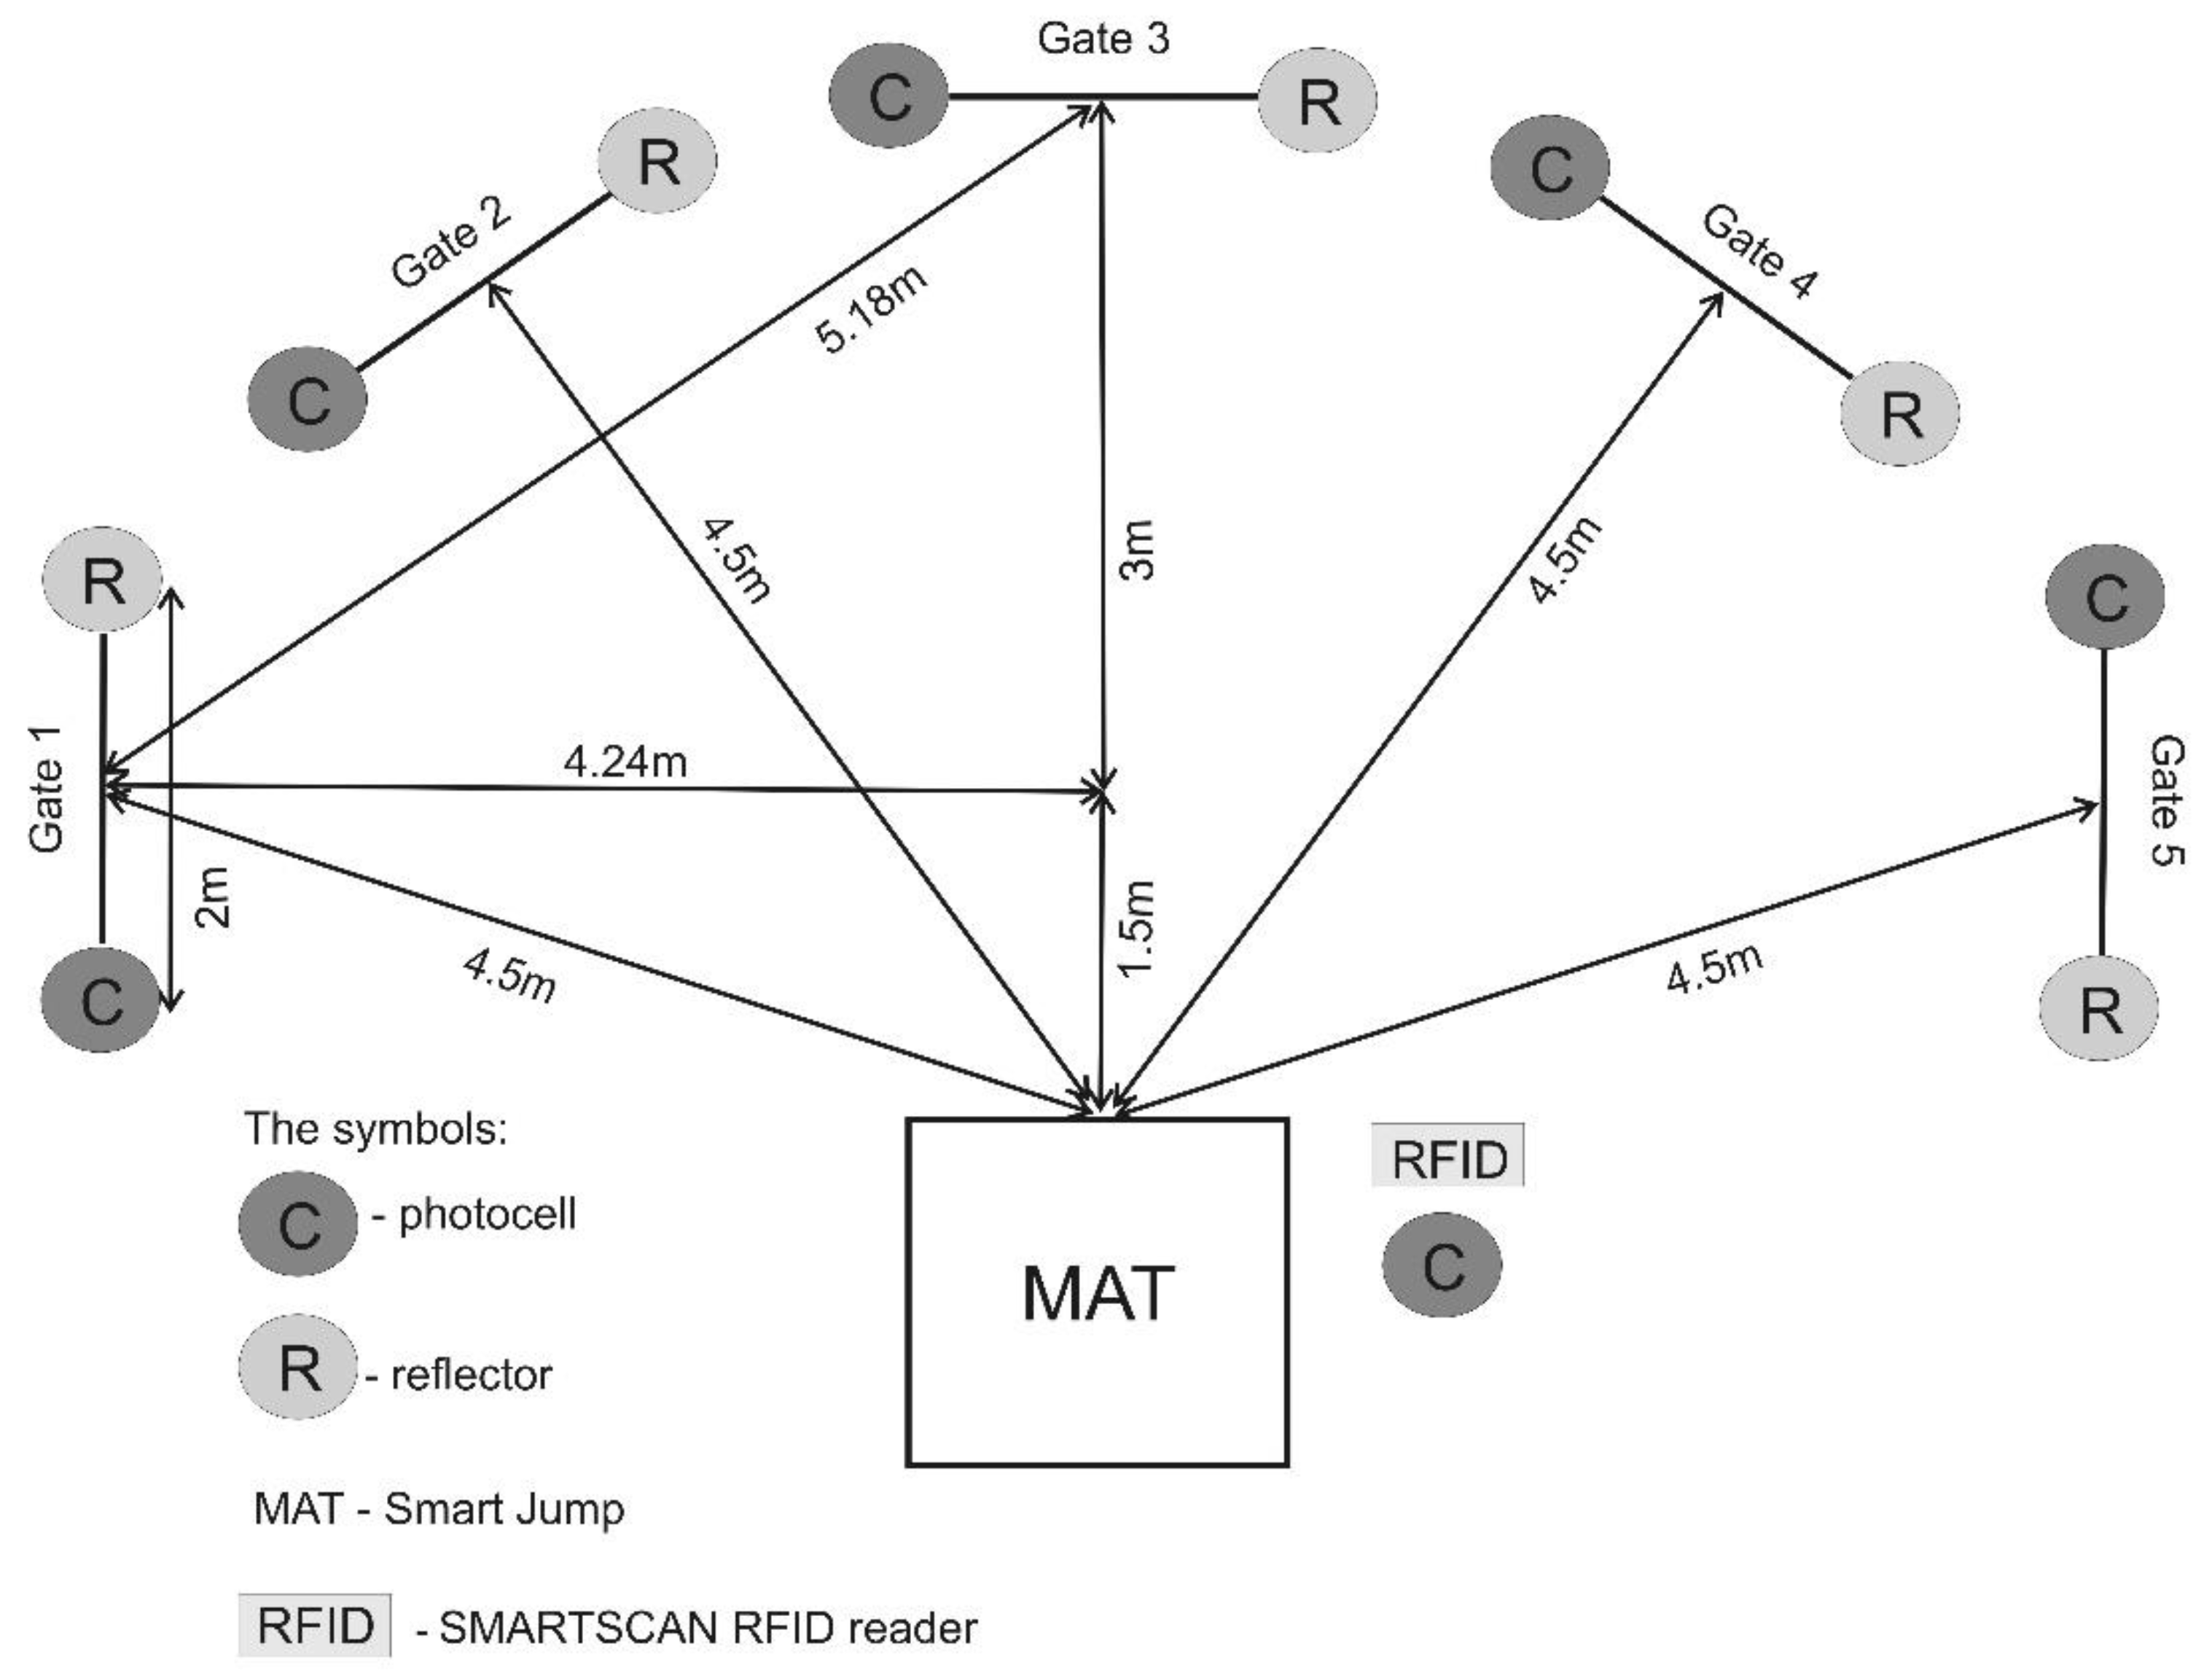
2.2. Measurements
2.3. Statistical Procedures
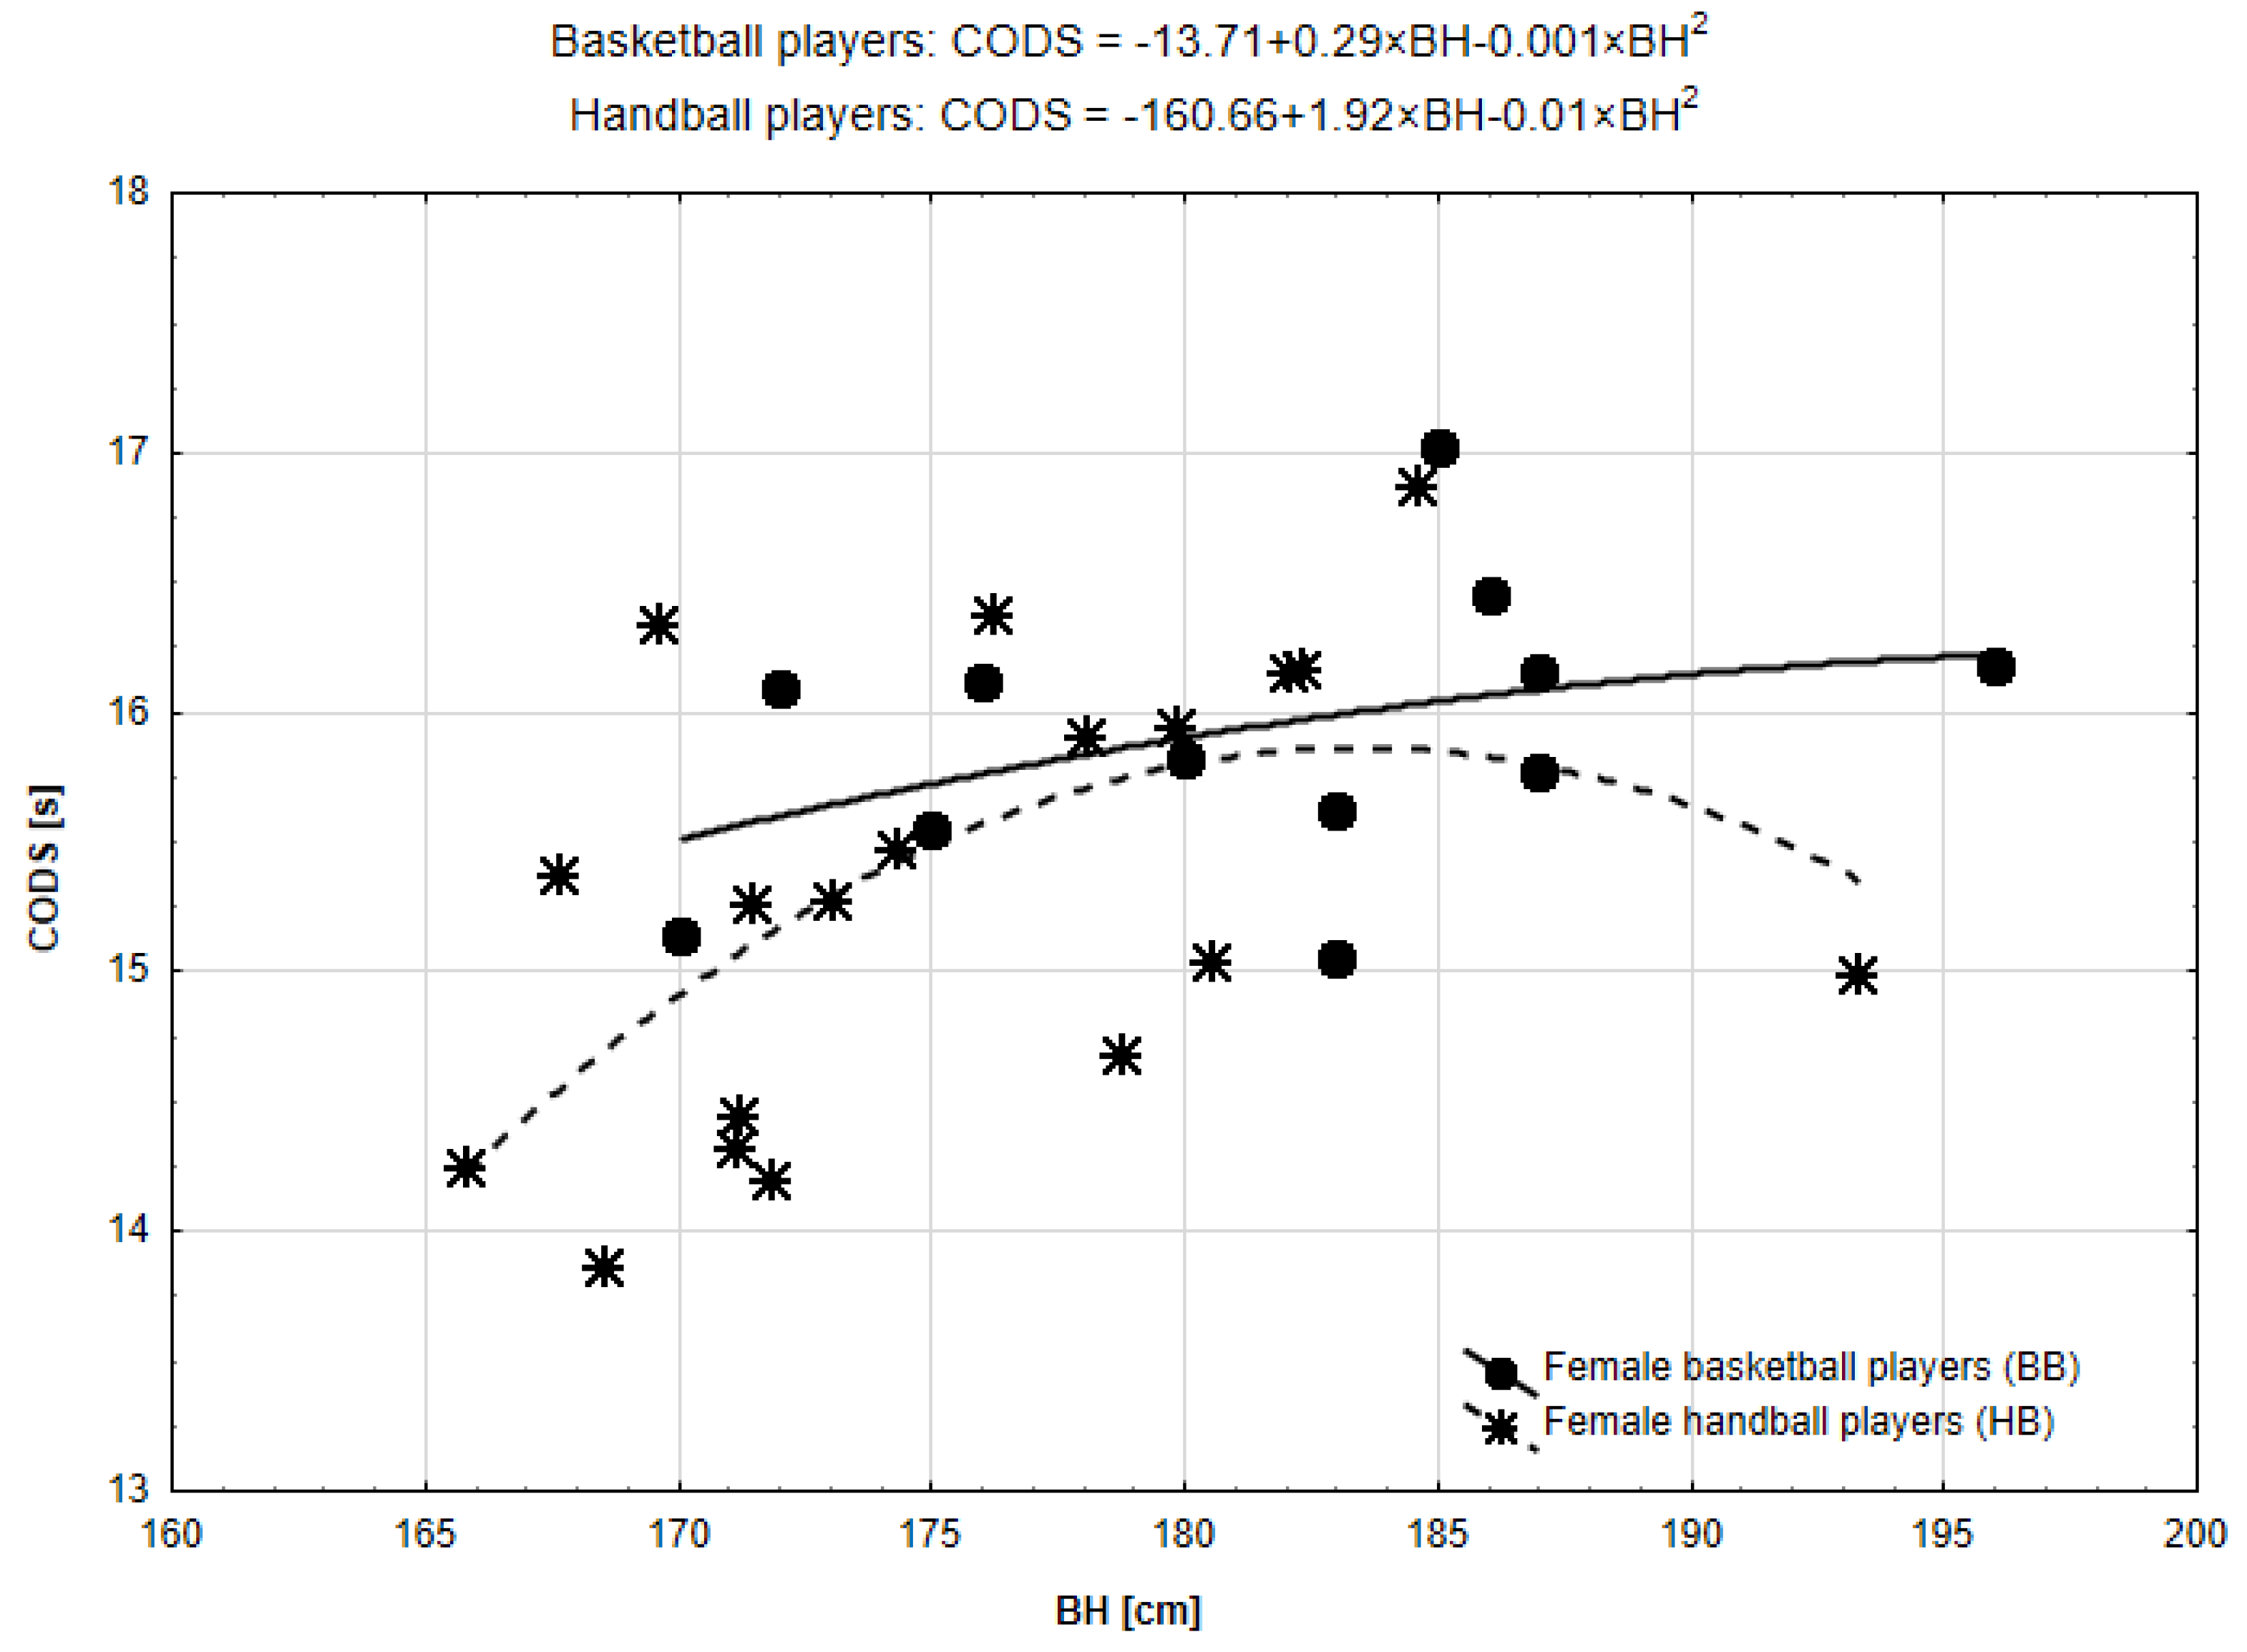
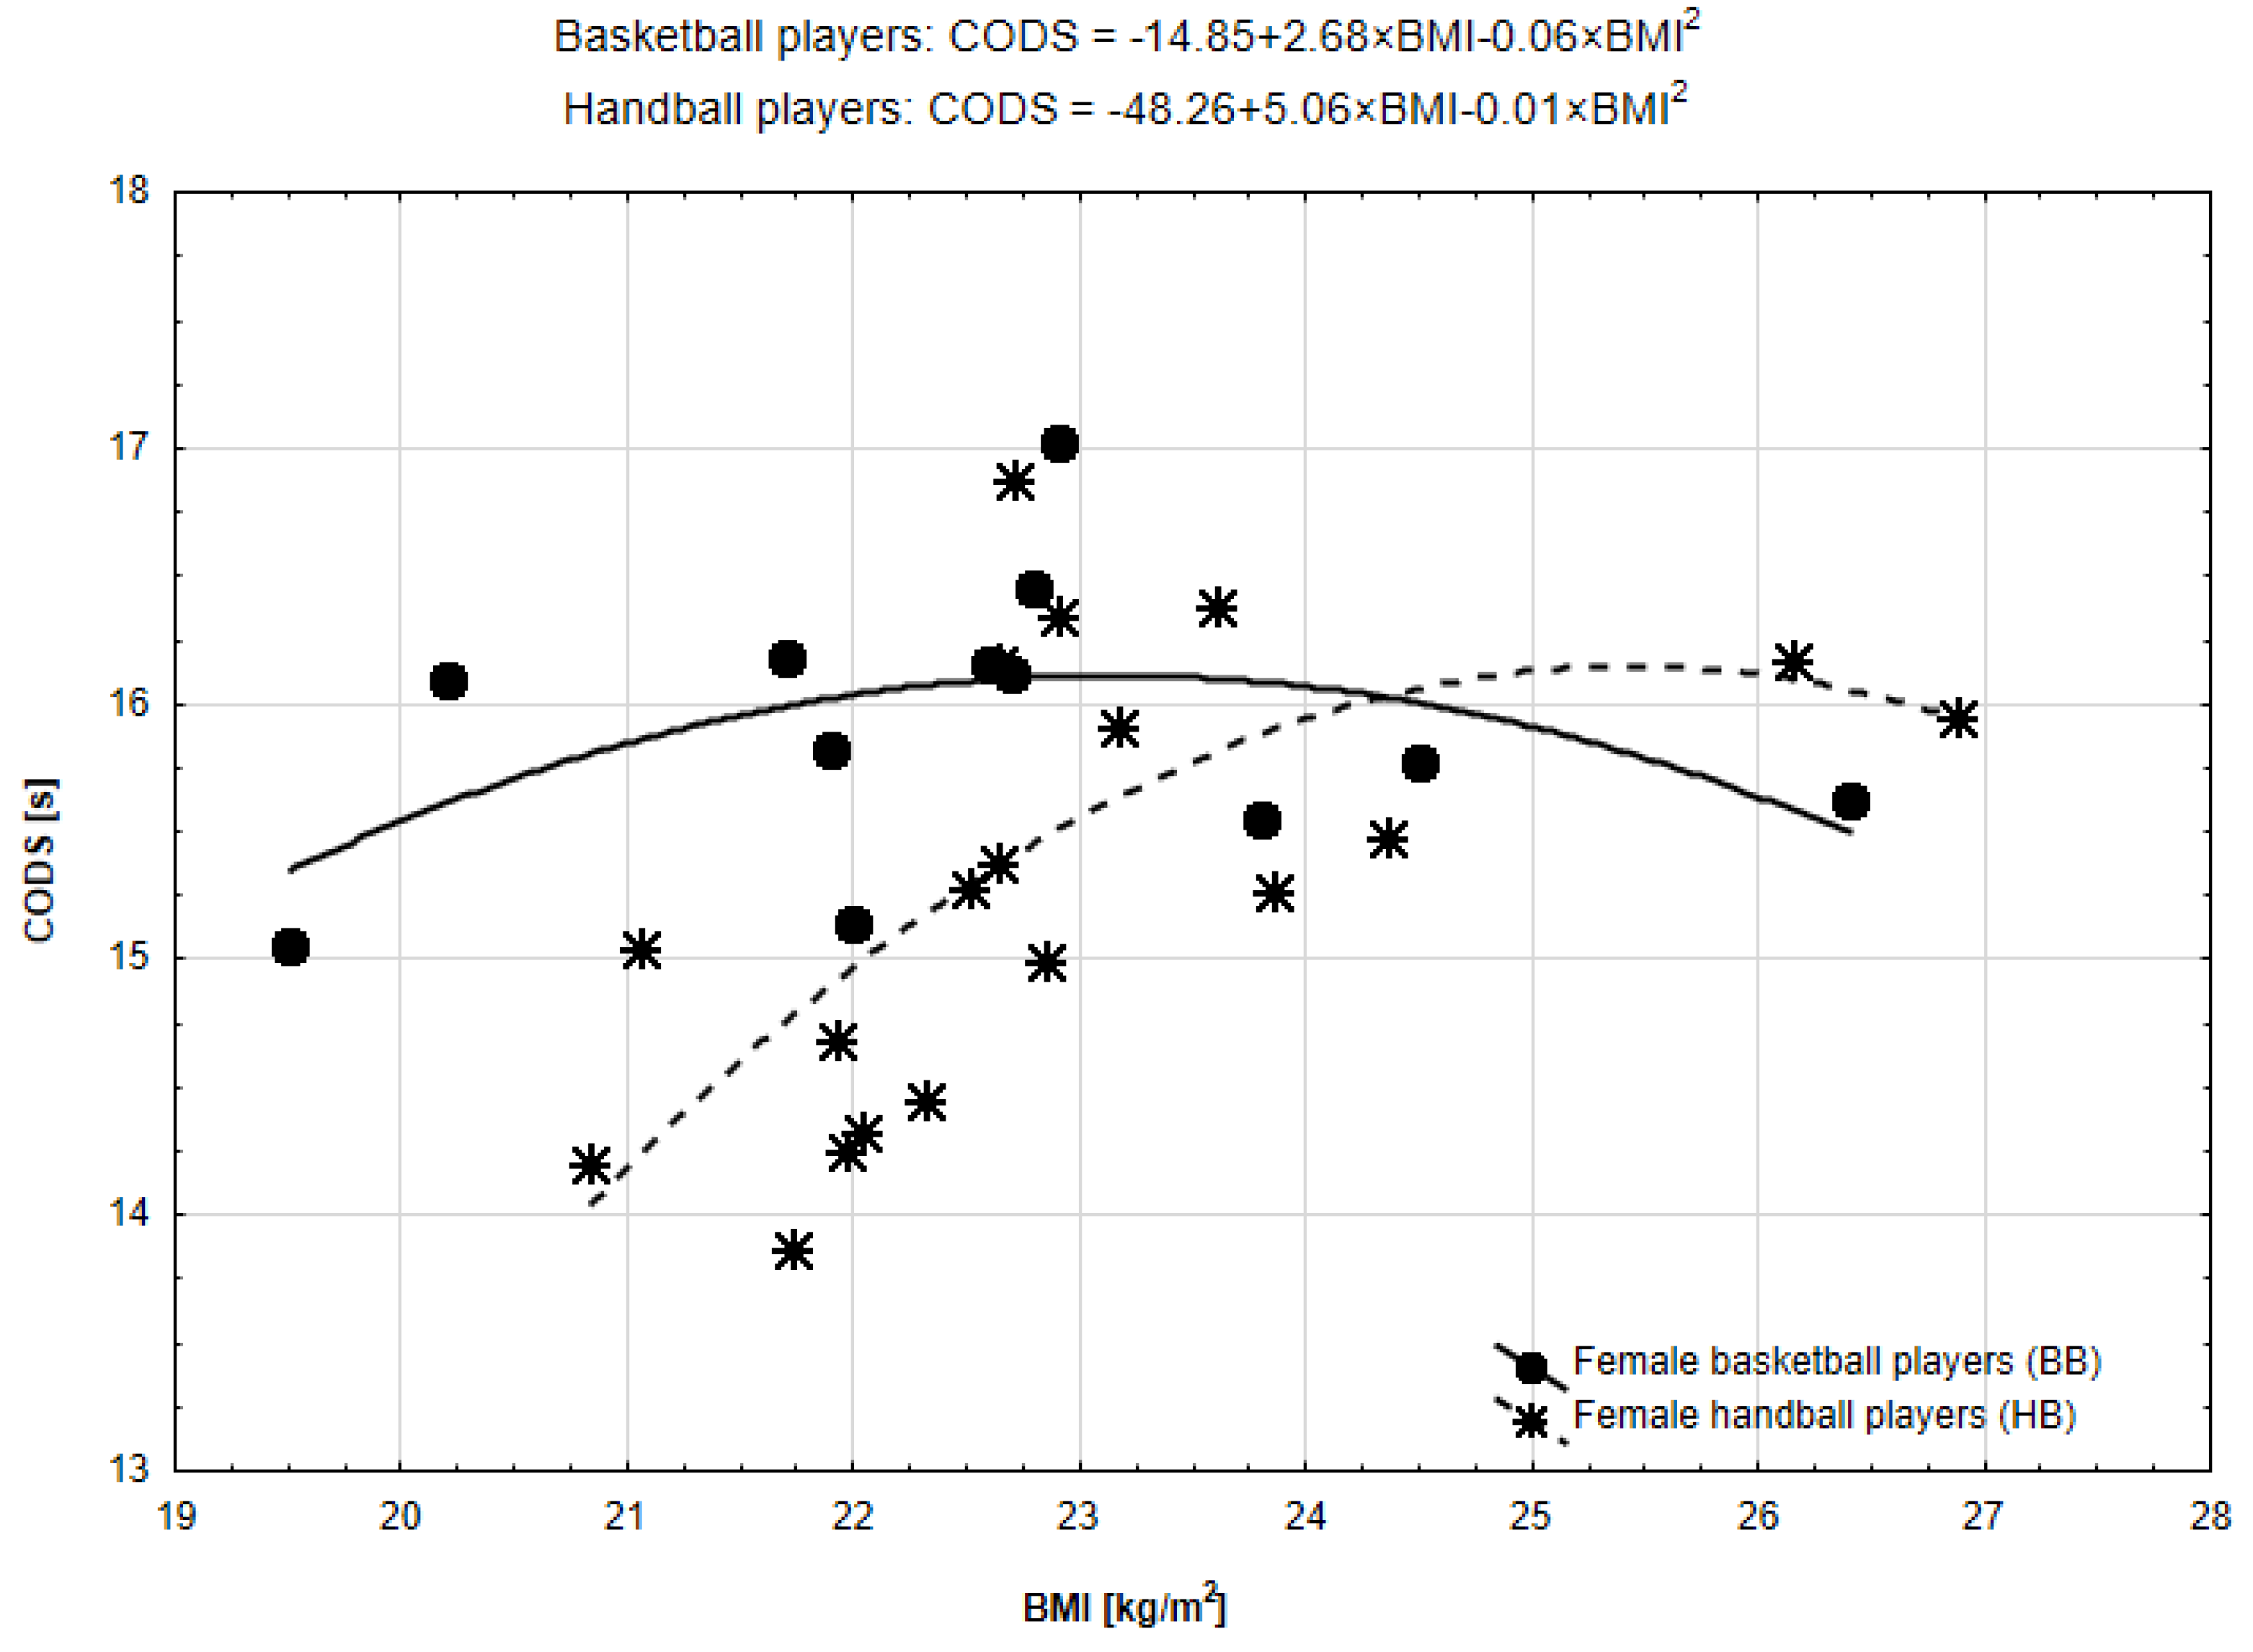
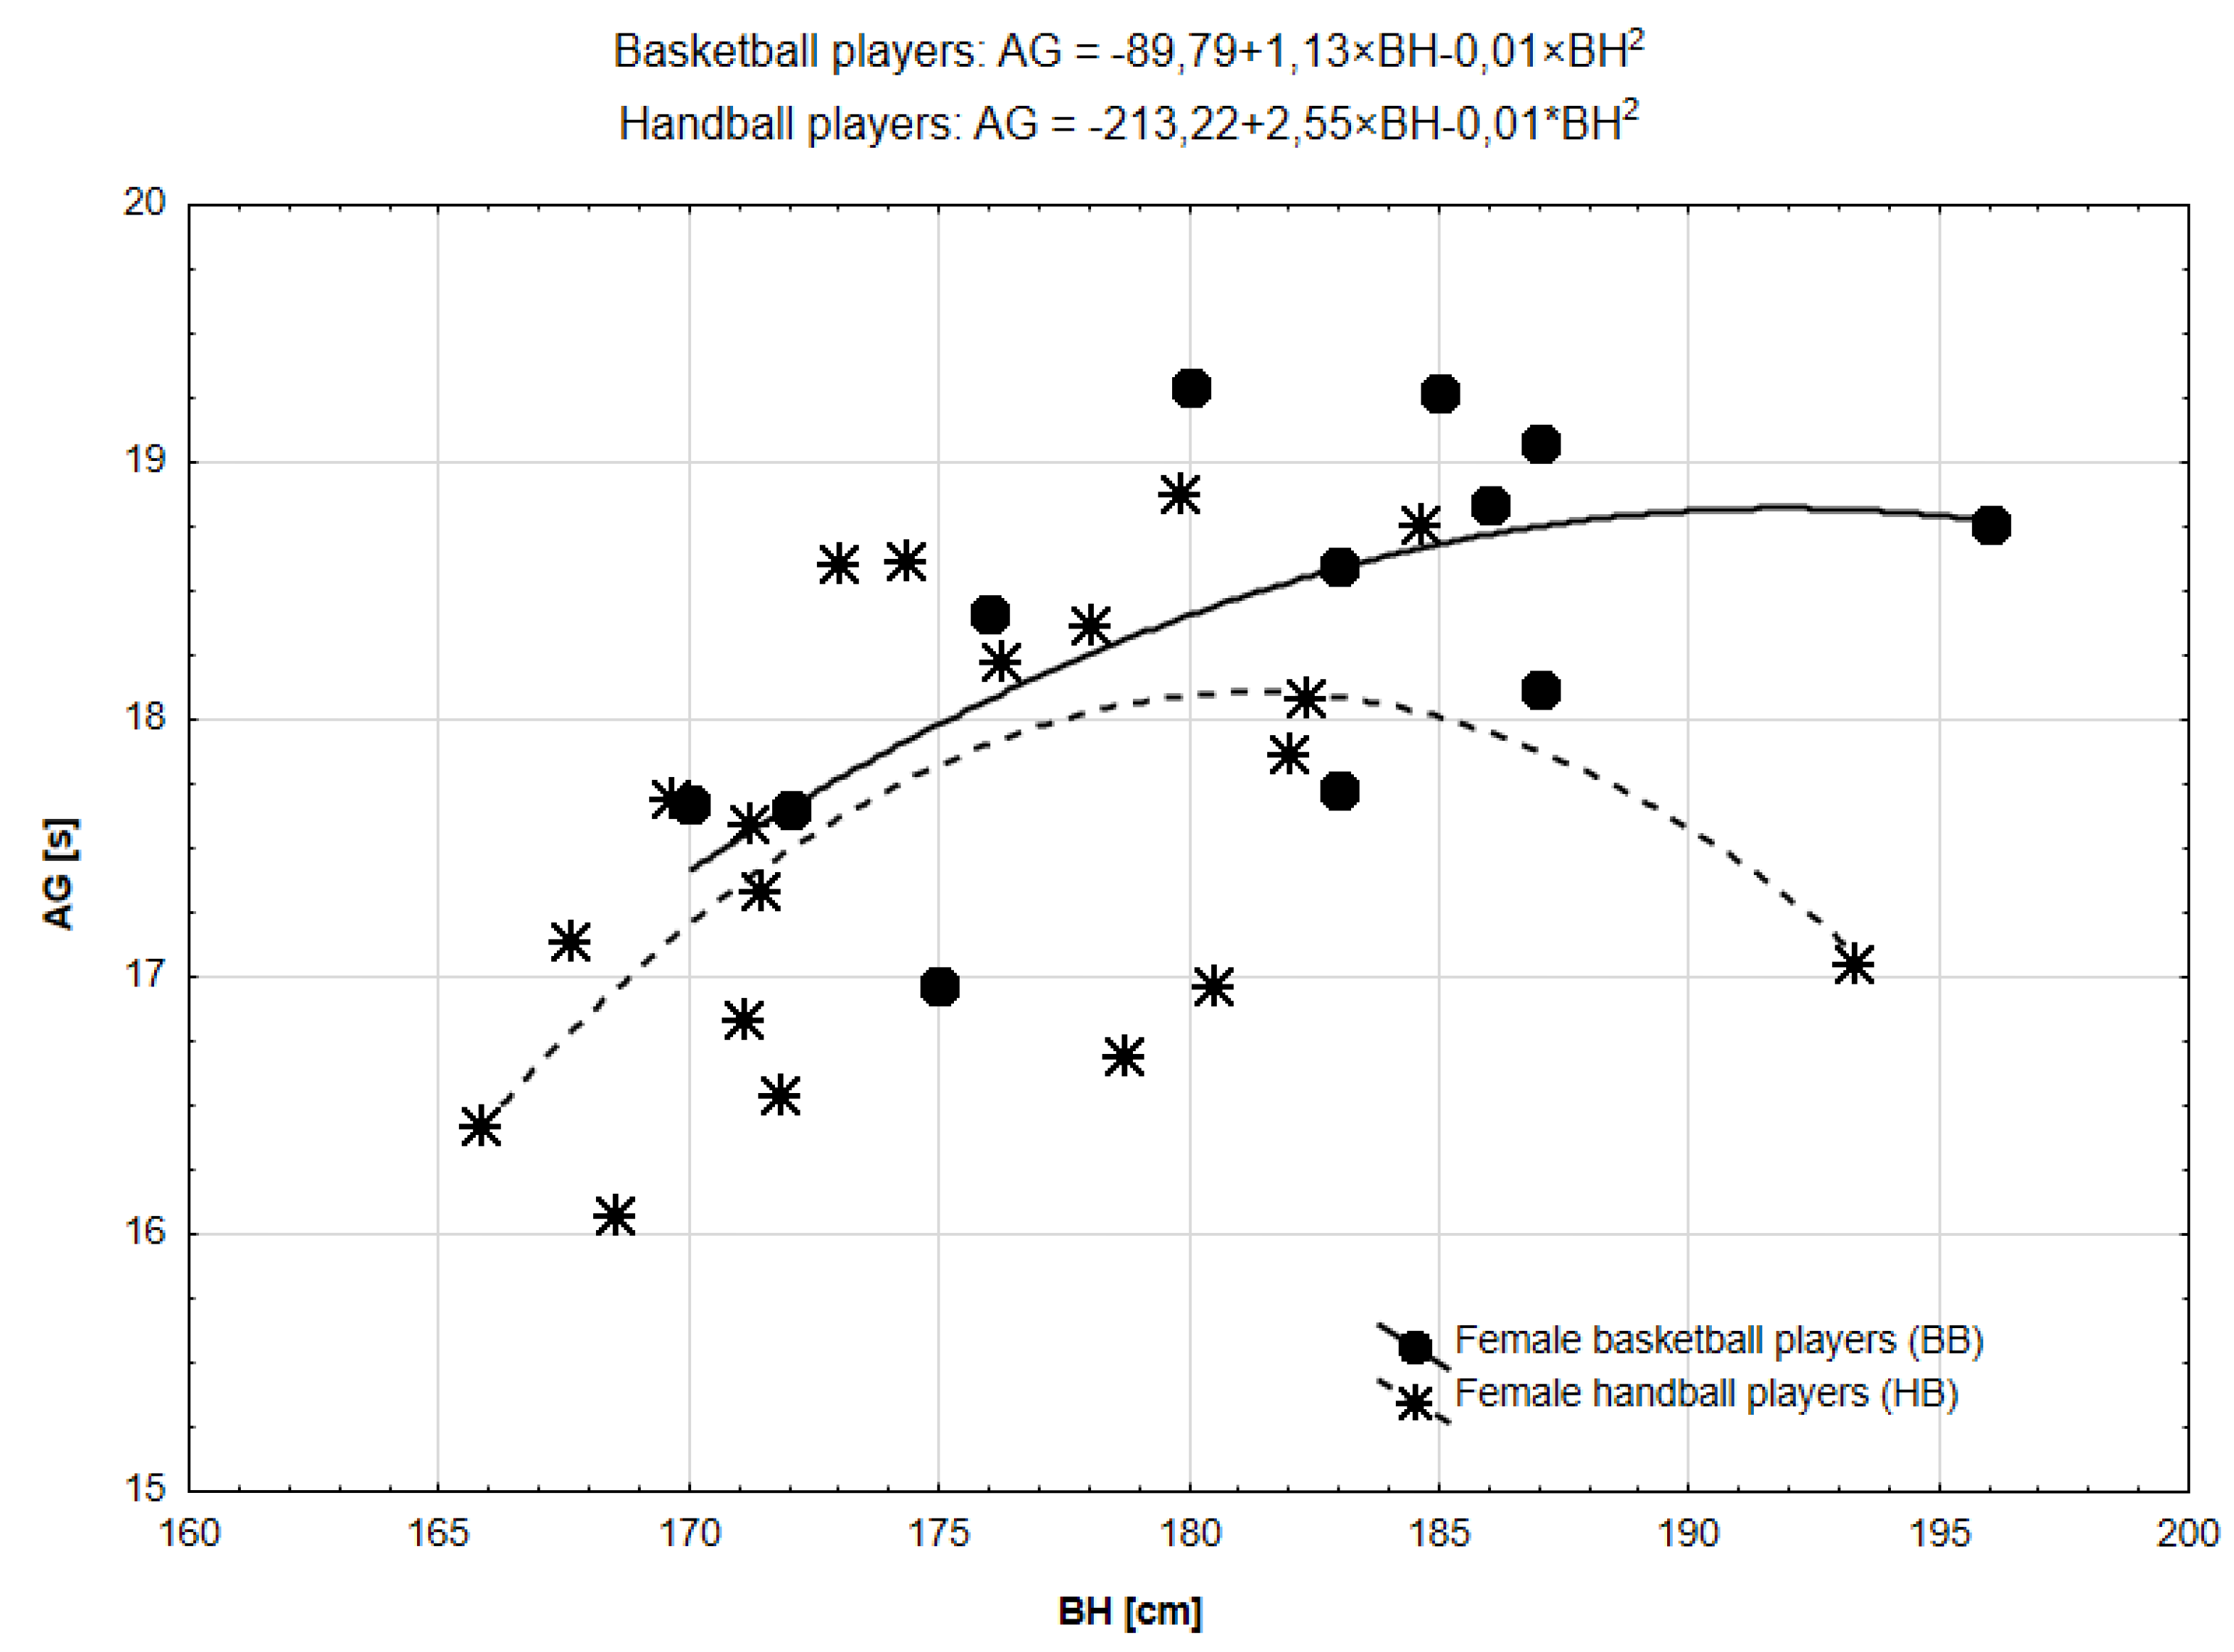
3. Results
4. Discussion
5. Conclusions
Author Contributions
Funding
Institutional Review Board Statement
Informed Consent Statement
Data Availability Statement
Acknowledgments
Conflicts of Interest
References
- Sheppard, J.M.; Young, W.B. Agility literature review: Classifications, training and testing. J. Sport. Sci. 2006, 24, 919–932. [Google Scholar] [CrossRef] [PubMed]
- McNeil, D.G.; Spittle, M.; Mesagno, C. Imagery training for reactive agility: Performance improvements for decision time but not overall reactive agility. Int. J. Sport Exerc. Psychol. 2021, 19, 429–445. [Google Scholar] [CrossRef]
- Young, W.; Dos’Santos, T.; Harper, D.; Jefferys, I.; Talpey, S. Agility in Invasion Sports: Position Stand of the IUSCA. Int. J. Strength Cond. 2022, 2, 1–25. [Google Scholar] [CrossRef]
- Popowczak, M.; Domaradzki, J.; Rokita, A.; Zwierko, M.; Zwierko, T. Predicting Visual-motor performance in a reactive agility task from selected demographic, training, anthropometric, and functional variables in adolescents. Int. J. Environ. Res. Public Health 2020, 17, 5322. [Google Scholar] [CrossRef] [PubMed]
- Zwierko, T.; Popowczak, M.; Wozniak, J.; Rokita, A. Visual control in basketball shooting under exertion conditions. J. Sport. Med. Phys. Fit. 2018, 58, 1544–1553. [Google Scholar] [CrossRef]
- Duncan, M.J.; Woodfield, L.; Al-Nakeeb, Y. Anthropometric and physiological characteristics of junior elite volleyball players. Br. J. Sport. Med. 2006, 40, 649–651. [Google Scholar] [CrossRef]
- Koltai, M.; Gusztafik, Á.; Nagyváradi, K.; Szeiler, B.; Halasi, S.; Lepeš, J. The connection between the agility of adolescent soccer players and their body composition. Facta Univ. Ser. Phys. Educ. Sport 2021, 18, 577–588. [Google Scholar] [CrossRef]
- Popowczak, M.; Cichy, I.; Rokita, A.; Domaradzki, J. The Relationship Between Reactive Agility and Change of Direction Speed in Professional Female Basketball and Handball Players. Front. Psychol. 2021, 12, 708771. [Google Scholar] [CrossRef]
- Horicka, P.; Simonek, J. Age-related changes of reactive agility in football. Phys. Act. Rev. 2021, 9, 16–23. [Google Scholar] [CrossRef]
- Young, W.B.; Dawson, B.; Henry, G.J. Agility and change-of-direction speed are independent skills: Implications for training for agility in invasion Sports. Int. J. Sport. Sci. Coach. 2015, 10, 159–169. [Google Scholar] [CrossRef]
- Alesi, M.; Bianco, A.; Luppina, G.; Palma, A.; Pepi, A. Improving children’s coordinative skills and executive functions: The effects of a football exercise program. Percept. Mot. Ski. 2016, 122, 27–46. [Google Scholar] [CrossRef] [PubMed]
- Chaouachi, A.; Brughelli, M.; Levin, G.; Boudhina, N.B.; Cronin, J.; Chamari, K. Anthropometric, physiological and performance characteristics of elite team-handball players. J. Sport. Sci. 2009, 27, 151–157. [Google Scholar] [CrossRef] [PubMed]
- Young, W.B.; Miller, I.R.; Talpey, S.W. Physical qualities predict change-of-direction speed but not defensive agility in Australian rules football. J. Strength Cond. Res. 2015, 29, 206–212. [Google Scholar] [CrossRef] [PubMed]
- Young, W.B.; James, R.; Montgomery, I. Is muscle power related to running speed with changes of direction? J. Sport. Med. Phys. Fit. 2002, 42, 282–288. [Google Scholar]
- Malina, R.M.; Bouchard, C.; Bar-Or, O. Growth, Maturation, and Physical Activity, 2nd ed.; Human Kinetics: Champaign, IL, USA, 2004. [Google Scholar]
- Jakovljević, S.; Karalejić, M.; Pajić, Z.; Mandić, R. Acceleration and speed of change of direction and the way of movement of quality basketball players. Phys. Cult. 2011, 65, 16–23. [Google Scholar] [CrossRef]
- Garcia-Gil, M.; Torres-Unda, J.; Esain, I.; Duñabeitia, I.; Gil, S.M.; Gil, J.; Irazusta, J. Anthropometric parameters, age, and agility as performance predictors in elite female basketball players. J. Strength Cond. Res. 2018, 32, 1723–1730. [Google Scholar] [CrossRef]
- Mathisen, G.; Pettersen, S.A. Anthropometric factors related to sprint and agility performance in young male soccer players. Open Access J. Sport. Med. 2015, 6, 337–342. [Google Scholar] [CrossRef]
- Sekulic, D.; Spasic, M.; Mirkov, D.; Cavar, M.; Sattler, T. Gender-specific influences of balance, speed, and power on agility performance. J. Strength Cond. Res. 2013, 27, 802–811. [Google Scholar] [CrossRef]
- Jakovljevic, S.T.; Karalejic, M.S.; Pajic, Z.B.; Macura, M.M.; Erculj, F.F. Speed and agility of 12- and 14-year-old elite male basketball players. J. Strength Cond. Res. 2012, 26, 2453–2459. [Google Scholar] [CrossRef]
- Mann, J.B.; Ivey, P.A.; Mayhew, J.L.; Schumacher, R.M.; Brechue, W.F. Relationship between agility tests and short sprints. J. Strength Cond. Res. 2016, 30, 893–900. [Google Scholar] [CrossRef]
- Ziv, G.A.L.; Lidor, R. Physical characteristics, physiological attributes, and on-court performances of handball players: A review. Eur. J. Sport Sci. 2009, 9, 375–386. [Google Scholar] [CrossRef]
- McDonald, J.H. Handbook of Biological Statistics; Sparky House: Baltimore, MD, USA, 2014. [Google Scholar]
- Livshits, G.; Cohen, Z.; Otremski, I. Relationship between physical growth and motor development in infancy and early childhood: Multivariate analysis. Am. J. Hum. Biol. 1993, 5, 481–489. [Google Scholar] [CrossRef]
- Lampl, M.; Thompson, A.L. Growth chart curves do not describe individual growth biology. Am. J. Hum. Biol. 2007, 19, 643–653. [Google Scholar] [CrossRef]
- Adolph, K.E.; Hoch, J.E. Motor Development: Embodied, Embedded, Enculturated, and Enabling. Annu. Rev. Psychol. 2019, 70, 141–164. [Google Scholar] [CrossRef] [PubMed]
- Inglis, P.; Bird, S. Reactive agility tests: Review and practical applications. J. Aust. Strength Cond. 2016, 24, 62–69. [Google Scholar]
- Sugiyama, T.; Maeo, S.; Kurihara, T.; Kanehisa, H.; Isaka, T. Change of direction speed tests in basketball players: A brief review of test varieties and recent trends. Front. Sport. Act. Living 2021, 3, 645350. [Google Scholar] [CrossRef] [PubMed]
- Morral-Yepes, M.; Moras, G.; Bishop, C.; Gonzalo-Skok, O. Assessing the reliability and validity of agility testing in team sports: A systematic review. J. Strength Cond. Res. 2020, 36, 2035–2049. [Google Scholar] [CrossRef]
- Kucsa, R.; Mačura, P. Physical characteristics of female basketball players according to playing position. Acta Fac. Educ. Phys. Univ. Comen. 2015, 55, 46–53. [Google Scholar] [CrossRef]
- Harriss, D.J.; Atkinson, G. Ethical standards in sport and exercise science research: 2016 update. Int. J. Sport. Med. 2015, 36, 1121–1124. [Google Scholar] [CrossRef]
- Popowczak, M.; Rokita, A.; Struzik, A.; Cichy, I.; Dudkowski, A.; Chmura, P. Multi-directional sprinting and acceleration phase in basketball and handball players aged 14 and 15 years. Percept. Mot. Ski. 2016, 123, 543–563. [Google Scholar] [CrossRef]
- Domaradzki, J.; Popowczak, M.; Zwierko, T. The mediating effect of change of direction speed in the relationship between the type of sport and reactive agility in elite female team-sport athletes. J. Sport. Sci. Med. 2021, 20, 699–705. [Google Scholar] [CrossRef] [PubMed]
- Zouhal, H.; Abderrahman, A.B.; Dupont, G.; Truptin, P.; le Bris, R.; le Postec, E.; Sghaeir, Z.; Brughelli, M.; Granacher, U.; Bideau, B. Effects of neuromuscular training on agility performance in elite soccer players. Front. Physiol. 2019, 10, 947. [Google Scholar] [CrossRef] [PubMed]
- Šimonek, J.; Horička, P.; Hianik, J. The differences in acceleration, maximal speed and agility between soccer, basketball, volleyball and handball players. J. Hum. Sport Exerc. 2017, 12, 73–82. [Google Scholar] [CrossRef]
- Hammami, M.; Negra, Y.; Billaut, F.; Hermassi, S.; Shephard, R.J.; Chelly, M.S. Effects of lower-limb strength training on agility, repeated sprinting with changes of direction, leg peak power, and neuromuscular adaptations of soccer players. J. Strength Cond. Res. 2018, 32, 37–47. [Google Scholar] [CrossRef]
- Bouteraa, I.; Negra, Y.; Shephard, R.J.; Chelly, M.S. Effects of combined balance and plyometric training on athletic performance in female basketball players. J. Strength Cond. Res. 2020, 34, 1967–1973. [Google Scholar] [CrossRef]
- Bayios, I.A.; Bergeles, N.K.; Apostolidis, N.G.; Noutsos, K.S.; Koskolou, M.D. Anthropometric, body composition and somatotype differences of Greek elite female basketball, volleyball and handball players. J. Sport. Med. Phys. Fit. 2006, 46, 271–280. [Google Scholar]
- Nuttall, F.Q. Body mass index: Obesity, BMI, and health: A critical review. Nutr. Today 2015, 50, 117–128. [Google Scholar] [CrossRef]
- Sattler, T.; Sekulic, D.; Spasic, M.; Peric, M.; Krolo, A.; Uljevic, O.; Kondric, M. Analysis of the association between motor and anthropometric variables with change of direction speed and reactive agility performance. J. Hum. Kinet. 2015, 47, 137–145. [Google Scholar] [CrossRef]
- Chaouachi, A.; Brughelli, M.; Chamari, K.; Levin, G.T.; Abdelkrim, N.B.; Laurencelle, L.; Castagna, C. Lower limb maximal dynamic strength and agility determinants in elite basketball players. J. Strength Cond. Res. 2009, 23, 1570–1577. [Google Scholar] [CrossRef]
- Chaouachi, A.; Manzi, V.; Chaalali, A.; Wong, D.P.; Chamari, K.; Castagna, C. Determinants analysis of change-of-direction ability in elite soccer players. J. Strength Cond. Res. 2012, 26, 2667–2676. [Google Scholar] [CrossRef]
- Skurvydas, A.; Gutnik, B.; Zuoza, A.K.; Nash, D.; Zuoziene, I.J.; Mickeviciene, D. Relationship between simple reaction time and body mass index. HOMO 2009, 60, 77–85. [Google Scholar] [CrossRef] [PubMed]
- Deore, D.N.; Surwase, S.P.; Masroor, S.; Khan, S.T.; Kathore, V. A cross sectional study on the relationship between the body mass index (BMI) and the audiovisual reaction time (ART). J. Clin. Diagn. Res. 2012, 6, 1466–1468. [Google Scholar] [CrossRef] [PubMed]
- Turner, A.; Comfort, P. Advanced Strength and Conditioning: An Evidence-Based Approach; Routledge: Oxfordshire, UK, 2022. [Google Scholar]
- Gryko, K.; Kopiczko, A.; Mikołajec, K.; Stasny, P.; Musalek, M. Anthropometric variables and somatotype of young and professional male basketball players. Sports 2018, 6, 9. [Google Scholar] [CrossRef] [PubMed]
- Bogild, P.; Jensen, K.; Kvorning, T. Physiological performance characteristics of Danish national team handball players 1990–2016: Implications on position-specific strength and conditioning training. J. Strength Cond. Res. 2020, 34, 1555–1563. [Google Scholar] [CrossRef] [PubMed]
- Milanese, C.; Piscitelli, F.; Lampis, C.; Zancanaro, C. Anthropometry and body composition of female handball players according to competitive level or the playing position. J. Sport. Sci. 2011, 29, 1301–1309. [Google Scholar] [CrossRef]


| Variables | Elite Female Basketball Players | Elite Female Handball Players | t | p | ||||||
|---|---|---|---|---|---|---|---|---|---|---|
| Mean | −95CI | +95CI | SD | Mean | −95CI | +95CI | SD | |||
| BH | 181.67 | 176.96 | 186.38 | 7.41 | 175.77 | 172.44 | 179.11 | 6.93 | 2.25 | 0.033 * |
| BMI | 22.58 | 21.42 | 23.74 | 1.83 | 22.96 | 22.22 | 23.69 | 1.53 | −0.61 | 0.544 |
| CODS | 15.92 | 15.57 | 16.26 | 0.55 | 15.31 | 14.89 | 15.73 | 0.87 | 2.14 | 0.041 * |
| AG | 18.37 | 17.90 | 18.84 | 0.74 | 17.57 | 17.15 | 17.99 | 0.87 | 2.63 | 0.014 * |
| IV | Athletes | Statistic Parameters | DV | |||
|---|---|---|---|---|---|---|
| BH | BMI | |||||
| Function | Function | |||||
| F1 | F2 | F1 | F2 | |||
| CODS | BB | x | 0.02 | 0.29 | 0.03 | 2.67 |
| x2 | −0.001 | −0.06 | ||||
| Constant | 10.67 | 13.71 | 15.20 | −14.84 | ||
| R2 | 0.15 | 0.15 | 0.01 | 0.24 | ||
| p | 0.209 | 0.456 | 0.742 | 0.286 | ||
| HB | x | 0.05 | 1.92 | 0.31 | 5.06 | |
| x2 | −0.01 | −0.01 | ||||
| Constant | 5.67 | −160.66 | 8.04 | −48.26 | ||
| R2 | 0.19 | 0.32 | 0.31 | 0.42 | ||
| p | 0.061 | 0.045 * | 0.010 * | 0.012 * | ||
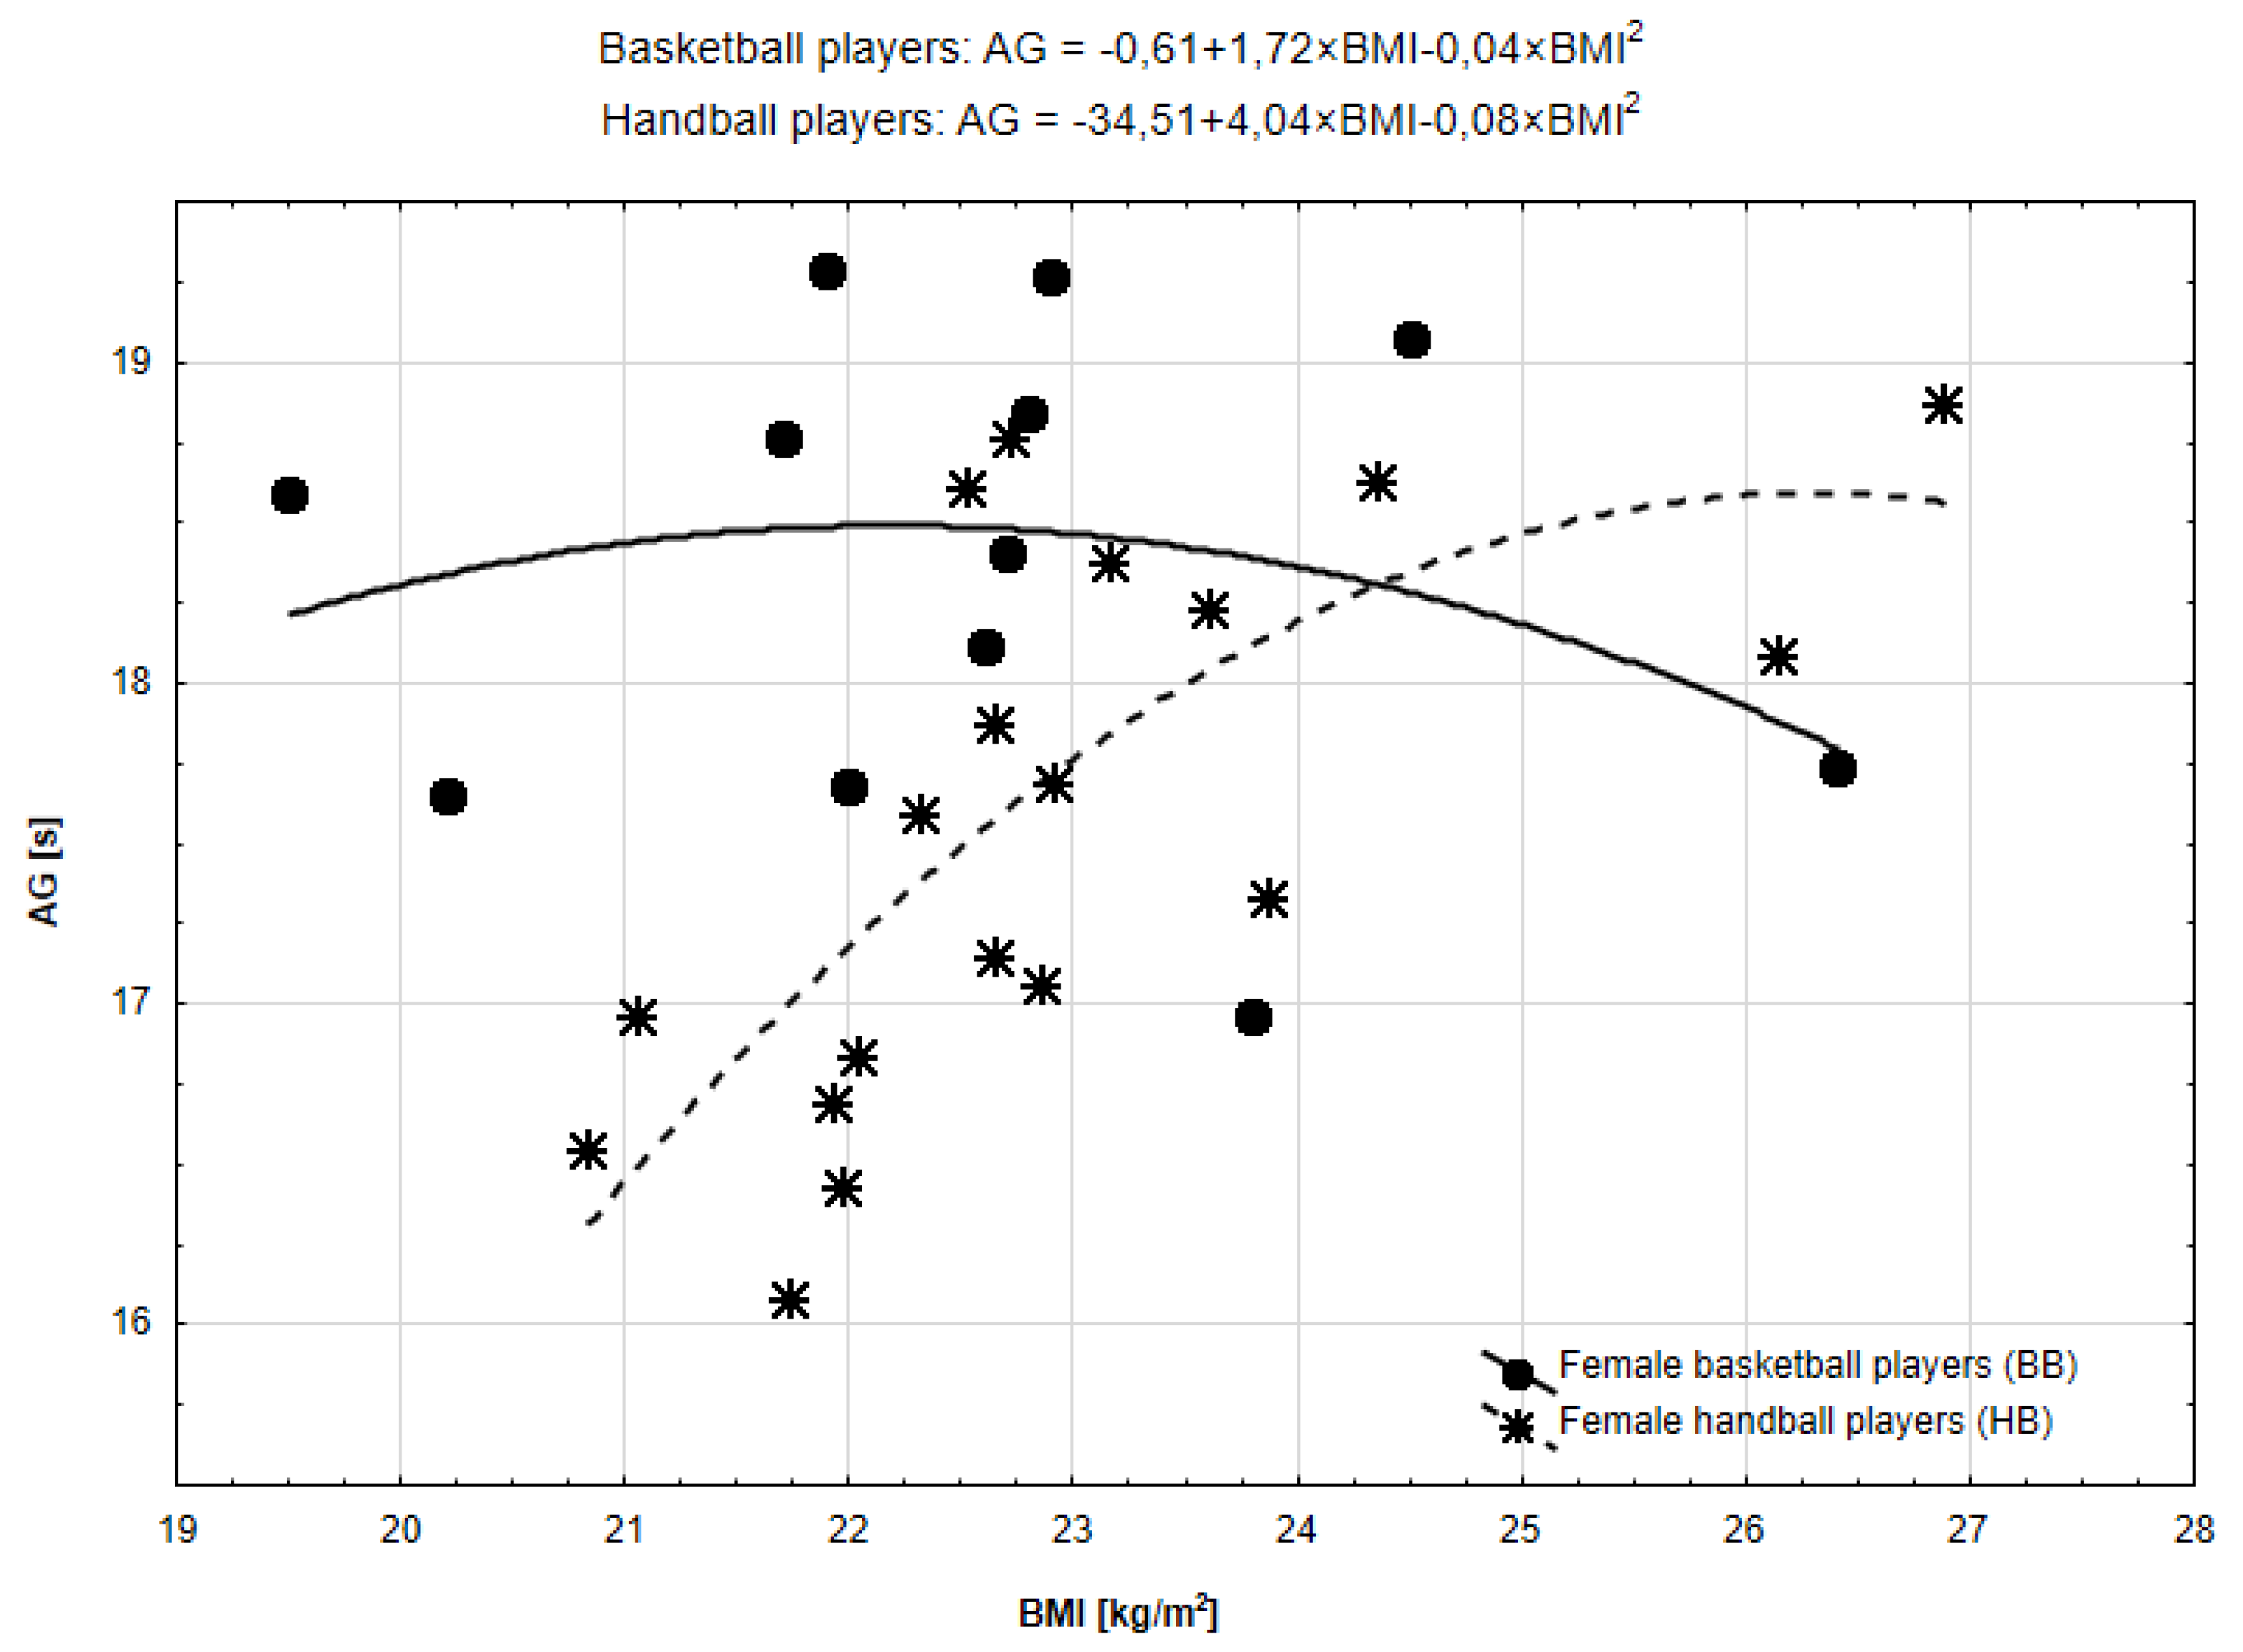
| AG | BB | x | 0.05 | 1.13 | −0.05 | 1.72 |
| x2 | −0.003 | −0.04 | ||||
| Constant | 7.77 | −89.78 | 19.56 | −0.61 | ||
| R2 | 0.34 | 0.40 | 0.02 | 0.07 | ||
| p | 0.046 * | 0.097 | 0.685 | 0.707 | ||
| HB | x | 0.04 | 2.55 | 0.37 | 4.04 | |
| x2 | −0.007 | −0.08 | ||||
| Constant | 9.91 | −213.21 | 8.96 | −34.51 | ||
| R2 | 0.12 | 0.35 | 0.43 | 0.51 | ||
| p | 0.140 | 0.029 * | 0.002* | 0.003 * | ||
Publisher’s Note: MDPI stays neutral with regard to jurisdictional claims in published maps and institutional affiliations. |
© 2022 by the authors. Licensee MDPI, Basel, Switzerland. This article is an open access article distributed under the terms and conditions of the Creative Commons Attribution (CC BY) license (https://creativecommons.org/licenses/by/4.0/).
Share and Cite
Popowczak, M.; Horička, P.; Šimonek, J.; Domaradzki, J. The Functional Form of the Relationship between Body Height, Body Mass Index and Change of Direction Speed, Agility in Elite Female Basketball and Handball Players. Int. J. Environ. Res. Public Health 2022, 19, 15038. https://doi.org/10.3390/ijerph192215038
Popowczak M, Horička P, Šimonek J, Domaradzki J. The Functional Form of the Relationship between Body Height, Body Mass Index and Change of Direction Speed, Agility in Elite Female Basketball and Handball Players. International Journal of Environmental Research and Public Health. 2022; 19(22):15038. https://doi.org/10.3390/ijerph192215038
Chicago/Turabian StylePopowczak, Marek, Pavol Horička, Jaromir Šimonek, and Jarosław Domaradzki. 2022. "The Functional Form of the Relationship between Body Height, Body Mass Index and Change of Direction Speed, Agility in Elite Female Basketball and Handball Players" International Journal of Environmental Research and Public Health 19, no. 22: 15038. https://doi.org/10.3390/ijerph192215038
APA StylePopowczak, M., Horička, P., Šimonek, J., & Domaradzki, J. (2022). The Functional Form of the Relationship between Body Height, Body Mass Index and Change of Direction Speed, Agility in Elite Female Basketball and Handball Players. International Journal of Environmental Research and Public Health, 19(22), 15038. https://doi.org/10.3390/ijerph192215038