
Co-Benefits of Energy Structure Transformation and Pollution Control for Air Quality and Public Health until 2050 in Guangdong, China
Abstract
1. Introduction
2. Literature Review
3. Materials and Methods
3.1. Scenario Design
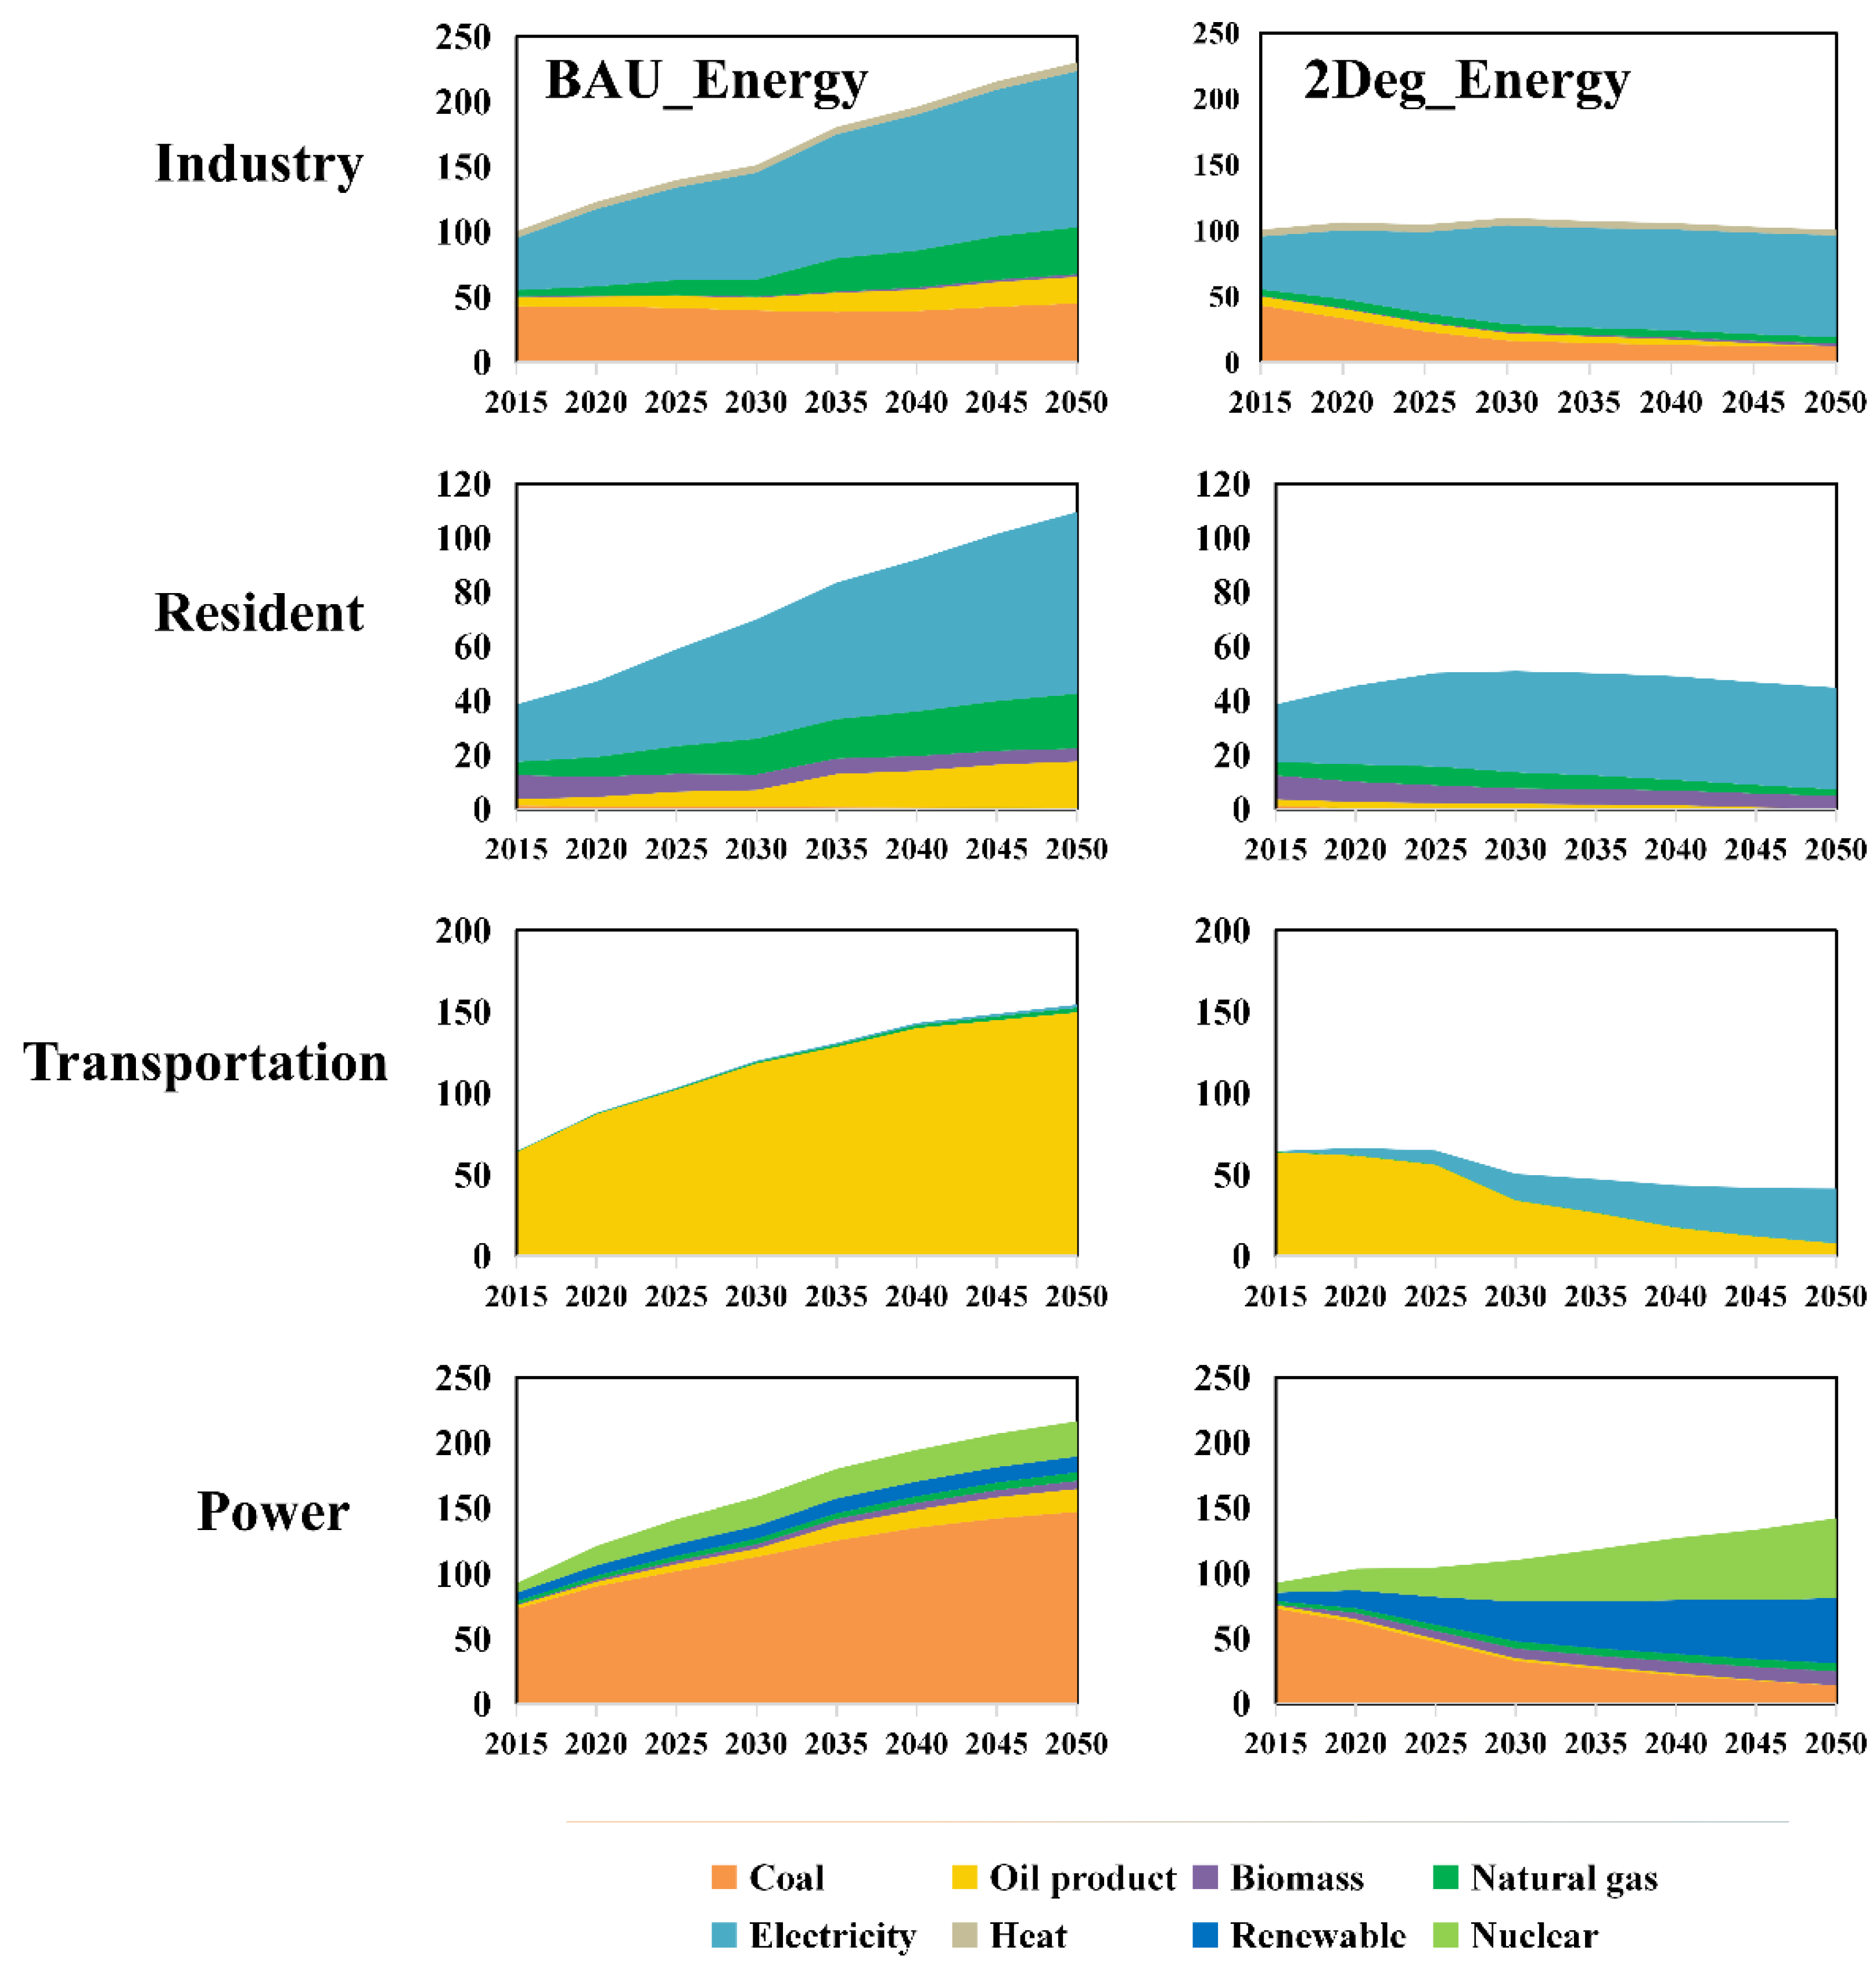
- The industrial sector of Guangdong would be dominated by advanced manufacturing industries, leading to a continuous increase in electricity consumption. Meanwhile, Guangdong would undergo an economic structural transformation, and the service industry would take up a large proportion of the total economic volume, so the increase in industrial energy consumption would be limited, and the adjustment of energy structure would be the most important feature for the industrial sector.
- The transportation sector of Guangdong would widely adopt electricity in the future. Small electric vehicles would be the major transport tools for travel, whereas large trucks and ships would be gradually electrified. In addition, the volume of air transportation in Guangdong would grow further, leading to an increase in aviation kerosene use in the short term. The electric aircraft would start to become popular after 2030, and the total fuel use in the transportation sector would change smoothly until 2025, after which it would start to decline rapidly.
- For the residential sector in Guangdong, due to population growth and continuous urban expansion, as well as the rapid development of the service industry, the future energy consumption of buildings in Guangdong would continue to grow and be dominated by electricity. However, along with the continuous improvement of building energy use efficiencies, such as the development of advanced lighting, air conditioning and heating technologies, the future trend of energy use in the residential sector would remain flat.
- The power sector of Guangdong would widely adopt clean energy for electricity generation. With the completion of large-scale centralized wind power and nuclear power plants in the coastal areas of western and eastern Guangdong, the province’s electricity generation will rise to 705 billion kWh in 2050, an increase of 67% compared to 2015, whereas the share of electricity generation from traditional fossil fuels will be less than 5%, which is almost clean. However, due to population growth and urban expansion, the province’s electricity demand would reach 1 trillion kWh in 2050, and the additional demand will be met by green power imported from regions outside the province.
3.2. Air Quality Simulation
3.3. Health Benefits Assessment
4. Results
4.1. Energy Structure Comparison
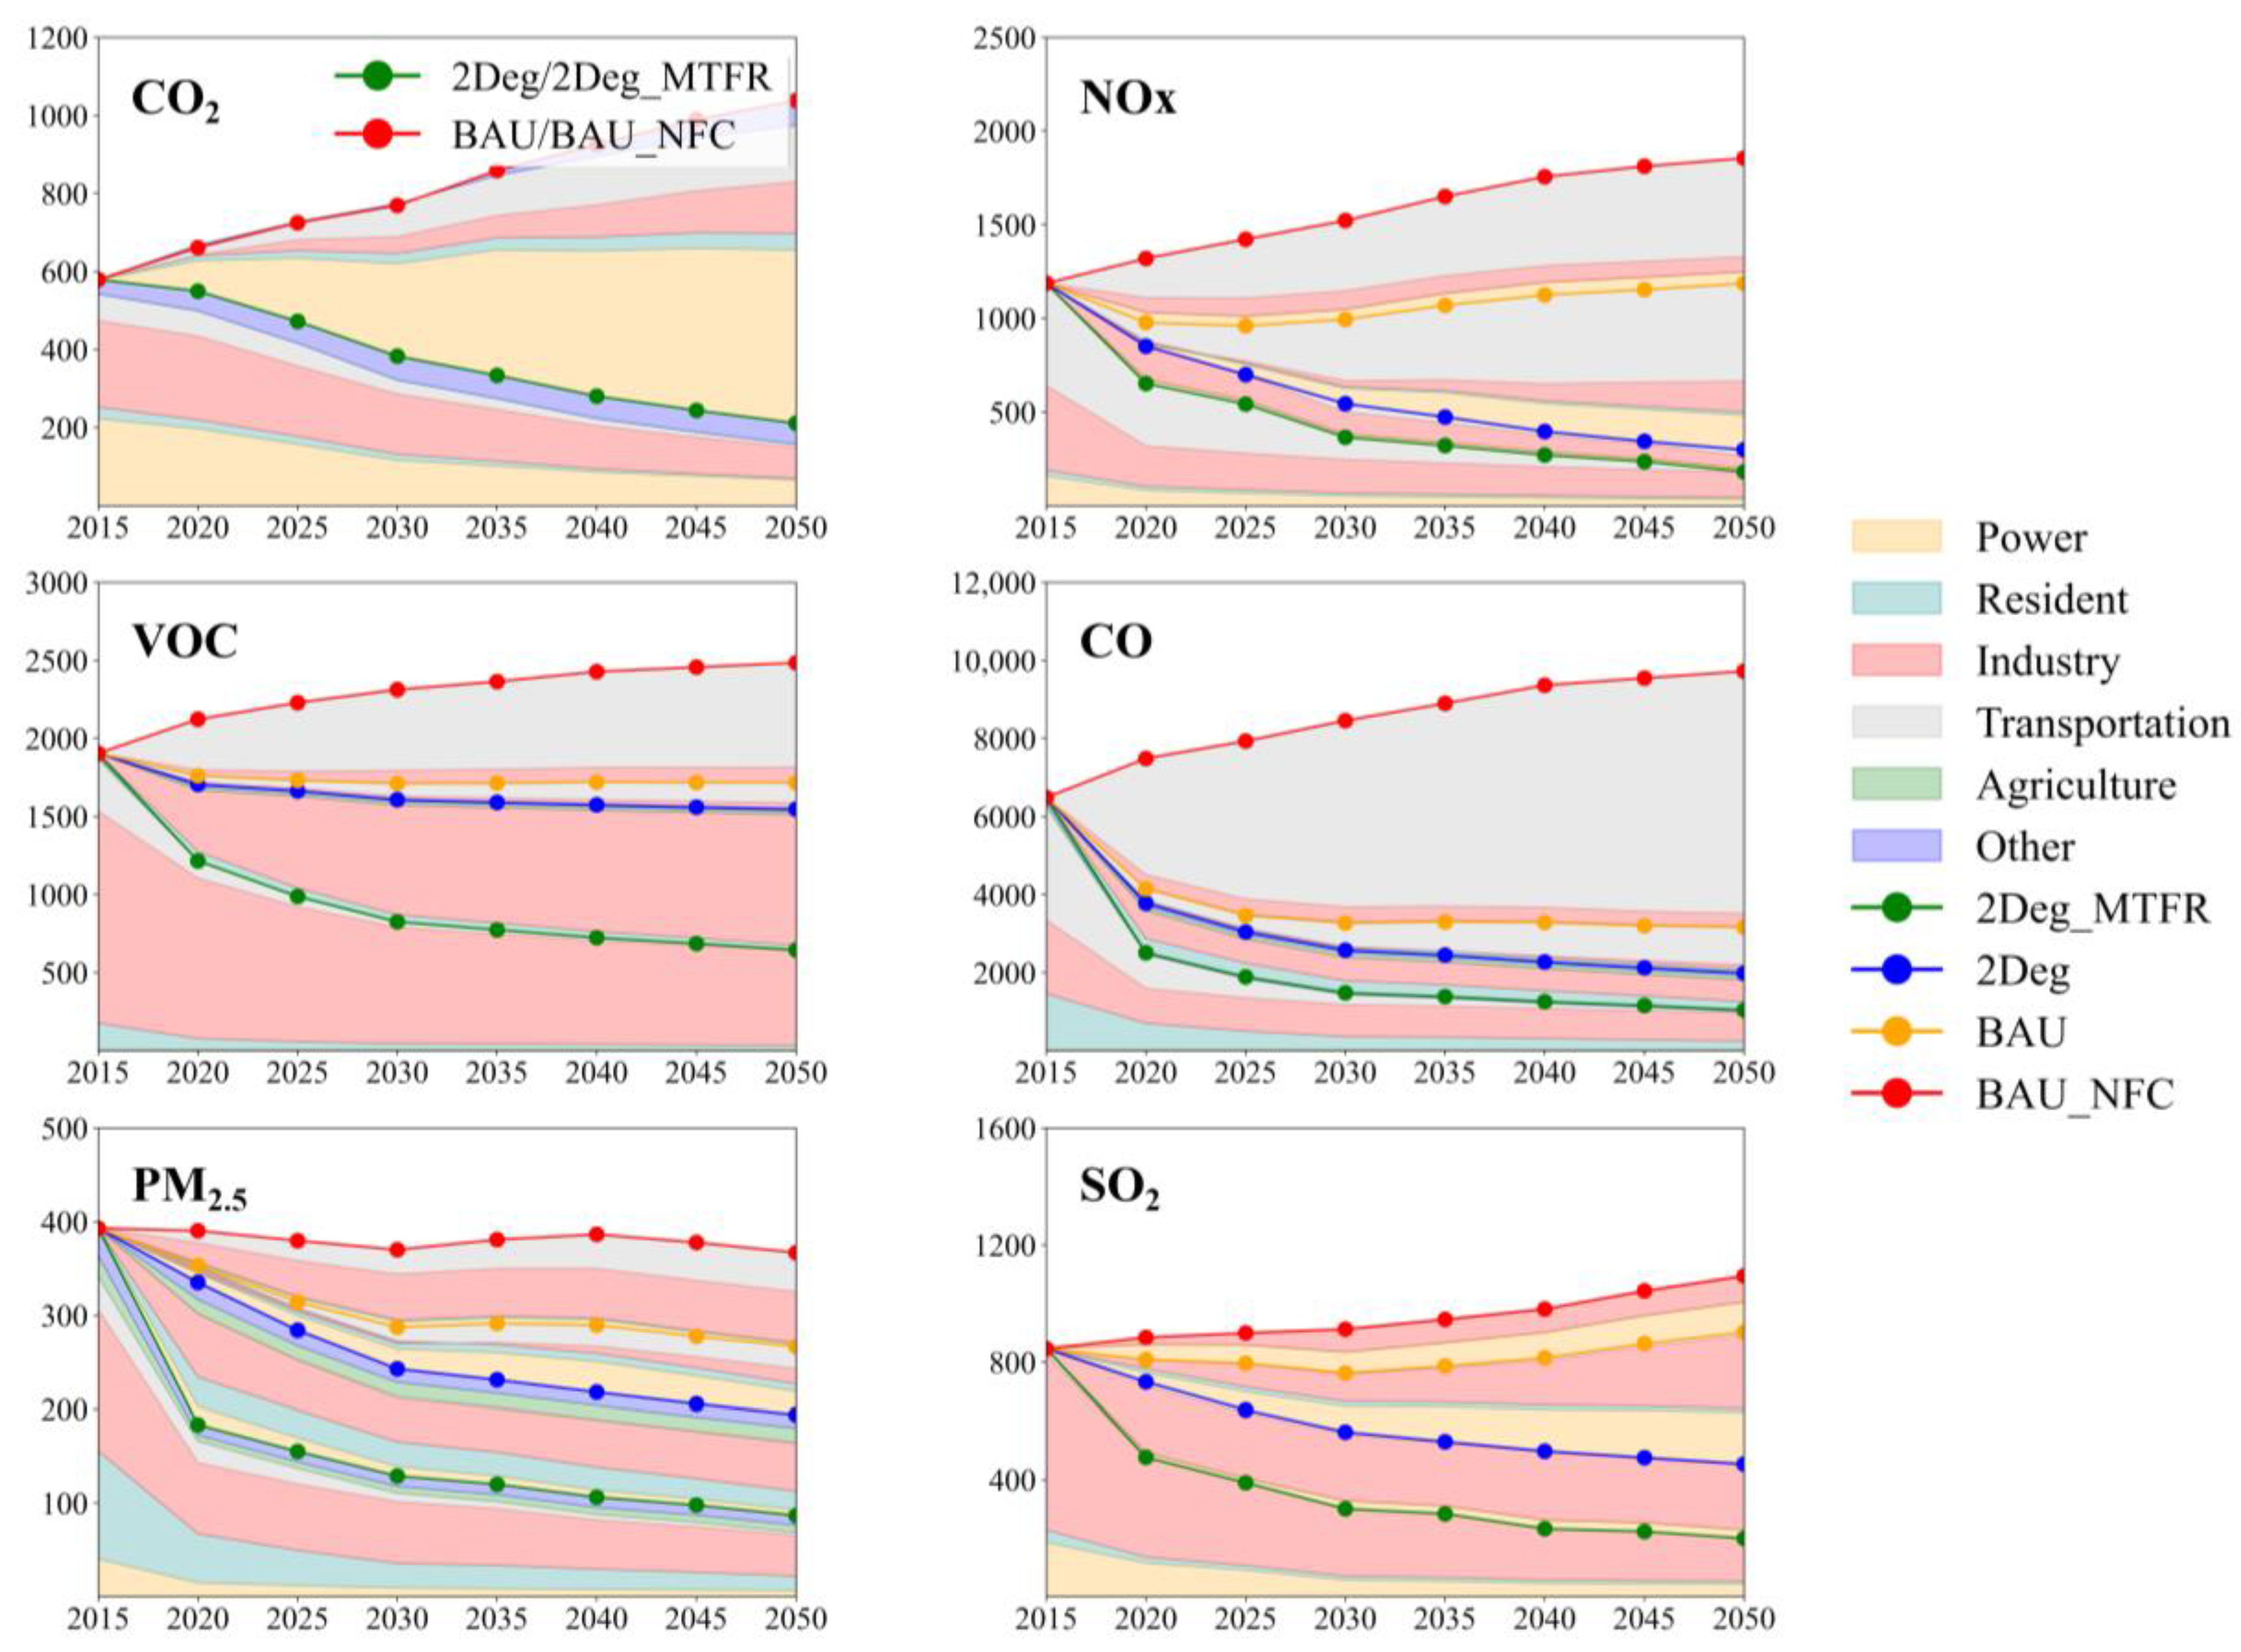
4.2. Emission Trends of Air Pollutant Emissions under Different Scenarios
4.3. Air Quality Changes under the Different Scenarios
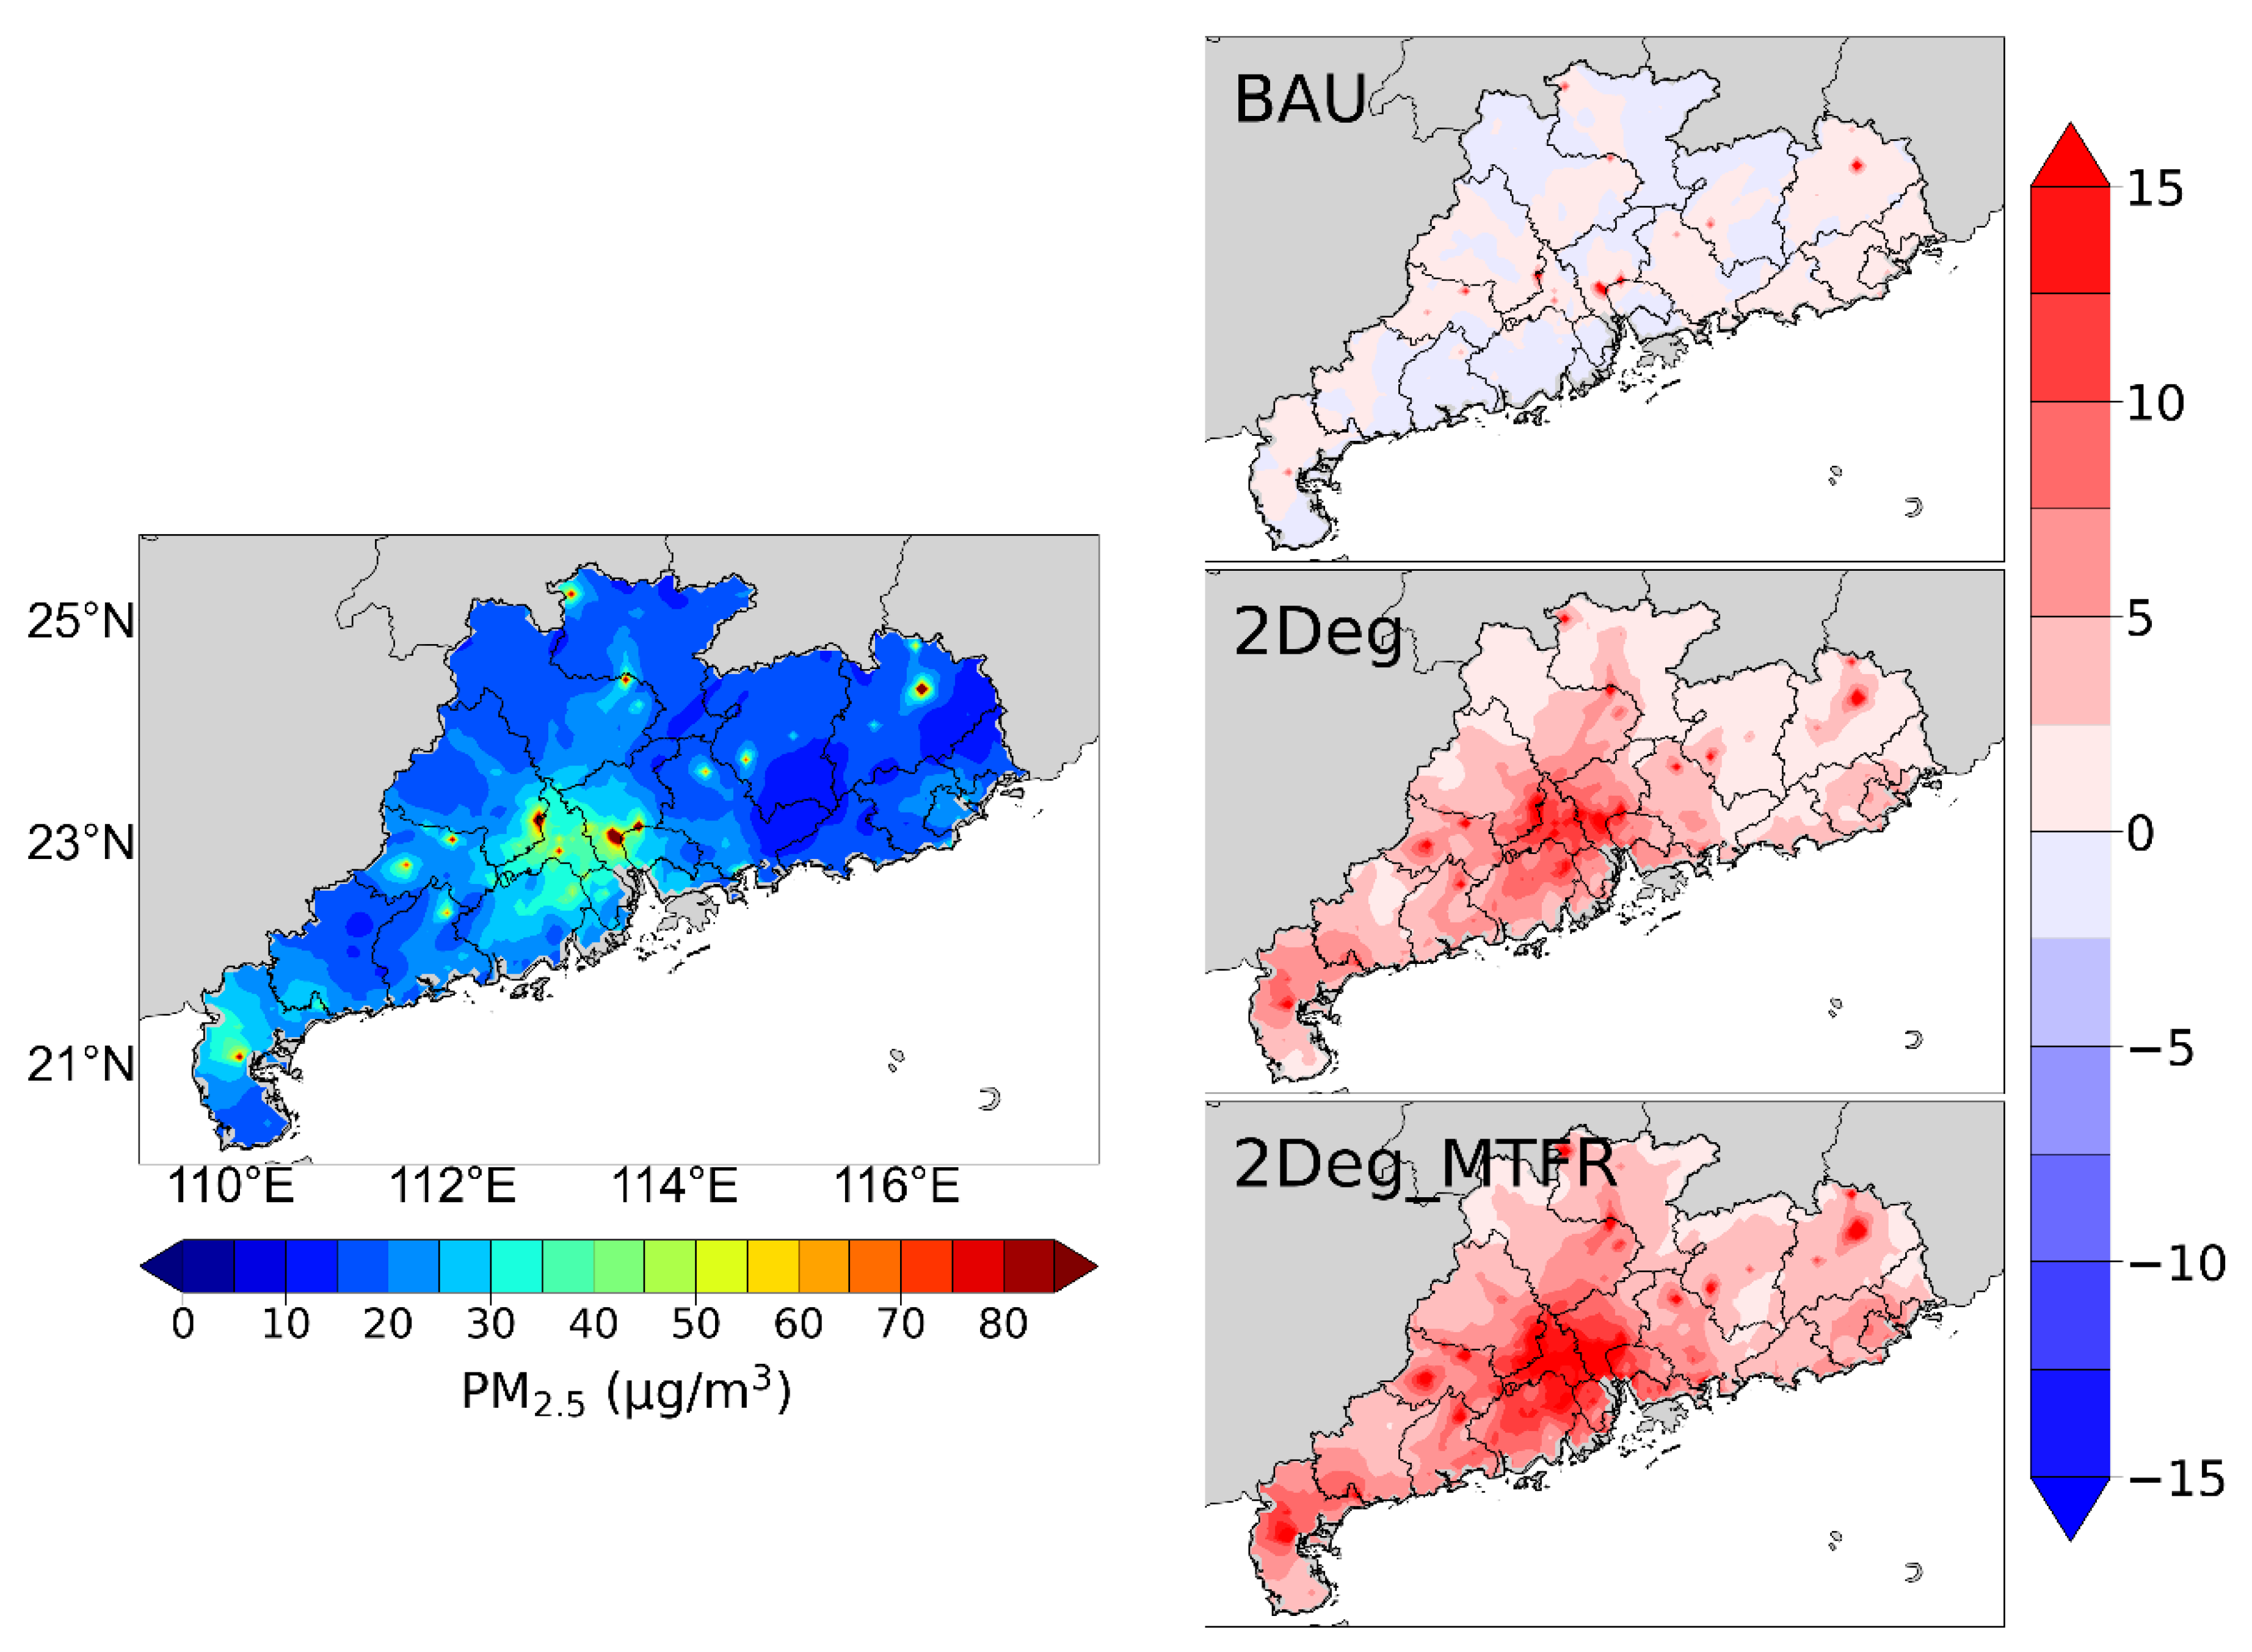
4.3.1. PM2.5
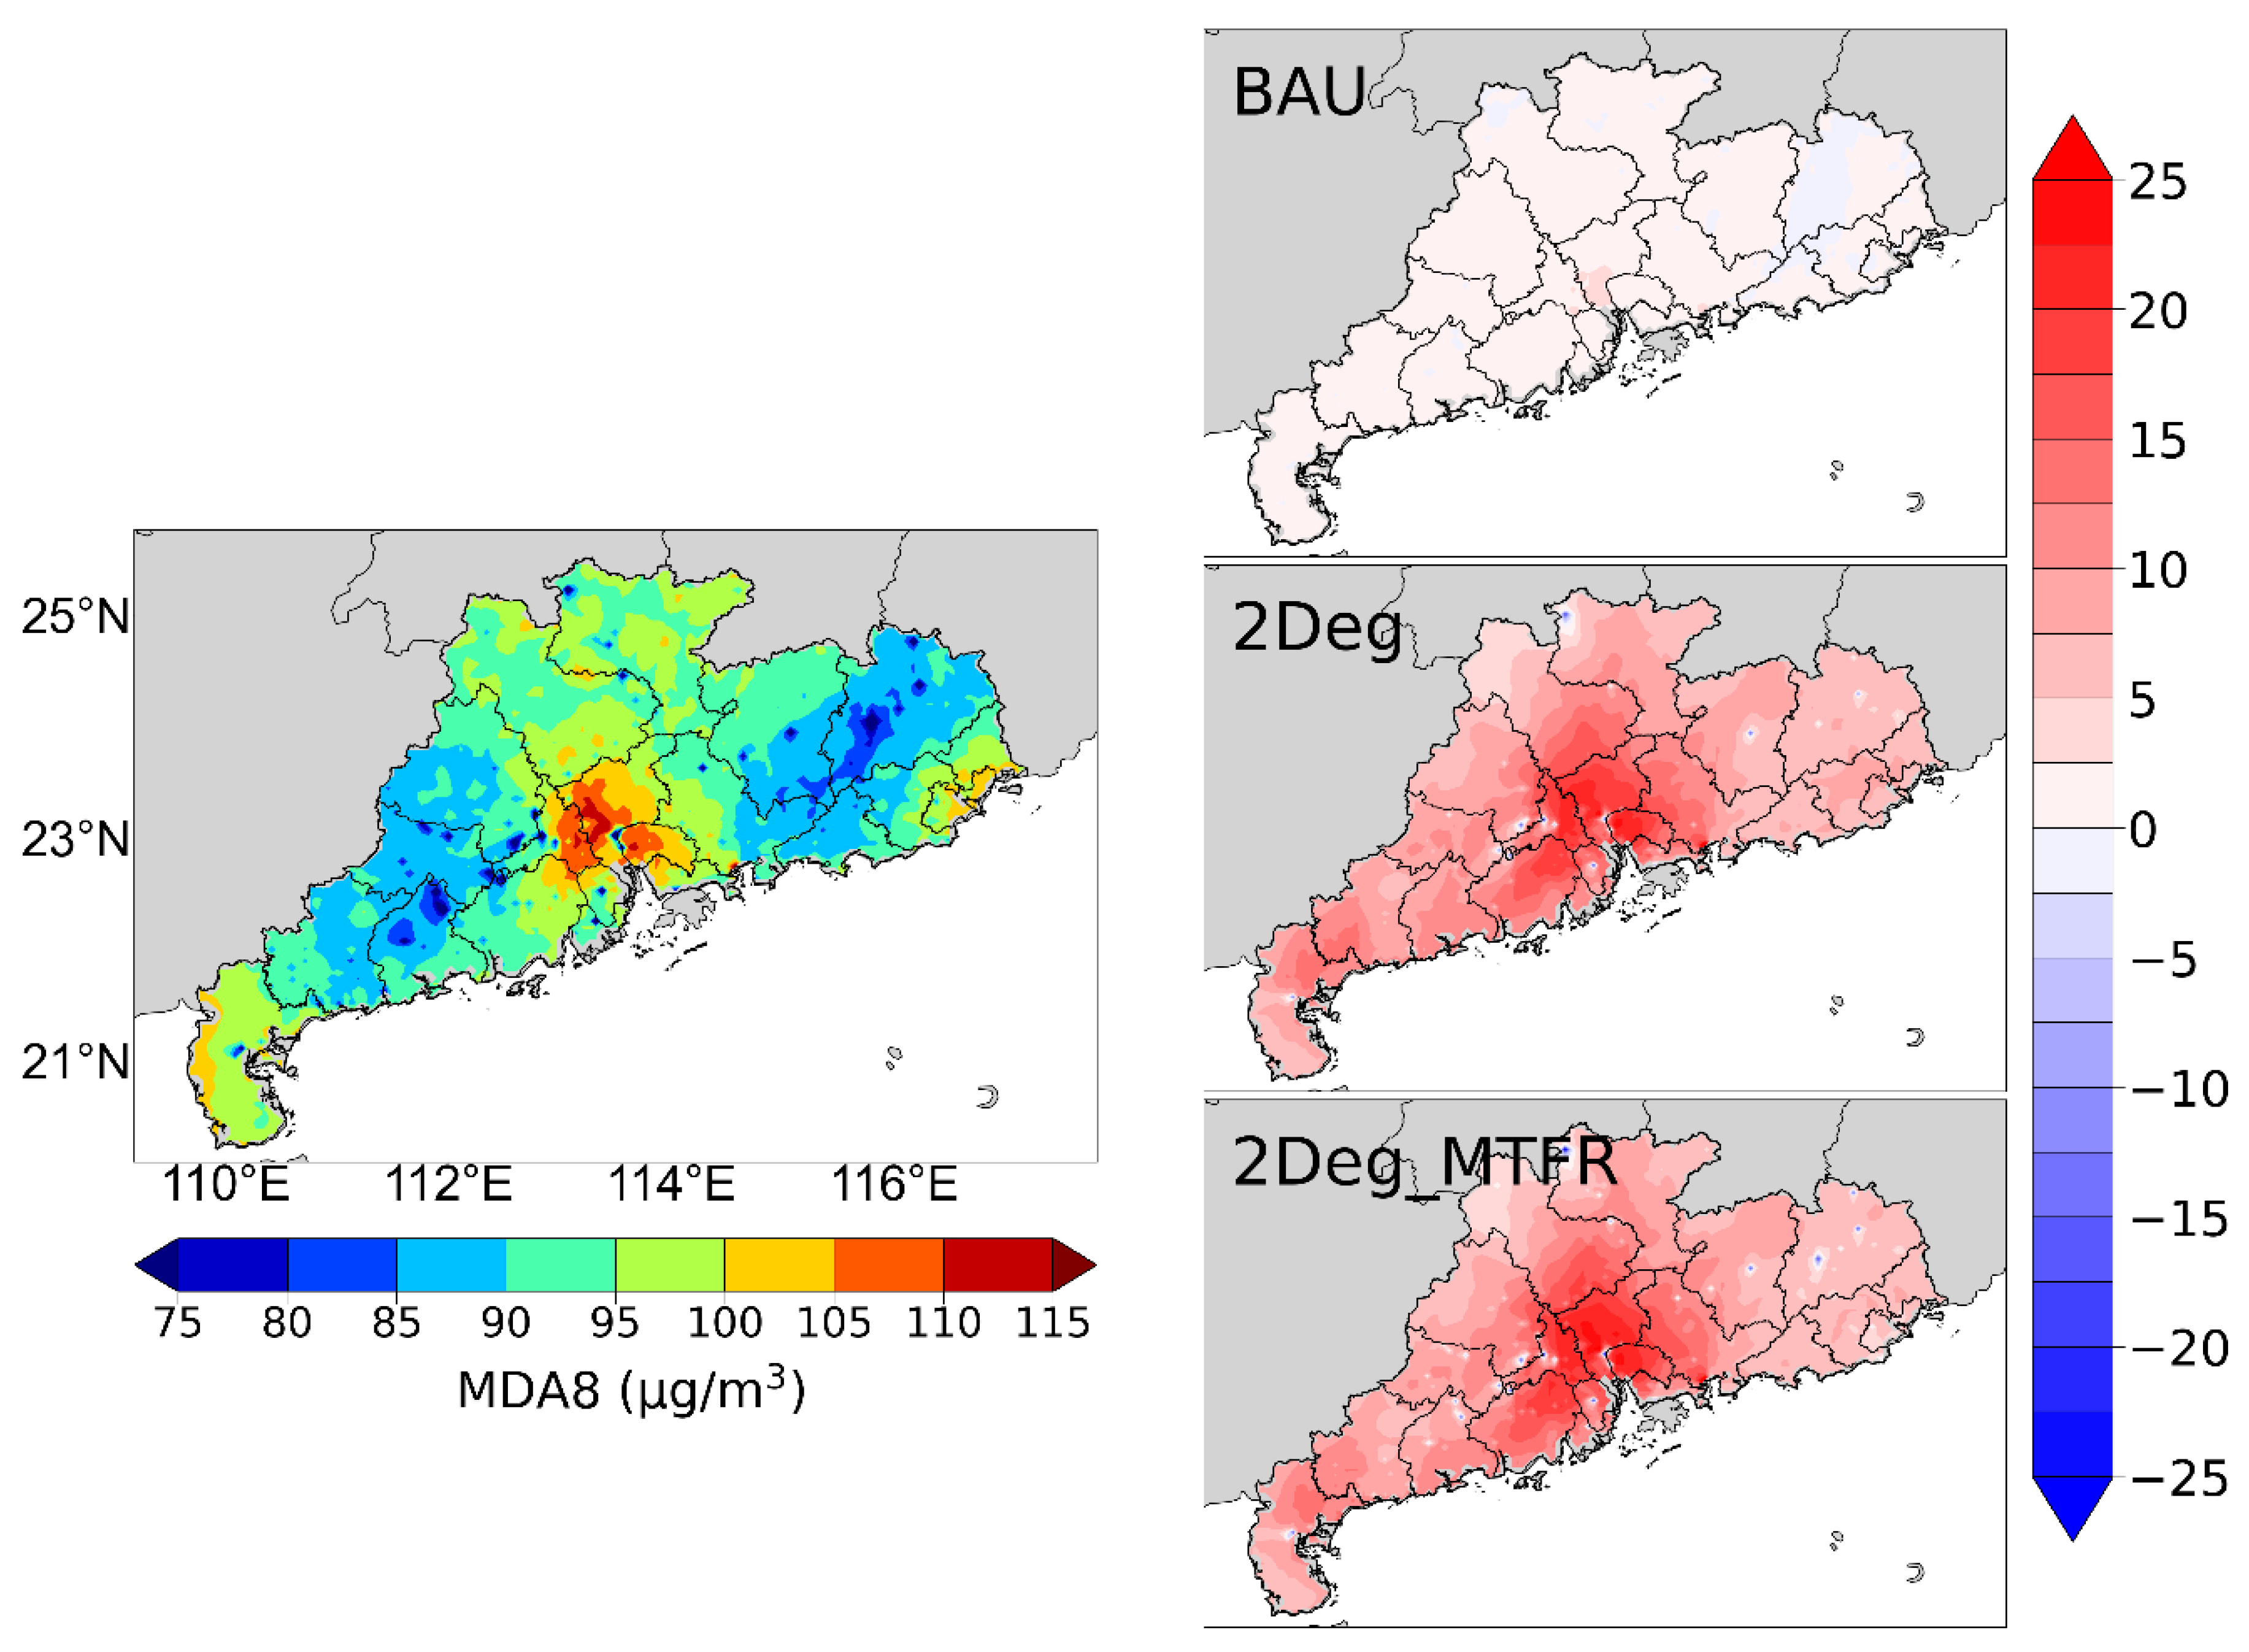
4.3.2. Ozone
4.4. Public Health Co-Benefits under the Different Scenarios
5. Discussion
6. Conclusions
Supplementary Materials
Author Contributions
Funding
Conflicts of Interest
References
- Shan, Y.; Huang, Q.; Guan, D.; Hubacek, K. China CO2 emission accounts 2016–2017. Sci. Data 2020, 7, 54. [Google Scholar] [CrossRef] [PubMed]
- Gregg, J.S.; Andres, R.J.; Marland, G. China: Emissions pattern of the world leader in CO2 emissions from fossil fuel consumption and cement production. Geophys. Res. Lett. 2008, 35. [Google Scholar] [CrossRef]
- Shan, Y.; Guan, D.; Zheng, H.; Ou, J.; Li, Y.; Meng, J.; Mi, Z.; Liu, Z.; Zhang, Q. China CO2 emission accounts 1997–2015. Sci. Data 2018, 5, 170201. [Google Scholar] [CrossRef] [PubMed]
- Agreement, P. Report of the Conference of the Parties to the United Nations Framework Convention on Climate Change (21st Session, 2015: Paris). In Paris Agreement; UN: New York, NY, USA, 2015; p. 2017. [Google Scholar]
- Zhou, X.; Cao, Z.; Ma, Y.; Wang, L.; Wu, R.; Wang, W. Concentrations, correlations and chemical species of PM2.5/PM10 based on published data in China: Potential implications for the revised particulate standard. Chemosphere 2016, 144, 518–526. [Google Scholar] [CrossRef]
- Kan, H.D.; Chen, R.J.; Tong, S.L. Ambient air pollution, climate change, and population health in China. Environ. Int. 2012, 42, 10–19. [Google Scholar] [CrossRef]
- Wang, T.; Xue, L.; Brimblecombe, P.; Lam, Y.F.; Li, L.; Zhang, L. Ozone pollution in China: A review of concentrations, meteorological influences, chemical precursors, and effects. Sci. Total Environ. 2017, 575, 1582–1596. [Google Scholar] [CrossRef]
- Feng, S.L.; Gao, D.; Liao, F.; Zhou, F.R.; Wang, X.M. The health effects of ambient PM2.5 and potential mechanisms. Ecotox. Environ. Saf. 2016, 128, 67–74. [Google Scholar] [CrossRef]
- Tong, D.; Geng, G.N.; Jiang, K.J.; Cheng, J.; Zheng, Y.X.; Hong, C.P.; Yan, L.; Zhang, Y.X.; Chen, X.T.; Bo, Y.; et al. Energy and emission pathways towards PM2.5 air quality attainment in the Beijing-Tianjin-Hebei region by 2030. Sci. Total. Environ. 2019, 692, 361–370. [Google Scholar] [CrossRef]
- Burnett, R.; Chen, H.; Szyszkowicz, M.; Fann, N.; Hubbell, B.; Pope, C.A., 3rd; Apte, J.S.; Brauer, M.; Cohen, A.; Weichenthal, S.; et al. Global estimates of mortality associated with long-term exposure to outdoor fine particulate matter. Proc. Natl. Acad. Sci. USA 2018, 115, 9592–9597. [Google Scholar] [CrossRef]
- Li, M.W.; Zhang, D.; Li, C.T.; Selin, N.E.; Karplus, V.J. Co-benefits of China’s climate policy for air quality and human health in China and transboundary regions in 2030. Environ. Res. Lett. 2019, 14, 084006. [Google Scholar] [CrossRef]
- Wang, Y.; Shen, L.; Wu, S.; Mickley, L.; He, J.; Hao, J. Sensitivity of surface ozone over China to 2000–2050 global changes of climate and emissions. Atmos. Environ. 2013, 75, 374–382. [Google Scholar] [CrossRef]
- Yang, J.; Zhao, Y.; Cao, J.; Nielsen, C.P. Co-benefits of carbon and pollution control policies on air quality and health till 2030 in China. Environ. Int. 2021, 152, 106482. [Google Scholar] [CrossRef] [PubMed]
- Xu, X.L.; Huang, G.H.; Liu, L.R.; Guan, Y.R.; Zhai, M.Y.; Li, Y.P. Revealing dynamic impacts of socioeconomic factors on air pollution changes in Guangdong Province, China. Sci. Total. Environ. 2020, 699, 134178. [Google Scholar] [CrossRef] [PubMed]
- Bian, Y.H.; Huang, Z.J.; Ou, J.M.; Zhong, Z.M.; Xu, Y.Q.; Zhang, Z.W.; Xiao, X.; Ye, X.; Wu, Y.Q.; Yin, X.H.; et al. Evolution of anthropogenic air pollutant emissions in Guangdong Province, China, from 2006 to 2015. Atmos. Chem. Phys. 2019, 19, 11701–11719. [Google Scholar] [CrossRef]
- World Health Organization. WHO Air Quality Guidelines for Particular Matter, Ozone, Dioxide and Sulfur Dioxide. Global Update 2005. Summary of Risk Assessment; WHO Publications: Berlin, Germany, 2005; Volume 74, p. 75.
- Wang, X.; Zhang, T.; Xiang, Y.; Lv, L.; Fan, G.; Ou, J. Investigation of atmospheric ozone during summer and autumn in Guangdong Province with a lidar network. Sci. Total Environ. 2021, 751, 141740. [Google Scholar] [CrossRef]
- Zhong, Z.M.; Zheng, J.Y.; Zhu, M.N.; Huang, Z.J.; Zhang, Z.W.; Jia, G.L.; Wang, X.L.; Bian, Y.H.; Wang, Y.L.; Li, N. Recent developments of anthropogenic air pollutant emission inventories in Guangdong province, China. Sci. Total Environ. 2018, 627, 1080–1092. [Google Scholar] [CrossRef]
- Zhang, Y.N.; Xiang, Y.R.; Chan, L.Y.; Chan, C.Y.; Sang, X.F.; Wang, R.; Fu, H.X. Procuring the regional urbanization and industrialization effect on ozone pollution in Pearl River Delta of Guangdong, China. Atmos. Environ. 2011, 45, 4898–4906. [Google Scholar] [CrossRef]
- Li, J.; Lu, K.; Lv, W.; Li, J.; Zhong, L.; Ou, Y.; Chen, D.; Huang, X.; Zhang, Y. Fast increasing of surface ozone concentrations in Pearl River Delta characterized by a regional air quality monitoring network during 2006–2011. J. Environ. Sci. 2014, 26, 23–36. [Google Scholar] [CrossRef]
- Li, N.; Chen, W.Y.; Rafaj, P.; Kiesewetter, G.; Schopp, W.; Wang, H.; Zhang, H.J.; Krey, V.; Riahi, K. Air Quality Improvement Co-benefits of Low-Carbon Pathways toward Well Below the 2 °C Climate Target in China. Environ. Sci. Technol. 2019, 53, 5576–5584. [Google Scholar] [CrossRef]
- Xie, Y.; Dai, H.; Zhang, Y.; Wu, Y.; Hanaoka, T.; Masui, T. Comparison of health and economic impacts of PM2.5 and ozone pollution in China. Environ. Int. 2019, 130, 104881. [Google Scholar] [CrossRef]
- Shi, X.; Zheng, Y.; Lei, Y.; Xue, W.; Yan, G.; Liu, X.; Cai, B.; Tong, D.; Wang, J. Air quality benefits of achieving carbon neutrality in China. Sci. Total Environ. 2021, 795, 148784. [Google Scholar] [CrossRef] [PubMed]
- Yang, X.; Teng, F. The air quality co-benefit of coal control strategy in China. Resour. Conserv. Recycl. 2018, 129, 373–382. [Google Scholar] [CrossRef]
- Tang, R.; Zhao, J.; Liu, Y.F.; Huang, X.; Zhang, Y.X.; Zhou, D.R.; Ding, A.J.; Nielsen, C.P.; Wang, H.K. Air quality and health co-benefits of China’s carbon dioxide emissions peaking before 2030. Nat. Commun. 2022, 13, 1008. [Google Scholar] [CrossRef] [PubMed]
- Westervelt, D.M.; Ma, C.T.; He, M.Z.; Fiore, A.M.; Kinney, P.L.; Kioumourtzoglou, M.A.; Wang, S.; Xing, J.; Ding, D.; Correa, G. Mid-21st century ozone air quality and health burden in China under emissions scenarios and climate change. Environ. Res. Lett. 2019, 14, 074030. [Google Scholar] [CrossRef]
- Xie, Y.; Wu, Y.Z.; Xie, M.J.; Li, B.D.; Zhang, H.; Ma, T.; Zhang, Y.Q. Health and economic benefit of China’s greenhouse gas mitigation by 2050. Environ. Res. Lett. 2020, 15, 104042. [Google Scholar] [CrossRef]
- Dong, H.J.; Dai, H.C.; Dong, L.; Fujita, T.; Geng, Y.; Klimont, Z.; Inoue, T.; Bunya, S.; Fujii, M.; Masui, T. Pursuing air pollutant co-benefits of CO2 mitigation in China: A provincial leveled analysis. Appl. Energy 2015, 144, 165–174. [Google Scholar] [CrossRef]
- Zhang, S.L.; Wu, Y.Z.; Liu, X.R.; Qian, J.; Chen, J.H.; Han, L.; Dai, H.C. Co-benefits of deep carbon reduction on air quality and health improvement in Sichuan Province of China. Environ. Res. Lett. 2021, 16, 095011. [Google Scholar] [CrossRef]
- Wu, P.; Guo, F.; Cai, B.; Wang, C.; Lv, C.; Liu, H.; Huang, J.; Huang, Y.; Cao, L.; Pang, L.; et al. Co-benefits of peaking carbon dioxide emissions on air quality and health, a case of Guangzhou, China. J. Environ. Manag. 2021, 282, 111796. [Google Scholar] [CrossRef]
- Jiang, J.J.; Ye, B.; Shao, S.; Zhou, N.; Wang, D.S.; Zeng, Z.Z.; Liu, J.G. Two-Tier Synergic Governance of Greenhouse Gas Emissions and Air Pollution in China’s Megacity, Shenzhen: Impact Evaluation and Policy Implication. Environ. Sci. Technol. 2021, 55, 7225–7236. [Google Scholar] [CrossRef]
- Chen, W.D.; Li, H.X.; Zhu, Y.; Jang, J.C.; Lin, C.J.; Chiang, P.C.; Wang, S.X.; Xing, J.; Fang, T.T.; Li, J.; et al. Impact Assessment of Energy Transition Policy on Air Quality over a Typical District of the Pearl River Delta Region, China. Aerosol Air Qual. Res. 2022, 22, 220071. [Google Scholar] [CrossRef]
- Xu, B.Y.; Wang, T.J.; Ma, D.Y.; Song, R.; Zhang, M.; Gao, L.B.; Li, S.; Zhuang, B.L.; Li, M.M.; Xie, M. Impacts of regional emission reduction and global climate change on air quality and temperature to attain carbon neutrality in China. Atmos. Res. 2022, 279, 106384. [Google Scholar] [CrossRef]
- Chang, S.C.; Zeng, W.T.; Zheng, Y.J.; Wang, L.; Song, Z.; Zhu, Q.R.; Luo, Y.P.; Li, P.F.; Li, Y.X.; Liao, C.H.; et al. Emission mitigation pathways to achieve PM2.5 interim target III of the world health organization in the Pearl River Delta in 2035. Atmos. Res. 2022, 269, 106050. [Google Scholar] [CrossRef]
- Tong, D.; Cheng, J.; Liu, Y.; Yu, S.; Yan, L.; Hong, C.P.; Qin, Y.; Zhao, H.Y.; Zheng, Y.X.; Geng, G.N.; et al. Dynamic projection of anthropogenic emissions in China: Methodology and 2015–2050 emission pathways under a range of socio-economic, climate policy, and pollution control scenarios. Atmos. Chem. Phys. 2020, 20, 5729–5757. [Google Scholar] [CrossRef]
- Peng, W.; Yang, J.N.; Wagner, F.; Mauzerall, D.L. Substantial air quality and climate co-benefits achievable now with sectoral mitigation strategies in China. Sci. Total. Environ. 2017, 598, 1076–1084. [Google Scholar] [CrossRef] [PubMed]
- Peng, W.; Yang, J.N.; Lu, X.; Mauzerall, D.L. Potential co-benefits of electrification for air quality, health, and CO2 mitigation in 2030 China. Appl. Energy 2018, 218, 511–519. [Google Scholar] [CrossRef]
- Wang, K.; Wang, S.S.; Liu, L.; Yue, H.; Zhang, R.Q.; Tang, X.Y. Environmental co-benefits of energy efficiency improvement in coal-fired power sector: A case study of Henan Province, China. Appl. Energy 2016, 184, 810–819. [Google Scholar] [CrossRef]
- Zhang, S.H.; Worrell, E.; Crijns-Graus, W. Evaluating co-benefits of energy efficiency and air pollution abatement in China’s cement industry. Appl. Energy 2015, 147, 192–213. [Google Scholar] [CrossRef]
- Jiang, K.; He, C.; Dai, H.; Liu, J.; Xu, X. Emission scenario analysis for China under the global 1.5 °C target. Carbon Manag. 2018, 9, 481–491. [Google Scholar] [CrossRef]
- Jiang, K.; Hu, X.; Matsuoka, Y.; Morita, T. Energy technology changes and CO2 emission scenarios in China. J. Environ. Econ. Policy Stud. 1998, 1, 141–160. [Google Scholar] [CrossRef]
- Jiang, K.J.; Hu, X.L.; Zhu, S.L. Multi-gas mitigation analysis by IPAC. Energy J. 2006, 27, 425–440. [Google Scholar] [CrossRef]
- Jiang, K.J.; Zhuang, X.; Miao, R.; He, C.M. China’s role in attaining the global 2 degrees C target. Clim. Policy 2013, 13 (Suppl. S1), 55–69. [Google Scholar] [CrossRef]
- Jiang, K.G.; Hu, X.L. Emission scenario of non-CO2 gases from energy activities and other sources in China. Sci. Chin. Ser. C 2005, 48, 955–964. [Google Scholar]
- Jiang, K.J.; Zhao, D.Q.; Wang, W.J.; Hu, S. Energy Transition Scenario Study of Guangdong-Hong Kong-Macao to Realizing Air Pollution and CO2 Mitigation Targets; Guangdong-Hong Kong-Macau Greater Bay Area Green Development Report; China Yanshi Publishing House: Macao, China, 2020. [Google Scholar]
- Amann, M.; Bertok, I.; Borken-Kleefeld, J.; Cofala, J.; Heyes, C.; Hoglund-Isaksson, L.; Klimont, Z.; Nguyen, B.; Posch, M.; Rafaj, P.; et al. Cost-effective control of air quality and greenhouse gases in Europe: Modeling and policy applications. Environ. Modell. Softw. 2011, 26, 1489–1501. [Google Scholar] [CrossRef]
- Stohl, A.; Aamaas, B.; Amann, M.; Baker, L.H.; Bellouin, N.; Berntsen, T.K.; Boucher, O.; Cherian, R.; Collins, W.; Daskalakis, N.; et al. Evaluating the climate and air quality impacts of short-lived pollutants. Atmos. Chem. Phys. 2015, 15, 10529–10566. [Google Scholar] [CrossRef]
- Zhao, Y.; Zhang, J.; Nielsen, C. The effects of recent control policies on trends in emissions of anthropogenic atmospheric pollutants and CO2 in China. Atmos. Chem. Phys. 2013, 13, 487–508. [Google Scholar] [CrossRef]
- Wang, S.X.; Zhao, B.; Cai, S.Y.; Klimont, Z.; Nielsen, C.P.; Morikawa, T.; Woo, J.H.; Kim, Y.; Fu, X.; Xu, J.Y.; et al. Emission trends and mitigation options for air pollutants in East Asia. Atmos. Chem. Phys. 2014, 14, 6571–6603. [Google Scholar] [CrossRef]
- Grell, G.A.; Peckham, S.E.; Schmitz, R.; McKeen, S.A.; Frost, G.; Skamarock, W.C.; Eder, B. Fully coupled "online" chemistry within the WRF model. Atmos. Environ. 2005, 39, 6957–6975. [Google Scholar] [CrossRef]
- Carter, W.P. Implementation of the SAPRC-99 Chemical Mechanism into the Models-3 Framework; United States Environmental Protection Agency: Washington, DC, USA, 2000.
- Shrivastava, M.; Fast, J.; Easter, R.; Gustafson, W.I.; Zaveri, R.A.; Jimenez, J.L.; Saide, P.; Hodzic, A. Modeling organic aerosols in a megacity: Comparison of simple and complex representations of the volatility basis set approach. Atmos. Chem. Phys. 2011, 11, 6639–6662. [Google Scholar] [CrossRef]
- Zaveri, R.A.; Easter, R.C.; Fast, J.D.; Peters, L.K. Model for Simulating Aerosol Interactions and Chemistry (MOSAIC). J. Geophys. Res.-Atmos. 2008, 113, D13. [Google Scholar] [CrossRef]
- Emmons, L.K.; Walters, S.; Hess, P.G.; Lamarque, J.F.; Pfister, G.G.; Fillmore, D.; Granier, C.; Guenther, A.; Kinnison, D.; Laepple, T.; et al. Description and evaluation of the Model for Ozone and Related chemical Tracers, version 4 (MOZART-4). Geosci. Model. Dev. 2010, 3, 43–67. [Google Scholar] [CrossRef]
- Warszawski, L.; Frieler, K.; Huber, V.; Piontek, F.; Serdeczny, O.; Zhang, X.; Tang, Q.; Pan, M.; Tang, Y.; Tang, Q.; et al. Center for International Earth Science Information Network—CIESIN—Columbia University (2016). Gridded Population of the World, Version 4 (GPWv4): Population Density; NASA Socioeconomic Data and Applications Center (SEDAC): Palisades, NY, USA, 2017; p. 228. [Google Scholar] [CrossRef]
- Burnett, R.T.; Pope, C.A.; Ezzati, M.; Olives, C.; Lim, S.S.; Mehta, S.; Shin, H.H.; Singh, G.; Hubbell, B.; Brauer, M.; et al. An Integrated Risk Function for Estimating the Global Burden of Disease Attributable to Ambient Fine Particulate Matter Exposure. Environ. Health Perspect. 2014, 122, 397–403. [Google Scholar] [CrossRef] [PubMed]
- Jiang, X.J.; Zhang, Q.; Zhao, H.Y.; Geng, G.N.; Peng, L.Q.; Guan, D.B.; Kan, H.D.; Huo, H.; Lin, J.T.; Brauer, M.; et al. Revealing the Hidden Health Costs Embodied in Chinese Exports. Environ. Sci. Technol. 2015, 49, 4381–4388. [Google Scholar] [CrossRef] [PubMed]
- Lelieveld, J.; Barlas, C.; Giannadaki, D.; Pozzer, A. Model calculated global, regional and megacity premature mortality due to air pollution. Atmos. Chem. Phys. 2013, 13, 7023–7037. [Google Scholar] [CrossRef]
- Liu, H.; Liu, S.; Xue, B.R.; Lv, Z.F.; Meng, Z.H.; Yang, X.F.; Xue, T.; Yu, Q.; He, K.B. Ground-level ozone pollution and its health impacts in China. Atmos. Environ. 2018, 173, 223–230. [Google Scholar] [CrossRef]
- Turner, M.C.; Jerrett, M.; Pope, C.A.; Krewski, D.; Gapstur, S.M.; Diver, W.R.; Beckerman, B.S.; Marshall, J.D.; Su, J.; Crouse, D.L.; et al. Long-Term Ozone Exposure and Mortality in a Large Prospective Study. Am. J. Respir. Crit. Care 2016, 193, 1134–1142. [Google Scholar] [CrossRef]
- Wang, J.; Wu, Q.; Liu, J.; Yang, H.; Yin, M.; Chen, S.; Guo, P.; Ren, J.; Luo, X.; Linghu, W.; et al. Vehicle emission and atmospheric pollution in China: Problems, progress, and prospects. PeerJ 2019, 7, 6932. [Google Scholar] [CrossRef]
- Sillman, S. The relation between ozone, NOx and hydrocarbons in urban and polluted rural environments. Atmos. Environ. 1999, 33, 1821–1845. [Google Scholar] [CrossRef]
- Vingarzan, R. A review of surface ozone background levels and trends. Atmos. Environ. 2004, 38, 3431–3442. [Google Scholar] [CrossRef]
- Liu, S.; Xing, J.; Westervelt, D.M.; Liu, S.C.; Ding, D.; Fiore, A.M.; Kinney, P.L.; Zhang, Y.Q.; He, M.Z.; Zhang, H.L.; et al. Role of emission controls in reducing the 2050 climate change penalty for PM2.5 in China. Sci. Total Environ. 2021, 765, 144338. [Google Scholar] [CrossRef]
- Pedde, S.; Kok, K.; Holscher, K.; Frantzeskaki, N.; Holman, I.; Dunford, R.; Smith, A.; Jager, J. Advancing the use of scenarios to understand society’s capacity to achieve the 1.5 degree target. Glob. Environ. Change 2019, 56, 75–85. [Google Scholar] [CrossRef]
- Yue, H.; Worrell, E.; Crijns-Graus, W.; Zhang, S.H. The potential of industrial electricity savings to reduce air pollution from coal-fired power generation in China. J. Clean. Prod. 2021, 301, e126978. [Google Scholar] [CrossRef]
- Zhang, Q.R.; Tong, P.F.; Liu, M.D.; Lin, H.M.; Yun, X.; Zhang, H.R.; Tao, W.; Liu, J.F.; Wang, S.X.; Tao, S.; et al. A WRF-Chem model-based future vehicle emission control policy simulation and assessment for the Beijing-Tianjin-Hebei region, China. J. Environ. Manag. 2020, 253, 109751. [Google Scholar] [CrossRef] [PubMed]
- Zhang, Q.; Jiang, X.J.; Tong, D.; Davis, S.J.; Zhao, H.Y.; Geng, G.N.; Feng, T.; Zheng, B.; Lu, Z.F.; Streets, D.G.; et al. Transboundary health impacts of transported global air pollution and international trade. Nature 2017, 543, 705–709. [Google Scholar] [CrossRef] [PubMed]
- Hong, C.P.; Zhang, Q.; Zhang, Y.; Tang, Y.H.; Tong, D.; He, K.B. Multi-year downscaling application of two-way coupled WRF v3.4 and CMAQ v5.0.2 over east Asia for regional climate and air quality modeling: Model evaluation and aerosol direct effects. Geosci. Model. Dev. 2017, 10, 2447–2470. [Google Scholar] [CrossRef]
- Leung, D.M.; Tai, A.P.; Mickley, L.J.; Moch, J.M.; van Donkelaar, A.; Shen, L.; Martin, R.V. Synoptic meteorological modes of variability for fine particulate matter (PM2.5) air quality in major metropolitan regions of China. Atmos. Chem. Phys. 2018, 18, 6733–6748. [Google Scholar] [CrossRef]


| Scenario | Energy Structure Scenario | End-Of-Pipe Control Scenario |
|---|---|---|
| BAU_NFC | BAU_Energy | NFC |
| BAU | BAU_Energy | CLE |
| 2Deg | 2Deg_Energy | CLE |
| 2Deg_MTFR | 2Deg_Energy | MTFR |
Publisher’s Note: MDPI stays neutral with regard to jurisdictional claims in published maps and institutional affiliations. |
© 2022 by the authors. Licensee MDPI, Basel, Switzerland. This article is an open access article distributed under the terms and conditions of the Creative Commons Attribution (CC BY) license (https://creativecommons.org/licenses/by/4.0/).
Share and Cite
Mo, H.; Jiang, K.; Wang, P.; Shao, M.; Wang, X. Co-Benefits of Energy Structure Transformation and Pollution Control for Air Quality and Public Health until 2050 in Guangdong, China. Int. J. Environ. Res. Public Health 2022, 19, 14965. https://doi.org/10.3390/ijerph192214965
Mo H, Jiang K, Wang P, Shao M, Wang X. Co-Benefits of Energy Structure Transformation and Pollution Control for Air Quality and Public Health until 2050 in Guangdong, China. International Journal of Environmental Research and Public Health. 2022; 19(22):14965. https://doi.org/10.3390/ijerph192214965
Chicago/Turabian StyleMo, Haihua, Kejun Jiang, Peng Wang, Min Shao, and Xuemei Wang. 2022. "Co-Benefits of Energy Structure Transformation and Pollution Control for Air Quality and Public Health until 2050 in Guangdong, China" International Journal of Environmental Research and Public Health 19, no. 22: 14965. https://doi.org/10.3390/ijerph192214965
APA StyleMo, H., Jiang, K., Wang, P., Shao, M., & Wang, X. (2022). Co-Benefits of Energy Structure Transformation and Pollution Control for Air Quality and Public Health until 2050 in Guangdong, China. International Journal of Environmental Research and Public Health, 19(22), 14965. https://doi.org/10.3390/ijerph192214965