Article

Emergency Department Visits for Heat-Related Emergency Conditions in the United States from 2008–2020

1
College of Medicine, University of Cincinnati, Cincinnati, OH 45267, USA
2
Center for Pediatric Trauma Research, Nationwide Children’s Hospital, Columbus, OH 43205, USA
3
Center for Injury Research and Policy, Nationwide Children’s Hospital, Columbus, OH 43205, USA
4
Center for Biostatistics, The Ohio State University, Columbus, OH 43210, USA
5
College of Medicine, The Ohio State University, Columbus, OH 43210, USA
6
College of Public Health, The Ohio State University, Columbus, OH 43210, USA
*
Author to whom correspondence should be addressed.
Int. J. Environ. Res. Public Health 2022, 19(22), 14781; https://doi.org/10.3390/ijerph192214781
Submission received: 27 September 2022 / Revised: 4 November 2022 / Accepted: 6 November 2022 / Published: 10 November 2022

Abstract

:
Exposure to high temperatures is detrimental to human health. As climate change is expected to increase the frequency of extreme heat events, and raise ambient temperatures, an investigation into the trend of heat-related emergency department (ED) visits over the past decade is necessary to assess the human health impact of this growing public health crisis. ED visits were examined using the Nationwide Emergency Department Sample. Visits were included if the diagnostic field contained an ICD-9-CM or ICD-10-CM code specific to heat-related emergency conditions. Weighted counts were generated using the study design and weighting variables, to estimate the national burden of heat-related ED visits. A total of 1,078,432 weighted visits were included in this study. The annual incidence rate per 100,000 population increased by an average of 2.85% per year, ranging from 18.21 in 2009, to 32.34 in 2018. The total visit burden was greatest in the South (51.55%), with visits increasing to the greatest degree in the Midwest (8.52%). ED visit volume was greatest in July (29.79%), with visits increasing to the greatest degree in July (15.59%) and March (13.18%). An overall increase in heat-related ED visits for heat-related emergency conditions was found during the past decade across the United States, affecting patients in all regions and during all seasons.

1. Introduction

Scientists predict a global temperature increase exceeding 3 °C above pre-industrial averages by the end of the century [1]. A sharp increase in weather-related mortality is expected across the United States as a result of this climate change [2]. As temperatures rise, episodes of extreme heat are expected to become longer, more intense, and more frequent [3,4]. The negative impact of extreme heat events on human health, as it relates to both morbidity and mortality, has been well documented [5,6,7,8,9,10,11,12,13].
Emergency department (ED) patient volumes are usually seen to rise during episodes of extreme heat, which are typically defined as periods of temperature exceeding the 95th–99th percentile of region norms [5,6,14,15]. Unsurprisingly, visits for heat-related emergency conditions—a term used to encompass a spectrum of symptoms resulting from exposure to high temperatures [16]—are reported to increase by roughly 70% during these events [15,17]. Outside of extreme heat events, higher ambient temperatures are also harmful to human health [18]. Mortality risk is seen to rise by 8% for each degree (F) increase in maximum daily temperature from one day to the next [7]. Heat-related emergency conditions are also seen to increase on days with higher ambient temperature that do not meet the threshold of extreme heat, with one study citing a 393.3% excessive risk in heat-related ED visits for every 10° (F) increase in temperature [19].
Almost all investigations into heat-related ED visits have restricted the time course of analysis to extreme heat events during the warm season [15,19,20,21,22,23]. However, the effects of climate change have necessitated a new approach to researching heat-related emergency conditions. Ambient temperatures have risen to a greater degree during the winter months as compared to summer months, and seasonal shifts have seen warmer weather arrive earlier in the Spring and linger later into the Fall [24,25,26]. The concern for heat-related emergency conditions is therefore no longer just limited to the warm season, and should be evaluated throughout the year. Further, past investigations into heat-related ED visits have generally included narrow populations of interest, with studies focused on populations in California, Florida, and North Carolina [17,19,21,27]. Even the largest sample analyses, looking at all adult Medicare beneficiaries or the 14 CDC public health tracking states, captured only a quarter of the United States population.
At the time of our study, no article could be found describing the burden of heat-related emergency conditions in the United States on an annual and national scale over the past decade. This study aimed to characterize the national trends in ED visits for heat-related emergency conditions in United States from 2008–2020. Our hypothesis was that the incidence rate per 100,000 US population of heat-related ED visits increased significantly over the past decade.

2. Materials and Methods

ED records were obtained from the Nationwide Emergency Department Sample (NEDS), provided by the Agency for Healthcare Research and Quality as a part of the Healthcare Cost and Utilization Project [28]. The data provided by NEDS are de-identified and publicly available, so IRB approval was not required for this study. NEDS compiles information from both the State Inpatient Databases and State Emergency Department Databases, capturing patients that are seen in the ED and subsequently admitted to the hospital, transferred to another facility, or released following ED treatment. Data were available from NEDS for the years 2006–2020, but this analysis was restricted to 2008–2020 due to technical challenges in releasing the 2006–2007 NEDS dataset by the Agency for Healthcare Research and Quality. NEDS records were collected from 989 facilities that represent a 20-percent stratified sample of United States hospital-owned EDs [29].
ED visits were included in this study if the medical diagnosis, in any position, contained an International Classification of Diseases, Ninth Revision Clinical Modifications (ICD-9-CM) or Tenth Revision Clinical Modifications (ICD-10-CM) code for heat-related emergency conditions, as established by previous studies [30]. In the NEDS, ICD-9-CM codes were effective from the start of 2008 through quarter 3 of 2015, and included diagnostic codes 992.0–992.9, and external cause of injury codes E9000 and E9009. ICD-10-CM codes were effective from quarter 4 of 2015 through the end of 2020, and included codes T67.0–67.9, V932, X30, and X32. Diagnostic codes for accidents or exposure related to excessive man-made heat (E9001 and W92, respectively) were not included, as our analysis aimed to focus on natural heat related emergency conditions. See Appendix A for complete listing of ICD codes utilized in this study.
Within the NEDS dataset, there is a discharge weighting factor to use in generating national estimates. Weighted counts of heat-related ED visits were generated using the survey design stratum, cluster of hospitals, and weighing DISCWT method [28]. These weights, incorporating the survey design elements (strata and clustering), are applied to NEDS unweighted observations to generate national level frequency estimates. The Taylor series linearization method was used to estimate the standard error and confidence intervals of the weighted counts. We estimated the total counts for heat-related ED visits across the United States.
National temperature data were also collected for this study, to allow for a better understanding of the relationship between temperature and heat-related ED visits. Temperature data were obtained from the National Oceanic and Atmospheric Administration Climate at a Glance [31]. This data set compiles daily temperatures taken from each of the 344 climate divisions of the contiguous United States, and weighs divisional values by area to construct national averages [32]. For this analysis, data were gathered on an annual basis, as well as for the months of January, March, and July. January and July were chosen to evaluate the temperature trends in the coldest and hottest months of the year. March was subsequently included due to unanticipated results of large number of ED visits generated during data analysis for this month.

2.1. Study Variables

For heat-related ED visits included in this study, the date of the visit, hospital geographic location, patient sex, age, zip code income quartile, and payer status were analyzed. In this analysis, date of visit was recorded on a monthly time scale. Hospital geographic location was provided by NEDS as Northeast, South, Midwest, and West. As further geographic groupings were not possible due to the limited information provided by NEDS, these same stratifications were utilized during this analysis. Zip code income quartile was determined by NEDS using the median household income for the zip code attached to the patient visit. Payer status was listed by NEDS as public, private, self-pay, and other.
Patient age was provided in years. For the purposes of this study, age groups were generated using findings from previous works. Though inconsistent, studies have noted an increased risk among patients 0–4 years for heat-related ED visits [21], emergency medical services calls [33], and mortality [34]. Elderly patients have also been found to be more susceptible to heat-related emergency conditions [35]. An increase in heat-related ED visits has been observed in patients over 65 years old [21], and a stepwise increased risk of mortality has been seen in patients over 65, over 75, and over 85 [36]. Further, school aged children and younger adults are seen to face an increased risk for heat-related emergency conditions due to recreational and occupational exposures [22]. To best capture these findings, the groupings of patients as 0–4 years, 5–17 years, 18–49 years, 50–64 years, 65–79 years, and ≥80 years were used for subgroup analysis.
A small number of visits included in the study contained an ICD-9-CM or ICD-10-CM specific for heat-related emergency conditions, but did not have one or more of the analyzed variables. Hospital region, patient age, sex, or payer status was missing in less than 0.25% of weighted counts included in this study. Zip code income quartile was absent from 2.79% of included weighted counts.

2.2. Statistical Analysis
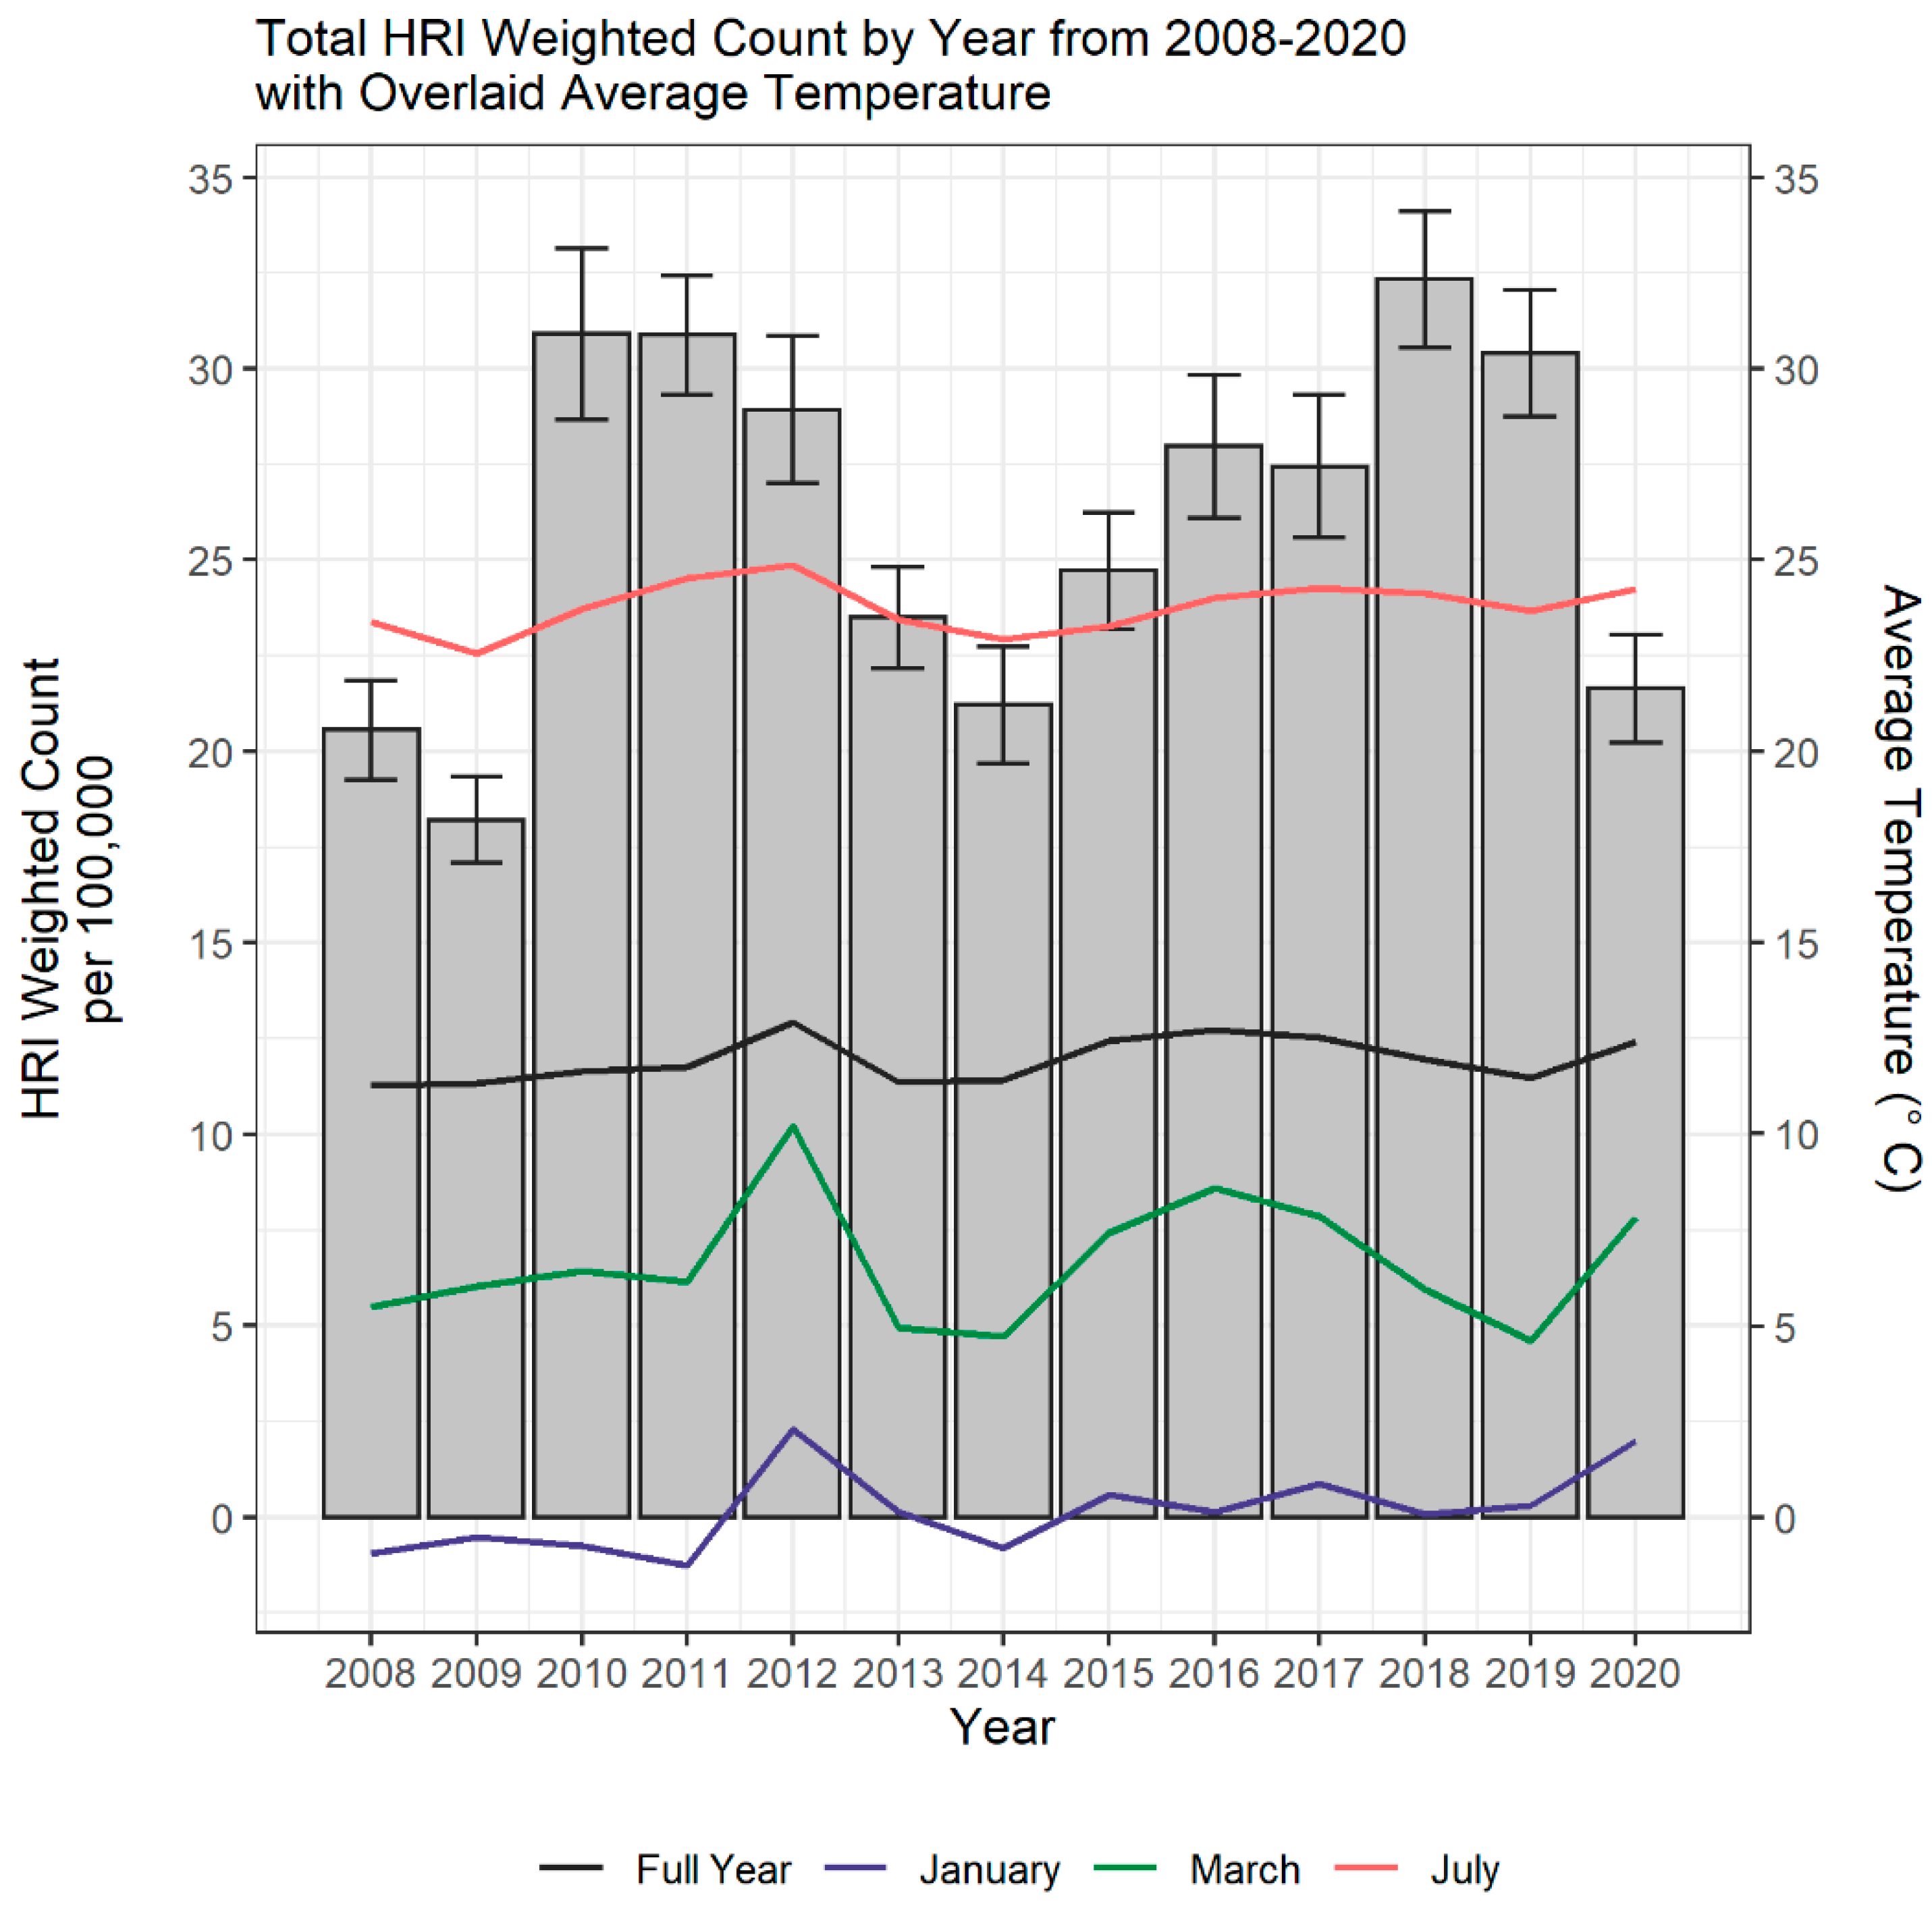
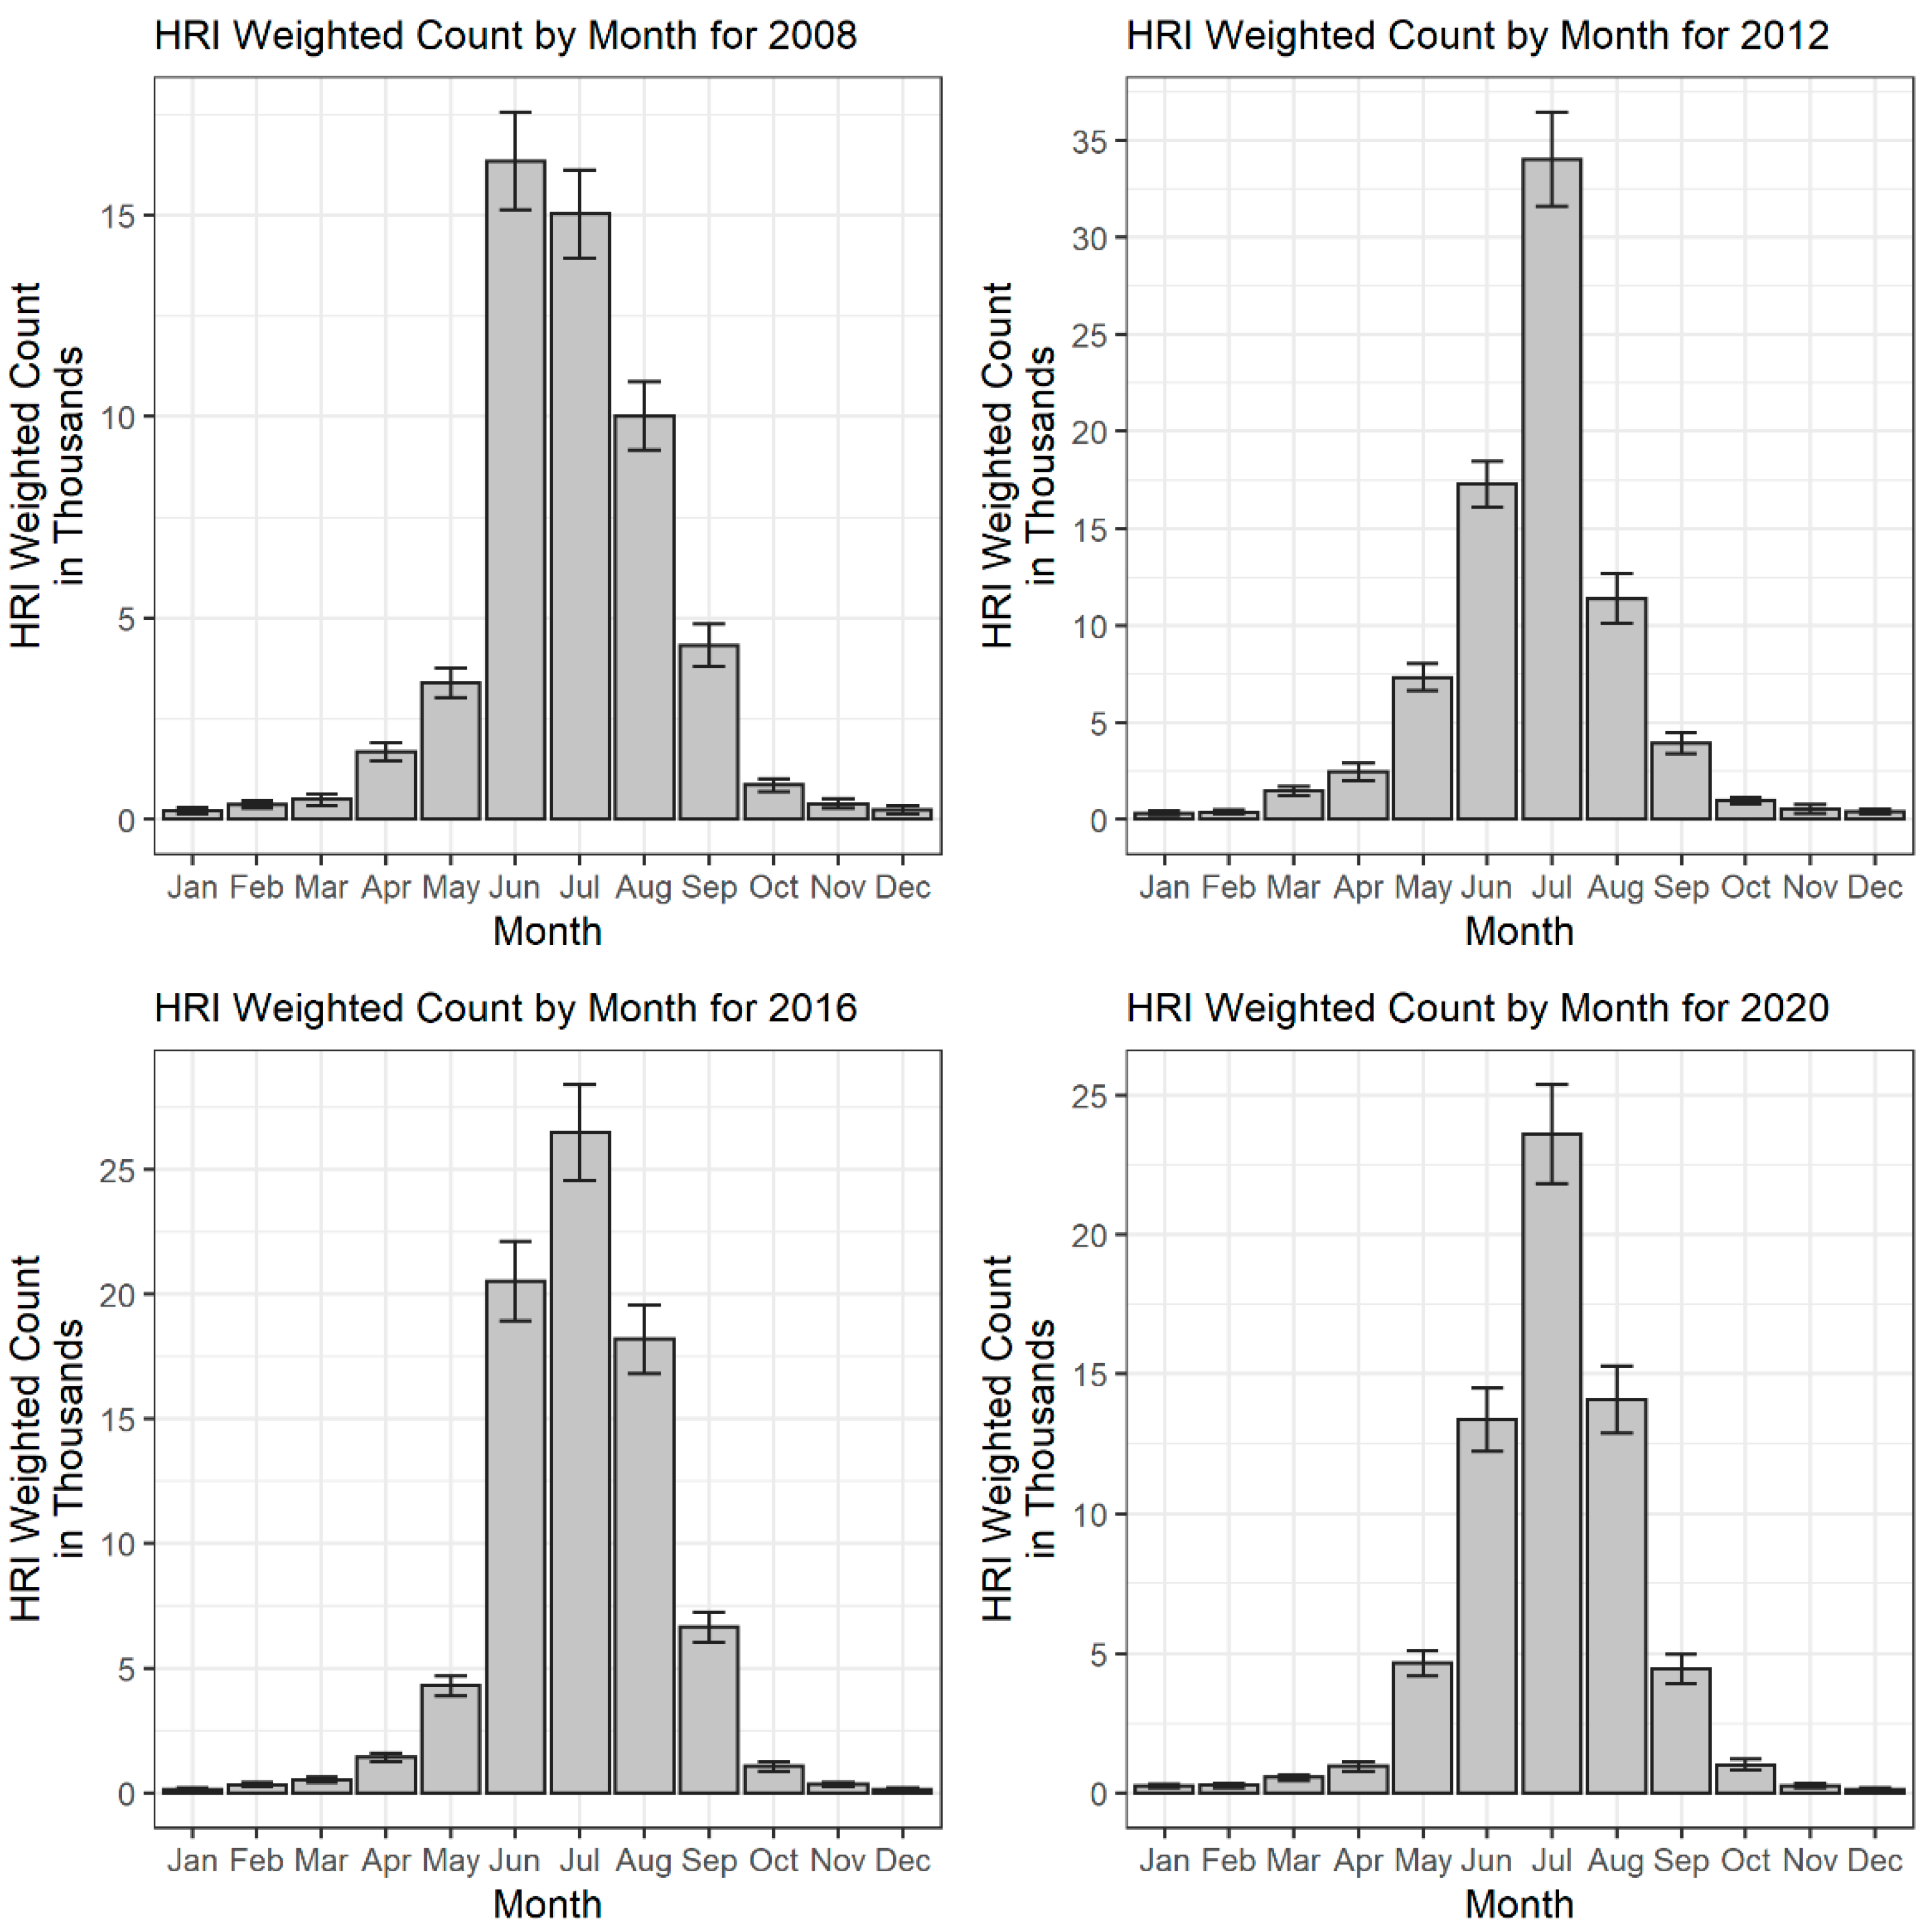
This study aimed to investigate the changes in the national incidence rate for heat-related emergency conditions from 2008–2020. Population data were utilized to generate crude incidence rates per 100,000 US population. Population data were from the Centers for Disease Control and Prevention WONDER online data set for Bridged-Race Population Estimates compiled by the National Center for Health Statistics [37]. This data set utilizes census information to estimate the total population of the United States on July 1st of each year, and was collected for the years 2008–2020 in this study. Percent change calculations were utilized to examine yearly shifts in incidence rates. Calculations were made on the general framework of [[(incidence rate 2020) − (incidence rate 2019)]/(incidence rate 2019)] × 100. Averages and 95% confidence intervals were generated for both the incidence rates and percent changes calculated across the study period.
This study also aimed to investigate the burden of heat-related ED visits, as stratified by the selected variables. Weighted counts of heat-related ED visits were used to compare the burden between subgroups. Percent change calculations were utilized to examine yearly shifts in weighted counts of heat-related ED visits, and were generated in the same method as described above. Averages and 95% confidence intervals were generated for both the weighted counts and percent changes calculated across the study period.

3. Results

Table 1 contains the national estimates for heat-related ED visits from 2008–2020, by hospital region, patient age, sex, zip code income quartile, and payer status. Over the study period, an estimated 1,078,432 ED visits for heat-related emergency medical conditions were recorded nationally.
The South (51.55%) accounted for the most heat-related ED visits over the study period, while the Northeast (10.17%) recorded the least. The Northeast (5.99%, 95% CI −21.14–33.12) and Midwest (8.52%, 95% CI −16.36–33.40) had the greatest average annual increase in heat-related ED visits from 2008–2020.
Patients aged 0–4 years (1.45%) and 5–17 years (10.84%) accounted for a lower percentage of heat-related ED visits than their population percentage (6.3% and 16.95%, respectively). Patients aged 18–49 years accounted for the most heat-related ED visits (53.54%), which represented a greater share than their population percentage (43.05%). Patients aged 50–64 years (19.08%), 65–79 years (10.53%), and ≥80 years (4.55%) all accounted for heat-related ED visit percentages similar to their population percentage (19.29%, 10.67%, and 3.74%, respectively).
Males (69.35%) accounted for the majority of heat-related ED visits during the study period.
Patients living in zip codes corresponding to the lowest income quartile had the greatest burden of heat-related ED visits (36.42%), while patients living in zip codes corresponding to the highest income quartile had the least (14.76%).
Patients utilizing public payer insurance accounted for the largest share of heat-related ED visits (36.30%).
Figure 1 displays the annual incidence rate of ED visits for heat-related emergency conditions per 100,000 US population from 2008–2020, with the corresponding average temperature across the same time period. The highest incidence rate was observed in 2018 (32.34 per 100,000), and the lowest incidence rate in 2009 (18.21 per 100,000). The average annual incidence rate for the study period was 26.06 (95% CI 23.41–28.70) per 100,000 and increased by an average of 2.85% (95% CI −11.43–17.13%) per year. The greatest increase in incidence rate (69.69%) was observed between 2009 (18.21 per 100,000) and 2010 (30.9 per 100,000). The largest decrease in incidence rate (−28.84%) was seen between 2019 (30.41 per 100,000) and 2020 (21.64 per 100,000).
The average annual temperature across the study period was 11.95 °C (95% CI 11.63–12.27), with the highest temperatures occurring in 2012 (12.93 °C), and the lowest in 2008 (11.27 °C). For the months of January, March, and July, the highest average temperatures were all observed in 2012 (2.34 °C, 10.23 °C, and 24.87 °C, respectively).
Figure 2 depicts the weighted counts for heat-related ED visits stratified by month of visit, for the years 2008, 2012, 2016, and 2020. These years were selected to observe changes in heat-related ED visits at even intervals across the study period. The warm season of May through September accounted for an average of 81.11% (95% CI 79.09–83.13%) of cases annually across the study period. July (29.79%) had the largest case volume over the study period, while December (0.31%) had the smallest. Across the study period, there was an average annual increase of 3.55% (95% CI −10.87–17.97%) per year in weighted counts of heat-related ED visits. July (15.59%, 95% CI −21.62–52.81%) and March (13.18%, 95% CI −17.84–44.20%) had the greatest average monthly increases.

4. Discussion

This study, based on weighted national medical records data, explored the trends in ED visits for heat-related emergency conditions across the United States from 2008 to 2020. An overall increase in the incidence rate for heat-related ED visits was observed during the study period, with this increase holding true both nationally and regionally. The burden of heat-related emergency conditions was seen to be greatest in the South. Most cases occurred during the month of July, with case numbers rising at the greatest rate in July and March.
While previous research on heat-related emergency conditions has largely been restricted to narrow populations of interest, the national approach of this study has allowed for a greater assessment of national trends and regional variations in heat-related ED visits across the United States. It is unsurprising that the South accounted for the greatest number of heat-related ED visits, knowing the regional temperature patterns of the United States. Looking at the demographic make-up of the South, this finding agrees with previous literature suggesting an increased risk of heat-related emergency medical conditions in more rural, non-White areas [23,38]. The observed increase in burden of heat-related ED visits is a particular cause for concern in the South, given the region’s workforce. In the coming years, Southern states are expected to face the greatest occupational risk to heat-related emergency conditions, and would most directly benefit from policies regulating workloads and shift times [39].
While the burden of heat-related ED visits was greatest in the South, the Northeast and Midwest had the greatest degree of increase in heat-related ED visits across the study period. This observed increase has several plausible explanations. On the basis of climate change, the Northeast has experienced greater warming and higher heat susceptibility as compared to the Southeast [40,41]. From a regional climate perspective, populations living in areas with significant seasonal weather variability are generally less able to adapt to higher temperatures. This is thought to be due to both physiology and the lesser availability of social adaptations, such as air conditioning [15,42]. Thus, focusing interventions on creating more social adaptations—particularly equipping public spaces with air conditioning and increasing tree cover—would be most effective in these regions [43].
When designing interventions for heat-related emergency conditions, it is important to note that the temperature threshold at which susceptibility increases is not the same across regions. Areas with lower average temperature have an increased risk for heat-related emergency conditions at lower temperature thresholds than areas of consistently warm climate [12]. While heat advisory alert systems have different temperature trigger points in different regions of the United States, past studies suggest the current models are not sufficient to both mitigate health risks and limit alarm fatigue [44]. Further research comparing heat advisory systems in different regions is warranted.
Results of this study also suggest that heat advisory trigger points should be evaluated during different months of the year. The burden pattern observed for the month of March suggest heat-related emergency medical risk increases with uncharacteristically high temperatures that are not exclusively limited to the warm season. A large peak of heat-related ED visits was observed in March 2012, which corresponds to the March 2012 heatwave [45]. Record breaking temperatures were recorded across the country, and the national monthly average temperature deviated nearly 5 °C above the twentieth century average [31]. Additional rises in heat-related ED visits were observed in March of 2015 and 2017, which similarly correspond to elevated temperatures in the western regions of the United States during these years [46,47]. As heat waves are predicted to begin earlier in the year [4], higher burdens of heat-related emergency conditions during March of subsequent years can be expected. This poses a particular concern, as extreme heat events in the early months of the year have been linked to greater health risks [48,49]. This is thought to be explained by the body’s lesser ability to adapt to higher temperatures following the winter months. Targeted interventions to limit heat-related emergency conditions enacted during the Spring could therefore be beneficial in the coming years.

Limitations

Results of this study should be interpreted in the context of limitations. First, the methods used to identify heat-related ED visits did not allow for the distinguishment between primary, subsequent, or sequalae visits (within the ICD-9-CM codes). Thus, the counts reflected in this analysis may inaccurately overestimate the true count of unique patients experiencing heat-related emergency conditions within the population. However, given the course of illness and effectiveness of treatment for heat-related emergency conditions, it is reasonable to assume that the majority of included heat-related ED visits were primary visits caused by heat-related emergency conditions. Second, temperature data examined in this study was collected as a national average. This prevented the exploration into regional temperature patterns and gave rise to the potential for elevated temperatures in certain sectors of the United States to be obscured by depressed temperatures in other areas. Specific heat waves were also unable to be accounted for with these data. Finally, the nature of the ED data obtained from the Healthcare Cost and Utilization Project’s NEDS datasets prevented further patient information from being elicited, despite previous research suggesting an association between other demographic variables and heat-related ED visits. For example, it is therefore unknown if the experienced heat-related emergency medical condition was related to occupational or recreational activities. Examination into patient socioeconomic status was limited to the provided zip code median income and payer status. Race could not be evaluated in this study, as NEDS only included race for visits occurring in 2019 and 2020.

5. Conclusions

In this cross-sectional study, a significant increase in ED visits for heat-related emergency conditions was seen across the United States in the last decade, affecting populations of all ages, in all regions, and during all seasons. As the impact of climate change is predicted to worsen in the coming years, targeted interventions are necessary to mitigate the human health impact of this growing public health crisis.

Author Contributions

R.A. and H.X. had full access to all of the data in the study and take responsibility for the integrity of the data and accuracy of the data analysis; concept and design: P.D., M.A., R.A. and H.X.; acquisition, analysis, or interpretation of data: P.D., M.A., R.A. and H.X.; drafting of the manuscript: P.D.; critical revision of the manuscript for important intellectual content: P.D., M.A., R.A. and H.X.; obtained funding: H.X.; supervision: H.X. All authors have read and agreed to the published version of the manuscript.

Funding

Efforts by Henry Xiang in this study were supported by a grant from the CDC National Center for Injury Prevention and Control (Grant #: 5R49CE003074-03; PI: Gary Smith).

Institutional Review Board Statement

Not applicable.

Informed Consent Statement

Not applicable.

Data Availability Statement

Publicly available datasets were analyzed in this study. This data can be found here: https://www.hcup-us.ahrq.gov/nedsoverview.jsp (accessed on 1 November 2022).

Conflicts of Interest

The authors declare no conflict of interest.

Appendix A

Table A1. ICD-9-CM and ICD-10-CM Codes to Identify Heat-Related ED Visits.
ICD-9-CM CodeDiagnosis
992.0Heat stroke and sunstroke
992.1Heat syncope
992.2Heat cramps
992.3Heat exhaustion, anhidrotic
992.4Heat exhaustion, due to salt depletion
992.5Heat exhaustion, unspecified
992.6Heat fatigue, transient
992.7Heat edema
992.8Other specified heat effects
992.9Unspecified effects of heat and light
E900.0Accident caused by excessive heat due to weather conditions
E900.9Accidents due to excessive heat of unspecified origin
ICD-10-CM CodeDiagnosis
T67.0Heat stroke and sunstroke
T67.1Heat syncope
T67.2Heat cramps
T67.3Heat exhaustion, anhidrotic
T67.4Heat exhaustion, due to salt depletion
T67.5Heat exhaustion, unspecified
T67.6Heat fatigue, transient
T67.7Heat edema
T67.8Other specified heat effects
T67.9Unspecified effects of heat and light
V93.2Heat exposure on board watercraft
X30Exposure to excessive natural heat
X32Exposure to sunlight

References

  1. Raftery, A.E.; Zimmer, A.; Frierson, D.M.W.; Startz, R.; Liu, P. Less than 2 °C warming by 2100 unlikely. Nat. Clim. Chang. 2017, 7, 637–641. [Google Scholar] [CrossRef] [PubMed]
  2. Kalkstein, L.S.; Greene, J.S. An evaluation of climate/mortality relationships in large U.S. cities and the possible impacts of a climate change. Environ. Health Perspect. 1997, 105, 84–93. [Google Scholar] [CrossRef] [PubMed]
  3. More Intense, More Frequent, and Longer Lasting Heat Waves in the 21st Century. Available online: https://www.science.org/doi/10.1126/science.1098704?cookieSet=1 (accessed on 23 June 2022).
  4. Habeeb, D.; Vargo, J.; Stone, B. Rising heat wave trends in large US cities. Nat. Hazards 2015, 76, 1651–1665. [Google Scholar] [CrossRef]
  5. Wilk, P.; Gunz, A.; Maltby, A.; Ravichakaravarthy, T.; Clemens, K.K.; Lavigne, É.; Lim, R.; Vicedo-Cabrera, A.M. Extreme heat and paediatric emergency department visits in Southwestern Ontario. Paediatr. Child Health 2020, 26, 305–309. [Google Scholar] [CrossRef] [PubMed]
  6. Oray, N.C.; Oray, D.; Aksay, E.; Atilla, R.; Bayram, B. The impact of a heat wave on mortality in the emergency department. Medicine 2018, 97, e13815. [Google Scholar] [CrossRef] [PubMed]
  7. Yip, F.Y.; Flanders, W.D.; Wolkin, A.; Engelthaler, D.; Humble, W.; Neri, A.; Lewis, L.; Backer, L.; Rubin, C. The impact of excess heat events in Maricopa County, Arizona: 2000–2005. Int. J. Biometeorol. 2008, 52, 765–772. [Google Scholar] [CrossRef] [PubMed]
  8. Chaseling, G.K.; Iglesies-Grau, J.; Juneau, M.; Nigam, A.; Kaiser, D.; Gagnon, D. Extreme Heat and Cardiovascular Health: What a Cardiovascular Health Professional Should Know. Can. J. Cardiol. 2021, 37, 1828–1836. [Google Scholar] [CrossRef] [PubMed]
  9. Li, B.; Sain, S.; Mearns, L.O.; Anderson, H.A.; Kovats, S.; Ebi, K.L.; Bekkedal, M.Y.; Kanarek, M.S.; Patz, J.A. The impact of extreme heat on morbidity in Milwaukee, Wisconsin. Clim. Chang. 2012, 110, 959–976. [Google Scholar] [CrossRef]
  10. Hajat, S.; O’Connor, M.; Kosatsky, T. Health effects of hot weather: From awareness of risk factors to effective health protection. Lancet 2010, 375, 856–863. [Google Scholar] [CrossRef]
  11. Baccini, M.; Kosatsky, T.; Analitis, A.; Anderson, H.R.; D’Ovidio, M.; Menne, B.; Michelozzi, P.; Biggeri, A.; PHEWE Collaborative Group. Impact of heat on mortality in 15 European cities: Attributable deaths under different weather scenarios. J. Epidemiol. Community Health 2011, 65, 64–70. [Google Scholar] [CrossRef]
  12. Ye, X.; Wolff, R.; Yu, W.; Vaneckova, P.; Pan, X.; Tong, S. Ambient Temperature and Morbidity: A Review of Epidemiological Evidence. Environ. Health Perspect. 2012, 120, 19–28. [Google Scholar] [CrossRef] [PubMed] [Green Version]
  13. Deschênes, O.; Moretti, E. Extreme Weather Events, Mortality, and Migration. Rev. Econ. Stat. 2009, 91, 659–681. [Google Scholar] [CrossRef]
  14. Kegel, F.; Luo, O.D.; Richer, S. The Impact of Extreme Heat Events on Emergency Departments in Canadian Hospitals. Wilderness Environ. Med. 2021, 32, 433–440. [Google Scholar] [CrossRef] [PubMed]
  15. Sun, S.; Weinberger, K.R.; Nori-Sarma, A.; Spangler, K.R.; Sun, Y.; Dominici, F.; Wellenius, G.A. Ambient heat and risks of emergency department visits among adults in the United States: Time stratified case crossover study. BMJ 2021, 375, e065653. [Google Scholar] [CrossRef] [PubMed]
  16. Gauer, R.; Meyers, B.K. Heat-Related Illnesses. Am. Fam. Phys. 2019, 99, 482–489. [Google Scholar] [PubMed]
  17. Fuhrmann, C.M.; Sugg, M.M.; Konrad, C.E.; Waller, A. Impact of Extreme Heat Events on Emergency Department Visits in North Carolina (2007–2011). J. Community Health 2016, 41, 146–156. [Google Scholar] [CrossRef]
  18. Basu, R. High ambient temperature and mortality: A review of epidemiologic studies from 2001 to 2008. Environ. Health 2009, 8, 40. [Google Scholar] [CrossRef] [Green Version]
  19. Basu, R.; Pearson, D.; Malig, B.; Broadwin, R.; Green, R. The effect of high ambient temperature on emergency room visits. Epidemiology 2012, 23, 813–820. [Google Scholar] [CrossRef]
  20. Mathes, R.W.; Ito, K.; Lane, K.; Matte, T.D. Real-time surveillance of heat-related morbidity: Relation to excess mortality associated with extreme heat. PLoS ONE 2017, 12, e0184364. [Google Scholar] [CrossRef] [Green Version]
  21. Knowlton, K.; Rotkin-Ellman, M.; King, G.; Margolis, H.G.; Smith, D.; Solomon, G.; Trent, R.; English, P. The 2006 California Heat Wave: Impacts on Hospitalizations and Emergency Department Visits. Environ. Health Perspect. 2009, 117, 61–67. [Google Scholar] [CrossRef]
  22. Harduar Morano, L.; Bunn, T.L.; Lackovic, M.; Lavender, A.; Dang, G.T.T.; Chalmers, J.J.; Li, Y.; Zhang, L.; Flammia, D.D. Occupational heat-related illness emergency department visits and inpatient hospitalizations in the southeast region, 2007–2011. Am. J. Ind. Med. 2015, 58, 1114–1125. [Google Scholar] [CrossRef] [PubMed]
  23. Fechter-Leggett, E.D.; Vaidyanathan, A.; Choudhary, E. Heat Stress Illness Emergency Department Visits in National Environmental Public Health Tracking States, 2005–2010. J. Community Health 2016, 41, 57–69. [Google Scholar] [CrossRef] [PubMed] [Green Version]
  24. US EPA. Climate Change Indicators: Seasonal Temperature. 2021. Available online: https://www.epa.gov/climate-indicators/climate-change-indicators-seasonal-temperature (accessed on 21 June 2022).
  25. US EPA. Seasonality and Climate Change. 2021. Available online: https://www.epa.gov/climate-indicators/seasonality-and-climate-change (accessed on 21 June 2022).
  26. Shifting Seasons. Conservation in a Changing Climate. Available online: https://climatechange.lta.org/climate-impacts/shifting-seasons/ (accessed on 21 June 2022).
  27. Harduar Morano, L.; Watkins, S.; Kintziger, K. A Comprehensive Evaluation of the Burden of Heat-Related Illness and Death within the Florida Population. Int. J. Environ. Res. Public Health 2016, 13, 551. [Google Scholar] [CrossRef] [PubMed] [Green Version]
  28. Gacutan, K. Healthcare Cost and Utilization Project—HCUP. 2019. Available online: https://www.hcup-us.ahrq.gov/db/nation/neds/NEDS_Introduction_2020.jsp (accessed on 15 June 2022).
  29. NEDS Overview. Available online: https://www.hcup-us.ahrq.gov/nedsoverview.jsp (accessed on 13 July 2022).
  30. Harduar Morano, L.; Watkins, S. Evaluation of Diagnostic Codes in Morbidity and Mortality Data Sources for Heat-Related Illness Surveillance. Public Health Rep. 2017, 132, 326–335. [Google Scholar] [CrossRef] [PubMed] [Green Version]
  31. National Centers for Environmental Information (NCEI); NOAA National Centers for Environmental Information. Climate at a Glance. Available online: https://www.ncdc.noaa.gov/cag/national/time-series (accessed on 15 June 2022).
  32. Regulations.gov. Available online: https://www.regulations.gov/document/EPA-HQ-OAR-2013-0566-0218 (accessed on 18 June 2022).
  33. Leonardi, G.; Hajat, S.; Kovats, R.; Smith, G.; Cooper, D.; Gerard, E. Syndromic surveillance use to detect the early effects of heat-waves: An analysis of NHS Direct data in England. Soz.-Präventivmedizin 2006, 51, 194–201. [Google Scholar] [CrossRef] [PubMed]
  34. Nitschke, M.; Tucker, G.R.; Hansen, A.L.; Williams, S.; Zhang, Y.; Bi, P. Impact of two recent extreme heat episodes on morbidity and mortality in Adelaide, South Australia: A case-series analysis. Environ. Health 2011, 10, 42. [Google Scholar] [CrossRef] [Green Version]
  35. Medina-Ramón, M.; Zanobetti, A.; Cavanagh, D.P.; Schwartz, J. Extreme Temperatures and Mortality: Assessing Effect Modification by Personal Characteristics and Specific Cause of Death in a Multi-City Case-Only Analysis. Environ. Health Perspect. 2006, 114, 1331–1336. [Google Scholar] [CrossRef] [Green Version]
  36. Stafoggia, M.; Forastiere, F.; Agostini, D.; Biggeri, A.; Bisanti, L.; Cadum, E.; Caranci, N.; de’Donato, F.; De Lisio, S.; De Maria, M.; et al. Vulnerability to heat-related mortality: A multicity, population-based, case-crossover analysis. Epidemiology 2006, 17, 315–323. [Google Scholar] [CrossRef]
  37. Center for Disease Control and Prevention. Bridged-Race Population Estimates 1990–2019 Request. Available online: https://wonder.cdc.gov/bridged-race-v2019.html (accessed on 14 June 2022).
  38. Zanobetti, A.; O’Neill, M.S.; Gronlund, C.J.; Schwartz, J.D. Susceptibility to Mortality in Weather Extremes: Effect Modification by Personal and Small Area Characteristics in a Multi-City Case-Only Analysis. Epidemiology 2013, 24, 809–819. [Google Scholar] [CrossRef] [Green Version]
  39. Licker, R.; Dahl, K.; Abatzoglou, J.T. Quantifying the impact of future extreme heat on the outdoor work sector in the United States. Elem. Sci. Anthr. 2022, 10, 48. [Google Scholar] [CrossRef]
  40. US EPA. Climate Change Indicators: U.S. and Global Temperature. 2016. Available online: https://www.epa.gov/climate-indicators/climate-change-indicators-us-and-global-temperature (accessed on 20 June 2022).
  41. Reid, C.E.; O’neill, M.S.; Gronlund, C.J.; Brines, S.J.; Brown, D.G.; Diez-Roux, A.V.; Schwartz, J. Mapping Community Determinants of Heat Vulnerability. Environ. Health Perspect. 2009, 117, 1730–1736. [Google Scholar] [CrossRef] [PubMed]
  42. Kalkstein, L.S. Saving lives during extreme weather in summer. BMJ 2000, 321, 650–651. [Google Scholar] [CrossRef] [PubMed]
  43. Kilbourne, E.M.; Choi, K.; Jones, T.S.; Thacker, S.B. Risk Factors for Heatstroke: A Case-Control Study. JAMA 1982, 247, 3332–3336. [Google Scholar] [CrossRef] [PubMed]
  44. Vaidyanathan, A.; Saha, S.; Vicedo-Cabrera, A.M.; Gasparrini, A.; Abdurehman, N.; Jordan, R.; Hawkins, M.; Hess, J.; Elixhauser, A. Assessment of extreme heat and hospitalizations to inform early warning systems. Proc. Natl. Acad. Sci. USA 2019, 116, 5420–5427. [Google Scholar] [CrossRef] [PubMed] [Green Version]
  45. Grumm, R.; Arnott, J.; Halblaub, J. The epic eastern North American warm episode of March 2012. J. Oper. Meteorol. 2014, 2, 36–50. [Google Scholar] [CrossRef]
  46. National Centers for Environmental Information (NCEI). March 2015 National Climate Report. Available online: https://www.ncei.noaa.gov/access/monitoring/monthly-report/national/201503 (accessed on 20 July 2022).
  47. National Centers for Environmental Information (NCEI). March 2017 National Climate Report. Available online: https://www.ncei.noaa.gov/access/monitoring/monthly-report/national/201703 (accessed on 20 July 2022).
  48. Hajat, S.; Kovats, R.S.; Atkinson, R.W.; Haines, A. Impact of hot temperatures on death in London: A time series approach. J. Epidemiol. Community Health 2002, 56, 367–372. [Google Scholar] [CrossRef] [Green Version]
  49. Kalkstein, A.J.; Kalkstein, L.S.; Vanos, J.K.; Eisenman, D.P.; Grady Dixon, P. Heat/mortality sensitivities in Los Angeles during winter: A unique phenomenon in the United States. Environ. Health 2018, 17, 45. [Google Scholar] [CrossRef]
Figure 1. Heat-related ED visits per 100,000 population, in the United States from 2008–2020. Average national temperature (in Celsius) for the United States from 2008–2020.
Ijerph 19 14781 g001
Figure 2. Heat-related ED visit weighted counts, stratified by month, in the United States for the years 2008, 2012, 2016, and 2020.
Ijerph 19 14781 g002
Table 1. Heat-related ED visit weighted counts, stratified by region, age, sex, income, and payer status in the United States from 2008–2020.
2008200920102011201220132014201520162017201820192020
Total62,51955,86895,58096,21590,78974,27667,54279,27390,36489,216105,66099,83271,298
Hospital Region
Northeast8010513511,62510,116996911,846579568798107685010,70086216057
Midwest11,488975821,56028,64627,70416,12211,21314,05417,83815,45221,04917,63414,126
South30,05928,40550,69744,49138,90231,28836,14944,47050,88946,11856,72859,60438,151
West12,96112,57111,69812,96114,21415,02114,38413,87013,53120,79617,18313,97412,964
Patient Age
0–41161106013901426161511881487144896010671324976586
5–178432755711,20311,36810,3398589745292449227951210,72190444242
18–4933,51529,28452,41652,57148,90539,97336,29944,06349,37045,75954,01552,60938,657
50–6410,585992217,43217,57216,93813,68612,71114,70717,44118,00821,45320,57714,708
65–7956485171873088828992757668536971941110,28012,96412,3939635
≥803178287544034390399532652735282939554589518442313466
Patient Sex
Female20,92517,50029,10329,75930,15923,19220,80824,16925,99227,16132,60329,77419,141
Male41,57338,28866,44466,41360,62751,07846,72455,10464,36062,05673,04170,04752,147
ZIP Code Income Quartile
1st (Lowest)18,49616,93032,45432,79030,54924,86825,06229,12732,96831,93240,05239,42027,151
2nd18,47315,58726,62025,67223,80920,62719,76820,07025,76025,16429,41225,76620,500
3rd12,67412,22619,33820,79919,91615,66612,16116,96617,45316,79119,31218,91212,442
4th10,603923714,60714,53914,24311,096852311,14111,98512,67113,99313,1748901
Payer
Public17,44816,64129,36731,65431,15926,05326,47128,50634,21536,80243,72439,53628,928
Private24,78721,39234,47233,65430,94924,12321,24827,06729,20627,81832,60030,24820,644
Self-Pay12,29211,04421,13319,81618,78216,26213,15516,09918,44616,92220,21421,72415,342
Other7723667410,28110,623973477146525740583127348896882216242
Publisher’s Note: MDPI stays neutral with regard to jurisdictional claims in published maps and institutional affiliations.

