
Healthy Eats—Evaluation of a Social Marketing Program Delivered in Primary School Settings in Queensland


Abstract
1. Introduction
2. Materials and Methods
2.1. Study Design
2.2. Population
2.3. Data Analysis
3. Results
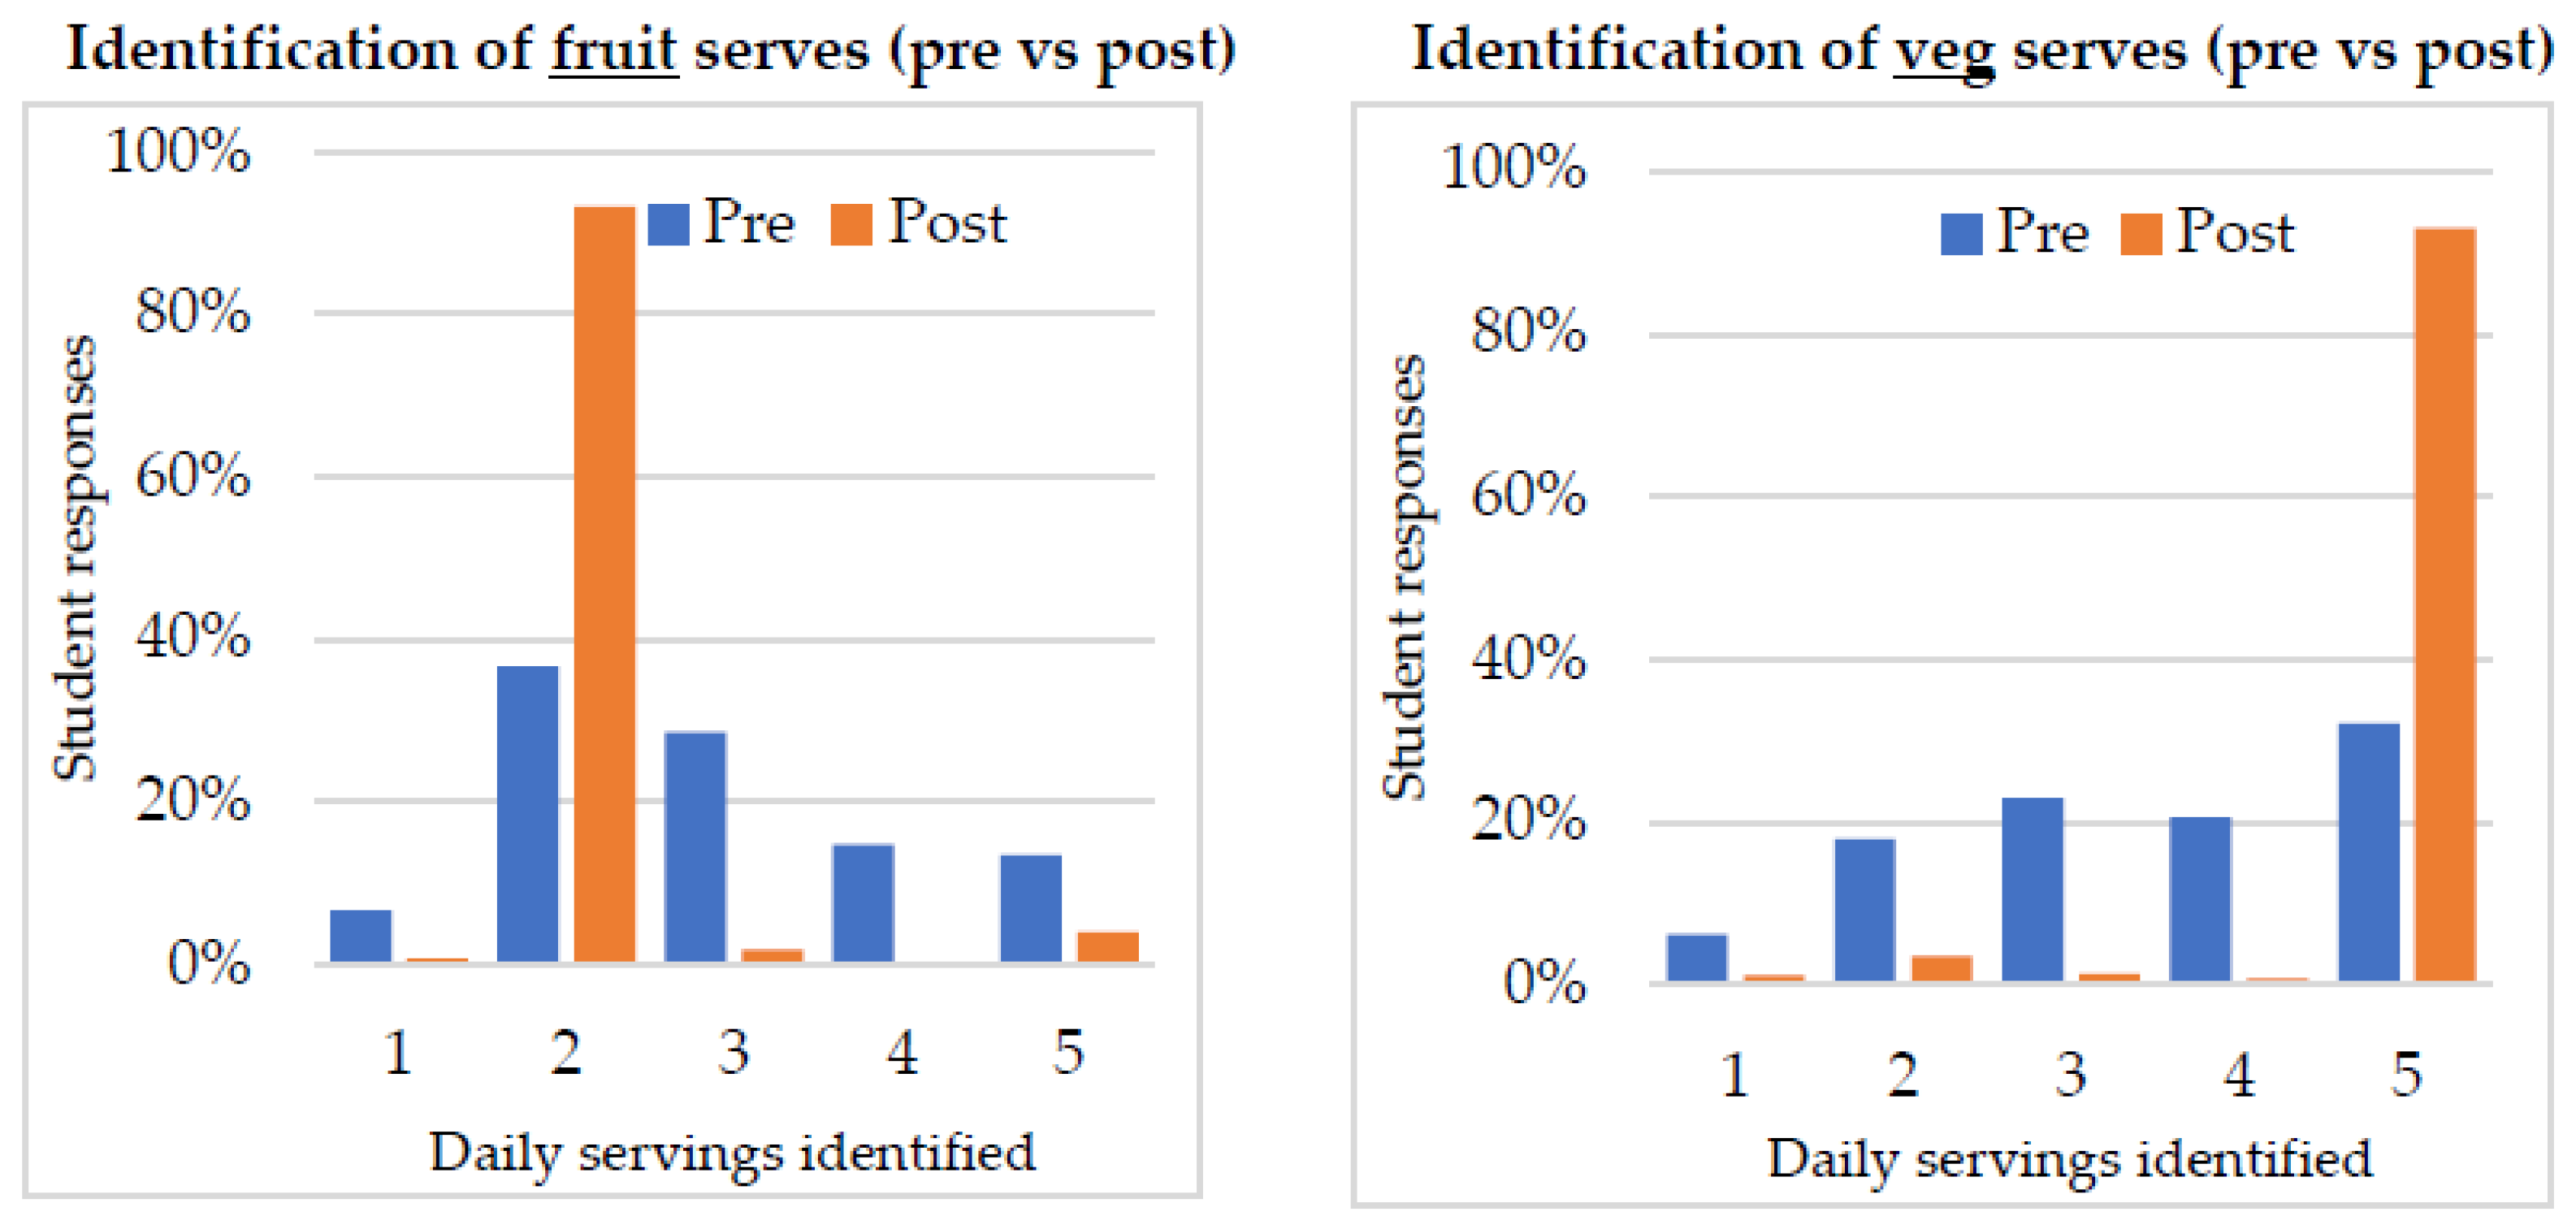
3.1. Changes in Knowledge of Recommended Daily Serves
3.2. Group Differences in Knowledge
3.3. Changes in Knowledge of Healthy Food Skills
3.4. Changes in Analysis of Passport Competition (Behaviour)
4. Discussion
5. Conclusions
Author Contributions
Funding
Institutional Review Board Statement
Informed Consent Statement
Acknowledgments
Conflicts of Interest
References
- Queensland Health. The Health of Queenslanders. Available online: https://www.health.qld.gov.au/__data/assets/pdf_file/0019/1011286/cho-report-2020-full.pdf (accessed on 6 October 2022).
- Azzopardi, P.S.; Sawyer, S.M.; Carlin, J.B.; Degenhardt, L.; Brown, N.; Brown, A.D.; Patton, G.C. Health and wellbeing of Indigenous adolescents in Australia: A systematic synthesis of population data. Lancet 2018, 391, 766–782. [Google Scholar] [CrossRef]
- Dyer, S.M.; Gomersall, J.S.; Smithers, L.G.; Davy, C.; Coleman, D.T.; Street, J.M. Prevalence and characteristics of overweight and obesity in indigenous Australian children: A systematic review. Crit. Rev. Food Sci. Nutr. 2017, 57, 1365–1376. [Google Scholar] [CrossRef]
- Department of Health. Are Queenslanders Meeting the Australian Dietary Guidelines? Daily Diets and Total Energy Intake. Available online: https://www.health.qld.gov.au/__data/assets/pdf_file/0029/731198/diets-report-qld.pdf (accessed on 1 June 2022).
- Hardy, L.L.; Mihrshahi, S.; Gale, J.; Drayton, B.A.; Bauman, A.; Mitchell, J. 30-year trends in overweight, obesity and waist-to-height ratio by socioeconomic status in Australian children, 1985 to 2015. Int. J. Obes. 2017, 41, 76–82. [Google Scholar] [CrossRef]
- Garnett, S.P.; Baur, L.A.; Jones, A.M.D.; Hardy, L.L. Trends in the Prevalence of Morbid and Severe Obesity in Australian Children Aged 7–15 Years, 1985-2012. PLoS ONE 2016, 11, e0154879. [Google Scholar] [CrossRef]
- Carins, J.; Pang, B.; Willmott, T.; Knox, K.; Storr, R.; Robertson, D.; Rundle-Thiele, S.; Pettigrew, S. Creating supportive eating places: A systematic review of food service initiatives. Health Promot. Int. 2021, 36, 1368–1392. [Google Scholar] [CrossRef]
- Frerichs, L.; Brittin, J.; Sorensen, D.; Trowbridge, M.J.; Yaroch, A.L.; Siahpush, M.; Tibbits, M.; Huang, T.T.K. Influence of school architecture and design on healthy eating: A review of the evidence. Am. J. Public Health 2015, 105, e46–e57. [Google Scholar] [CrossRef]
- Story, M.; Kaphingst, K.M.; French, S. The role of schools in obesity prevention. Future Child. 2006, 16, 109–142. [Google Scholar] [CrossRef]
- Story, M.; Nanney, M.; Schwartz, M. Schools and Obesity Prevention: Creating School Environments and Policies to Promote Healthy Eating and Physical Activity. Milbank Q. 2009, 87, 71–100. [Google Scholar] [CrossRef]
- Booth, M.; O’Brodovich, H.; Finegood, D. Addressing Childhood Obesity: The Evidence for Action; Canadian Institutes of Health Research, Institute of Nutrition, Metabolism and Diabetes: Ottawa, ON, Canada, 2004; Available online: http://www.caphc.org/documentsprograms/obesity/obesityreport.pdf (accessed on 6 October 2022).
- Stewart-Brown, S. What is the Evidence on School Health Promotion in Improving Health Orpreventing Disease and, Specifically, What is the Effectiveness of the Health Promoting Schools Approach? World Health Organization: Geneva, Switzerland, 2006. [Google Scholar]
- Chote, B.; McKelvie-Sebileau, P.; Swinburn, B.; Tipene-Leach, D.; D’Souza, E. Culture of Healthy Eating and Food Environments, Policies, and Practices in Regional New Zealand Schools. Int. J. Environ. Res. Public Health 2022, 19, 6729. [Google Scholar] [CrossRef]
- Jamelske, E.; Bica, L.A.; McCarty, D.J.; Meinen, A. Preliminary findings from an evaluation of the USDA Fresh Fruit and Vegetable Program in Wisconsin schools. Wis. Med. J. 2008, 107, 225. [Google Scholar]
- Prelip, M.; Kinsler, J.; Thai, C.L.; Erausquin, J.T.; Slusser, W. Evaluation of a School-based Multicomponent Nutrition Education Program to Improve Young Children’s Fruit and Vegetable Consumption. J. Nutr. Educ. Behav. 2012, 44, 310–318. [Google Scholar] [CrossRef]
- Hawkes, C.; Smith, T.G.; Jewell, J.; Wardle, J.; Hammond, R.A.; Friel, S.; Thow, A.M.; Kain, J. Smart food policies for obesity prevention. Lancet 2015, 385, 2410–2421. [Google Scholar] [CrossRef]
- Townsend, N.; Murphy, S.; Moore, L. The more schools do to promote healthy eating, the healthier the dietary choices by students. J. Epidemiol Community Health 2011, 65, 889–895. [Google Scholar] [CrossRef]
- Townsend, N.; Foster, C. Developing and applying a socio-ecological model to the promotion of healthy eating in the school. Public Health Nutr. 2013, 16, 1101–1108. [Google Scholar] [CrossRef]
- Moore, L.; de Silva-Sanigorski, A.; Moore, S.N. A socio-ecological perspective on behavioural interventions to influence food choice in schools: Alternative, complementary or synergistic? Public Health Nutr. 2013, 16, 1000–1005. [Google Scholar] [CrossRef]
- Moore, S.N.; Murphy, S.; Moore, L. Health improvement, nutrition-related behaviour and the role of school meals: The usefulness of a socio-ecological perspective to inform policy design, implementation and evaluation. Crit. Public Health 2011, 21, 441–454. [Google Scholar] [CrossRef]
- Dooris, M. Holistic and sustainable health improvement: The contribution of the settings-based approach to health promotion. Perspect. Public Health 2009, 129, 29–36. [Google Scholar] [CrossRef]
- Lang, T.; Rayner, G. Ecological public health: The 21st century’s big idea? An essay by Tim Lang and Geof Rayner. BMJ 2012, 345, e5466. [Google Scholar] [CrossRef]
- Story, M.; Kaphingst, K.M.; Robinson-O’Brien, R.; Glanz, K. Creating healthy food and eating environments: Policy and environmental approaches. Annu. Rev. Public Health 2008, 29, 253–272. [Google Scholar] [CrossRef]
- Drummond, C. Using nutrition education and cooking classes in primary schools to encourage healthy eating. J. Stud. Wellbeing 2010, 4, 43–54. [Google Scholar] [CrossRef]
- Lytle, L.A. Nutrition Education for School-Aged Children: A Review of Research. 1994. Available online: https://files.eric.ed.gov/fulltext/ED428061.pdf (accessed on 6 October 2022).
- Pérez-Rodrigo, C.; Aranceta, J. School-based nutrition education: Lessons learned and new perspectives. Public Health Nutr. 2001, 4, 131–139. [Google Scholar] [CrossRef]
- Anderson, A.; Porteous, L.; Foster, E.; Higgins, C.; Stead, M.; Hetherington, M.; Ha, M.; Adamson, A. The impact of a school-based nutrition education intervention on dietary intake and cognitive and attitudinal variables relating to fruits and vegetables. Public Health Nutr. 2005, 8, 650–656. [Google Scholar] [CrossRef]
- Graham, H.; Zidenberg-Cherr, S. California teachers perceive school gardens as an effective nutritional tool to promote healthful eating habits. J. Am. Diet. Assoc. 2005, 105, 1797–1800. [Google Scholar] [CrossRef]
- Day, M.E.; Strange, K.S.; McKay, H.A.; Naylor, P.-J. Action schools! BC—Healthy eating. Can. J. Public Health 2008, 99, 328–331. [Google Scholar] [CrossRef]
- Hesketh, K.; Waters, E.; Green, J.; Salmon, L.; Williams, J. Healthy eating, activity and obesity prevention: A qualitative study of parent and child perceptions in Australia. Health Promot. Int. 2005, 20, 19–26. [Google Scholar] [CrossRef]
- Koui, E.; Jago, R. Associations between self-reported fruit and vegetable consumption and home availability of fruit and vegetables among Greek primary-school children. Public Health Nutr. 2008, 11, 1142–1148. [Google Scholar] [CrossRef]
- Storfer-Isser, A.; Musher-Eizenman, D. Measuring parent time scarcity and fatigue as barriers to meal planning and preparation: Quantitative scale development. J. Nutr. Educ. Behav. 2013, 45, 176–182. [Google Scholar] [CrossRef]
- Larson, N.I.; Perry, C.L.; Story, M.; Neumark-Sztainer, D. Food preparation by young adults is associated with better diet quality. J. Am. Diet. Assoc. 2006, 106, 2001–2007. [Google Scholar] [CrossRef]
- Meehan, M.; Yeh, M.-C.; Spark, A. Impact of exposure to local food sources and food preparation skills on nutritional attitudes and food choices among urban minority youth. J. Hunger Environ. Nutr. 2008, 3, 456–471. [Google Scholar] [CrossRef]
- Dresler-Hawke, E.; Whitehead, D.; Coad, J. What are New Zealand children eating at school? A content analysis ofconsumed versus unconsumed’food groups in a lunch-box survey. Health Educ. J. 2009, 68, 3–13. [Google Scholar] [CrossRef]
- Dani, J.; Burrill, C.; Demmig-Adams, B. The remarkable role of nutrition in learning and behaviour. Nutr. Food Sci. 2005, 35, 258–263. [Google Scholar] [CrossRef]
- Anibaldi, R.; Rundle-Thiele, S.; Crespo-Casado, F.; Carins, J. Insights into children’s lunchboxes: Understanding the issues impacting the selection of contents by Australian parents. In Food Production and Eating Habits from around the World. A Multidisciplinary Approach; Entrena-Duran, F., Ed.; Nova Science Publishers, Inc.: New York, NY, USA, 2015; p. 193. [Google Scholar]
- Bathgate, K.; Begley, A. ‘It’s very hard to find what to put in the kid’s lunch’: What Perth parents think about food for school lunch boxes. Nutr. Diet. 2011, 68, 21–26. [Google Scholar] [CrossRef]
- Duncan, M.J.; Eyre, E.; Bryant, E.; Clarke, N.; Birch, S.; Staples, V.; Sheffield, D. The impact of a school-based gardening intervention on intentions and behaviour related to fruit and vegetable consumption in children. J. Health Psychol. 2015, 20, 765–773. [Google Scholar] [CrossRef]
- Evans, A.; Ranjit, N.; Rutledge, R.; Medina, J.; Jennings, R.; Smiley, A.; Stigler, M.; Hoelscher, D. Exposure to multiple components of a garden-based intervention for middle school students increases fruit and vegetable consumption. Health Promot. Pract. 2012, 13, 608–616. [Google Scholar] [CrossRef]
- Heim, S.; Bauer, K.W.; Stang, J.; Ireland, M. Can a community-based intervention improve the home food environment? Parental perspectives of the influence of the delicious and nutritious garden. J. Nutr. Educ. Behav. 2011, 43, 130–134. [Google Scholar] [CrossRef]
- Heim, S.; Stang, J.; Ireland, M. A garden pilot project enhances fruit and vegetable consumption among children. J. Am. Diet. Assoc. 2009, 109, 1220–1226. [Google Scholar] [CrossRef]
- Jaenke, R.L.; Collins, C.E.; Morgan, P.J.; Lubans, D.R.; Saunders, K.L.; Warren, J.M. The impact of a school garden and cooking program on boys’ and girls’ fruit and vegetable preferences, taste rating, and intake. Health Educ. Behav. 2012, 39, 131–141. [Google Scholar] [CrossRef]
- Ratcliffe, M.M.; Merrigan, K.A.; Rogers, B.L.; Goldberg, J.P. The effects of school garden experiences on middle school-aged students’ knowledge, attitudes, and behaviors associated with vegetable consumption. Health Promot. Pract. 2011, 12, 36–43. [Google Scholar] [CrossRef]
- Ratcliffe, M.M. Garden-Based Education in School Settings: The Effects on Children’s Vegetable Consumption, Vegetable Preferences and Ecoliteracy; Tufts University: Medford, MA, USA, 2007. [Google Scholar]
- Ma, A.W.W.; Wong, M.C. Secondary school tuck shop options and student choices: A cross-sectional survey. Int. J. Consum. Stud. 2018, 42, 93–100. [Google Scholar] [CrossRef]
- Hawkes, A.P.; Weinberg, S.L.; Janusz, R.; Demont-Heinrich, C.; Vogt, R.L. An innovative method of measuring changes in access to healthful foods in school lunch programs: Findings from a pilot evaluation. PLoS ONE 2016, 11, e0146875. [Google Scholar] [CrossRef]
- Kim, K.; Hong, S.A.; Yun, S.H.; Ryou, H.J.; Lee, S.S.; Kim, M.K. The effect of a healthy school tuck shop program on the access of students to healthy foods. Nutr. Res. Pract. 2012, 6, 138–145. [Google Scholar] [CrossRef]
- Social Marketing @ Griffith. Evaluation of Healthy Eats. 2021. Available online: https://lifeeducationqld.org.au/wp-content/uploads/Life-Ed-Qld-Healthy-Eats-Evaluation-Report-March-2022.pdf (accessed on 6 October 2022).
- Arbuckle, J. Amos 18 Users Guide, 2009; SPSS Inc.: New York, NY, USA, 2009; pp. 971–978. [Google Scholar]
- Peugh, J.L.; Enders, C.K. Missing data in educational research: A review of reporting practices and suggestions for improvement. Rev. Educ. Res. 2004, 74, 525–556. [Google Scholar] [CrossRef]
- Fayet-Moore, F.; McConnell, A.; Cassettari, T.; Tuck, K.; Petocz, P.; Kim, J. Vegetable intake in Australian children and adolescents: The importance of consumption frequency, eating occasion and its association with dietary and sociodemographic factors. Public Health Nutr. 2020, 23, 474–487. [Google Scholar] [CrossRef]
- Australian Bureau of Statistics. National Health Survey: State and Territory Findings. Available online: https://www.abs.gov.au/statistics/health/health-conditions-and-risks/national-health-survey-state-and-territory-findings/latest-release (accessed on 11 January 2022).
- Beasley, T.M.; Schumacker, R.E. Multiple regression approach to analyzing contingency tables: Post hoc and planned comparison procedures. J. Exp. Educ. 1995, 64, 79–93. [Google Scholar] [CrossRef]
- National Health and Medical Research Council. Australian Dietary Guidelines Summary. Available online: https://www.eatforhealth.gov.au/ (accessed on 6 October 2022).
- Poelman, A.A.M.; Cochet-Broch, M.; Cox, D.N.; Vogrig, D. Vegetable Education Program Positively Affects Factors Associated with Vegetable Consumption Among Australian Primary (Elementary) Schoolchildren. J. Nutr. Educ. Behav. 2019, 51, 492–497.e1. [Google Scholar] [CrossRef]
- Long, J.D.; Stevens, K.R. Using technology to promote self-efficacy for healthy eating in adolescents. J. Nurs. Scholarsh. 2004, 36, 134–139. [Google Scholar] [CrossRef]
- Raby Powers, A.; Struempler, B.J.; Guarino, A.; Parmer, S.M. Effects of a nutrition education program on the dietary behavior and nutrition knowledge of second-grade and third-grade students. J. Sch. Health 2005, 75, 129–133. [Google Scholar] [CrossRef]
- Casazza, K.; Ciccazzo, M. The method of delivery of nutrition and physical activity information may play a role in eliciting behavior changes in adolescents. Eat. Behav. 2007, 8, 73–82. [Google Scholar] [CrossRef]
- Räihä, T.; Tossavainen, K.; Turunen, H.; Enkenberg, J.; Kiviniemi, V. Effects of nutrition health intervention on pupils’ nutrition knowledge and eating habits. Scand. J. Educ. Res. 2012, 56, 277–294. [Google Scholar] [CrossRef]
- Chung, L.M.Y.; Fong, S.S.M. Role of behavioural feedback in nutrition education for enhancing nutrition knowledge and improving nutritional behaviour among adolescents. Asia Pac. J. Clin. Nutr. 2018, 27, 466–472. [Google Scholar]
- Rebuli, M.A.; Williams, G.; James-Martin, G.; Hendrie, G.A. Food group intake at self-reported eating occasions across the day: Secondary analysis of the Australian National Nutrition Survey 2011–2012. Public Health Nutr. 2020, 23, 3067–3080. [Google Scholar] [CrossRef] [PubMed]
- VegKIT. Evidence Brief: Boosting Children’s Vegetable Intake. Available online: https://www.vegkit.com.au/globalassets/vegkit/documents/community--public-health/evidence-brief-boosting-childrens-vegetable-intake.pdf (accessed on 4 July 2022).
- Vettori, V.; Lorini, C.; Milani, C.; Bonaccorsi, G. Towards the implementation of a conceptual framework of food and nutrition literacy: Providing healthy eating for the population. Int. J. Environ. Res. Public Health 2019, 16, 5041. [Google Scholar] [CrossRef] [PubMed]
- Worsley, A. Nutrition knowledge and food consumption: Can nutrition knowledge change food behaviour? Asia Pac. J. Clin. Nutr. 2002, 11, S579–S585. [Google Scholar] [CrossRef] [PubMed]
- Dickson-Spillmann, M.; Siegrist, M. Consumers’ knowledge of healthy diets and its correlation with dietary behaviour. J. Hum. Nutr. Diet. 2011, 24, 54–60. [Google Scholar] [CrossRef] [PubMed]
- Hill, C.R.; Blekkenhorst, L.C.; Radavelli-Bagatini, S.; Sim, M.; Woodman, R.J.; Devine, A.; Shaw, J.E.; Hodgson, J.M.; Daly, R.M.; Lewis, J.R. Fruit and vegetable knowledge and intake within an Australian population: The AusDiab study. Nutrients 2020, 12, 3628. [Google Scholar] [CrossRef]
- Worsley, A. Children’s healthful eating: From research to practice. Food Nutr. Bull. 2005, 26, S135–S143. [Google Scholar] [CrossRef]
- Draxten, M.; Fulkerson, J.A.; Friend, S.; Flattum, C.F.; Schow, R. Parental role modeling of fruits and vegetables at meals and snacks is associated with children’s adequate consumption. Appetite 2014, 78, 1–7. [Google Scholar] [CrossRef]
- Wyse, R.; Wolfenden, L.; Bisquera, A. Characteristics of the home food environment that mediate immediate and sustained increases in child fruit and vegetable consumption: Mediation analysis from the Healthy Habits cluster randomised controlled trial. Int. J. Behav. Nutr. Phys. Act. 2015, 12, 118. [Google Scholar] [CrossRef]
- Lynch, C.; Kristjansdottir, A.G.; Te Velde, S.J.; Lien, N.; Roos, E.; Thorsdottir, I.; Krawinkel, M.; de Almeida, M.D.V.; Papadaki, A.; Ribic, C.H. Fruit and vegetable consumption in a sample of 11-year-old children in ten European countries–the PRO GREENS cross-sectional survey. Public Health Nutr. 2014, 17, 2436–2444. [Google Scholar] [CrossRef]
- Hall, E.; Chai, W.; Albrecht, J.A. Relationships between nutrition-related knowledge, self-efficacy, and behavior for fifth grade students attending Title I and non-Title I schools. Appetite 2016, 96, 245–253. [Google Scholar] [CrossRef]
- Papamichael, M.M.; Karatzi, K.; Mavrogianni, C.; Cardon, G.; De Vylder, F.; Iotova, V.; Usheva, N.; Tankova, T.; González-Gil, E.M.; Kivelä, J. Socioeconomic vulnerabilities and food intake in European children: The Feel4Diabetes Study. Nutrition 2022, 103, 111744. [Google Scholar] [CrossRef] [PubMed]
- Alsharairi, N.A. Current government actions and potential policy options for reducing obesity in Queensland schools. Children 2018, 5, 18. [Google Scholar] [CrossRef] [PubMed]
- Mihrshahi, S.; Gow, M.L.; Baur, L.A. Contemporary approaches to the prevention and management of paediatric obesity: An Australian focus. Med. J. Aust. 2018, 209, 267–274. [Google Scholar] [CrossRef] [PubMed]
- Cooke, L.; Wardle, J.; Gibson, E.; Sapochnik, M.; Sheiham, A.; Lawson, M. Demographic, familial and trait predictors of fruit and vegetable consumption by pre-school children. Public Health Nutr. 2004, 7, 295–302. [Google Scholar] [CrossRef]
- Skinner, J.D.; Carruth, B.R.; Bounds, W.; Ziegler, P.; Reidy, K. Do food-related experiences in the first 2 years of life predict dietary variety in school-aged children? J. Nutr. Educ. Behav. 2002, 34, 310–315. [Google Scholar] [CrossRef]
- Birch, L.L. Development of food preferences. Annu. Rev. Nutr. 1999, 19, 41. [Google Scholar] [CrossRef]
- Group, E.M.C.C.S. Dietary Patterns Track from Infancy to Preschool Age: Cross-Sectional and Longitudinal Perspectives. J. Nutr. 2015, 145, 775–782. [Google Scholar] [CrossRef]
- Rundle-Thiele, S.; David, P.; Willmott, T.; Pang, B.; Eagle, L.; Hay, R. Delivering behavioural change: A theoretical research agenda. J. Mark. Manag. 2019, 35, 160–181. [Google Scholar] [CrossRef]
- David, P.; Rundle-Thiele, S. Social marketing theory measurement precision: A theory of planned behaviour illustration. J. Soc. Mark. 2018, 8, 182–201. [Google Scholar] [CrossRef]
- David, P.; Rundle-Thiele, S. Rethinking behaviour change: A dynamic approach in social marketing. J. Soc. Mark. 2019, 9, 258–268. [Google Scholar] [CrossRef]
- Centeio, E.E.; McCaughtry, N.; Moore, E.W.G.; Kulik, N.; Garn, A.; Martin, J.; Shen, B.; Somers, C.L.; Fahlman, M. Building healthy communities: A comprehensive school health program to prevent obesity in elementary schools. Prev. Med. 2018, 111, 210–215. [Google Scholar] [CrossRef] [PubMed]
- Bandura, A. Human agency in social cognitive theory. Am. Psychol. 1989, 44, 1175. [Google Scholar] [CrossRef] [PubMed]
- Rolling, T.E.; Hong, M.Y. The effect of social cognitive theory-based interventions on dietary behavior within children. J. Nutr. Health Food Sci. 2016, 4, 1–9. [Google Scholar]


| Characteristic | Category | Pre | Post | χ2 | ||
|---|---|---|---|---|---|---|
| n | n | |||||
| Gender | Male | 422 | 44.8% | 437 | 46.5% | χ2 (2) = 1.037; p = 0.595 |
| Female | 467 | 49.5% | 448 | 47.7% | ||
| Prefer not to say | 44 | 4.7% | 50 | 5.3% | ||
| Missing | 10 | 1.1% | 4 | 0.4% | ||
| Total | 943 | 100.0% | 939 | 100.0% | ||
| Age | 8 years-old | 3 | 0.3% | 3 | 0.3% | χ2 (5) = 0.031; p = 1.000 |
| 9 years-old | 118 | 12.5% | 116 | 12.4% | ||
| 10 years-old | 599 | 63.5% | 598 | 63.7% | ||
| 11 years-old | 196 | 20.8% | 194 | 20.7% | ||
| 12 years-old | 23 | 2.4% | 22 | 2.3% | ||
| 13 years-old | 1 | 0.1% | 1 | 0.1% | ||
| Missing | 3 | 0.3% | 5 | 0.5% | ||
| Total | 943 | 100.0% | 939 | 100.0% | ||
| Ethnicity | Non-indigenous | 732 | 77.6% | 714 | 76.0% | χ2 (3) = 32.039; p < 0.001 * |
| Aboriginal | 65 | 6.9% | 118 | 12.6% | ||
| Torres Strait Islander | 84 | 8.9% | 39 | 4.2% | ||
| both Aboriginal and Torres Strait Islander | 56 | 5.9% | 58 | 6.2% | ||
| Missing | 6 | 0.6% | 10 | 1.1% | ||
| Total | 943 | 100.0% | 939 | 100.0% | ||
| Program participation | First timer | 386 | 40.9% | 387 | 41.2% | χ2 (1) = 0.015; p = 0.901 |
| Previously attended | 557 | 59.1% | 552 | 58.8% | ||
| Missing | 0 | 0% | 0 | 0% | ||
| Total | 943 | 100% | 939 | 100% | ||
| Pathway | Core | 405 | 42.9% | 399 | 42.5% | χ2 (2) = 0.043; p = 0.979 |
| Halfway/in progress | 288 | 30.5% | 290 | 30.9% | ||
| Full/completed | 250 | 26.5% | 250 | 26.6% | ||
| Missing | 0 | 0% | 0 | 0% | ||
| Total | 943 | 100% | 939 | 100% | ||
| Tuckshop | No | 77 | 8.2 | 78 | 8.3% | χ2 (1) = 0.012; p = 0.911 |
| Yes | 866 | 91.8 | 861 | 91.7% | ||
| Missing | 0 | 0% | 0 | 0% | ||
| Total | 943 | 100% | 939 | 100% | ||
| Vegetable garden | No | 248 | 26.3% | 249 | 26.5% | χ2 (1) = 0.012; p = 0.914 |
| Yes | 695 | 73.7% | 690 | 73.5% | ||
| Missing | 0 | 0% | 0 | 0% | ||
| Total | 943 | 100% | 939 | 100% | ||
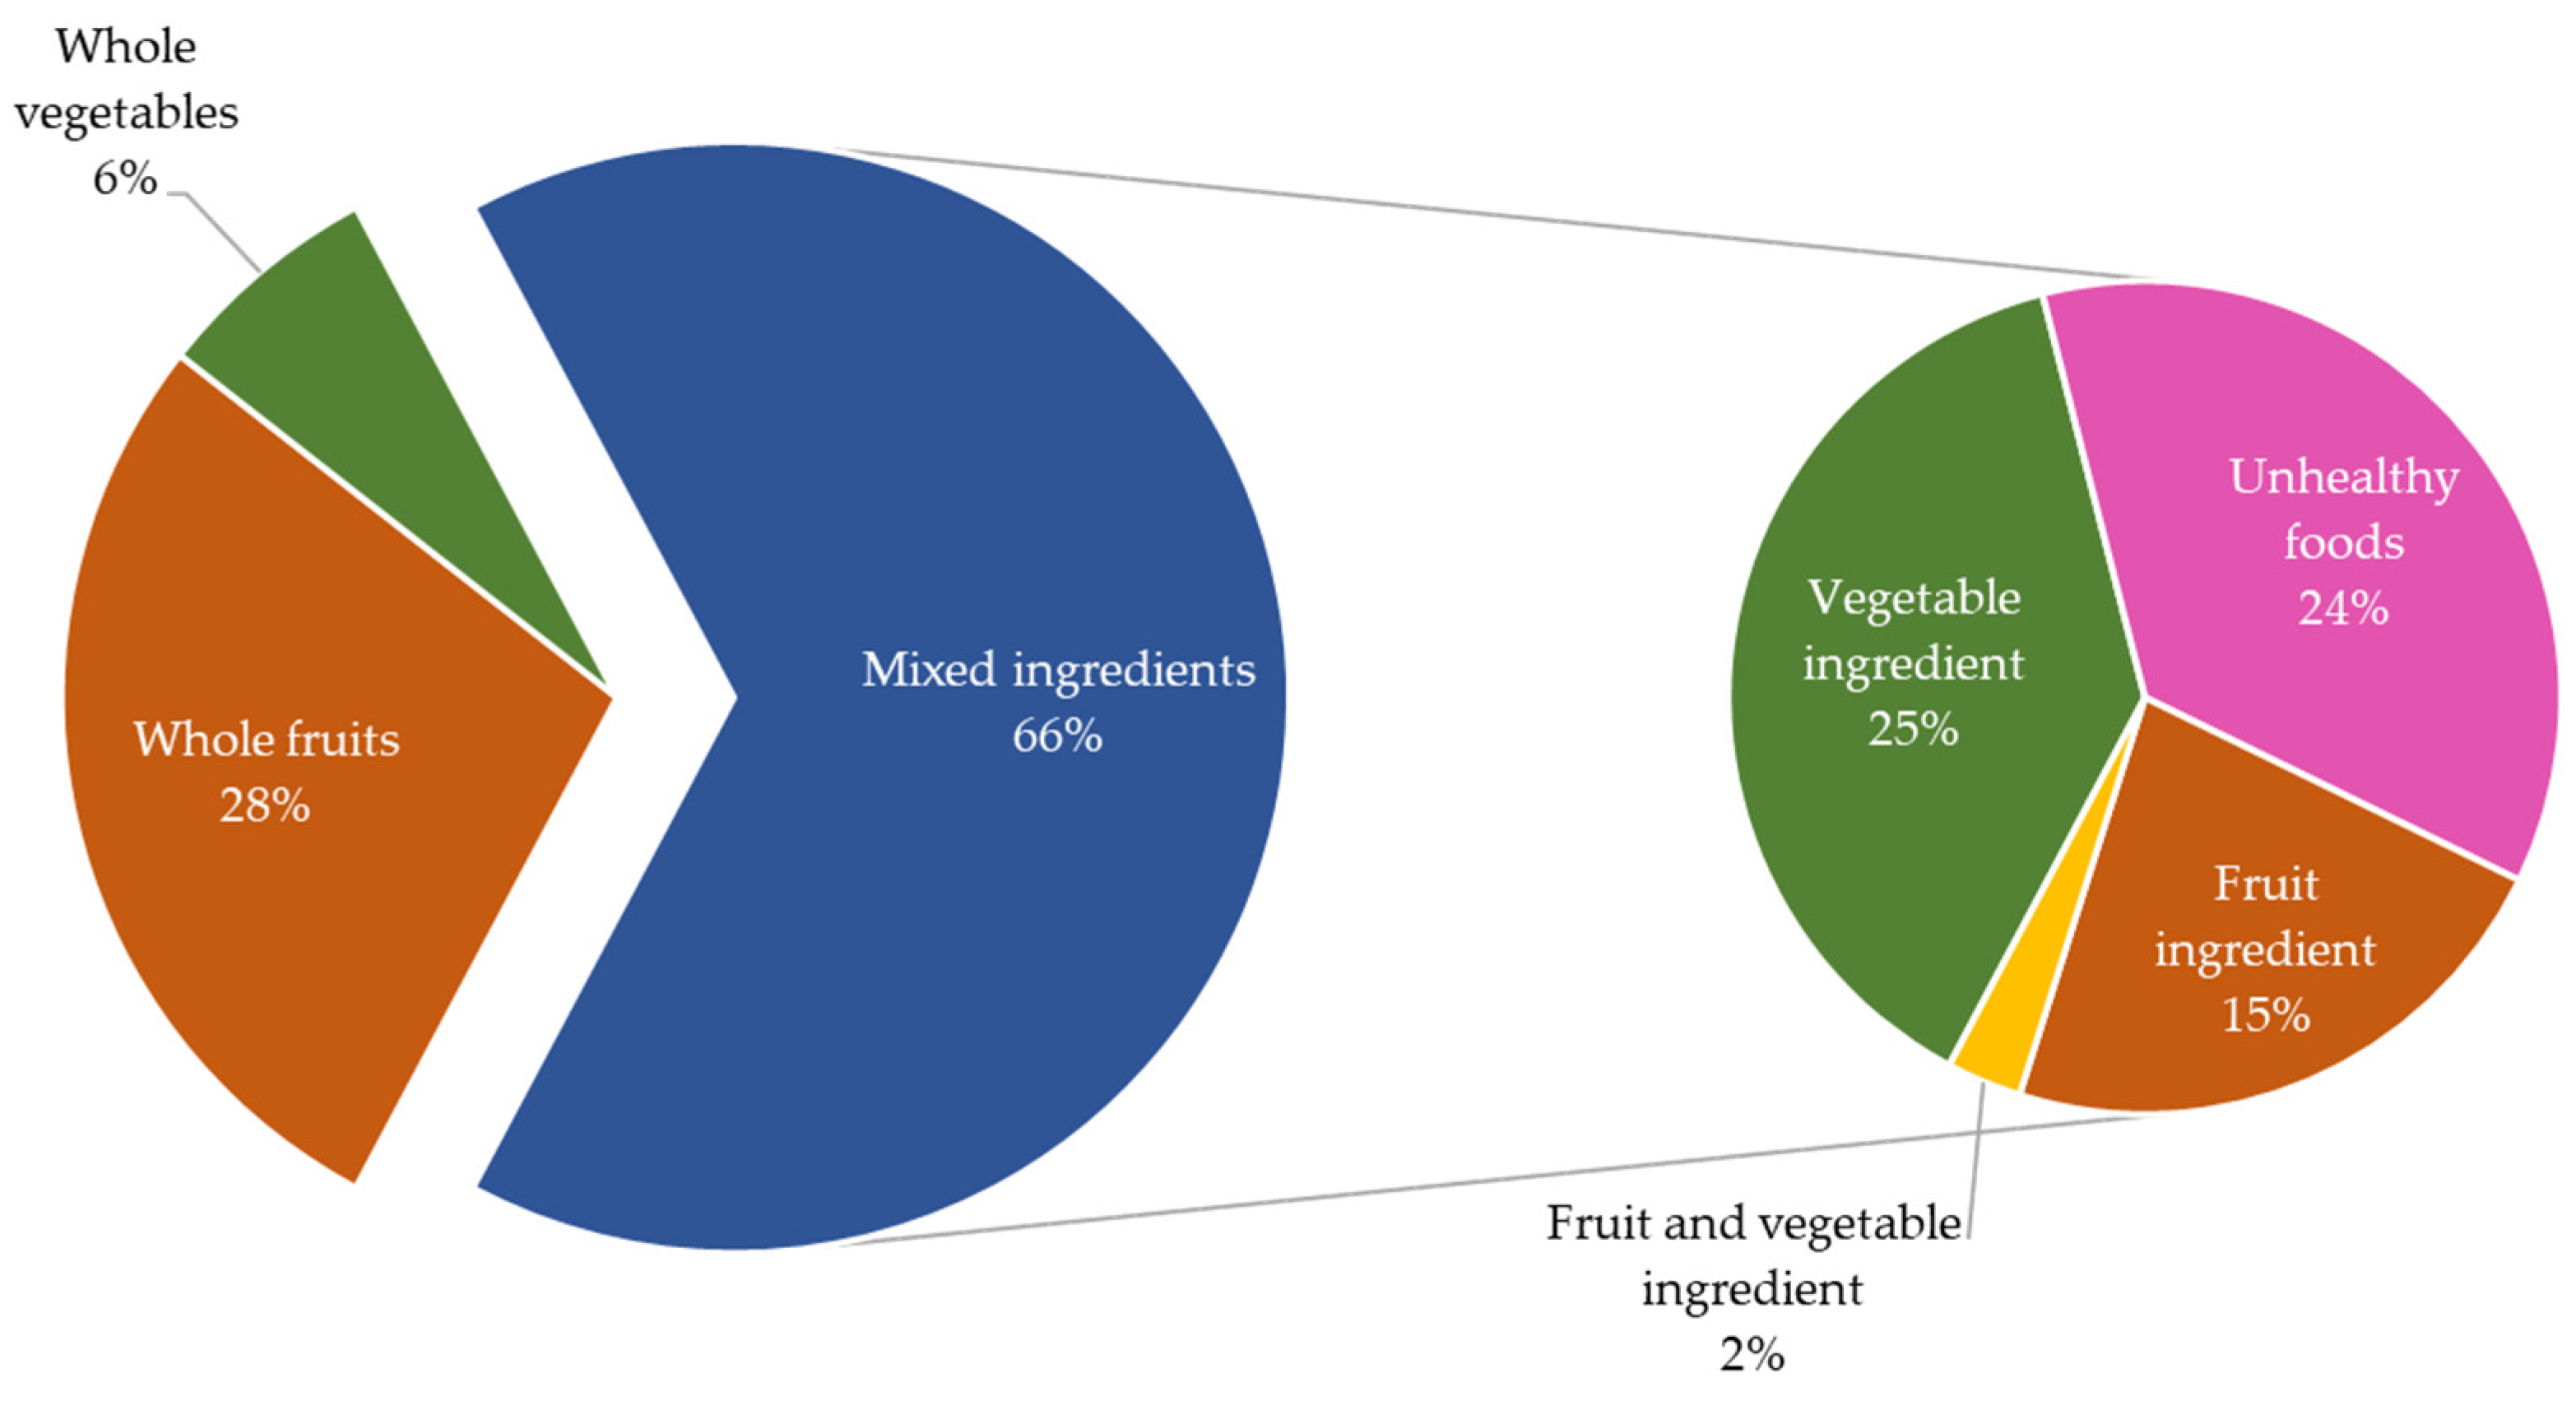
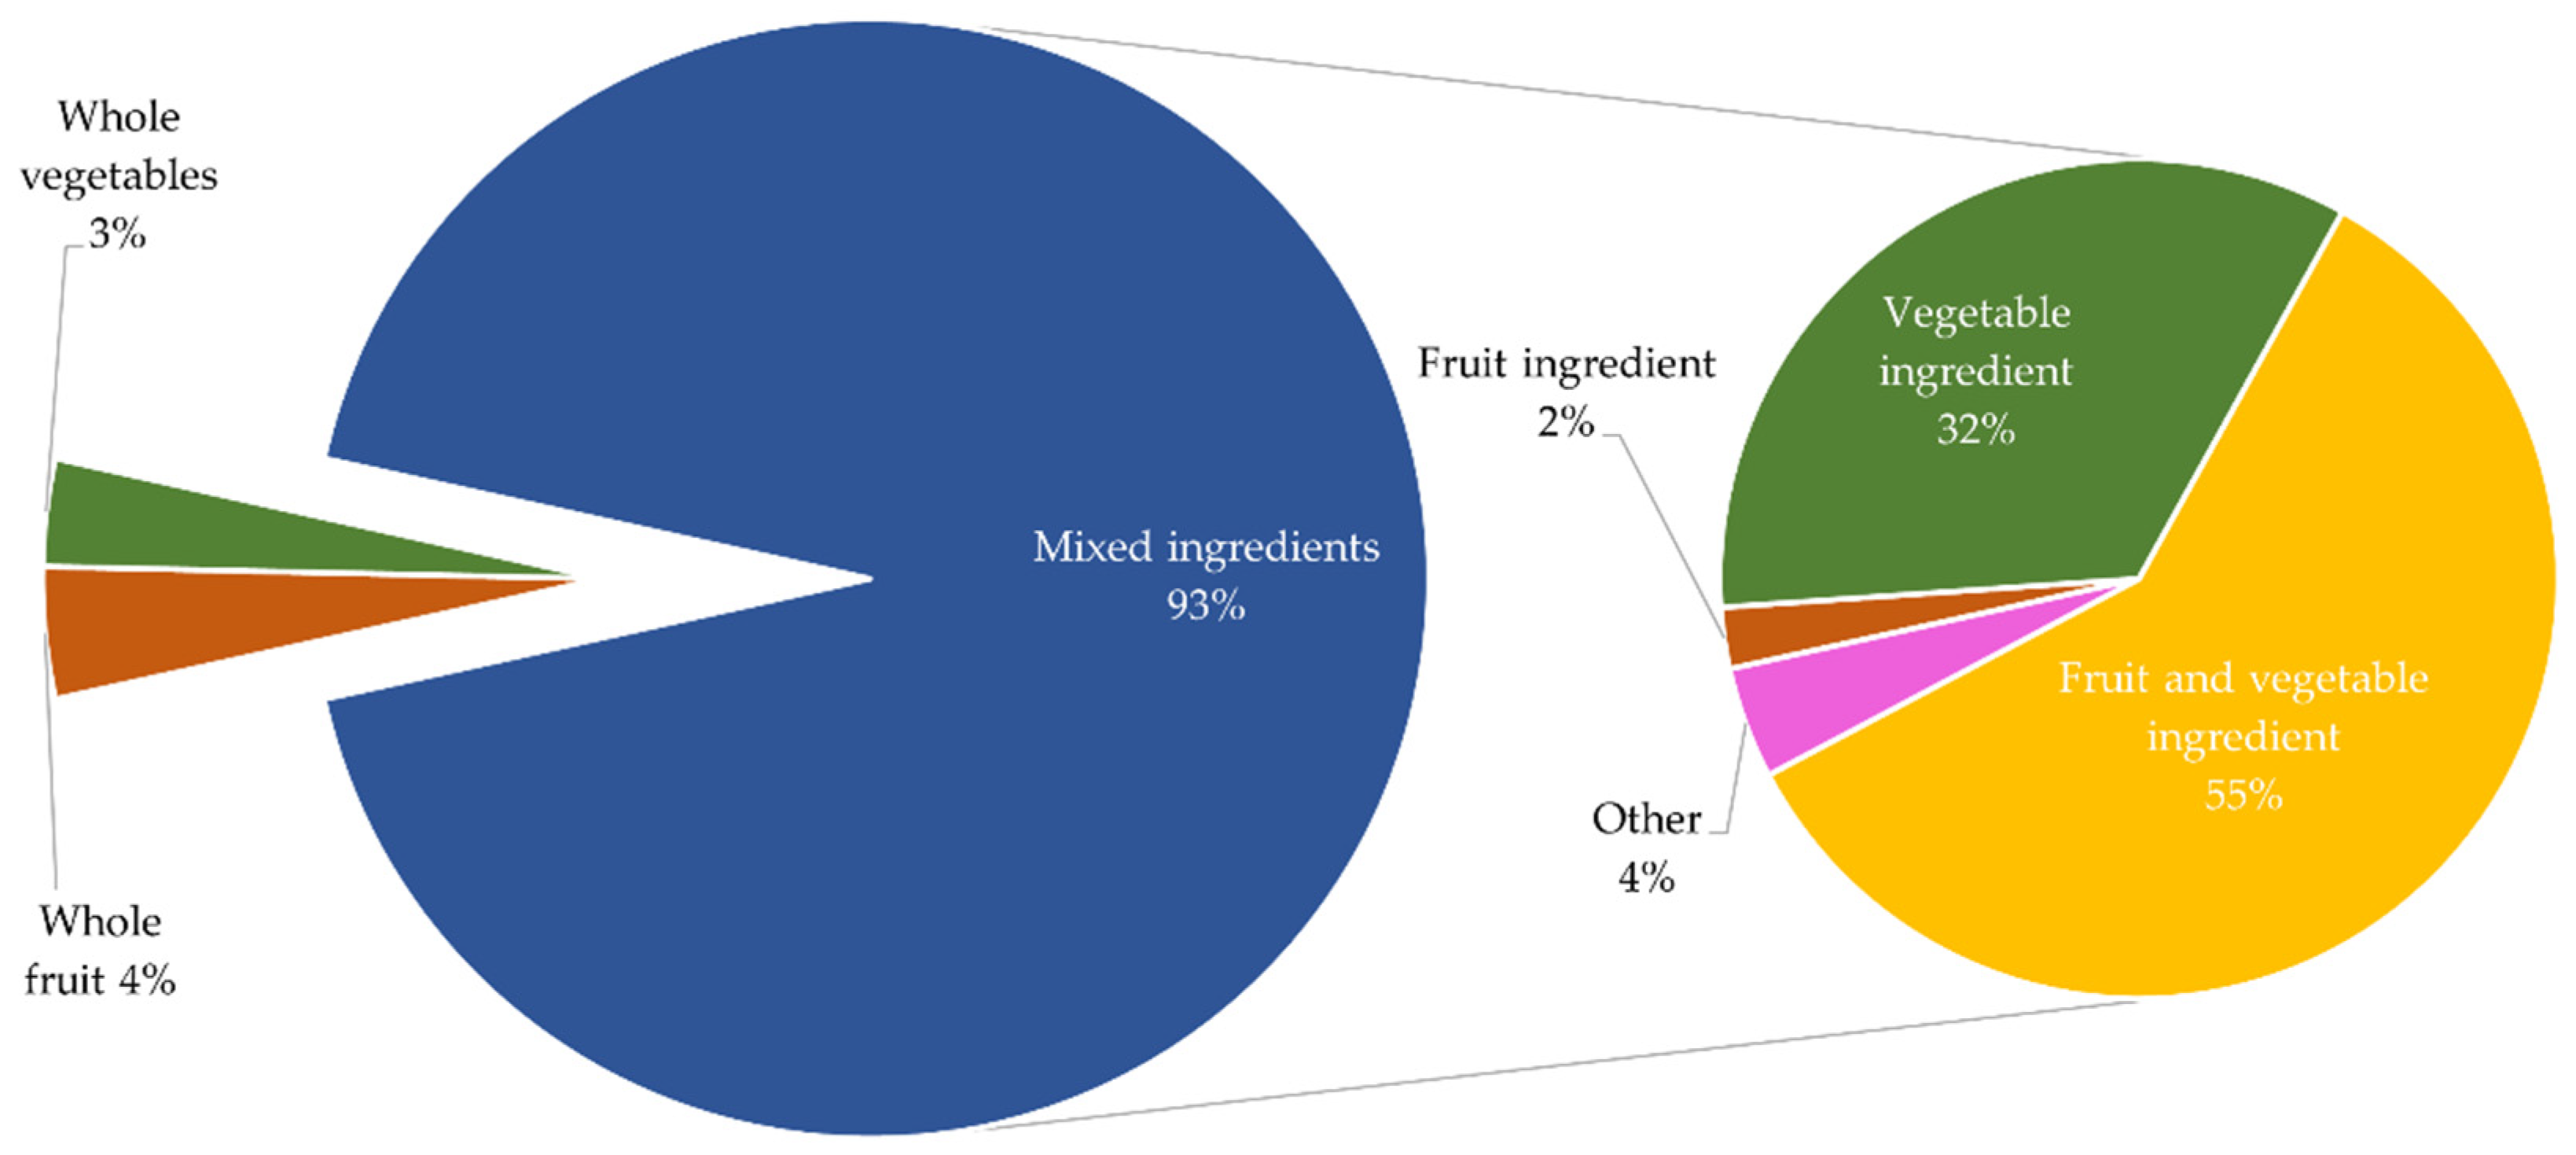
| Coding | Label | Response Examples |
|---|---|---|
| Round 1 | (1) Whole fruits | Apple, banana, orange, strawberries, peach, plums, grapes |
| (2) Whole vegetables | Carrot, cucumber, celery, corn, tomato, capsicum | |
| (3) Mixed Ingredients | [Coded in Round 2] | |
| Round 2 | (3) Fruit ingredient | “Banana, milk, flour, eggs” “Apple, peanut butter” |
| (4) Vegetable ingredient | “Carrot, peanut butter”; “Chicken, lettuce, cheese, bread” | |
| (5) Fruit and vegetable ingredient | “Celery, cream, sultanas”; “Celery, peanut butter, sultanas” | |
| (6) Other foods | Crackers and cheese, meat, jam and bread, pastry, ham |
| Pre-Program | Post-Program | |||||||
|---|---|---|---|---|---|---|---|---|
| n | Mean | n | Mean | t(df) | p | Diff | ||
| School A | Fruit serves | 42 | 3.0 | 41 | 2.2 | 4.235 (66) | <0.001 | ⏺ ↓ |
| Veg serves | 41 | 3.6 | 41 | 5.0 | −6.418 (45) | <0.001 | ⏺ ↑ | |
| School B | Fruit serves | 87 | 2.9 | 84 | 2.0 | 7.796 (86) | <0.001 | ⏺ ↓ |
| Veg serves | 84 | 3.8 | 85 | 5.0 | −10.129 (85) | <0.001 | ⏺ ↑ | |
| School C | Fruit serves | 56 | 2.5 | 55 | 2.1 | 2.221 (83) | 0.029 | ⏺ ↓ |
| Veg serves | 56 | 3.4 | 55 | 4.7 | −5.949 (100) | <0.001 | ⏺ ↑ | |
| School D | Fruit serves | 11 | 2.8 | 12 | 2.5 | 0.611 (21) | 0.547 | - |
| Veg serves | 12 | 2.8 | 12 | 4.8 | −4.642 (22) | <0.001 | ⏺ ↑ | |
| School E | Fruit serves | 19 | 2.7 | 20 | 2.2 | 1.648 (26) | 0.102 | - |
| Veg serves | 17 | 2.9 | 20 | 4.9 | −5.171 (22) | <0.001 | ⏺ ↑ | |
| School F | Fruit serves | 13 | 2.9 | 13 | 2.0 | 2.382 (12) | 0.026 | ⏺ ↓ |
| Veg serves | 12 | 4.0 | 13 | 5.0 | −2.449 (11) | 0.018 | ⏺ ↑ | |
| School G | Fruit serves | 66 | 2.9 | 67 | 2.0 | 5.398 (78) | <0.001 | ⏺ ↓ |
| Veg serves | 64 | 3.2 | 66 | 5.0 | −10.04 (72) | <0.001 | ⏺ ↑ | |
| School H | Fruit serves | 38 | 2.6 | 40 | 2.2 | 1.95 (70) | 0.053 | - |
| Veg serves | 40 | 4.3 | 40 | 4.8 | −2.38 (74) | 0.020 | ⏺ ↑ | |
| School I | Fruit serves | 18 | 3.1 | 18 | 2.2 | 3.083 (31) | 0.004 | ⏺ ↓ |
| Veg serves | 18 | 3.9 | 18 | 5.0 | −4.486 (17) | <0.001 | ⏺ ↑ | |
| School J | Fruit serves | 132 | 3.2 | 131 | 2.2 | 8.04 (206) | <0.001 | ⏺ ↓ |
| Veg serves | 130 | 3.4 | 132 | 4.7 | −9.927 (214) | <0.001 | ⏺ ↑ | |
| School K | Fruit serves | 22 | 2.8 | 22 | 2.3 | 1.519 (42) | 0.136 | - |
| Veg serves | 22 | 3.6 | 22 | 4.3 | −1.618 (42) | 0.113 | - | |
| School L | Fruit serves | 15 | 3.4 | 15 | 2.0 | 5.957 (14) | <0.001 | ⏺ ↓ |
| Veg serves | 15 | 3.4 | 15 | 4.8 | −4.537 (28) | <0.001 | ⏺ ↑ | |
| School M | Fruit serves | 40 | 2.8 | 40 | 2.1 | 3.603 (54) | 0.001 | ⏺ ↓ |
| Veg serves | 40 | 3.5 | 40 | 4.8 | −5.638 (70) | <0.001 | ⏺ ↑ | |
| School N | Fruit serves | 20 | 2.9 | 19 | 2.2 | 2.674 (34) | 0.012 | ⏺ ↓ |
| Veg serves | 20 | 3.5 | 19 | 4.8 | −4.591 (32) | <0.001 | ⏺ ↑ | |
| School O | Fruit serves | 63 | 3.3 | 63 | 2.1 | 6.615 (85) | <0.001 | ⏺ ↓ |
| Veg serves | 63 | 3.7 | 64 | 4.8 | −6.013 (93) | <0.001 | ⏺ ↑ | |
| School P | Fruit serves | 69 | 2.8 | 63 | 2.0 | 6.441 (75) | <0.001 | ⏺ ↓ |
| Veg serves | 68 | 3.2 | 63 | 4.8 | −9.492 (106) | <0.001 | ⏺ ↑ | |
| School Q | Fruit serves | 78 | 2.7 | 78 | 2.3 | 2.822 (139) | 0.005 | ⏺ ↓ |
| Veg serves | 78 | 3.2 | 79 | 4.7 | −8.163 (127) | <0.001 | ⏺ ↑ | |
| School R | Fruit serves | 56 | 2.6 | 57 | 2.2 | 2.352 (92) | 0.020 | ⏺ ↓ |
| Veg serves | 57 | 4.4 | 57 | 4.7 | −2.098 (106) | 0.038 | ⏺ ↑ | |
| School S | Fruit serves | 85 | 3.2 | 87 | 2.1 | 9.071 (132) | <0.001 | ⏺ ↓ |
| Veg serves | 84 | 3.5 | 88 | 4.8 | −8.666 (147) | <0.001 | ⏺ ↑ | |
| Total | Fruit serves | 930 | 2.9 | 925 | 2.1 | 18.44 (1419) | <0.001 | ⏺ ↓ |
| Veg serves | 921 | 3.5 | 929 | 4.8 | 26.12 (1466) | <0.001 | ⏺ ↑ | |
| Fruit Serves (Test Value = 2) | ||||||||
|---|---|---|---|---|---|---|---|---|
| School | n | Mean | t(df) | p | Diff | Mean Diff | Δ | |
| School A | pre | 42 | 3.0 | 5.755 (41) | <0.001 | ⏺ | 1.0 | −28.3% |
| post | 41 | 2.2 | 1.432 (40) | 0.08 | - | 0.1 | ||
| School B | pre | 87 | 2.9 | 7.796 (86) | <0.001 | ⏺ | 0.9 | −29.8% |
| post | 84 | 2.0 | n/a * | - | - | - | ||
| School C | pre | 56 | 2.5 | 3.365 (55) | <0.001 | ⏺ | 0.5 | −14.8% |
| post | 55 | 2.1 | 1.63 (54) | 0.054 | - | 0.1 | ||
| School D | pre | 11 | 2.8 | 2.043 (10) | 0.034 | ⏺ | 0.8 | −11.3% |
| post | 12 | 2.5 | 1.483 (11) | 0.083 | - | 0.5 | ||
| School E | pre | 19 | 2.7 | 2.281 (18) | 0.017 | ⏺ | 0.7 | −27.0% |
| post | 19 | 2.0 | n/a * | - | - | - | ||
| School F | pre | 13 | 2.9 | 2.382 (12) | 0.017 | ⏺ | 0.8 | −29.8% |
| post | 13 | 2.0 | n/a * | - | - | - | ||
| School G | pre | 66 | 2.9 | 5.976 (65) | <0.001 | ⏺ | 0.8 | −28.4% |
| post | 67 | 2.0 | 1.000 (66) | 0.16 | - | 0.0 | ||
| School H | pre | 38 | 2.6 | 3.822 (37) | <0.001 | ⏺ | 0.6 | −13.7% |
| post | 40 | 2.2 | 1.842 (39) | 0.037 | ⏺ | 0.2 | ||
| School I | pre | 18 | 3.1 | 4.486 (17) | <0.001 | ⏺ | 1.1 | −29.1% |
| post | 18 | 2.2 | 1.000 (17) | 0.166 | - | 0.2 | ||
| School J | pre | 132 | 3.2 | 10.89 (131) | <0.001 | ⏺ | 1.2 | −31.7% |
| post | 131 | 2.2 | 2.998 (130) | 0.002 | ⏺ | 0.2 | ||
| School K | pre | 22 | 2.8 | 3.645 (21) | <0.001 | ⏺ | 0.8 | −17.7% |
| post | 22 | 2.3 | 1.322 (21) | 0.100 | - | 0.3 | ||
| School L | pre | 15 | 3.4 | 5.957 (14) | <0.001 | ⏺ | 1.4 | −41.2% |
| post | 15 | 2.0 | n/a * | - | - | - | ||
| School M | pre | 40 | 2.8 | 4.365 (39) | <0.001 | ⏺ | 0.8 | −25.7% |
| post | 40 | 2.1 | 0.902 (39) | 0.186 | - | 0.1 | ||
| School N | pre | 20 | 2.9 | 3.943 (19) | <0.001 | ⏺ | 0.9 | −25.5% |
| post | 19 | 2.2 | 1.000 (18) | 0.165 | - | 0.2 | ||
| School O | pre | 63 | 3.3 | 8.001 (62) | <0.001 | ⏺ | 1.3 | −34.0% |
| post | 63 | 2.2 | 2.097 (62) | 0.02 | ⏺ | 0.2 | ||
| School P | pre | 70 | 2.8 | 6.445 (69) | <0.001 | ⏺ | 0.8 | −28.7% |
| post | 70 | 2.0 | −0.575 (69) | 0.284 | - | 0.0 | ||
| School Q | pre | 78 | 2.7 | 5.574 (77) | <0.001 | ⏺ | 0.7 | −16.4% |
| post | 77 | 2.3 | 2.982 (76) | 0.002 | ⏺ | 0.3 | ||
| School R | pre | 56 | 2.6 | 4.172 (55) | <0.001 | ⏺ | 0.6 | −16.0% |
| post | 57 | 2.2 | 2.269 (56) | 0.014 | ⏺ | 0.2 | ||
| School S | pre | 85 | 3.2 | 11.437 (84) | <0.001 | ⏺ | 1.2 | −34.9% |
| post | 87 | 2.1 | 1.919 (86) | 0.029 | ⏺ | 0.1 | ||
| Total | pre | 930 | 2.9 | 24.479 (929) | <0.001 | ⏺ | 0.9 | −27.6% |
| post | 925 | 2.1 | 6.688 (924) | <0.001 | ⏺ | 0.1 | ||
| Vegetable Serves (Test Value = 5) | ||||||||
|---|---|---|---|---|---|---|---|---|
| School | n | Mean | t(df) | p | Diff | Mean Diff | Δ | |
| School A | pre | 41 | 3.6 | −6.84 (40) | <0.001 | ⏺ | −1.4 | 37.1% |
| post | 41 | 5.0 | −1.000 (40) | 0.162 | - | 0.0 | ||
| School B | pre | 84 | 3.8 | −10.288 (83) | <0.001 | ⏺ | −1.2 | 30.3% |
| post | 85 | 5.0 | −1.000 (84) | 0.16 | - | 0.0 | ||
| School C | pre | 56 | 3.4 | −9.023 (55) | <0.001 | ⏺ | −1.6 | 38.1% |
| post | 55 | 4.7 | −2.257 (54) | 0.014 | ⏺ | −0.3 | ||
| School D | pre | 12 | 2.8 | −6.413 (11) | <0.001 | ⏺ | −2.3 | 72.7% |
| post | 12 | 4.8 | −1.000 (11) | 0.169 | - | −0.3 | ||
| School E | pre | 17 | 2.9 | −6.104 (16) | <0.001 | ⏺ | −2.1 | 70.1% |
| post | 19 | 5.0 | n/a * | - | - | - | ||
| School F | pre | 12 | 4.0 | −2.449 (11) | 0.016 | ⏺ | −1.0 | 25.0% |
| post | 13 | 5.0 | n/a * | - | - | - | ||
| School G | pre | 64 | 3.2 | −10.669 (63) | <0.001 | ⏺ | −1.8 | 54.7% |
| post | 66 | 5.0 | −1.000 (65) | 0.161 | - | 0.0 | ||
| School H | pre | 40 | 4.3 | −4.521 (39) | <0.001 | ⏺ | −0.7 | 10.4% |
| post | 40 | 4.8 | −1.94 (39) | 0.03 | ⏺ | −0.2 | ||
| School I | pre | 18 | 3.9 | −4.486 (17) | <0.001 | ⏺ | −1.1 | 26.9% |
| post | 18 | 5.0 | n/a * | - | - | - | ||
| School J | pre | 130 | 3.4 | −13.811 (129) | <0.001 | ⏺ | −1.6 | 41.1% |
| post | 132 | 4.7 | −3.546 (131) | <0.001 | ⏺ | −0.3 | ||
| School K | pre | 22 | 3.6 | −5.257 (21) | <0.001 | ⏺ | −1.4 | 17.3% |
| post | 22 | 4.3 | −2.46 (21) | 0.011 | ⏺ | −0.7 | ||
| School L | pre | 15 | 3.4 | −6.808 (14) | <0.001 | ⏺ | −1.6 | 41.2% |
| post | 15 | 4.8 | −1.000 (14) | 0.167 | - | −0.2 | ||
| School M | pre | 40 | 3.5 | −8.051 (39) | <0.001 | ⏺ | −1.5 | 37.4% |
| post | 40 | 4.8 | −1.711 (39) | 0.048 | ⏺ | −0.2 | ||
| School N | pre | 20 | 3.5 | −6.097 (19) | <0.001 | ⏺ | −1.5 | 38.3% |
| post | 19 | 4.8 | −1.000 (18) | 0.165 | - | −0.2 | ||
| School O | pre | 63 | 3.7 | −7.792 (62) | <0.001 | ⏺ | −1.3 | 31.5% |
| post | 64 | 4.8 | −1.93 (63) | 0.029 | ⏺ | −0.2 | ||
| School P | pre | 69 | 3.3 | −11.847 (68) | <0.001 | ⏺ | −1.8 | 49.5% |
| post | 70 | 4.9 | −1.857 (69) | 0.034 | ⏺ | −0.1 | ||
| School Q | pre | 78 | 3.2 | −11.303 (77) | <.001 | ⏺ | −1.8 | 46.6% |
| post | 78 | 4.7 | −2.926 (77) | 0.002 | ⏺ | −0.3 | ||
| School R | pre | 57 | 4.4 | −4.481 (56) | <0.001 | ⏺ | −0.6 | 9.0% |
| post | 57 | 4.7 | −2.32 (56) | 0.012 | ⏺ | −0.3 | ||
| School S | pre | 84 | 3.5 | −12.053 (83) | <0.001 | ⏺ | −1.5 | 35.9% |
| post | 88 | 4.8 | −2.35 (87) | 0.011 | ⏺ | −0.2 | ||
| Total | pre | 921 | 3.6 | 36.791 (920) | <0.001 | ⏺ | 1.6 | 33.0% |
| post | 929 | 4.8 | 116.744 (928) | <0.001 | ⏺ | 2.8 | ||
| Group Differences | |||||||
|---|---|---|---|---|---|---|---|
| Group | n | Mean | F/t(df) | p | Diff | ||
| Gender | Fruit | Males (pre) a | 418 | 3.02 | F(2, 917) = 3.07 | p < 0.05 | ⏺ |
| Female (pre) b | 461 | 2.83 | |||||
| Prefer not to say (pre) ab | 41 | 2.90 | |||||
| Males (post) a | 430 | 2.17 | F(2, 918) = 1.29 | p = 0.28 | |||
| Female (post) a | 444 | 2.10 | |||||
| Prefer not to say (post) a | 47 | 2.15 | |||||
| Vegetable | Males (pre) a | 409 | 3.50 | F(2, 908) = 0.42 | p = 0.66 | ||
| Female (pre) a | 459 | 3.57 | |||||
| Prefer not to say (pre) a | 43 | 3.60 | |||||
| Males (pre) a | 431 | 4.77 | F(2, 922) = 2.63 | p = 0.07 | |||
| Female (pre) a | 444 | 4.86 | |||||
| Prefer not to say (pre) a | 50 | 4.68 | |||||
| Ethnicity | Fruit | Non-ATSI (pre) a | 725 | 2.86 | t(293.7) = −2.72 | p < 0.05 | ⏺ |
| ATSI (pre) b | 205 | 3.13 | |||||
| Non-ATSI (post) a | 710 | 2.11 | t(299.9) = −1.72 | p = 0.09 | |||
| ATSI (post) a | 215 | 2.20 | |||||
| Vegetable | Non-ATSI (pre) a | 717 | 3.55 | t(919) = 0.07 | p = 0.94 | ||
| ATSI (pre) a | 204 | 3.54 | |||||
| Non-ATSI (post) a | 708 | 4.82 | t(927) = 0.72 | p = 0.47 | |||
| ATSI (post) a | 221 | 4.78 | |||||
| First-timers vs. previously participated | Fruit | First-timers (pre) a | 381 | 2.99 | t(928) = 1.64 | p = 0.10 | |
| Prev. participated (pre) a | 549 | 2.87 | |||||
| First-timers (post) a | 384 | 2.15 | t(923) = 0.71 | p = 0.48 | |||
| Prev. participated (post) a | 541 | 2.12 | |||||
| Vegetable | First-timers (pre) a | 379 | 3.42 | t(919) = −2.40 | p < 0.05 | ⏺ | |
| Prev. participated (pre) b | 542 | 3.63 | |||||
| First-timers (post) a | 386 | 4.82 | t(927) = 0.50 | p = 0.61 | |||
| Prev. participated (pre) a | 543 | 4.80 | |||||
| Pathway | Fruit | Core (pre) a | 401 | 3.01 | F(2, 927) = 2.15 | p = 0.12 | |
| In progress (pre) a | 282 | 2.85 | |||||
| Full accreditation (pre) a | 247 | 2.85 | |||||
| Core (post) a | 393 | 2.08 | F(2, 922) = 3.10 | p = 0.05 | |||
| In progress (post) a | 283 | 2.17 | |||||
| Full accreditation (post) a | 249 | 2.18 | |||||
| Vegetable | Core (pre) ab | 396 | 3.56 | F(2, 918) = 5.80 | p < 0.05 | ⏺ | |
| In progress (pre) a | 283 | 3.71 | |||||
| Full accreditation (pre) b | 242 | 3.33 | |||||
| Core (post) a | 396 | 4.82 | F(2, 926) = 2.15 | p = 0.12 | |||
| In progress (post) a | 284 | 4.74 | |||||
| Full accreditation (post) a | 249 | 4.87 | |||||
| Vegetable garden | Fruit | No vegetable garden (pre) a | 244 | 2.98 | t(928) = 1.03 | p = 0.30 | |
| Vegetable garden (pre) a | 686 | 2.90 | |||||
| No vegetable garden (post) a | 247 | 2.14 | t(923) = 0.23 | p = 0.82 | |||
| Vegetable garden (post) a | 678 | 2.13 | |||||
| Vegetable | No vegetable garden (pre) a | 241 | 3.34 | t(919) = −2.98 | p < 0.05 | ⏺ | |
| Vegetable garden (pre) b | 680 | 3.62 | |||||
| No vegetable garden (post) a | 248 | 4.82 | t(927) = 0.23 | p = 0.82 | |||
| Vegetable garden (post) a | 681 | 4.81 | |||||
| Pre | Post | |||||||
|---|---|---|---|---|---|---|---|---|
| School | n | Mean (Daily) | n | Mean (Daily) | t(df) | p | Diff | |
| School F | Fruit serves | 14 | 1.8 | 14 | 2.5 | −1.912 (13) | 0.078 | - |
| Veg serves | 14 | 1.2 | 14 | 3.8 | −8.597 (13) | <0.001 | ⏺ ↑ | |
| School G 1 | Fruit serves | 29 | 2.7 | 29 | 2.0 | 3.335 (28) | 0.002 | ⏺ ↓ |
| Veg serves | 29 | 2.4 | 29 | 1.6 | 1.984 (28) | 0.057 | - | |
| School H | Fruit serves | 37 | 3.0 | 37 | 3.1 | −0.374 (36) | 0.711 | - |
| Veg serves | 37 | 3.0 | 37 | 3.1 | −0.603 (36) | 0.551 | - | |
| School I | Fruit serves | 18 | 1.7 | 18 | 1.5 | 0.573 (17) | 0.574 | - |
| Veg serves | 18 | 0.3 | 18 | 0.6 | −1.534 (17) | 0.143 | - | |
| School L | Fruit serves | 15 | 2.1 | 15 | 2.9 | −2.663 (14) | 0.019 | ⏺ ↑ |
| Veg serves | 15 | 1.6 | 15 | 2.4 | −2.755 (14) | 0.015 | ⏺ ↑ | |
| School P | Fruit serves | 18 | 1.7 | 18 | 1.8 | −0.296 (17) | 0.771 | - |
| Veg serves | 18 | 1.0 | 18 | 1.6 | −1.925 (17) | 0.071 | - | |
| School R | Fruit serves | 67 | 2.1 | 67 | 2.1 | −0.161 (66) | 0.873 | - |
| Veg serves | 68 | 2.5 | 68 | 2.6 | −0.85 (67) | 0.398 | - | |
| School S | Fruit serves | 63 | 2.0 | 63 | 2.1 | −0.686 (62) | 0.495 | - |
| Veg serves | 61 | 1.9 | .61 | 1.8 | 0.67 (60) | 0.505 | - | |
| Total | Fruit serves | 261 | 2.2 | 261 | 2.2 | −0.606 (260) | 0.545 | - |
| Veg serves | 260 | 2.0 | 260 | 2.2 | −1.71 (259) | 0.089 | - | |
| Fruit Serves (Reported Consumption Compared to 2 Serves *) | ||||||||
|---|---|---|---|---|---|---|---|---|
| School | n | Mean | Daily Mean | t(df) | p | Diff | Δ | |
| School F | Pre | 14 | 9.1 | 1.8 | −0.637 (13) | 0.535 | - | 35.2% |
| Post | 14 | 12.4 | 2.5 | 2.148 (13) | 0.051 | - | ||
| School G 1 | Pre | 29 | 13.5 | 2.7 | 3.313 (28) | 0.003 | ⏺ | −26.8% |
| Post | 29 | 9.9 | 2.0 | −0.146 (28) | 0.885 | - | ||
| School H | Pre | 38 | 14.7 | 3.0 | 4.637 (37) | <0.001 | ⏺ | 5.0% |
| Post | 37 | 15.5 | 3.1 | 5.924 (36) | <0.001 | ⏺ | ||
| School I | Pre | 18 | 8.3 | 1.7 | −1.696 (17) | 0.108 | - | −7.4% |
| Post | 18 | 7.7 | 1.5 | −3.636 (17) | 0.002 | ⏺ | ||
| School L | Pre | 15 | 10.5 | 2.1 | 0.356 (14) | 0.727 | - | 39.9% |
| Post | 15 | 14.7 | 2.9 | 3.443 (14) | 0.004 | ⏺ | ||
| School P | Pre | 18 | 8.3 | 1.7 | −1.182 (17) | 0.253 | - | 6.0% |
| Post | 18 | 8.8 | 1.8 | −1.582 (17) | 0.132 | - | ||
| School R | Pre | 67 | 10.5 | 2.1 | 0.838 (66) | 0.405 | - | 3.2% |
| Post | 68 | 10.8 | 2.1 | 1.365 (67) | 0.177 | - | ||
| School S | Pre | 63 | 10.1 | 2.0 | 0.079 (62) | 0.937 | - | 8.2% |
| Post | 64 | 10.9 | 2.1 | 1.09 (63) | 0.280 | - | ||
| Total | Pre | 261 | 11.01 | 2.2 | 2.770 (260) | 0.006 | ⏺ | 3.0% |
| Post | 263 | 11.34 | 2.3 | 3.932 (262) | <0.001 | ⏺ | ||
| Vegetable Serves (Reported Consumption Compared to 5 Serves *) | ||||||||
|---|---|---|---|---|---|---|---|---|
| School | n | Mean | Daily Mean | t(df) | p | Diff | Δ | |
| School F | Pre | 14 | 6.2 | 1.2 | −17.919 (13) | <0.001 | ⏺ | 205.2% |
| Post | 14 | 18.9 | 3.8 | −8.749 (13) | <0.001 | ⏺ | ||
| School G | Pre | 29 | 12.1 | 2.4 | −7.661 (28) | <0.001 | ⏺ | −33.6% |
| Post | 29 | 8.0 | 1.6 | −13.153 (28) | <0.001 | ⏺ | ||
| School H | Pre | 38 | 15.1 | 3.0 | −9.779 (37) | <0.001 | ⏺ | 4.4% |
| Post | 37 | 15.7 | 3.1 | −7.663 (36) | <0.001 | ⏺ | ||
| School I | Pre | 18 | 1.4 | 0.3 | −42.996 (17) | <0.001 | ⏺ | 107.9% |
| Post | 18 | 2.9 | 0.6 | −29.341 (17) | <0.001 | ⏺ | ||
| School L | Pre | 15 | 8.2 | 1.6 | −9.577 (14) | <0.001 | ⏺ | 48.5% |
| Post | 15 | 12.1 | 2.4 | −7.349 (14) | <0.001 | ⏺ | ||
| School P | Pre | 18 | 5.1 | 1.0 | −14.352 (17) | <0.001 | ⏺ | 54.7% |
| Post | 18 | 7.8 | 1.6 | −14.507 (17) | <0.001 | ⏺ | ||
| School R | Pre | 68 | 12.3 | 2.5 | −16.614 (67) | <0.001 | ⏺ | 5.0% |
| Post | 68 | 12.9 | 2.6 | −15.474 (67) | <0.001 | ⏺ | ||
| School S | Pre | 61 | 9.5 | 1.9 | −13.122 (60) | <0.001 | ⏺ | −0.7% |
| Post | 64 | 9.4 | 1.8 | −14.54 (63) | <0.001 | ⏺ | ||
| Total | Pre | 251 | 10.64 | 2.1 | −29.102 (250) | <0.001 | ⏺ | 4.9% |
| Post | 263 | 11.16 | 2.2 | −28.921 (262) | <0.001 | ⏺ | ||
| Fruit | Vegetables | ||||||||||
|---|---|---|---|---|---|---|---|---|---|---|---|
| Pre | Post | Pre | Post | ||||||||
| n | Mean Week | Mean Daily | Mean Week | Mean Daily | n | Mean (Week) | Mean Daily | Mean (Week) | Mean Daily | ||
| All Schools | Increase | 125 | 8.2 | 1.6 | 13.7 | 2.7 a | 130 | 7.7 | 1.5 | 14.6 | 2.9 c |
| No change | 23 | 9.1 | 1.8 | 9.1 | 1.8 | 20 | 7.5 | 1.5 | 7.4 | 1.5 | |
| Decrease | 112 | 14.6 | 2.9 | 9.0 | 1.8 b | 100 | 15 | 3 | 8.1 | 1.6 d | |
Publisher’s Note: MDPI stays neutral with regard to jurisdictional claims in published maps and institutional affiliations. |
© 2022 by the authors. Licensee MDPI, Basel, Switzerland. This article is an open access article distributed under the terms and conditions of the Creative Commons Attribution (CC BY) license (https://creativecommons.org/licenses/by/4.0/).
Share and Cite
Isbanner, S.; Carins, J.; Rundle-Thiele, S. Healthy Eats—Evaluation of a Social Marketing Program Delivered in Primary School Settings in Queensland. Int. J. Environ. Res. Public Health 2022, 19, 14415. https://doi.org/10.3390/ijerph192114415
Isbanner S, Carins J, Rundle-Thiele S. Healthy Eats—Evaluation of a Social Marketing Program Delivered in Primary School Settings in Queensland. International Journal of Environmental Research and Public Health. 2022; 19(21):14415. https://doi.org/10.3390/ijerph192114415
Chicago/Turabian StyleIsbanner, Sebastian, Julia Carins, and Sharyn Rundle-Thiele. 2022. "Healthy Eats—Evaluation of a Social Marketing Program Delivered in Primary School Settings in Queensland" International Journal of Environmental Research and Public Health 19, no. 21: 14415. https://doi.org/10.3390/ijerph192114415
APA StyleIsbanner, S., Carins, J., & Rundle-Thiele, S. (2022). Healthy Eats—Evaluation of a Social Marketing Program Delivered in Primary School Settings in Queensland. International Journal of Environmental Research and Public Health, 19(21), 14415. https://doi.org/10.3390/ijerph192114415