

The Impact of the Pandemic on Mental Health in Ethnically Diverse Mothers: Findings from the Born in Bradford, Tower Hamlets and Newham COVID-19 Research Programmes
 ,
,  , , and
Abstract
1. Introduction
- Explore what factors are associated with poor mental health during the COVID-19 pandemic across a range of ethnic groups in three areas in England.
- Explore in depth, the association between financial insecurity and mental health.
- Explore the association between loneliness and mental health.
- Identify how any ethnic differences in mother’s mental health are modified by financial insecurity, loneliness, and social support.
2. Materials and Methods
2.1. Setting
2.2. Study Design and Participants
2.2.1. Bradford
2.2.2. Tower Hamlets
2.2.3. Newham
2.3. Data Collection
2.4. Measures
2.4.1. Outcomes
2.4.2. Exposures
Ethnicity
Financial Insecurity
Loneliness
Other Household Characteristics
Location of Residency
2.5. Data Analysis
3. Results
3.1. Sample Characteristics

| Characteristics | Overall | Bradford | Tower Hamlets | Newham | ||||
|---|---|---|---|---|---|---|---|---|
| n = 2807 | % | n = 1466 | % | n = 445 | % | n = 896 | % | |
| Depressive symptoms | ||||||||
| None | 1236 | 44% | 876 | 60% | 154 | 35% | 206 | 23% |
| Mild | 794 | 28% | 344 | 23% | 136 | 31% | 314 | 35% |
| Moderate | 561 | 20% | 148 | 10% | 90 | 20% | 323 | 36% |
| Moderately severe | 163 | 6% | 73 | 5% | 51 | 11% | 39 | 4% |
| Severe | 53 | 2% | 25 | 2% | 14 | 3% | 14 | 2% |
| Anxiety symptoms | ||||||||
| None | 1360 | 48% | 930 | 63% | 182 | 41% | 248 | 28% |
| Mild | 861 | 31% | 335 | 23% | 138 | 31% | 388 | 43% |
| Moderate | 421 | 15% | 120 | 8% | 82 | 18% | 219 | 24% |
| Severe | 165 | 6% | 81 | 6% | 43 | 10% | 41 | 5% |
| Ethnicity | ||||||||
| White | ||||||||
| British | 1237 | 44% | 609 | 42% | 176 | 40% | 452 | 50% |
| Irish | 121 | 4% | <5 | --- | <5 | --- | 116 | 13% |
| Any other White | 219 | 8% | 39 | 3% | 58 | 13% | 122 | 14% |
| Black/Black British/Mixed Caribbean/African | ||||||||
| Caribbean | 46 | 2% | 21 | 1% | 8 | 2% | 17 | 2% |
| African | 35 | 1% | 16 | 1% | 12 | 3% | 7 | 1% |
| Asian/Asian British/Mixed | ||||||||
| Indian | 94 | 3% | 51 | 3% | 11 | 2% | 32 | 4% |
| Pakistani | 659 | 23% | 623 | 43% | 8 | 2% | 28 | 3% |
| Bangladeshi | 200 | 7% | 37 | 3% | 129 | 29% | 34 | 4% |
| Any other Asian | 81 | 3% | 32 | 2% | 18 | 4% | 31 | 4% |
| Any other ethnic group/Mixed | 115 | 4% | 36 | 2% | 22 | 5% | 57 | 6% |
| Relationship status | ||||||||
| Single | 328 | 12% | 188 | 13% | 67 | 15% | 73 | 8% |
| Married/civil partnership | 2194 | 78% | 1117 | 76% | 329 | 74% | 748 | 83% |
| Not married but in a relationship | 285 | 10% | 161 | 11% | 49 | 11% | 75 | 8% |
| Pregnancy status | ||||||||
| No | 2515 | 90% | 1415 | 97% | 369 | 83% | 731 | 82% |
| Yes | 292 | 10% | 51 | 3% | 76 | 17% | 165 | 18% |
| Home condition—mould or damp house | ||||||||
| No | 2114 | 75% | 1090 | 74% | 322 | 72% | 702 | 78% |
| Yes | 693 | 25% | 376 | 26% | 123 | 28% | 194 | 22% |
| Worrying about job security | ||||||||
| Strongly disagree | 383 | 14% | 272 | 19% | 33 | 7% | 78 | 9% |
| Disagree | 691 | 25% | 392 | 27% | 69 | 16% | 230 | 26% |
| Neither agree or disagree | 659 | 24% | 296 | 20% | 133 | 30% | 230 | 26% |
| Agree | 735 | 26% | 338 | 23% | 150 | 34% | 247 | 28% |
| Strongly agree | 339 | 12% | 168 | 11% | 60 | 13% | 111 | 12% |
| Food insecurity—Food didn’t last | ||||||||
| Never true | 2061 | 73% | 1243 | 85% | 271 | 61% | 547 | 61% |
| Sometimes true | 512 | 18% | 174 | 12% | 133 | 30% | 205 | 23% |
| Often true | 234 | 8% | 49 | 3% | 41 | 9% | 144 | 16% |
| Food insecurity—Couldn’t afford balanced meals | ||||||||
| Never true | 2072 | 74% | 1238 | 84% | 265 | 60% | 569 | 64% |
| Sometimes true | 474 | 17% | 156 | 11% | 135 | 30% | 183 | 20% |
| Often true | 261 | 9% | 72 | 5% | 45 | 10% | 144 | 16% |
| Food insecurity—Have been hungry? | ||||||||
| No | 2467 | 88% | 1413 | 96% | 376 | 84% | 678 | 76% |
| Yes | 340 | 12% | 53 | 4% | 69 | 16% | 218 | 24% |
| Financial insecurity—how are you getting on | ||||||||
| Living comfortably | 597 | 21% | 342 | 23% | 82 | 18% | 173 | 19% |
| Doing alright | 1172 | 42% | 666 | 45% | 158 | 36% | 348 | 39% |
| Just about getting by | 728 | 26% | 341 | 23% | 126 | 28% | 261 | 29% |
| Finding it quite difficult | 212 | 8% | 85 | 6% | 47 | 11% | 80 | 9% |
| Finding it very difficult | 98 | 3% | 32 | 2% | 32 | 7% | 34 | 4% |
| Quality of relationship with partner | ||||||||
| NA- Single | 328 | 12% | 188 | 13% | 67 | 15% | 73 | 8% |
| Excellent | 1002 | 36% | 643 | 44% | 133 | 30% | 226 | 25% |
| Good | 1051 | 37% | 508 | 35% | 166 | 37% | 377 | 42% |
| Average | 348 | 12% | 103 | 7% | 52 | 12% | 193 | 22% |
| Poor | 50 | 2% | 14 | 1% | 17 | 4% | 19 | 2% |
| Very poor | 28 | 1% | 10 | 1% | 10 | 2% | 8 | 1% |
| Social support—No of people you can count on | ||||||||
| 0–2: Low | 683 | 24% | 273 | 19% | 131 | 29% | 279 | 31% |
| 3–6: Medium | 1397 | 50% | 651 | 44% | 235 | 53% | 511 | 57% |
| 7 and more: High | 727 | 26% | 542 | 37% | 79 | 18% | 106 | 12% |
| Social support—No of people you can count on living locally | ||||||||
| 0–2: Low | 1386 | 49% | 573 | 39% | 253 | 57% | 560 | 63% |
| 3–6: Medium | 1069 | 38% | 608 | 41% | 165 | 37% | 296 | 33% |
| 7 and more: High | 352 | 13% | 285 | 19% | 27 | 6% | 40 | 4% |
| Loneliness | ||||||||
| None/almost none of the time | 1313 | 47% | 899 | 61% | 163 | 37% | 251 | 28% |
| Some of the time | 995 | 35% | 450 | 31% | 198 | 44% | 347 | 39% |
| Most of the time | 384 | 14% | 84 | 6% | 50 | 11% | 250 | 28% |
| All/almost all of the time | 115 | 4% | 33 | 2% | 34 | 8% | 48 | 5% |
3.2. Factors Associated with Clinically Important Depressive Symptoms
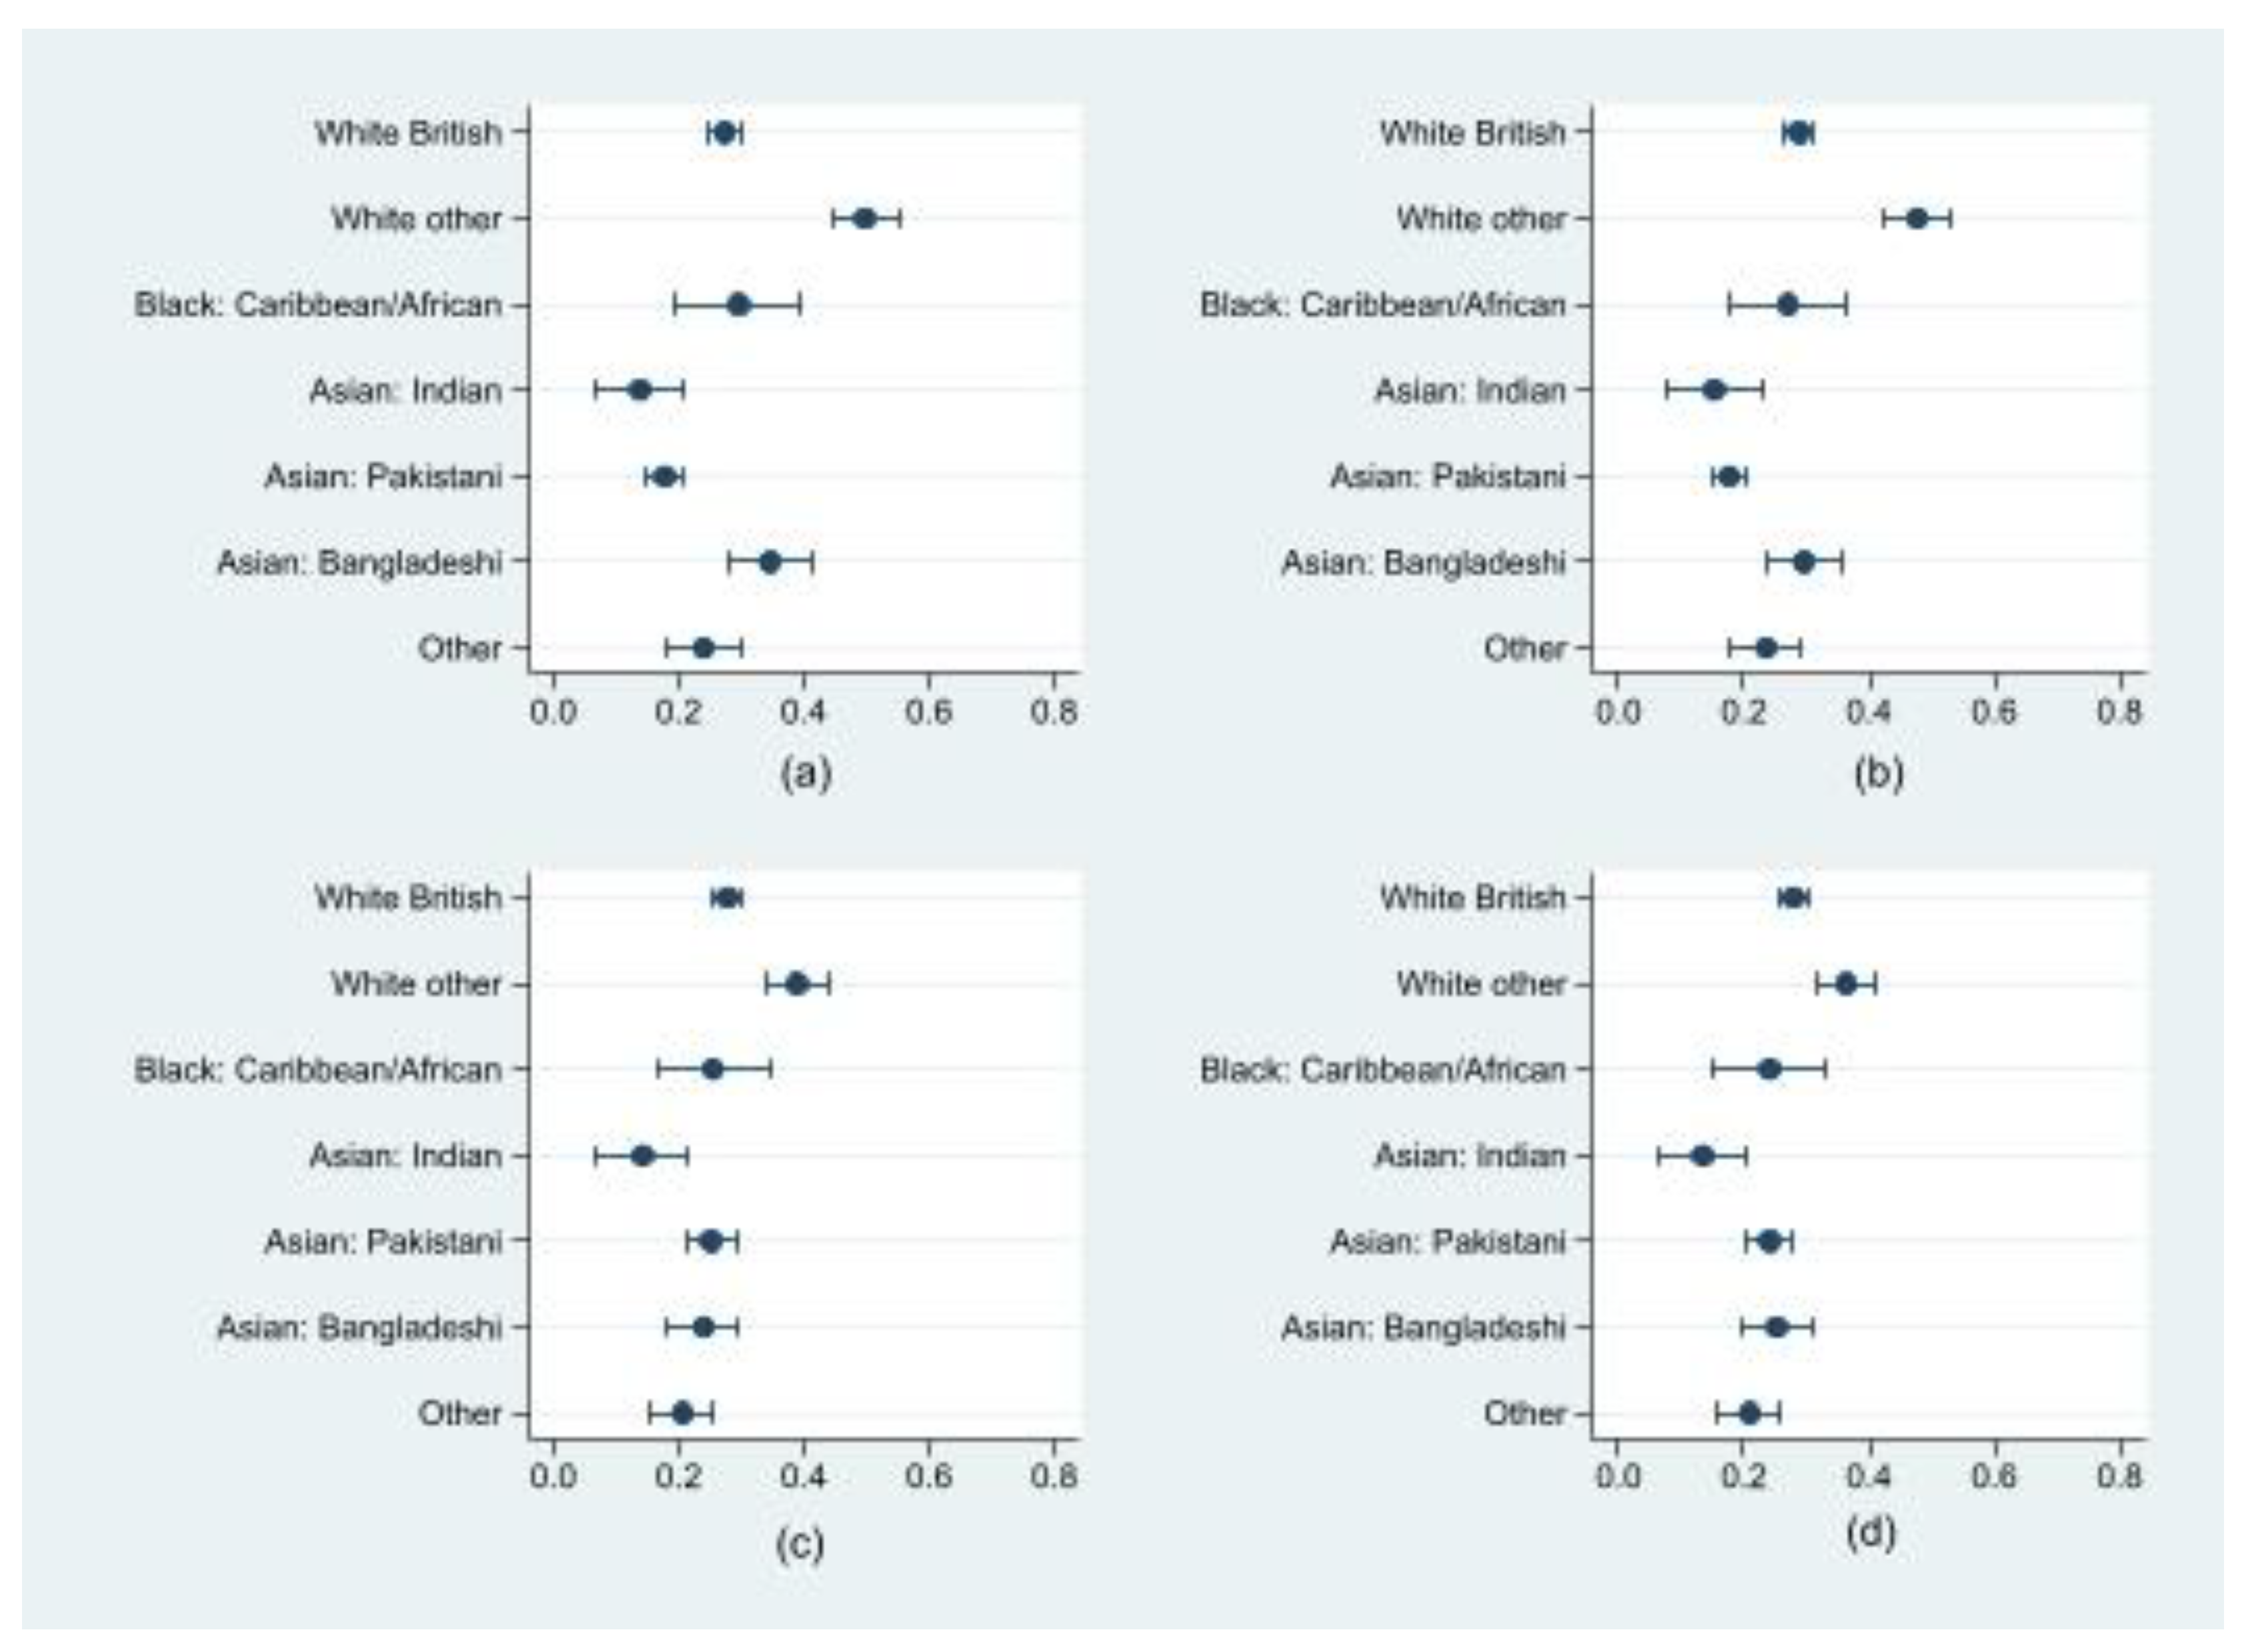
3.3. Ethnic Differences in the Risk of Clinically Important Depressive Symptoms and Role of Financial Insecurity
3.4. Ethnic Differences in the Risk of Clinically Important Depressive Symptoms and the Role of Loneliness
3.5. Clinically Important Anxiety Symptoms
4. Discussion
5. Conclusions
Supplementary Materials
Author Contributions
Funding
Institutional Review Board Statement
Informed Consent Statement
Data Availability Statement
Acknowledgments
Conflicts of Interest
Abbreviations
| UK | United Kingdom |
| PHQ-8 | Patient Health Questionnaire 8 |
| GAD-7 | Generalised Anxiety Disorder Assessment 7 |
| SD | Standard Deviation |
| OR | Odds Ratio |
| CI | Confidence Intervals |
| Ref | Reference group |
| BAME | Black, Asian, and Minority Ethnic |
| Est | Estimate |
References
- Suleman, M.; Sonthalia, S.; Webb, C.; Tinson, A.; Kane, M.; Bunbury, S.; Finch, D.; Bibby, J. Unequal Pandemic, Fairer Recovery; The Health Foundation: London, UK, 2021. [Google Scholar]
- Dickerson, J.; Kelly, B.; Lockyer, B.; Bridges, S.; Cartwright, C.; Willan, K.; Shire, K.; Crossley, K.; Sheldon, T.A.; Lawlor, D.A.; et al. Experiences of lockdown during the Covid-19 pandemic: Descriptive findings from a survey of families in the Born in Bradford study. Wellcome Open Res. 2021, 5, 228. [Google Scholar] [CrossRef] [PubMed]
- Proto, E.; Quintana-Domeque, C. COVID-19 and mental health deterioration by ethnicity and gender in the UK. PLoS ONE 2021, 16, e0244419. [Google Scholar] [CrossRef] [PubMed]
- Smith, K.; Bhui, K.; Cipriani, A. COVID-19, Mental Health and Ethnic Minorities; Royal College of Psychiatrists: London, UK, 2020; pp. 89–90. [Google Scholar]
- Cheng, Z.; Mendolia, S.; Paloyo, A.R.; Savage, D.A.; Tani, M. Working parents, financial insecurity, and childcare: Mental health in the time of COVID-19 in the UK. Rev. Econ. Househ. 2021, 19, 123–144. [Google Scholar] [CrossRef] [PubMed]
- Fitch, C.; Hamilton, S.; Bassett, P.; Davey, R. The relationship between personal debt and mental health: A systematic review. Ment. Health Rev. J. 2011, 16, 153–166. [Google Scholar] [CrossRef]
- Aldridge, R.W.; Lewer, D.; Katikireddi, S.V.; Mathur, R.; Pathak, N.; Burns, R.; Fragaszy, E.B.; Johnson, A.M.; Devakumar, D.; Abubakar, I. Black, Asian and minority ethnic groups in England are at increased risk of death from COVID-19: Indirect standardisation of NHS mortality data. Wellcome Open Res. 2020, 5, 88. [Google Scholar] [CrossRef] [PubMed]
- Jaspal, R.; Lopes, B. Discrimination and mental health outcomes in British black and south Asian people during the COVID-19 outbreak in the UK. Ment. Health Relig. Cult. 2021, 24, 80–96. [Google Scholar] [CrossRef]
- Gibson, B.; Schneider, J.; Talamonti, D.; Forshaw, M. The impact of inequality on mental health outcomes during the COVID-19 pandemic: A systematic review. Can. Psychol. 2021, 62, 101–126. [Google Scholar] [CrossRef]
- Almeida, M.; Shrestha, A.D.; Stojanac, D.; Miller, L.J. The impact of the COVID-19 pandemic on women’s mental health. Arch. Women’s Ment. Health 2020, 23, 741–748. [Google Scholar] [CrossRef] [PubMed]
- Pierce, M.; McManus, S.; Hope, H.; Hotopf, M.; Ford, T.; Hatch, S.L.; John, A.; Kontopantelis, E.; Webb, R.T.; Wessely, S. Mental health responses to the COVID-19 pandemic: A latent class trajectory analysis using longitudinal UK data. Lancet Psychiatry 2021, 8, 610–619. [Google Scholar] [CrossRef]
- Cameron, C.; Hauari, H.; Hollingworth, K.; O’Brien, M.; Whitaker, L. The Impact of Covid-19 on Families, Children Aged 0–4 and Pregnant Women in Tower Hamlets: Wave One Survey Findings; UCL Social Research Institute: London, UK, 2021. [Google Scholar]
- Newham Council. Towards a Better Newham: Our COVID-19 Recovery Strategy. 2022. Available online: https://www.newham.gov.uk/council/community-wealth-building/2 (accessed on 10 January 2022).
- Dickerson, J.; Kelly, B.; Lockyer, B.; Bridges, S.; Cartwright, C.; Willan, K.; Shire, K.; Crossley, K.; Bryant, M.; Siddiqi, N. ‘When will this end? Will it end?’ The impact of the March–June 2020 UK COVID-19 lockdown response on mental health: A longitudinal survey of mothers in the Born in Bradford study. BMJ Open 2022, 12, e047748. [Google Scholar] [CrossRef] [PubMed]
- ActEarly. Early Life Changes to Improve Life for Children. 2022. Available online: https://actearly.org.uk/ (accessed on 15 December 2021).
- City of Bradford Metropolitan District Council. Population. 2021. Available online: https://www.bradford.gov.uk/open-data/our-datasets/population/ (accessed on 10 January 2022).
- Tower Hamlets. Population Report. 2017. Available online: https://www.towerhamlets.gov.uk/lgnl/community_and_living/borough_statistics/population.aspx (accessed on 12 January 2022).
- Office for National Statistics. Household Projections for England: 2018-Based. 2020. Available online: https://www.ons.gov.uk/peoplepopulationandcommunity/populationandmigration/populationprojections/bulletins/householdprojectionsforengland/2018based (accessed on 14 June 2022).
- McEachan, R.R.; Dickerson, J.; Bridges, S.; Bryant, M.; Cartwright, C.; Islam, S.; Lockyer, B.; Rahman, A.; Sheard, L.; West, J.; et al. The Born in Bradford COVID-19 research study: Protocol for an adaptive mixed methods research study to gather actionable intelligence on the impact of COVID-19 on health inequalities amongst families living in Bradford. Wellcome Open Res. 2020, 5, 191. [Google Scholar] [CrossRef] [PubMed]
- Kroenke, K.; Strine, T.W.; Spitzer, R.L.; Williams, J.B.; Berry, J.T.; Mokdad, A.H. The PHQ-8 as a measure of current depression in the general population. J. Affect. Disord. 2009, 114, 163–173. [Google Scholar] [CrossRef] [PubMed]
- Spitzer, R.L.; Kroenke, K.; Williams, J.B.; Löwe, B. A brief measure for assessing generalized anxiety disorder: The GAD-7. Arch. Intern. Med. 2006, 166, 1092–1097. [Google Scholar] [CrossRef] [PubMed]
- Office for National Statistics. Census. 2011. Available online: https://www.ons.gov.uk/census/2011census (accessed on 2 May 2022).
- Williams, R. Using the margins command to estimate and interpret adjusted predictions and marginal effects. Stata J. 2012, 12, 308–331. [Google Scholar] [CrossRef]
- Nandi, A.; Platt, L. Briefing Note COVID-19 Survey: Ethnic Differences in Effects of COVID-19: Household and Local Context; Understanding Society at the Institute for Social and Economic Research: Colchester, UK, 2020. [Google Scholar]
- Shevlin, M.; McBride, O.; Murphy, J.; Miller, J.G.; Hartman, T.K.; Levita, L.; Mason, L.; Martinez, A.P.; McKay, R.; Stocks, T.V. Anxiety, depression, traumatic stress and COVID-19-related anxiety in the UK general population during the COVID-19 pandemic. BJPsych Open 2020, 6, e125. [Google Scholar] [CrossRef] [PubMed]
- Alvarez, E.C.; Kawachi, I.; Romani, J.R. Family social capital and health–A systematic review and redirection. Sociol. Health Illn. 2017, 39, 5–29. [Google Scholar] [CrossRef] [PubMed]
- Department for Levelling Up, Housing and Communities. Levelling Up the United Kingdom. 2022. Available online: https://www.gov.uk/government/publications/levelling-up-the-united-kingdom (accessed on 14 June 2022).


| Characteristics | Depressive Symptoms | ||||||||||
|---|---|---|---|---|---|---|---|---|---|---|---|
| None | Mild | Moderate | Moderately Severe | Severe | Total | ||||||
| n | % (95% CI) | n | % (95% CI) | n | % (95% CI) | n | % (95% CI) | n | % (95% CI) | n | |
| Overall | 1236 | 44% (42–46%) | 794 | 28% (27–30%) | 561 | 20% (19–22%) | 163 | 6% (5–7%) | 53 | 2% (1–2%) | 2807 |
| Ethnicity | |||||||||||
| White | |||||||||||
| British | 462 | 37% (35–40%) | 437 | 35% (33–38%) | 253 | 20% (18–23%) | 68 | 6% (4–7%) | 17 | 1% (1–2%) | 1237 |
| Irish | 13 | 11% (6–18%) | 21 | 17% (12–25%) | 84 | 69% (61–77%) | <5 | --- | <5 | --- | 121 |
| Any other White | 82 | 37% (31–44%) | 55 | 25% (20–31%) | 67 | 31% (25–37%) | 12 | 5% (3–9%) | 5 | 1% (1–4%) | 219 |
| Black/British Black | |||||||||||
| Caribbean | 23 | 50% (36–64%) | 8 | 17% (9–31%) | 7 | 15% (7–29%) | 5 | 11% (5–24%) | <5 | --- | 46 |
| African | 17 | 49% (33–65%) | 9 | 26% (14–42%) | <5 | --- | <5 | --- | <5 | --- | 35 |
| Asian/British Asian | |||||||||||
| Indian | 57 | 61% (50–70%) | 24 | 26% (18–35%) | 8 | 9% (4–16%) | 5 | 5% (2–12%) | 0 | --- | 94 |
| Pakistani | 415 | 63% (59–67%) | 127 | 19% (16–22%) | 69 | 10% (8–13%) | 35 | 5% (4–7%) | 13 | 2% (1–3%) | 659 |
| Bangladeshi | 71 | 36% (29–42%) | 60 | 30% (24–37%) | 41 | 21% (15–27%) | 22 | 11% (7–16%) | 6 | 3% (1–7%) | 200 |
| Any other Asian | 43 | 53% (42–64%) | 21 | 26% (18–37%) | 11 | 14% (8–23%) | 6 | 5% (2–12%) | <5 | --- | 81 |
| Any other ethnic group/Mixed | 53 | 46% (37–55%) | 32 | 28% (20–37%) | 17 | 15% (9–23%) | 6 | 5% (2–11%) | 7 | 6% (3–12%) | 115 |
| Relationship status | |||||||||||
| Single | 130 | 40% (34–45%) | 89 | 27% (23–32%) | 49 | 15% (11–19%) | 43 | 13% (10–17%) | 17 | 5% (3–8%) | 328 |
| Married/civil partnership | 980 | 45% (43–47%) | 618 | 28% (26–30%) | 462 | 21% (19–23%) | 108 | 5% (4–6%) | 26 | 1% (1–2%) | 2194 |
| Not married but in a relationship | 126 | 44% (39–50%) | 87 | 31% (25–36%) | 50 | 18% (14–22%) | 12 | 4% (2–7%) | 10 | 4% (2–6%) | 285 |
| Pregnancy status | |||||||||||
| No | 1147 | 46% (44–48%) | 733 | 29% (27–31%) | 435 | 17% (16–19%) | 150 | 6% (5–7%) | 50 | 2% (2–3%) | 2515 |
| Yes | 89 | 30% (25–36%) | 61 | 21% (17–26%) | 126 | 43% (38–49%) | 13 | 4% (3–8%) | <5 | --- | 292 |
| Home condition—mould or damp house | |||||||||||
| No | 976 | 46% (44–48%) | 629 | 30% (28–32%) | 384 | 18% (17–20%) | 97 | 5% (4–6%) | 28 | 1% (1–2%) | 2114 |
| Yes | 260 | 38% (34–41%) | 165 | 24% (21–27%) | 177 | 26% (22–29%) | 66 | 10% (8–12%) | 25 | 4% (2–5%) | 693 |
| Worrying about job security | |||||||||||
| Strongly disagree | 219 | 57% (52–62%) | 80 | 21% (17–25%) | 53 | 14% (11–18%) | 23 | 6% (4–9%) | 8 | 2% (1–4%) | 383 |
| Disagree | 339 | 49% (45–53%) | 182 | 26% (23–30%) | 139 | 20% (17–23%) | 25 | 4% (2–5%) | 6 | 1% (0.4–2%) | 691 |
| Neither agree or disagree | 271 | 41% (37–45%) | 175 | 27% (23–30%) | 155 | 24% (20–27%) | 39 | 6% (4–8%) | 19 | 3% (2–4%) | 659 |
| Agree | 297 | 40% (37–44%) | 237 | 32% (29–36%) | 146 | 20% (17–23%) | 48 | 7% (5–9%) | 7 | 1% (0.4–2%) | 735 |
| Strongly agree | 110 | 32% (28–38%) | 120 | 35% (30–41%) | 68 | 20% (16–25%) | 28 | 8% (6–12%) | 13 | 4% (2–6%) | 339 |
| Food insecurity—Food didn’t last | |||||||||||
| Never true | 1074 | 52% (50–54%) | 616 | 30% (28–32%) | 274 | 13% (12–15%) | 78 | 4% (3–5%) | 19 | 1% (1–2%) | 2061 |
| Sometimes true | 132 | 26% (22–30%) | 139 | 27% (23–31%) | 172 | 34% (30–38%) | 48 | 9% (7–12%) | 21 | 4% (3–6%) | 512 |
| Often true | 30 | 13% (9–18%) | 39 | 17% (12–22%) | 115 | 49% (43–56%) | 37 | 16% (12–21%) | 13 | 6% (3–9%) | 234 |
| Food insecurity—Couldn’t afford balanced meals | |||||||||||
| Never true | 1065 | 51% (49–54%) | 620 | 30% (28–32%) | 286 | 14% (12–15%) | 81 | 4% (3–5%) | 20 | 1% (1–2%) | 2072 |
| Sometimes true | 125 | 26% (23–31%) | 124 | 26% (22–30%) | 158 | 33% (29–38%) | 48 | 10% (8–13%) | 19 | 4% (3–6%) | 474 |
| Often true | 46 | 18% (13–23%) | 50 | 19% (15–24%) | 117 | 45% (39–51%) | 34 | 13% (9–18%) | 14 | 5% (3–9%) | 261 |
| Food insecurity—Have been hungry? | |||||||||||
| No | 1208 | 49% (47–51%) | 734 | 30% (28–32%) | 386 | 16% (14–17%) | 105 | 4% (4–5%) | 34 | 1% (1–2%) | 2467 |
| Yes | 28 | 8% (6–12%) | 60 | 18% (14–22%) | 175 | 51% (46–57%) | 58 | 17% (13–21%) | 19 | 6% (4–9%) | 340 |
| Financial insecurity—How are you getting on? | |||||||||||
| Living comfortably | 368 | 62% (58–65%) | 151 | 25% (22–29%) | 56 | 9% (7–12%) | 21 | 4% (2–5%) | <5 | --- | 597 |
| Doing alright | 566 | 48% (45–51%) | 322 | 27% (25–30%) | 224 | 19% (17–21%) | 47 | 4% (3–5%) | 13 | 1% (1–2%) | 1172 |
| Just about getting by | 236 | 32% (29–36%) | 247 | 34% (31–37%) | 184 | 25% (22–29%) | 45 | 6% (5–8%) | 16 | 2% (1–4%) | 728 |
| Finding it quite difficult | 48 | 23% (18–29%) | 56 | 26% (21–33%) | 69 | 33% (27–39%) | 27 | 13% (9–18%) | 12 | 6% (3–10%) | 212 |
| Finding it very difficult | 18 | 18% (12–27%) | 18 | 18% (12–27%) | 28 | 29% (21–38%) | 23 | 23% (16–33%) | 11 | 11% (6–19%) | 98 |
| Relationship quality with partner | |||||||||||
| NA-Single | 130 | 40% (34–45%) | 89 | 27% (23–32%) | 49 | 15% (11–19%) | 43 | 13% (10–17%) | 17 | 5% (3–8%) | 328 |
| Excellent | 602 | 60% (57–63%) | 237 | 24% (21–26%) | 125 | 12% (11–15%) | 24 | 2% (2–4%) | 14 | 1% (1–2%) | 1002 |
| Good | 433 | 41% (38–44%) | 336 | 32% (29–35%) | 224 | 21% (19–24%) | 47 | 4% (3–6%) | 11 | 1% (1–2%) | 1051 |
| Average | 63 | 18% (14–23%) | 119 | 34% (29–39%) | 137 | 39% (34–45%) | 24 | 7% (5–10%) | 5 | 1% (1–3%) | 348 |
| Poor | 5 | 10% (4–22%) | 9 | 18% (10–31%) | 18 | 36% (24–50%) | 16 | 32% (21–46%) | <5 | --- | 50 |
| Very poor | <5 | --- | <5 | 14% (5–32%) | 8 | 29% (15–48%) | 9 | 32% (18–51%) | <5 | --- | 28 |
| Social support—No. of people you can count on | |||||||||||
| 0–2: Low | 196 | 29% (25–32%) | 206 | 30% (27–34%) | 183 | 27% (24–30%) | 76 | 11% (9–14%) | 22 | 3% (2–5%) | 683 |
| 3–6: Medium | 582 | 42% (39–44%) | 414 | 30% (27–32%) | 310 | 22% (20–24%) | 71 | 5% (4–6%) | 20 | 1% (1–2%) | 1397 |
| 7 and more: High | 458 | 63% (59–66%) | 174 | 24% (21–27%) | 68 | 9% (7–12%) | 16 | 2% (1–4%) | 11 | 2% (1–3%) | 727 |
| Social support—No. of people you can count on living locally | |||||||||||
| 0–2: Low | 490 | 35% (33–38%) | 470 | 34% (31–36%) | 282 | 20% (18–23%) | 110 | 8% (7–9%) | 34 | 2% (2–3%) | 1386 |
| 3–6: Medium | 523 | 49% (46–52%) | 255 | 24% (21–27%) | 236 | 22% (20–25%) | 43 | 4% (3–5%) | 12 | 2% (1–2%) | 1069 |
| 7 and more: High | 223 | 63% (58–68%) | 69 | 20% (16–24%) | 43 | 12% (9–16%) | 10 | 3% (2–5%) | 7 | 2% (1–4%) | 352 |
| Loneliness | |||||||||||
| None/almost none of the time | 891 | 68% (65–70%) | 288 | 22% (20–24%) | 106 | 8% (7–10%) | 22 | 2% (1–3%) | 6 | 0.5% (0.2–1%) | 1313 |
| Some of the time | 314 | 32% (29–35%) | 371 | 37% (34–40%) | 2401 | 24% (22–27%) | 60 | 6% (5–8%) | 10 | 1% (1–2%) | 995 |
| Most of the time | 26 | 7% (5–10%) | 113 | 29% (25–34%) | 77 | 46% (41–51%) | 47 | 12% (9–16%) | 21 | 5% (4–8%) | 384 |
| All/almost all of the time | 5 | 4% (2–10%) | 22 | 19% (13–27%) | 38 | 33% (25–42%) | 34 | 30% (22–39%) | 16 | 14% (9–22%) | 115 |
| Univariate | Multivariate | ||||
|---|---|---|---|---|---|
| Unadjusted | Adjusted for Location of Residency Only | Adjusted for Loneliness Only | Adjusted for Social Support Only | Adjusted for Financial Insecurity Only | |
| OR (95% CI) | OR (95% CI) | OR (95% CI) | OR (95% CI) | OR (95% CI) | |
| Ethnicity | |||||
| White other | 2.63 | 1.88 | 1.81 | 2.23 | 2.36 |
| (2.05–3.36) | (1.45–2.43) | (1.37–2.39) | (1.73–2.88) | (1.83–3.04) | |
| Black/British Black: Caribbean/African | 1.12 | 1.09 | 1.24 | 1 | 0.91 |
| (0.68–1.83) | (0.65–1.80) | (0.71–2.18) | (0.59–1.64) | (0.55–1.51) | |
| Asian/British Asian: Indian | 0.43 | 0.43 | 0.57 | 0.43 | 0.43 |
| (0.23–0.78) | (0.24–0.80) | (0.30–1.09) | (0.23–0.79) | (0.24–0.79) | |
| Asian/British Asian: Pakistani | 0.57 | 0.97 | 0.82 | 0.59 | 0.52 |
| (0.45–0.73) | (0.74–1.26) | (0.64–1.07) | (0.47–0.75) | (0.41–0.66) | |
| Asian/British Asian: Bangladeshi | 1.4 | 1.05 | 1.39 | 1.35 | 1.04 |
| (1.02–1.92) | (0.76–1.45) | (0.98–1.98) | (0.97–1.87) | (0.75–1.44) | |
| Other | 0.84 | 0.72 | 0.97 | 0.78 | 0.75 |
| (0.59–1.19) | (0.50–1.03) | (0.66–1.43) | (0.55–1.12) | (0.52–1.08) | |
| White British | 1 | 1 | 1 | 1 | 1 |
| Location of residency | |||||
| London | 3.25 | 2.87 | |||
| (2.73–3.87) | (2.32–3.54) | ||||
| Bradford | 1 | 1 | |||
| Loneliness | |||||
| Some of the time | 3.98 | 3.67 | |||
| (3.18–4.98) | (2.93–4.61) | ||||
| All of the time | 17.65 | 15.31 | |||
| (13.64–22.85) | (11.76–19.93) | ||||
| None of the time | 1 | 1 | |||
| Social Support | |||||
| Medium (3–6) | 2.68 | 2.43 | |||
| (2.10–3.42) | (1.90–3.12) | ||||
| Low (0–2) | 4.65 | 4.08 | |||
| (3.57–6.06) | (3.11–5.34) | ||||
| High (+7) | 1 | 1 | |||
| Financial insecurity | |||||
| Insecure | 2.59 | 2.57 | |||
| (2.19–3.07) | (2.15–3.06) | ||||
| Secure | 1 | 1 | |||
Publisher’s Note: MDPI stays neutral with regard to jurisdictional claims in published maps and institutional affiliations. |
© 2022 by the authors. Licensee MDPI, Basel, Switzerland. This article is an open access article distributed under the terms and conditions of the Creative Commons Attribution (CC BY) license (https://creativecommons.org/licenses/by/4.0/).
Share and Cite
McIvor, C.; Vafai, Y.; Kelly, B.; O’Toole, S.E.; Heys, M.; Badrick, E.; Iqbal, H.; Pickett, K.E.; Cameron, C.; Dickerson, J. The Impact of the Pandemic on Mental Health in Ethnically Diverse Mothers: Findings from the Born in Bradford, Tower Hamlets and Newham COVID-19 Research Programmes. Int. J. Environ. Res. Public Health 2022, 19, 14316. https://doi.org/10.3390/ijerph192114316
McIvor C, Vafai Y, Kelly B, O’Toole SE, Heys M, Badrick E, Iqbal H, Pickett KE, Cameron C, Dickerson J. The Impact of the Pandemic on Mental Health in Ethnically Diverse Mothers: Findings from the Born in Bradford, Tower Hamlets and Newham COVID-19 Research Programmes. International Journal of Environmental Research and Public Health. 2022; 19(21):14316. https://doi.org/10.3390/ijerph192114316
Chicago/Turabian StyleMcIvor, Claire, Yassaman Vafai, Brian Kelly, Sarah E. O’Toole, Michelle Heys, Ellena Badrick, Halima Iqbal, Kate E. Pickett, Claire Cameron, and Josie Dickerson. 2022. "The Impact of the Pandemic on Mental Health in Ethnically Diverse Mothers: Findings from the Born in Bradford, Tower Hamlets and Newham COVID-19 Research Programmes" International Journal of Environmental Research and Public Health 19, no. 21: 14316. https://doi.org/10.3390/ijerph192114316
APA StyleMcIvor, C., Vafai, Y., Kelly, B., O’Toole, S. E., Heys, M., Badrick, E., Iqbal, H., Pickett, K. E., Cameron, C., & Dickerson, J. (2022). The Impact of the Pandemic on Mental Health in Ethnically Diverse Mothers: Findings from the Born in Bradford, Tower Hamlets and Newham COVID-19 Research Programmes. International Journal of Environmental Research and Public Health, 19(21), 14316. https://doi.org/10.3390/ijerph192114316