


The Long-Term Impact of COVID-19 Lockdowns in Istanbul


Abstract
:1. Introduction
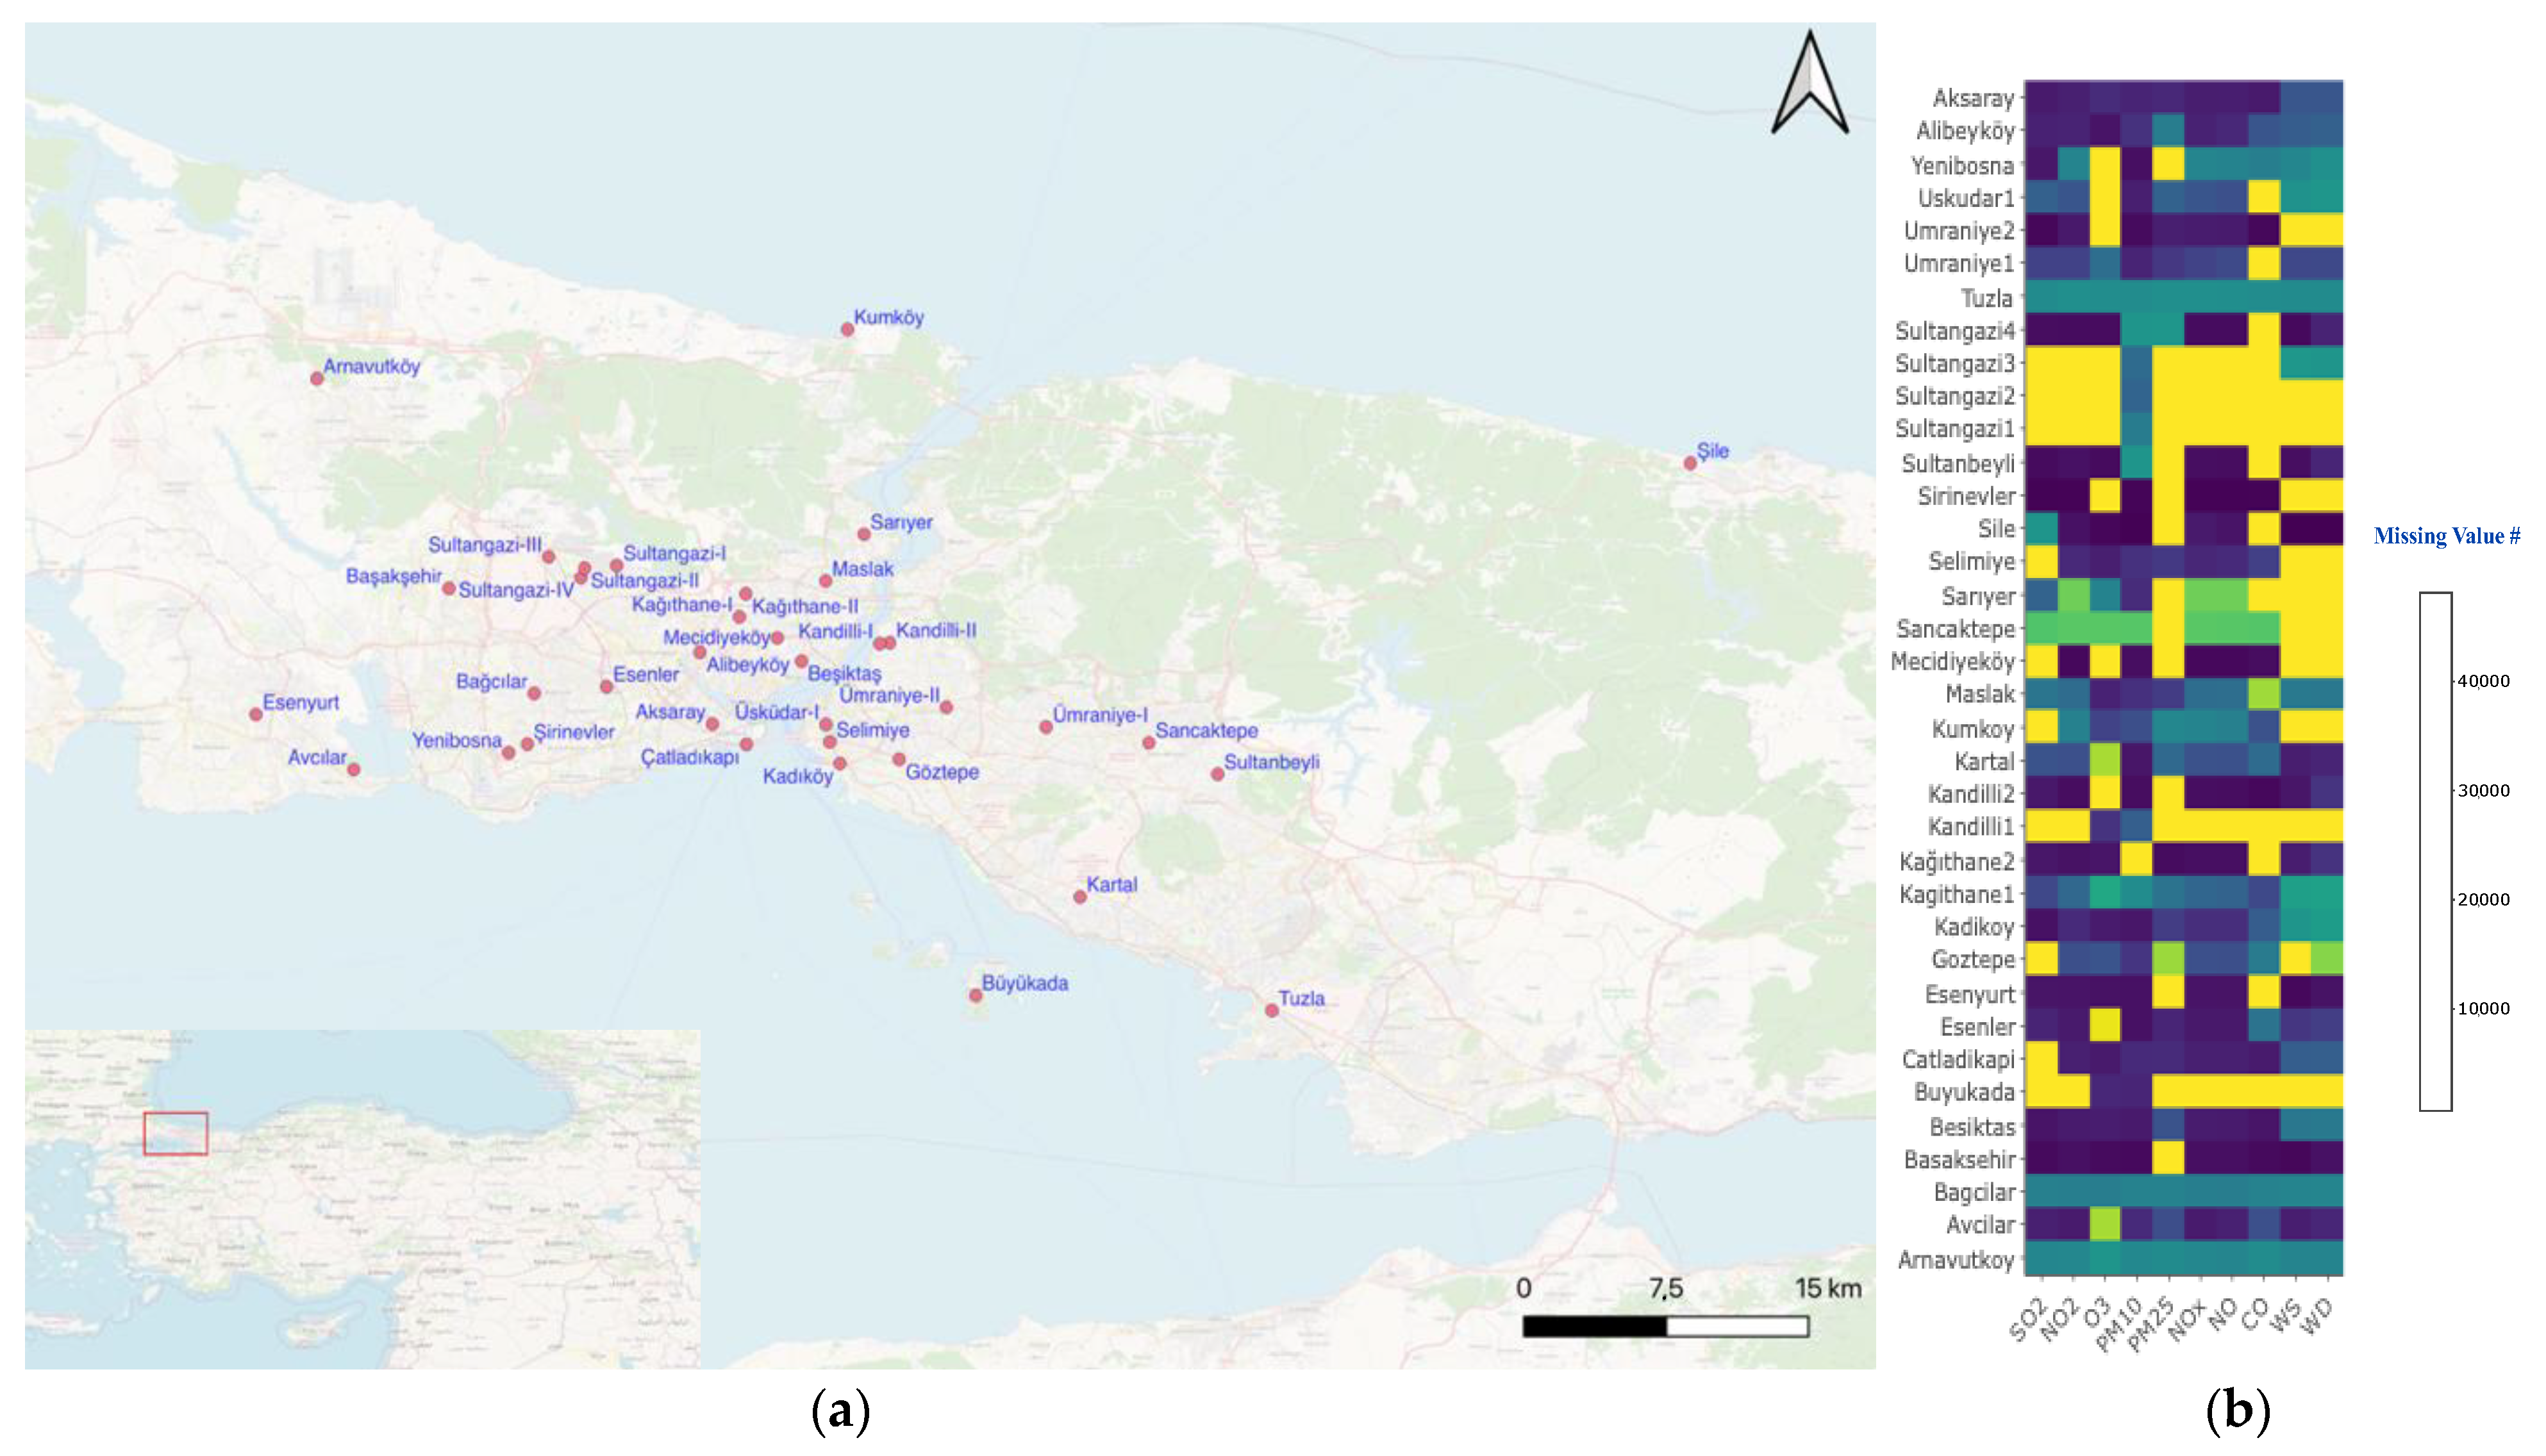
2. Data and Methods
- Phase I: 12 March 2016–30 June 2017 (Before Lockdowns I)
- Phase II: 12 March 2018–30 June 2019 (Before Lockdowns II)
- Phase III: 12 March 2020–30 June 2021 (During Lockdowns)
3. Results and Discussion
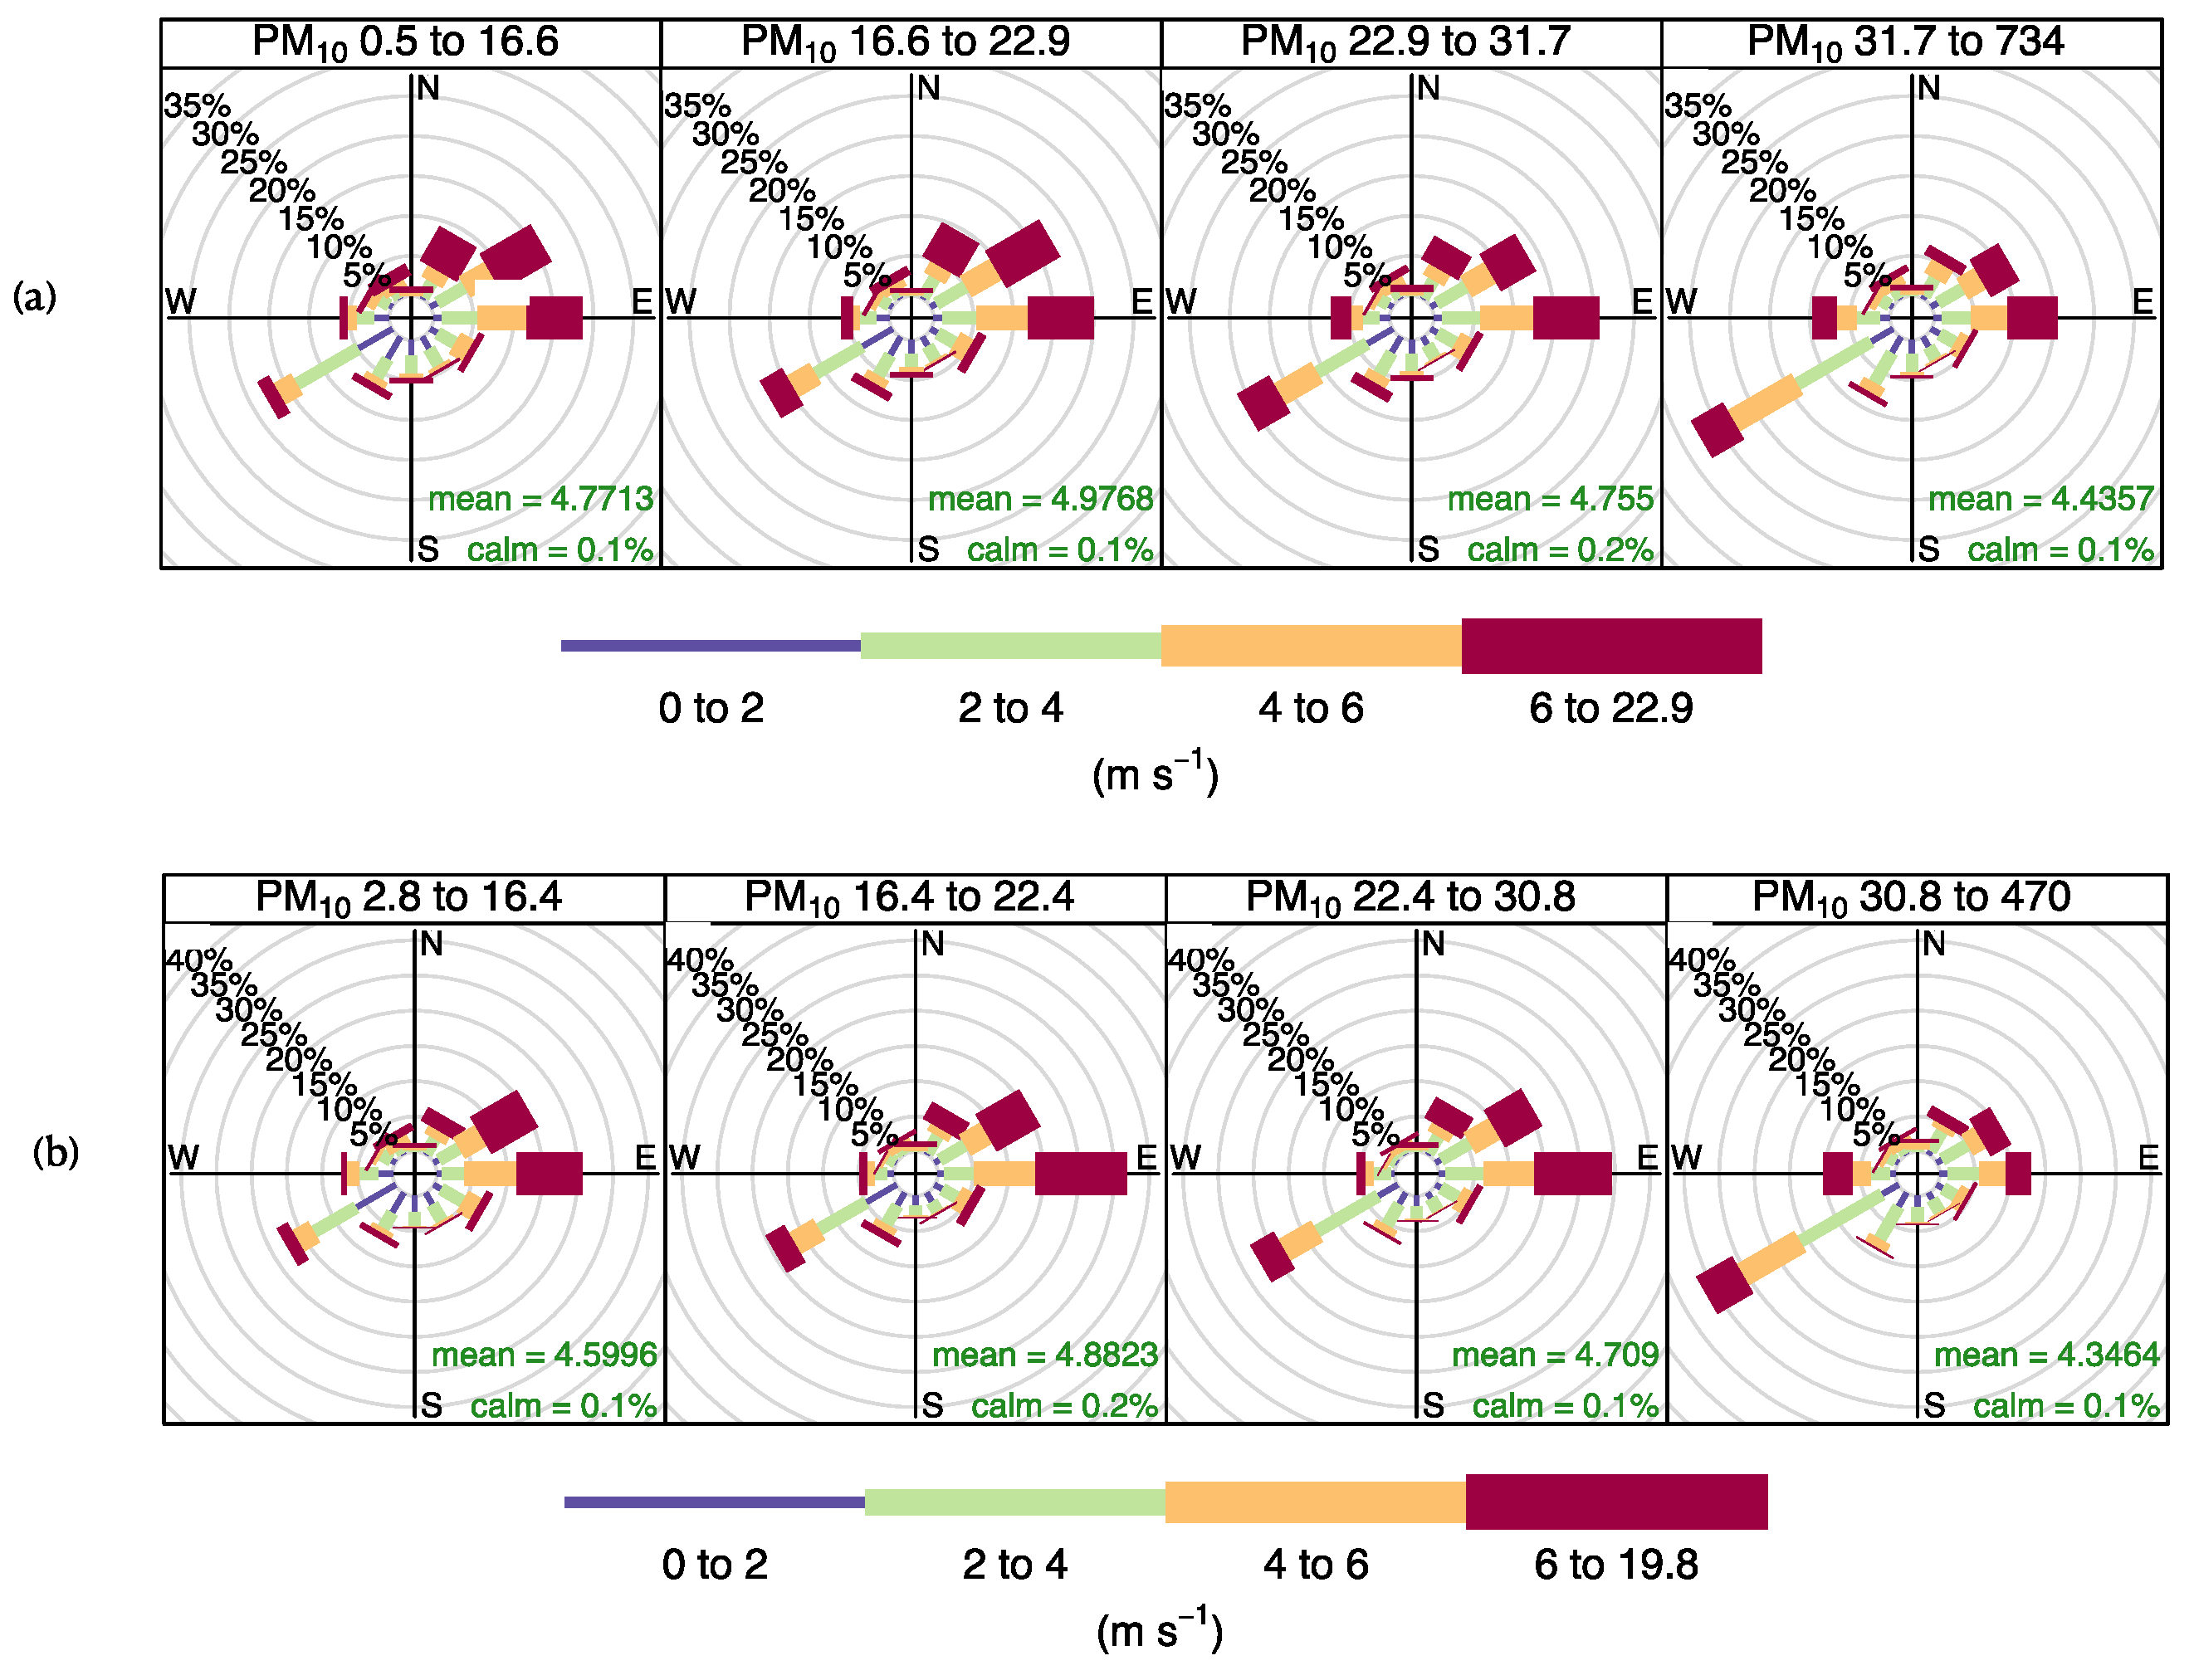
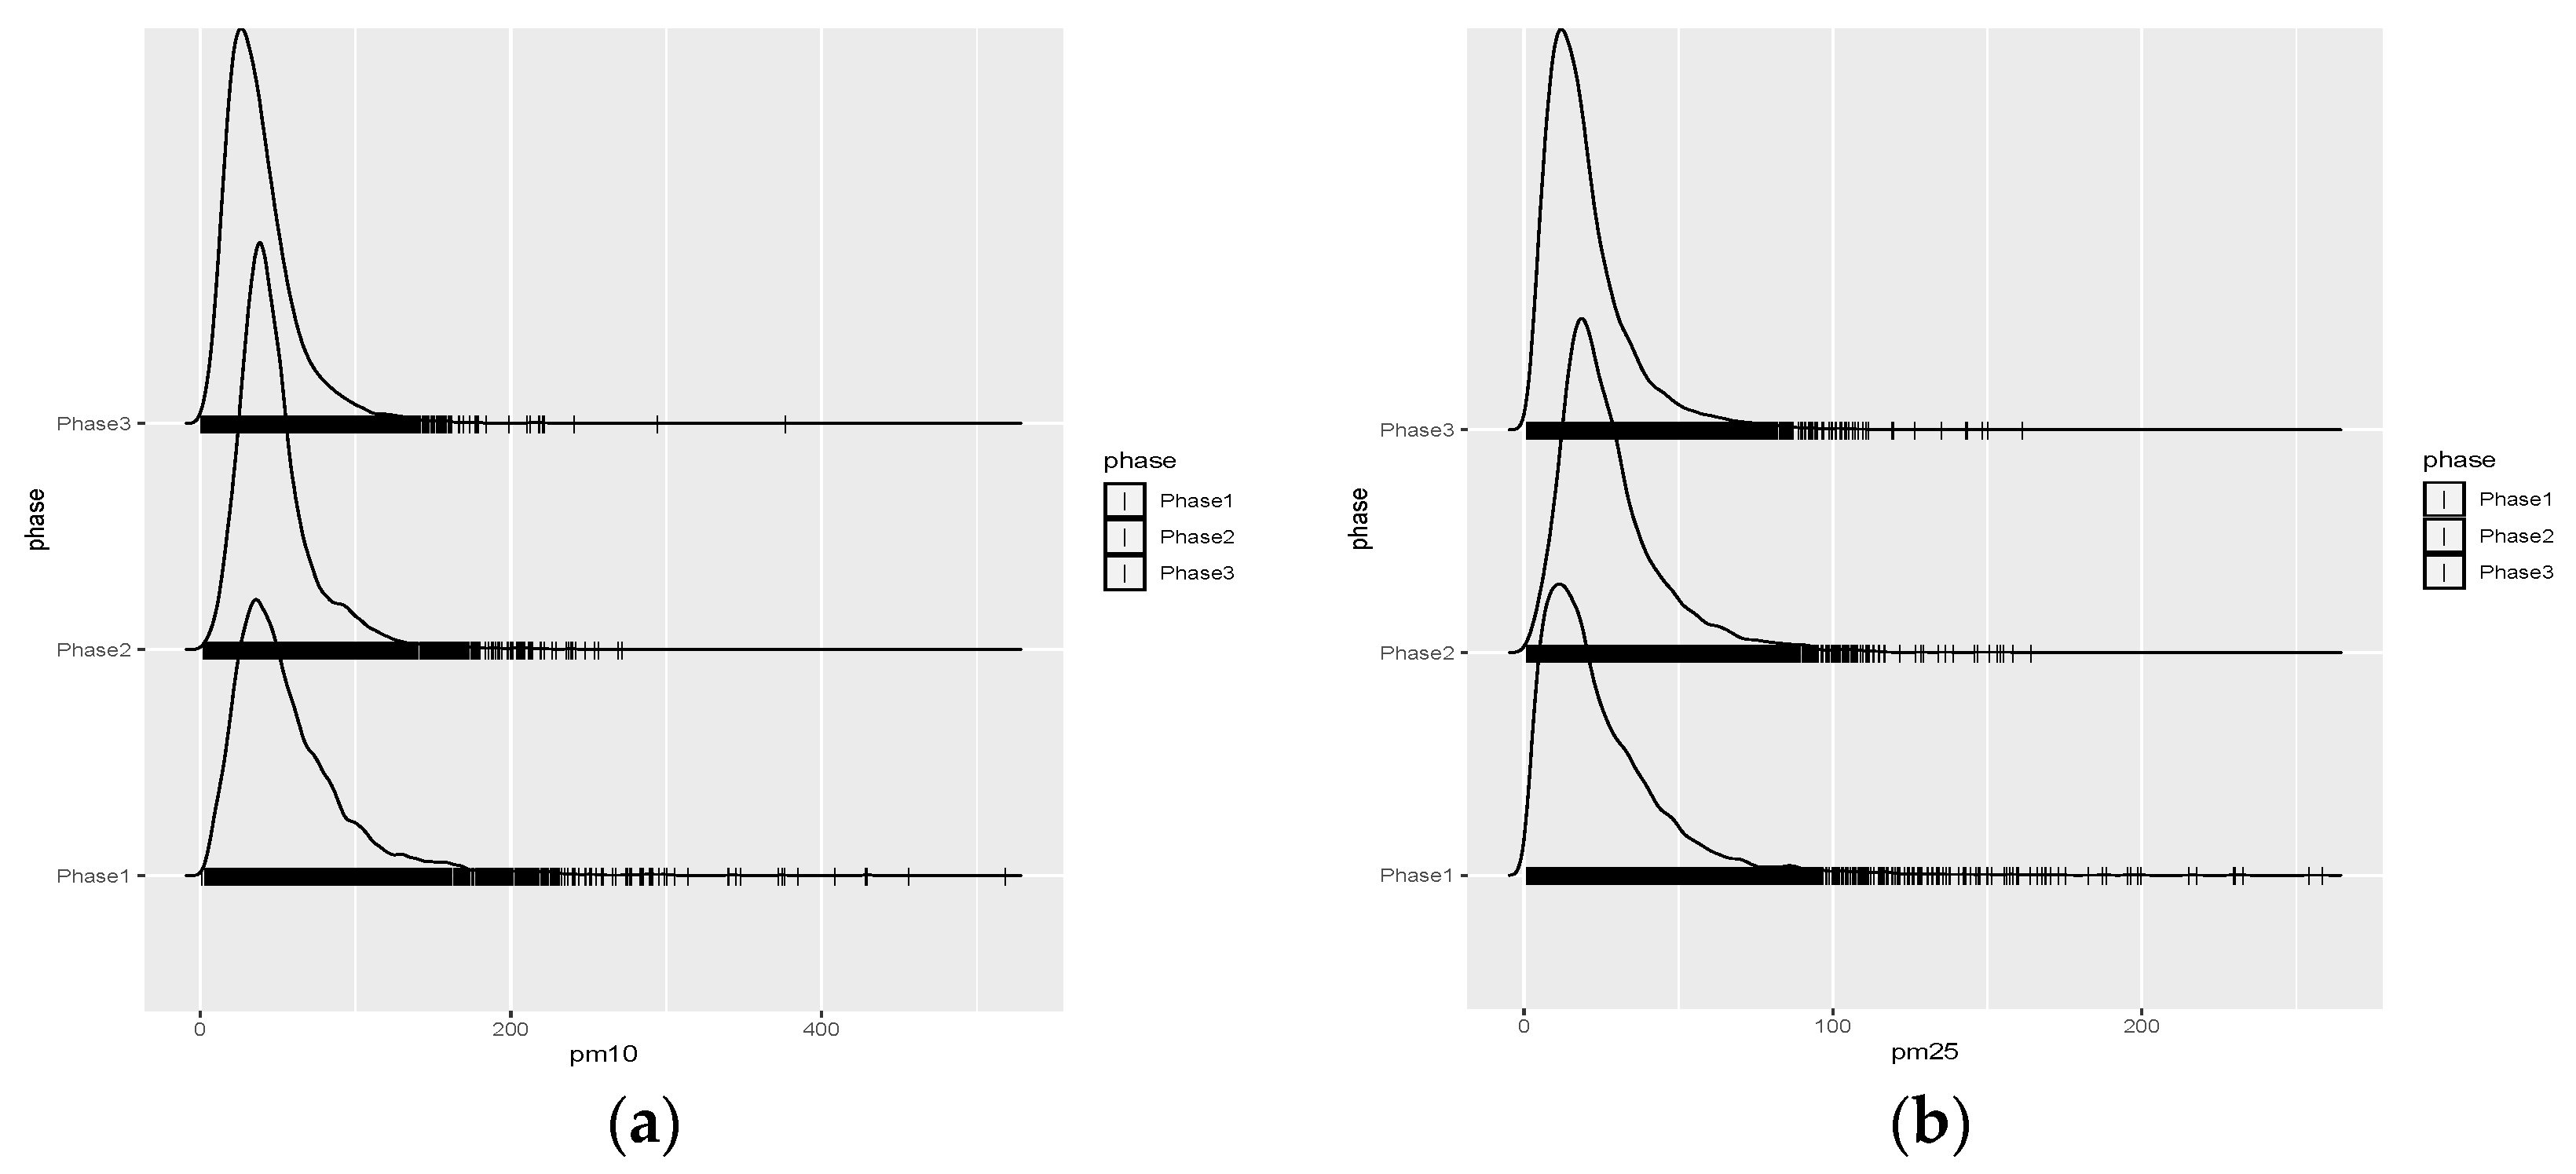
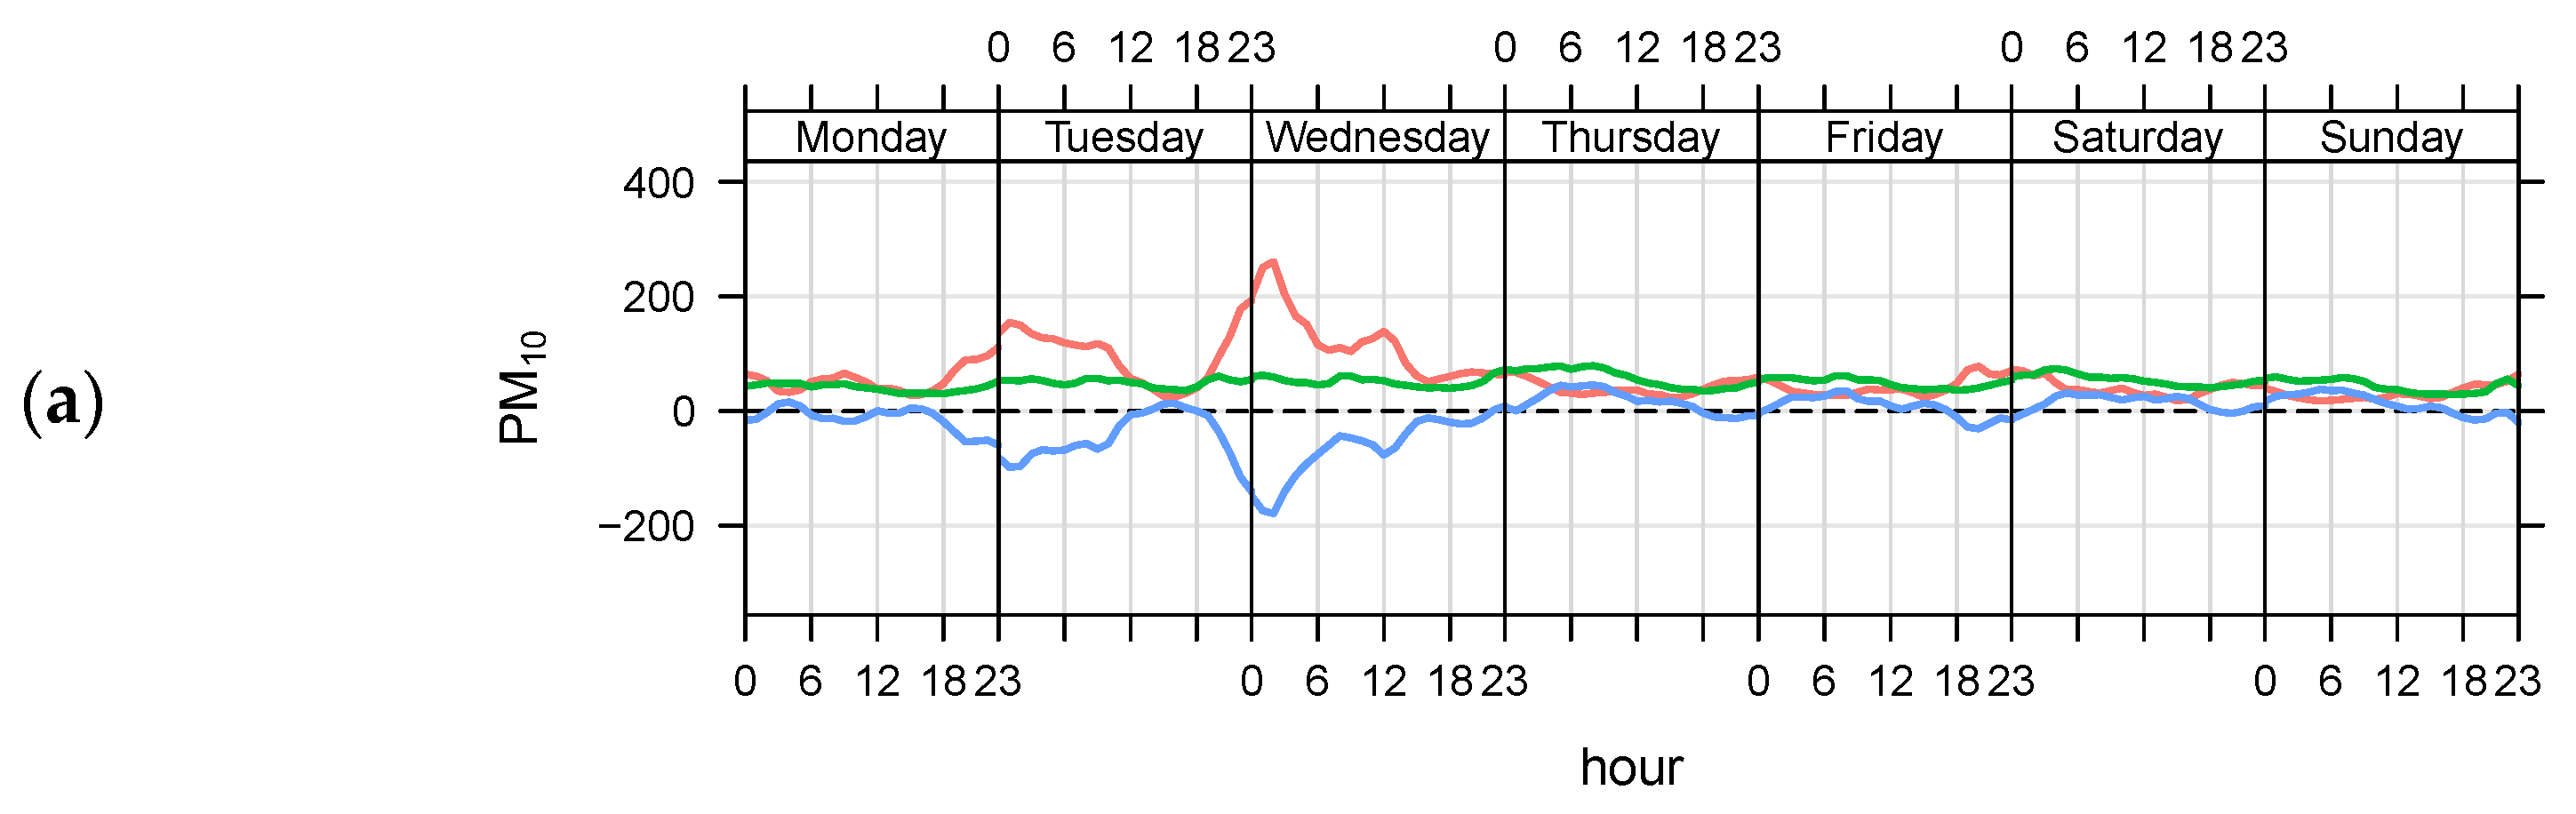
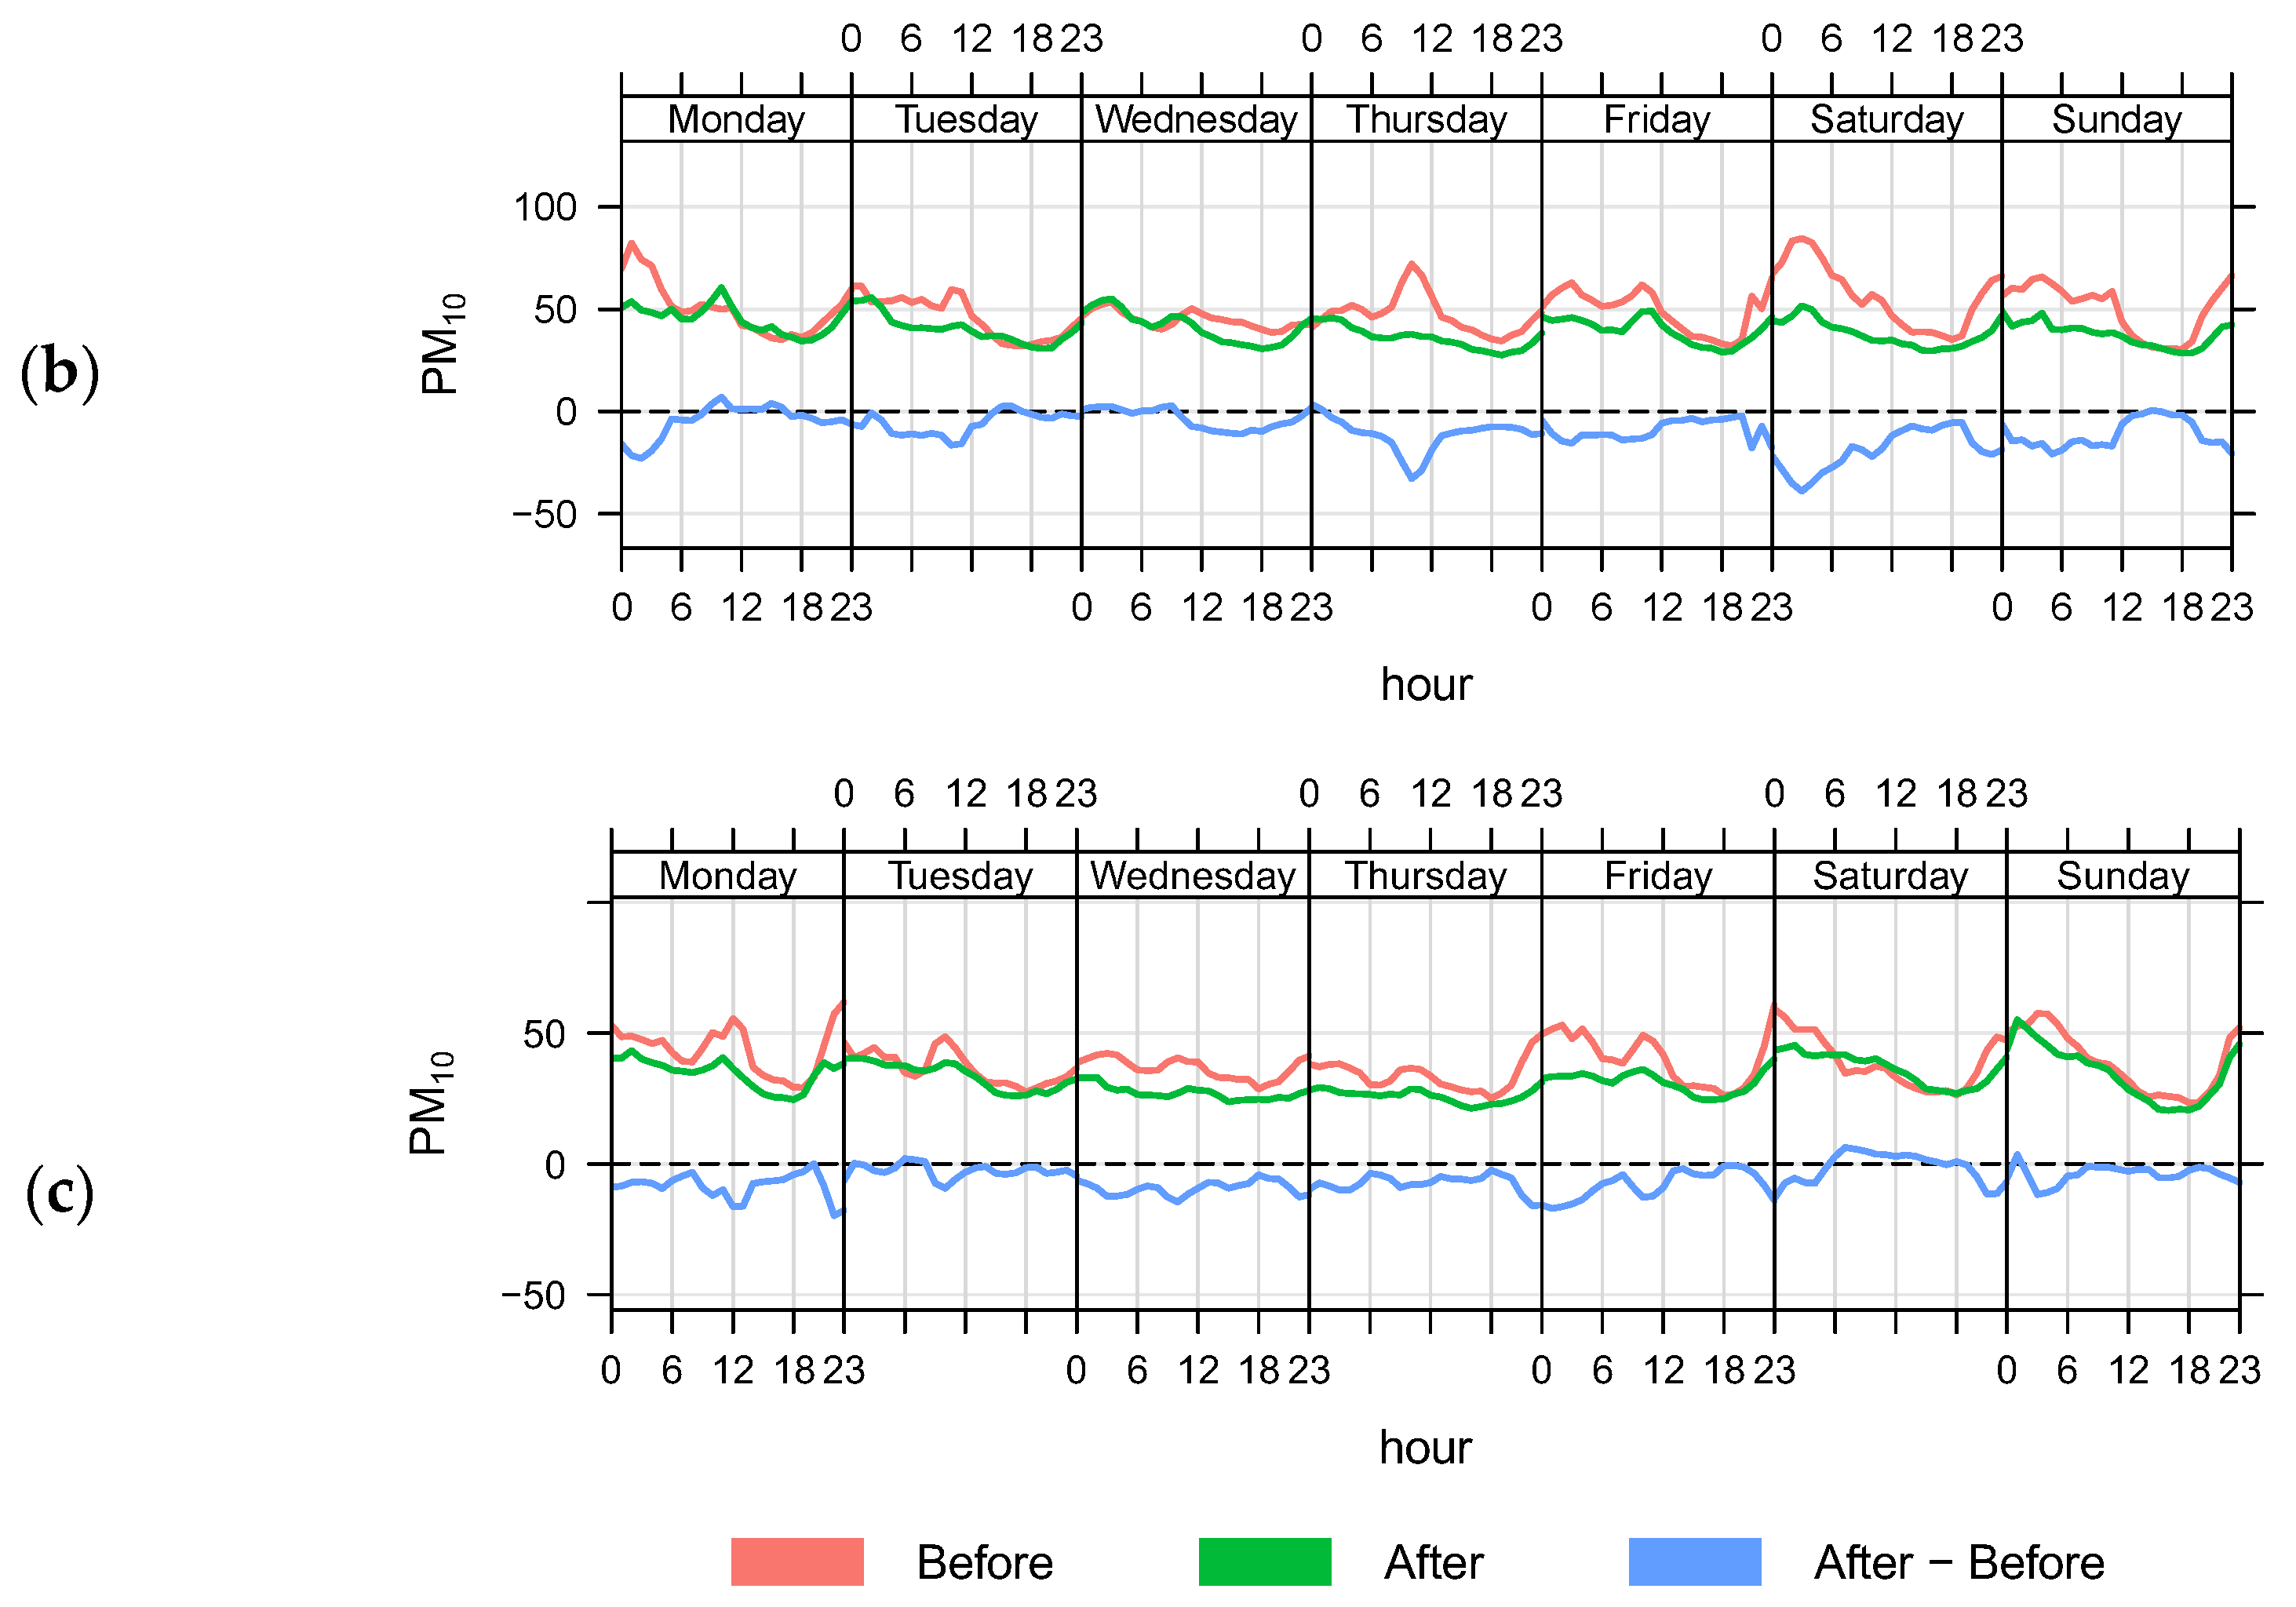
3.1. Particulate Matter (PMs)
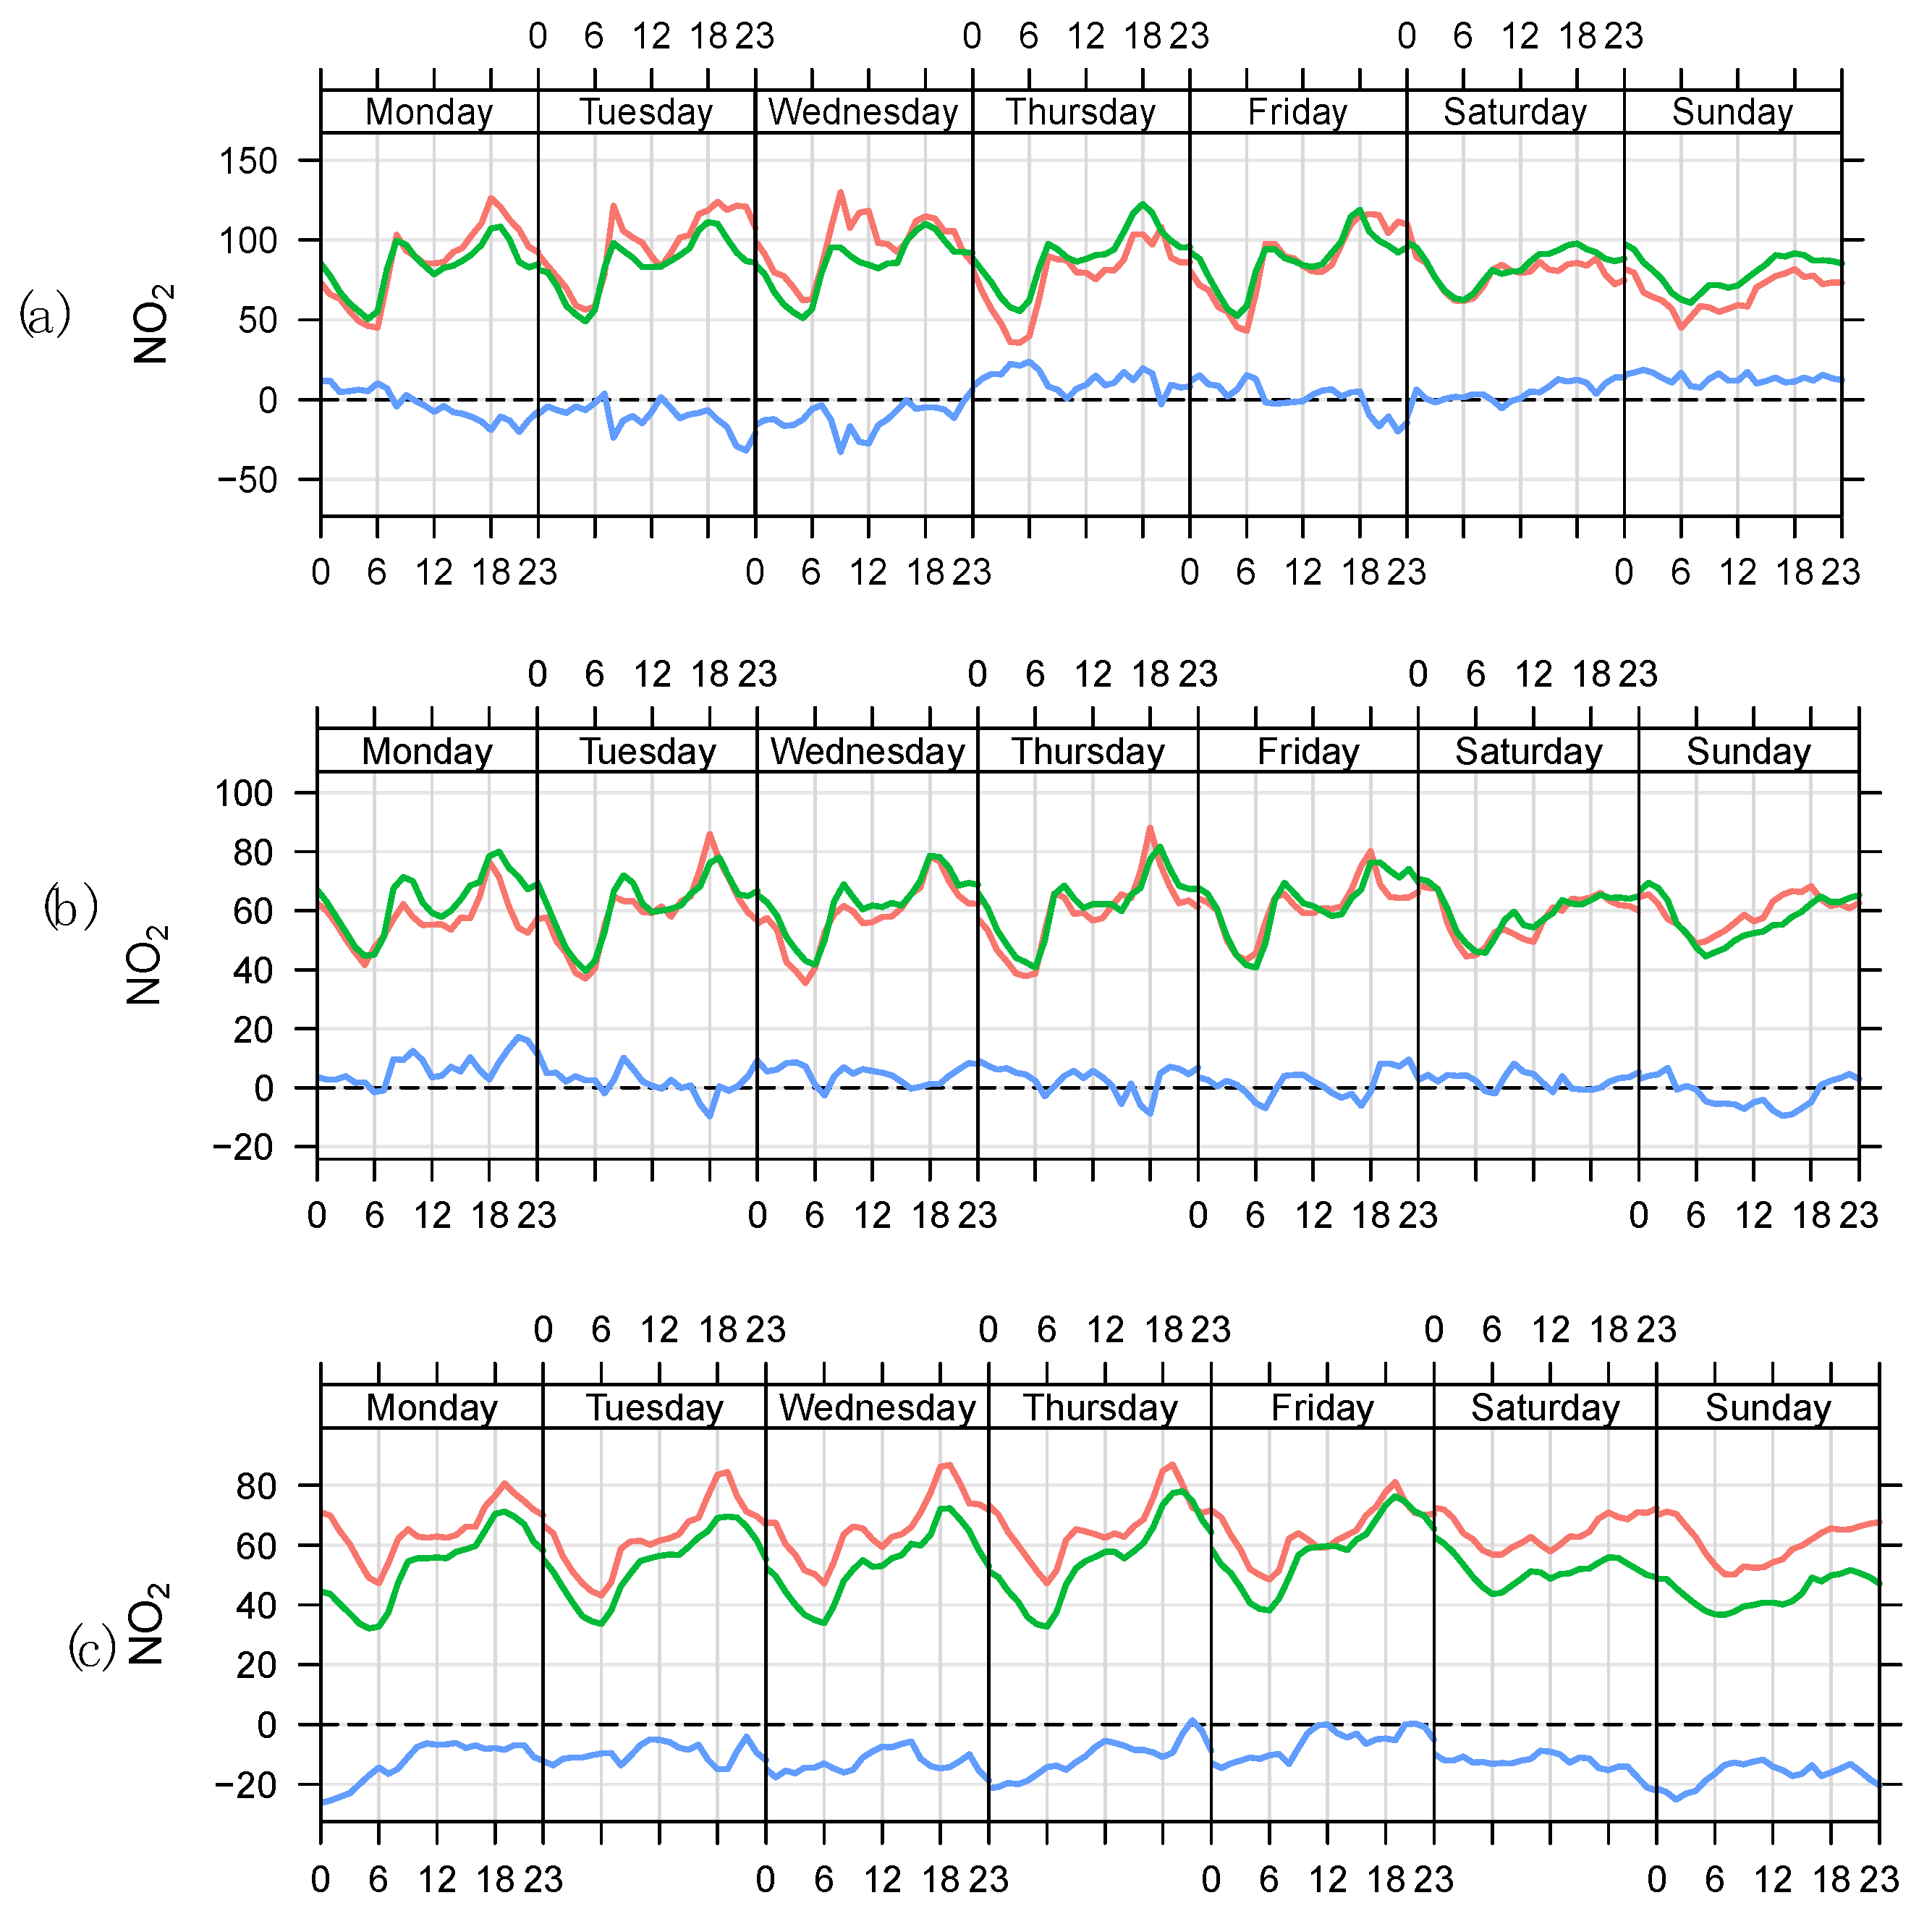
3.2. Nitrogen Oxides
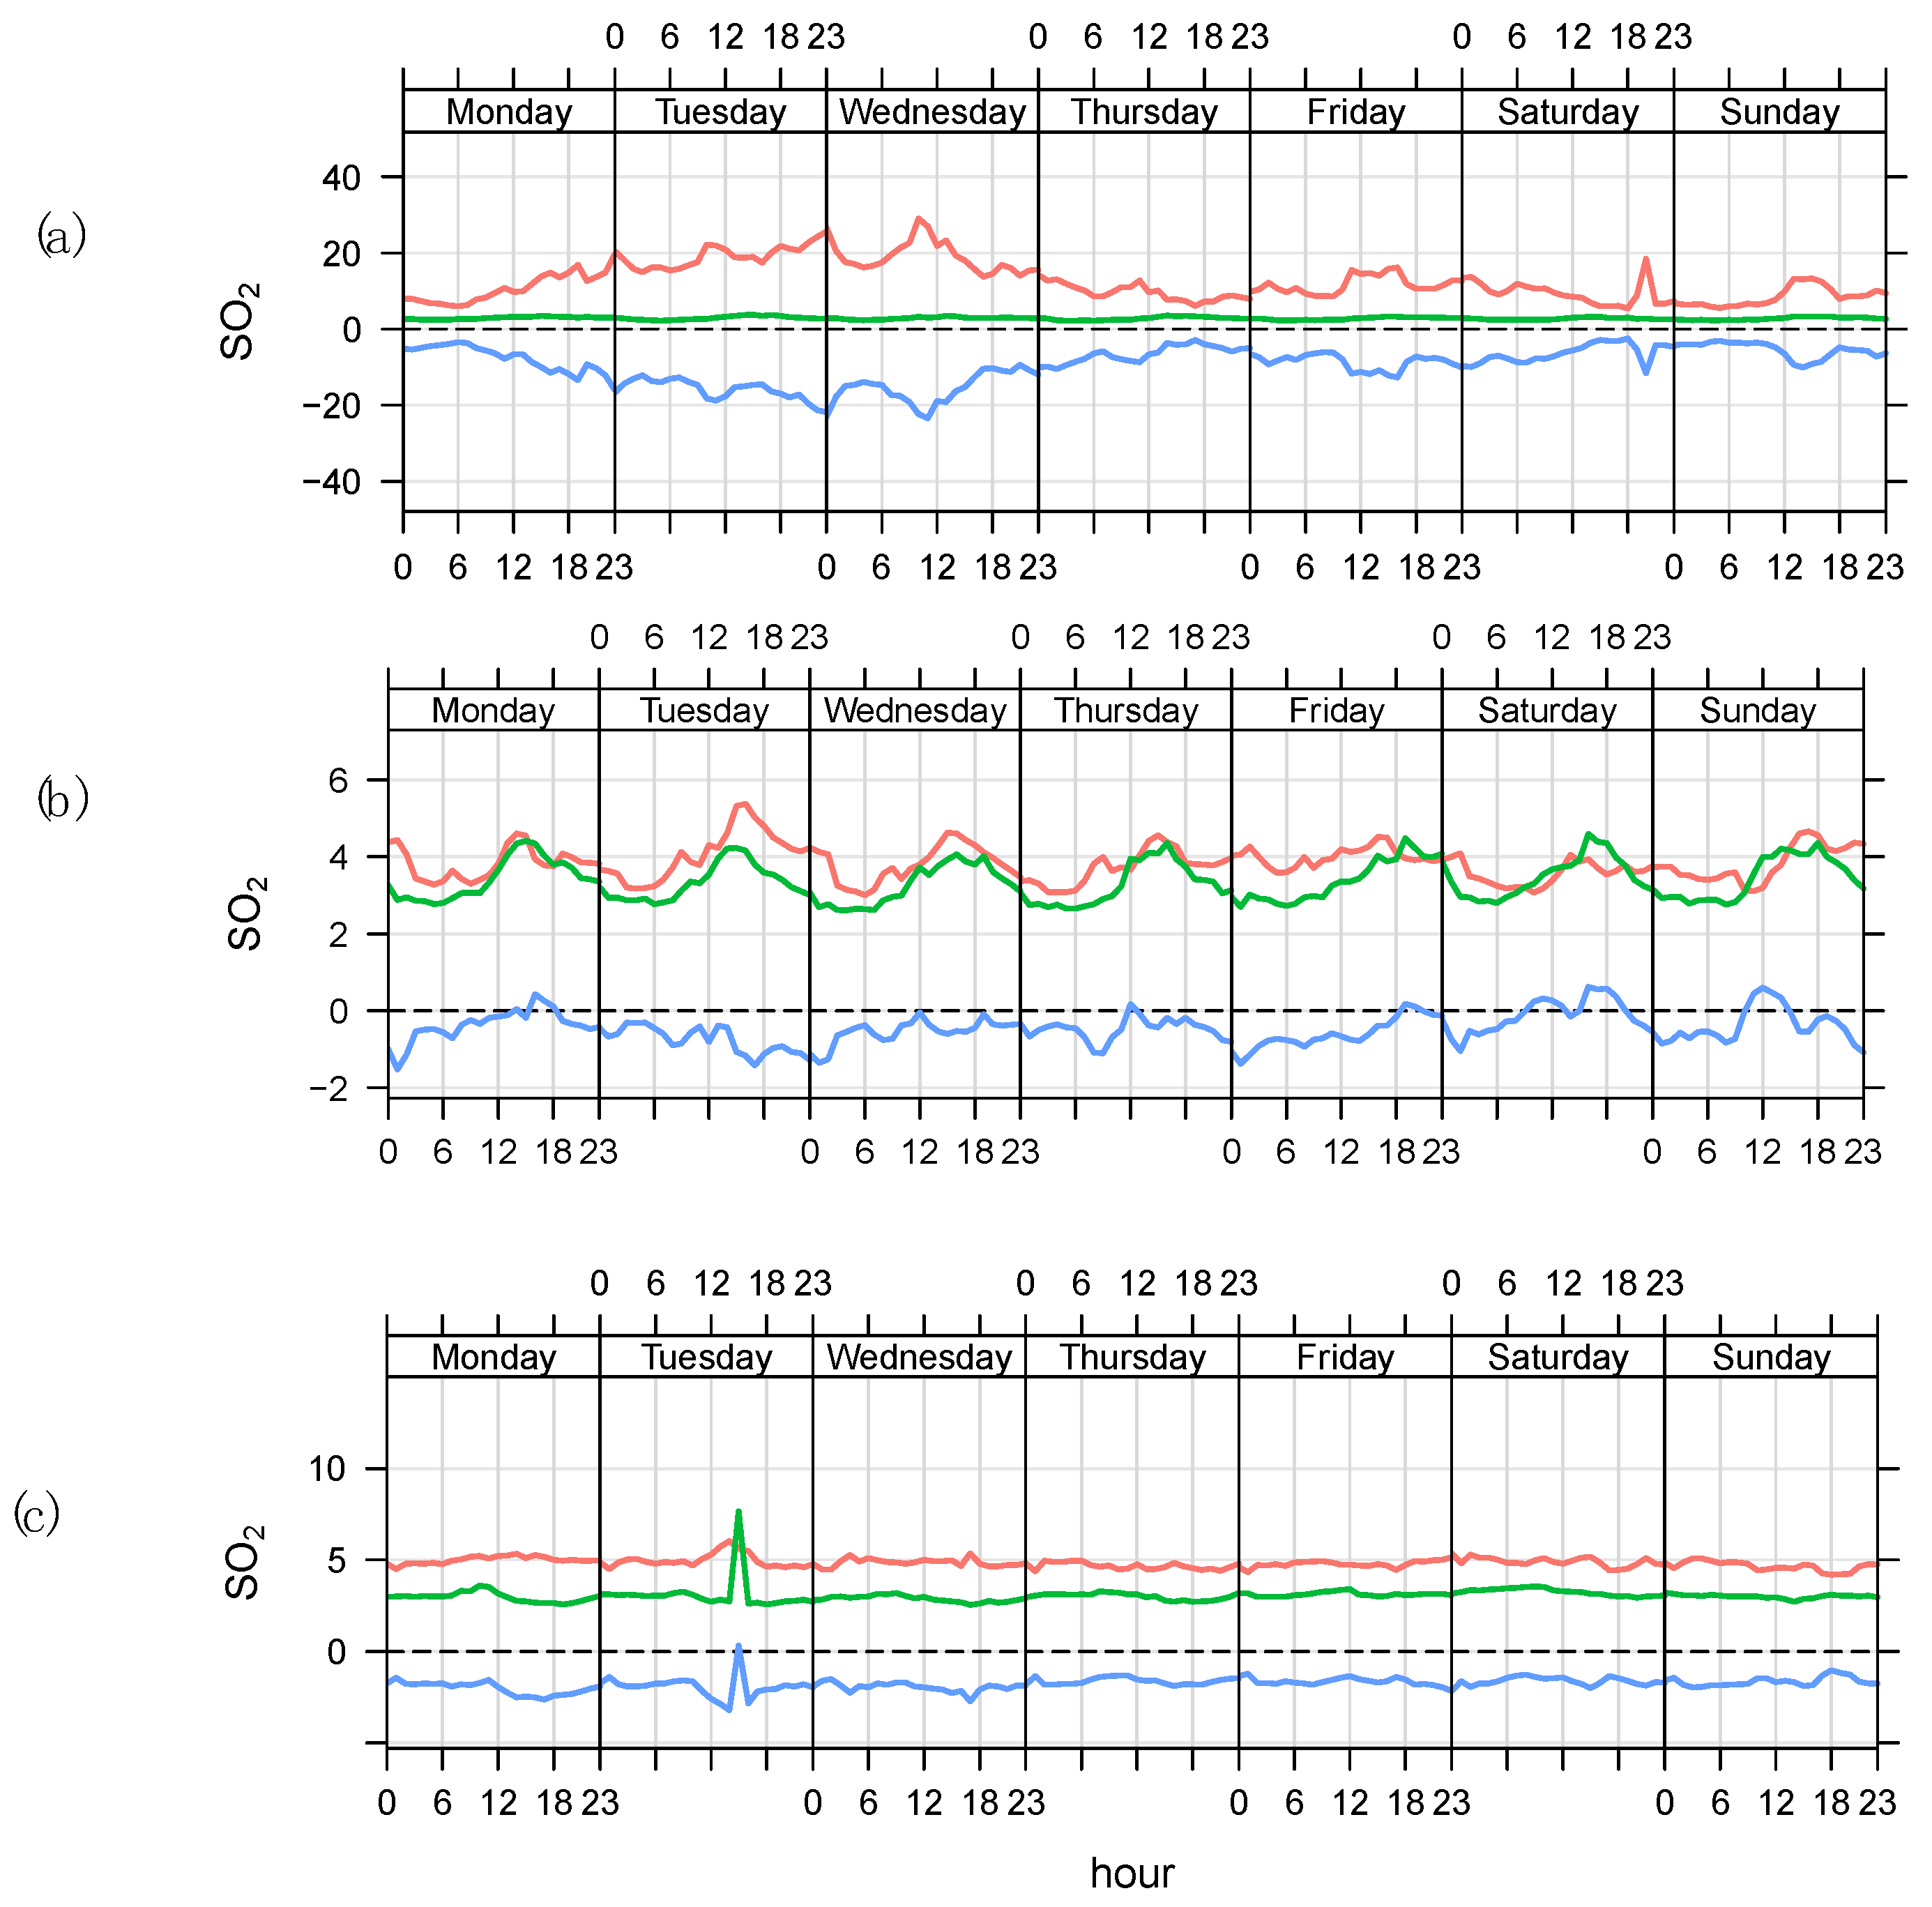
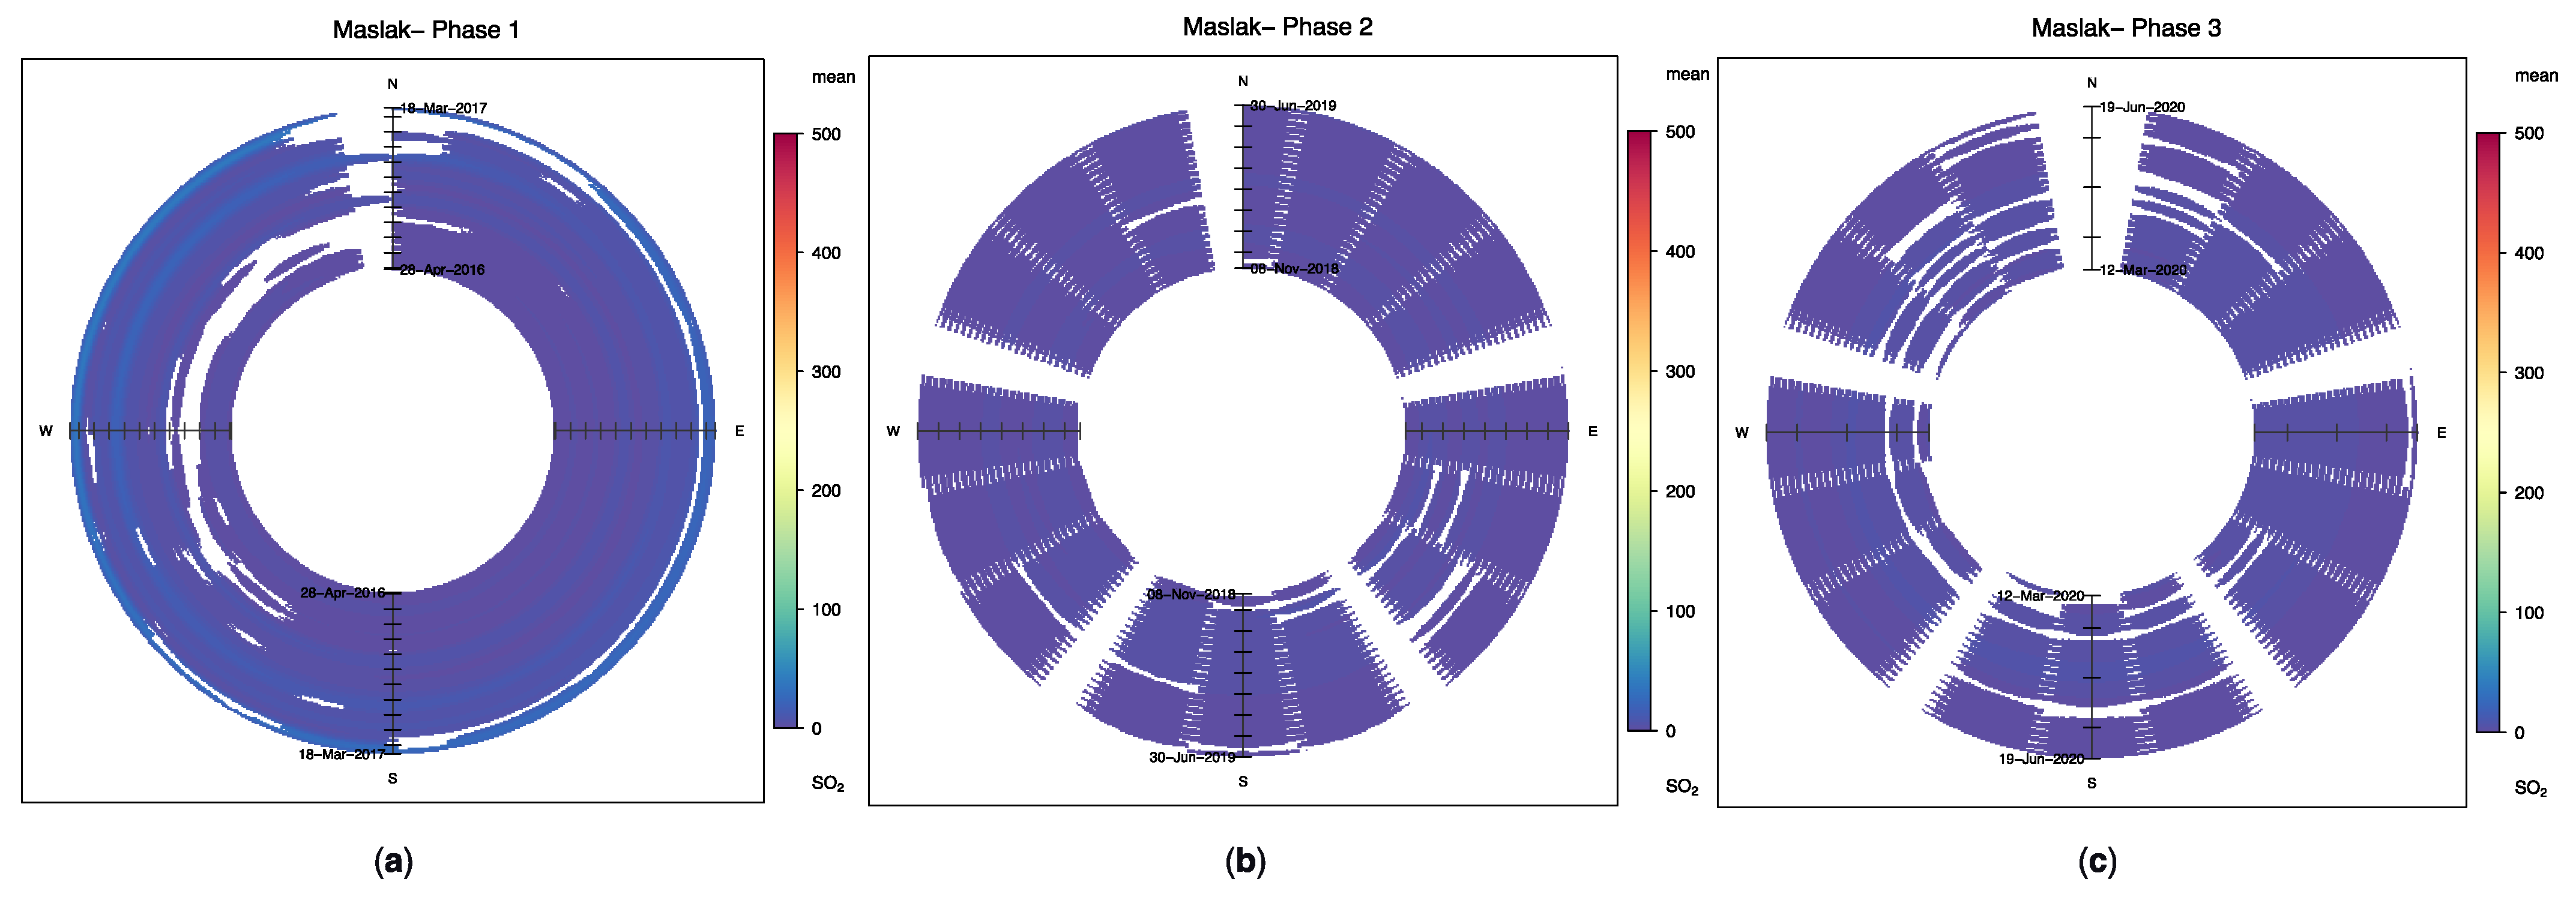
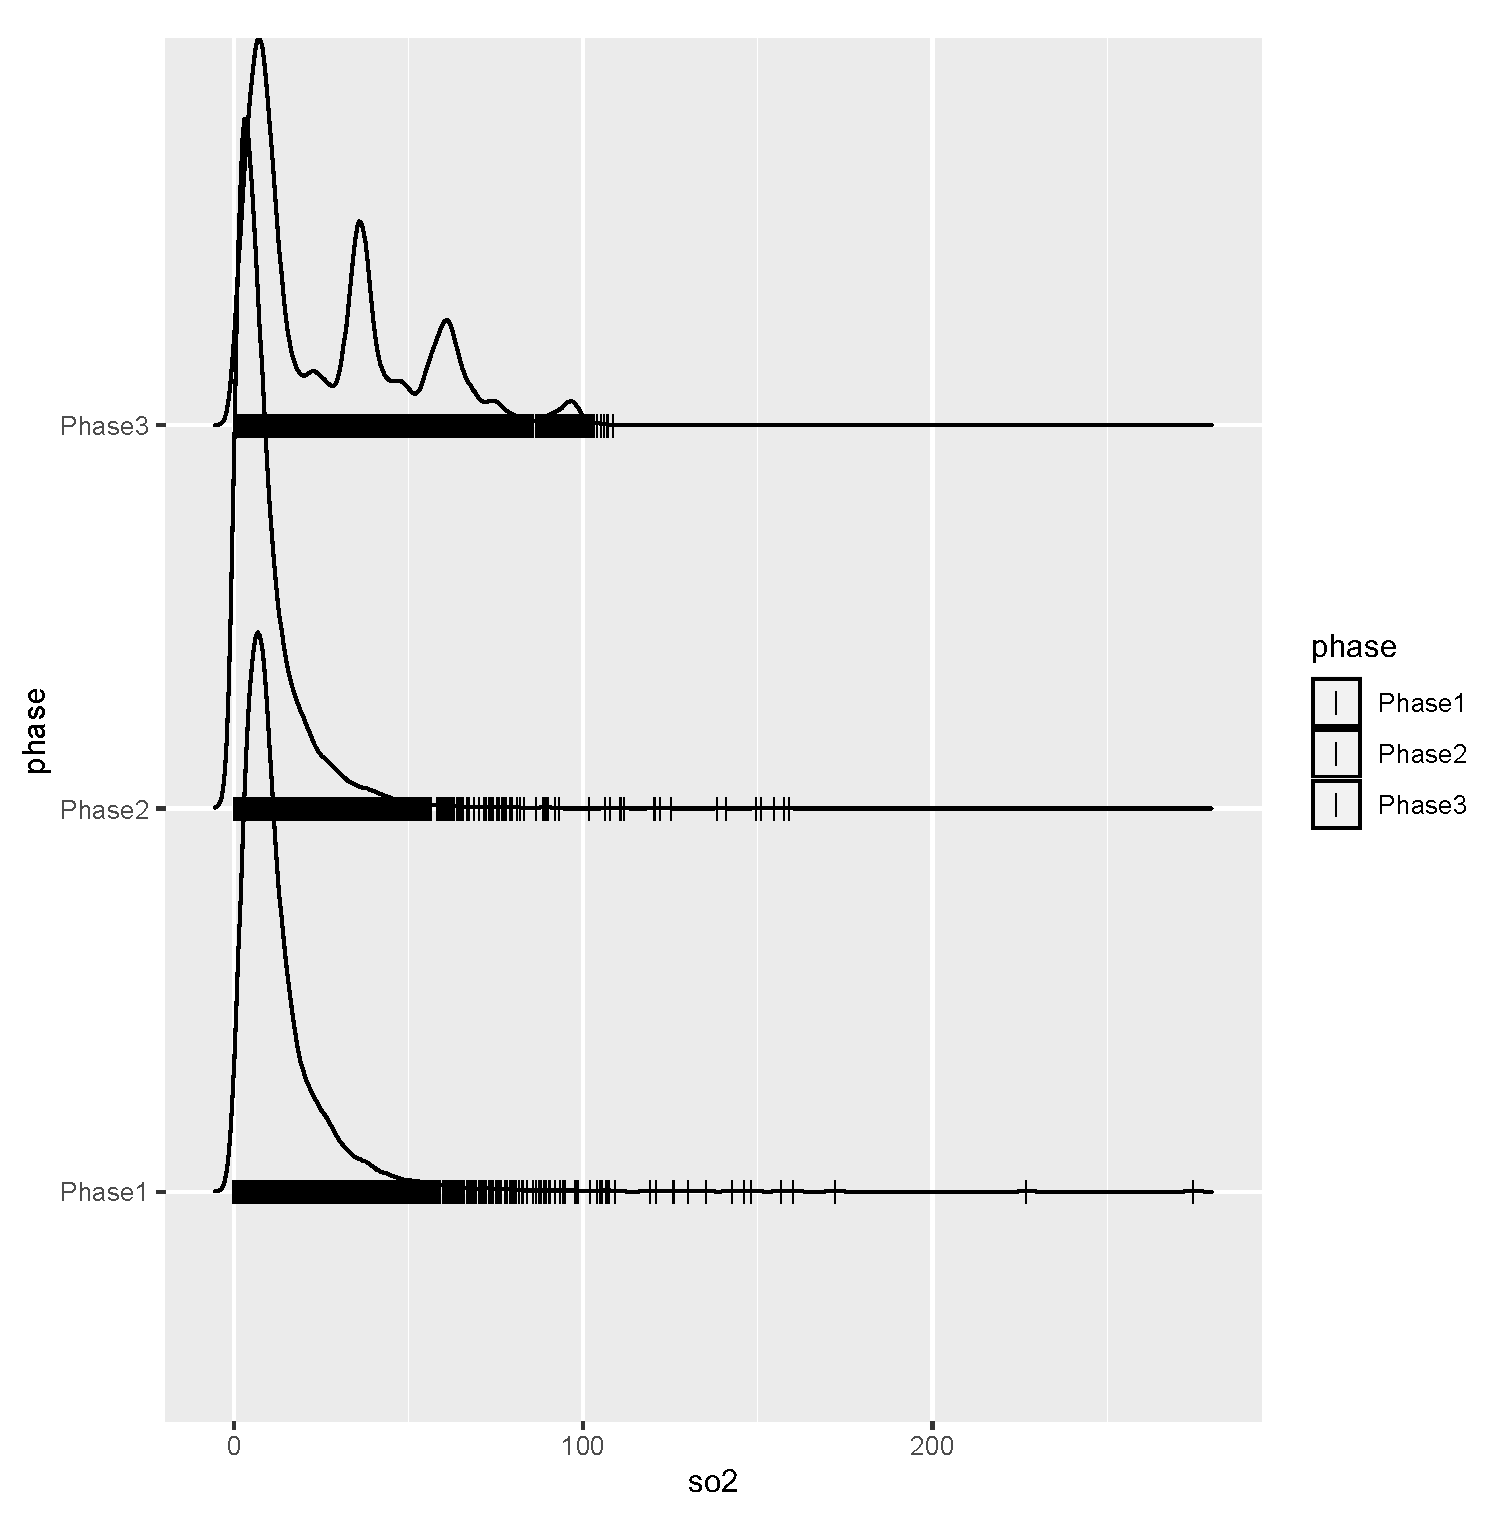
3.3. Sulphur Dioxide
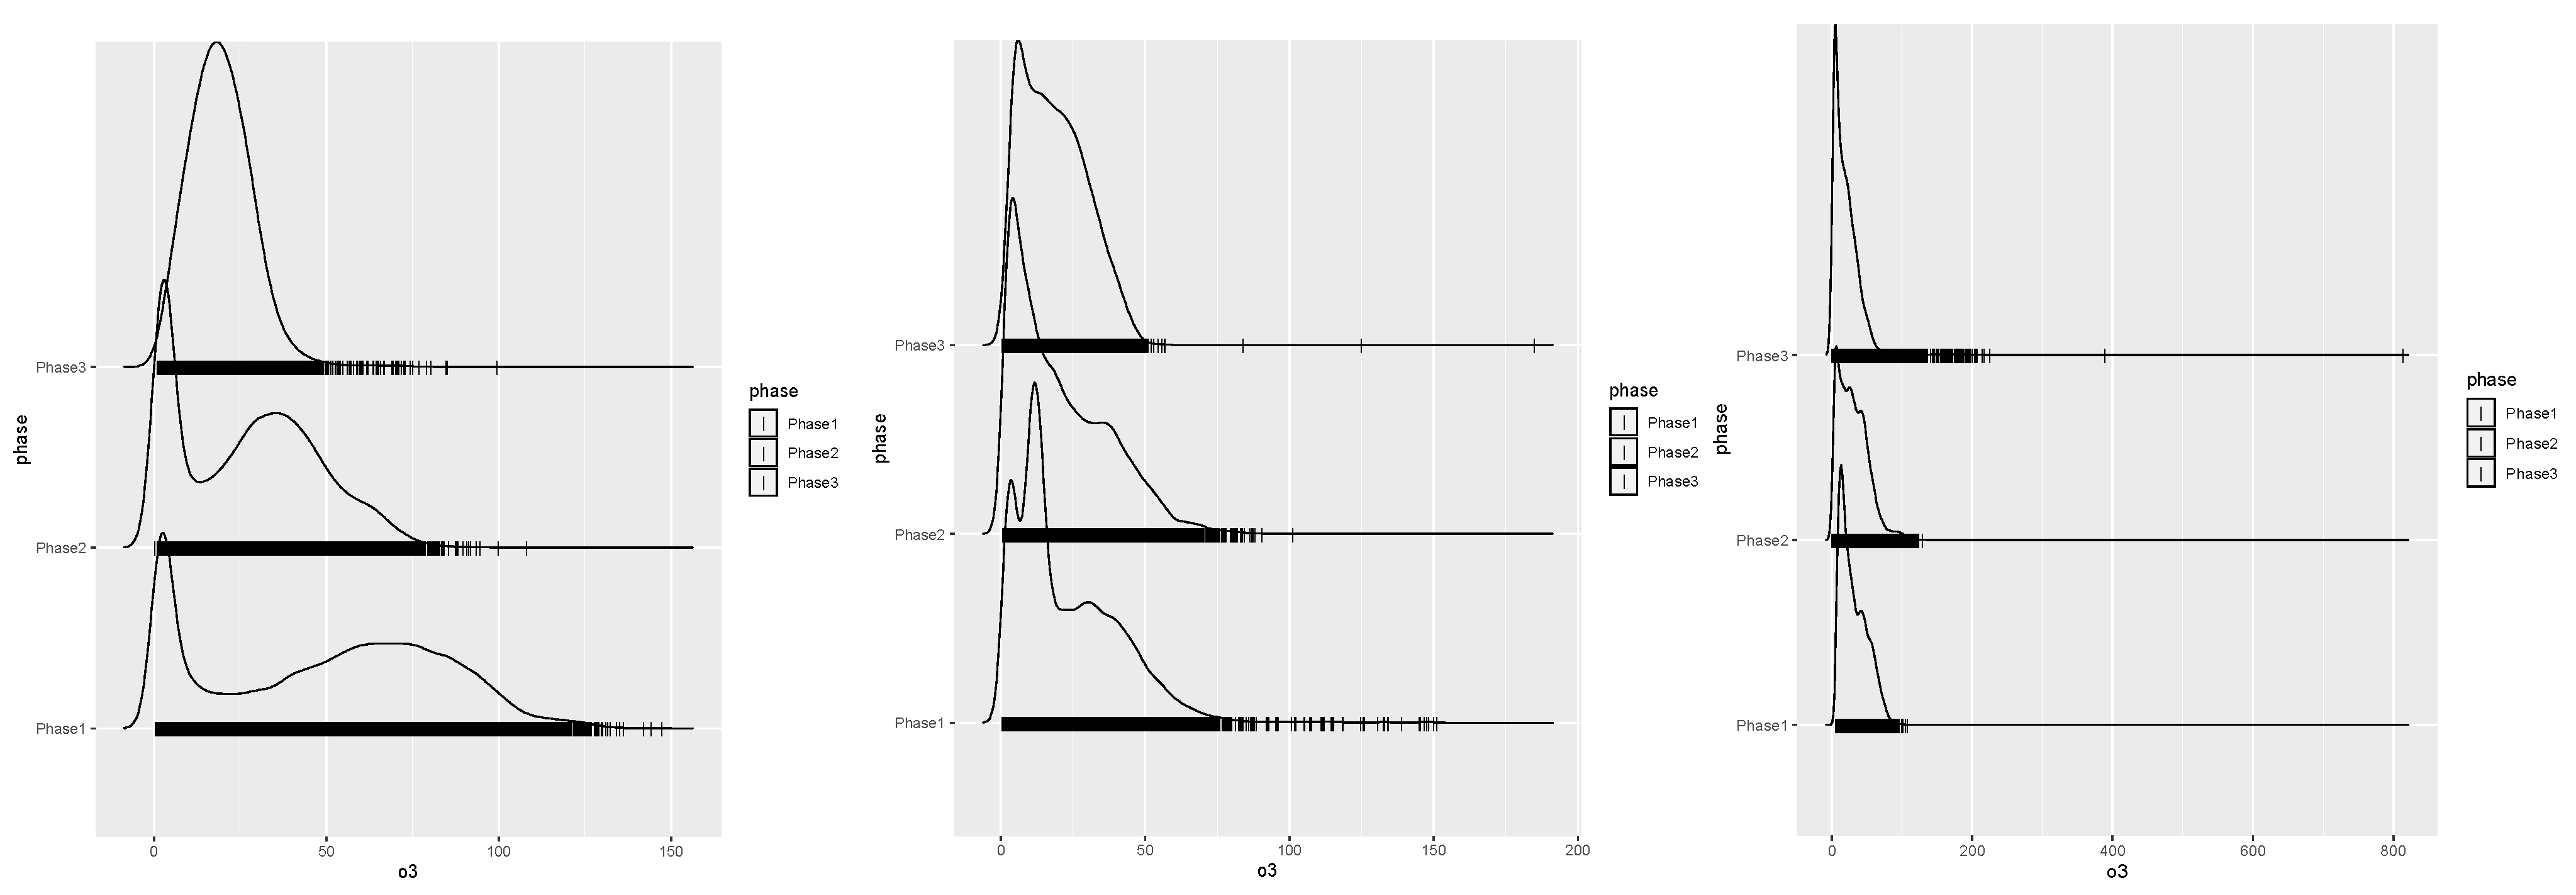
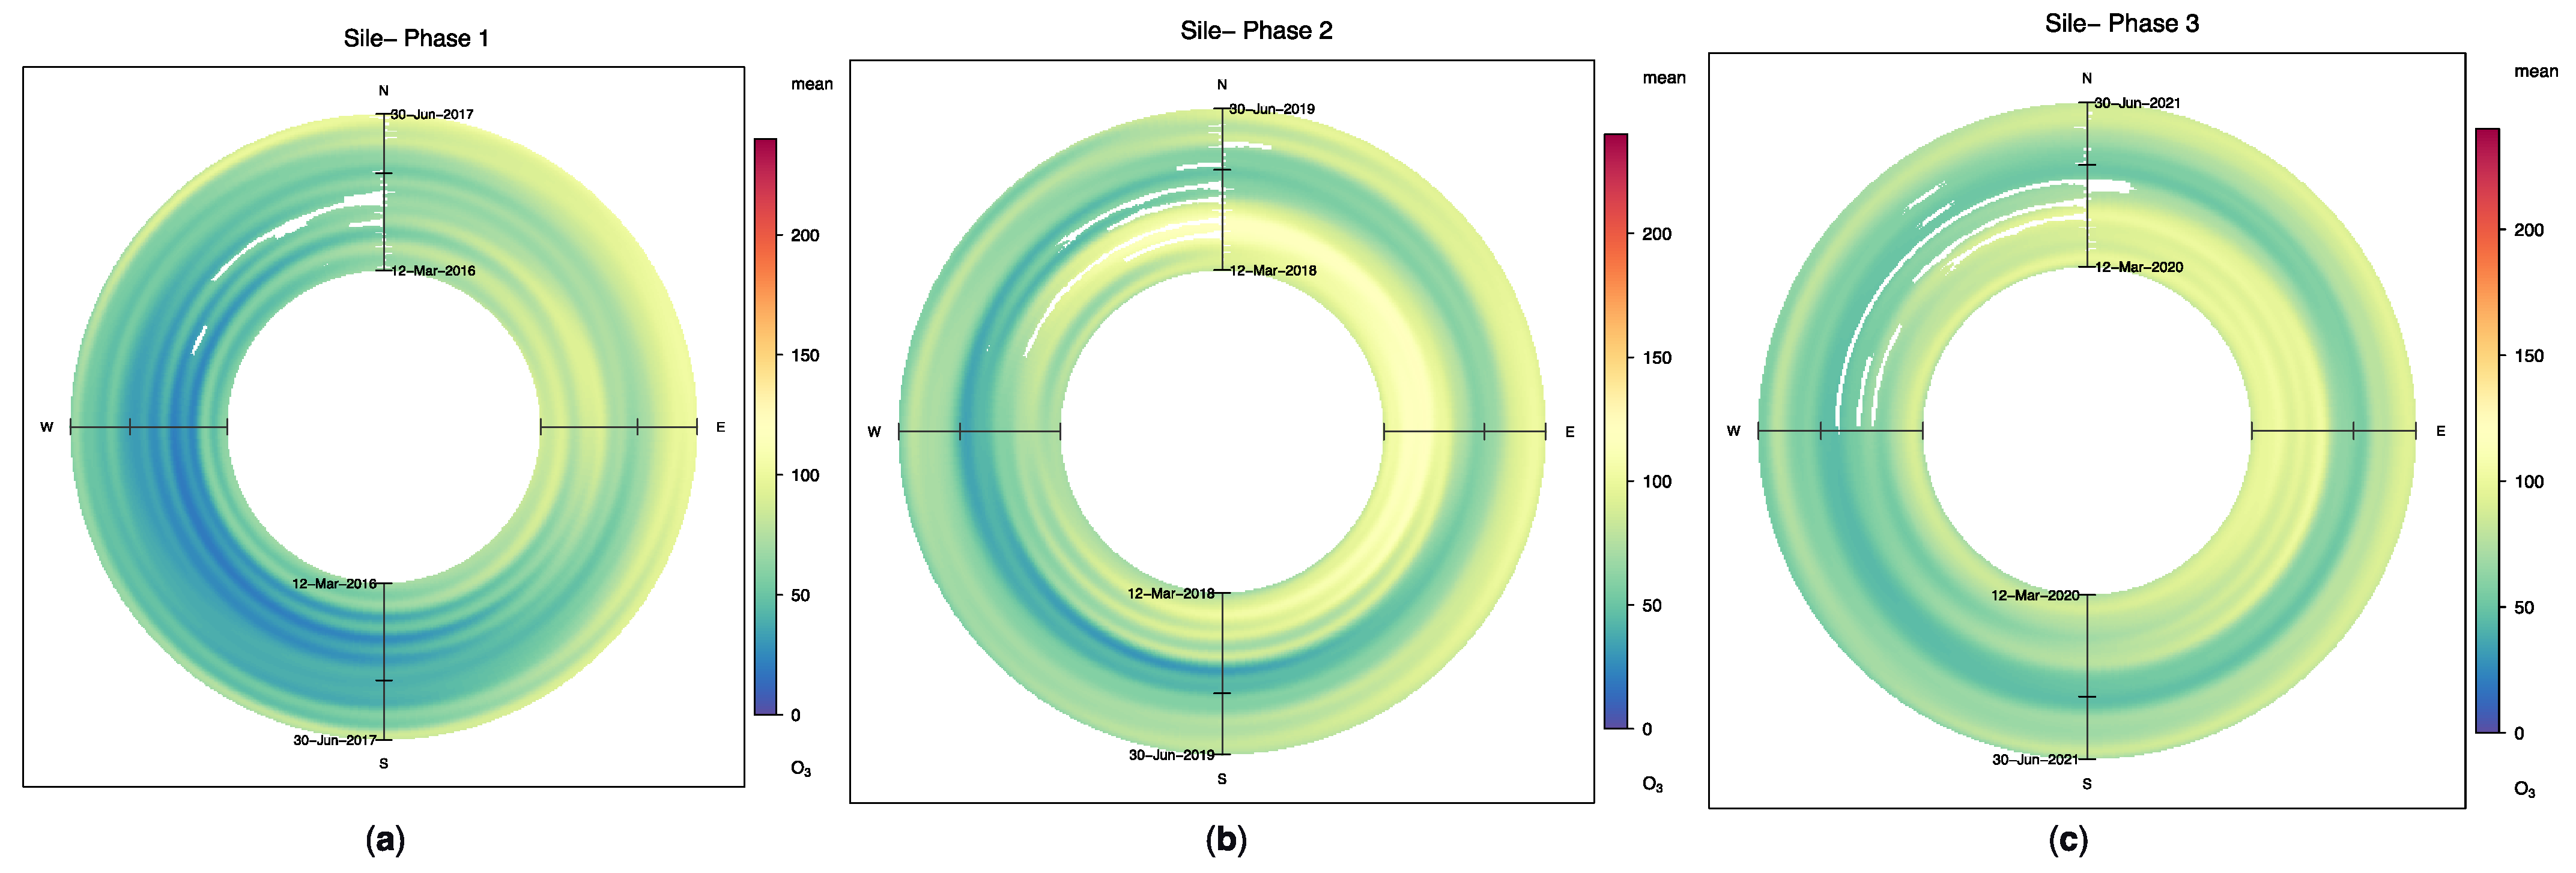
3.4. Ground-Level Ozone
3.5. Air Quality Limit Exceedances
4. Conclusions
Funding
Institutional Review Board Statement
Informed Consent Statement
Data Availability Statement
Acknowledgments
Conflicts of Interest
Appendix A. Air Quality Standards of EU and WHO

| Pollutant | Averaging Period | EU Air Quality Directives | WHO Air Quality Guidelines | |||||||
|---|---|---|---|---|---|---|---|---|---|---|
| Objective | Concentration (μg/m3) | Comments | Concentration (μg/m3) | Comments | ||||||
| Interim Targets | AQG Level (μg/m3) | |||||||||
| 1 | 2 | 3 | 4 | |||||||
| PM10 | 24-h | Limit Value | 50 | Not to be exceeded on more than 35 days/year | 150 | 100 | 75 | 50 | 45 | 99th Percentile (i.e., 3–4 exc. days/year) |
| PM2.5 | 24-h | Target Value | - | 75 | 50 | 37.5 | 25 | 15 | ||
| NO2 | 24-h | Target Value | - | 120 | 50 | - | - | 25 | ||
| SO2 | 24-h | Limit Value | 125 | Not to be exceeded on more than 3 days/year | 125 | 50 | - | - | 40 | |
| O3 | 8-h | Limit/Target Value | 120 | Max daily 8-hr mean | 160 | 120 | - | - | 100 | |
Appendix B. Average Values
| Stations | PM10 | PM2.5 | NO2 | SO2 | O3 | ||||||||||||||||||||
|---|---|---|---|---|---|---|---|---|---|---|---|---|---|---|---|---|---|---|---|---|---|---|---|---|---|
| P I | P II | P III | III–I | III–II | P I | P II | P III | III–I | III–II | P I | P II | P III | III–I | III–II | P I | P II | P III | III–I | III–II | P I | P II | P III | III–I | III–II | |
| μg/m3 | % | μg/m3 | % | μg/m3 | % | μg/m3 | % | μg/m3 | % | ||||||||||||||||
| Kumkoy | 26.4 | 22.6 | 12.0 | −54.5 | −46.8 | - | 35.7 | 26.4 | - | −26.0 | 14.8 | 35.2 | 35.7 | 142.2 | 1.6 | 46.3 | 40.5 | 26.9 | −41.9 | −33.7 | 16.1 | 55.4 | 56.5 | 250.2 | 1.9 |
| Sile | 26.1 | 24,9 | 26.1 | −0.2 | 4.6 | - | - | - | - | - | 13.7 | 9.2 | 12.2 | −10.5 | 32.9 | 40.1 | 38.7 | 45.8 | 14.1 | 18.5 | 80.4 | 92.1 | 86.5 | 7.6 | −6.0 |
| Buyukada | 26.2 | 23.2 | 17.2 | −34.3 | −26.0 | - | - | - | - | - | - | - | - | - | - | 51.2 | 42.7 | 37.0 | −27.6 | −13.3 | 11.1 | 35.6 | 26.3 | 137.2 | −26.2 |
| Kandilli2 | 41.4 | 34.9 | 29.9 | −27.8 | −14.4 | - | - | - | - | - | 70.1 | 67.8 | 40.0 | −43.0 | −41.0 | 95.2 | 57.9 | 49.8 | −47.7 | −14.0 | - | - | - | - | - |
| Esenyurt | 72.5 | 63.0 | 54.2 | −25.1 | −13.9 | - | - | - | - | - | 38.5 | 57.6 | 25.8 | −32.9 | −55.2 | 155.1 | 115.2 | 99.4 | −35.9 | −13.8 | 55.2 | 47.1 | 31.0 | −43.8 | −34.2 |
| Kagithane2 | - | - | - | - | - | 50.0 | 44.1 | 36.1 | −27.9 | −18.3 | 78.7 | 53.1 | 80.5 | 2.3 | 51.6 | - | - | - | - | - | 55.2 | 69.8 | 102.4 | 85.6 | 46.8 |
| Yenibosna | 53.6 | 38.6 | 38.1 | −28.9 | −1.4 | - | - | - | - | - | - | 80.1 | 72.4 | - | −9.6 | 99.3 | 68.0 | 71.3 | −28.2 | 4.7 | - | - | - | - | - |
| Alibeykoy | 53.8 | 54.9 | 59.2 | 9.9 | 7.7 | 105.5 | 40.2 | 34.0 | −67.8 | −15.5 | 103.1 | 61.9 | 62.0 | −39.8 | 0.3 | 103.8 | 96.4 | 103.2 | −0.5 | 7.1 | 54.2 | 27.0 | 29.0 | −46.5 | 7.6 |
| Sariyer | 32.9 | 21.4 | 22.5 | −31.6 | 4.7 | - | - | - | - | - | - | - | 29.6 | - | - | 58.5 | 41.2 | 40.8 | −30.3 | −1.0 | 63.6 | 44.9 | 36.5 | −42.7 | −18.7 |
| Esenler | 51.6 | 37.3 | 33.7 | −34.7 | −9.4 | 42.0 | 37.9 | 33.3 | −20.7 | −12.1 | 98.0 | 85.8 | 82.0 | −16.3 | −4.4 | 95.8 | 62.9 | 56.7 | −40.8 | −9.8 | 0.0 | - | - | - | - |
| Bagcilar | - | - | - | - | - | - | 48.7 | 41.1 | - | −15.5 | - | 86.5 | 81.2 | - | −6.1 | - | 80.4 | 80.9 | - | 0.6 | - | 53.0 | 53.9 | - | 1.6 |
| Sultanbeyli | - | - | - | - | - | - | - | - | - | - | 48.0 | 32.4 | 93.4 | 94.3 | 188.5 | - | 77.6 | 65.7 | - | −15.4 | 79.0 | 80.0 | 78.5 | −0.6 | −1.8 |
| Kartal | 47.7 | 46.0 | 37.6 | −21.3 | −18.3 | - | 34.3 | 41.7 | - | 21.4 | 121.0 | 94.6 | 78.5 | −35.1 | −17.0 | 91.4 | 93.6 | 80.9 | −11.4 | −13.5 | - | - | 47.1 | - | - |
| Kadikoy | 49.2 | 39.6 | 31.8 | −35.5 | −19.8 | 71.8 | 39.5 | 33.1 | −53.8 | −16.1 | 86.6 | 86.4 | 94.3 | 8.9 | 9.1 | 100.0 | 71.8 | 59.3 | −40.7 | −17.5 | 31.5 | 29.8 | 25.0 | −20.7 | −16.0 |
| Sancaktepe | - | - | - | - | - | - | - | - | - | - | - | - | 59.0 | - | - | - | - | 67.2 | - | - | - | - | 71.0 | - | - |
| Tuzla | - | - | - | - | - | - | 34.5 | 22.8 | - | −33.9 | - | 74.6 | 69.9 | - | −6.4 | - | 87.4 | 84.0 | - | −3.9 | - | 53.9 | 49.5 | - | −8.1 |
| Sultangazi4 | - | - | - | - | - | - | 38.5 | 28.7 | - | −25.5 | 69.7 | 63.0 | 88.8 | 27.3 | 41.0 | - | 120.0 | 101.9 | - | −15.0 | 49.7 | 54.9 | 61.3 | 23.4 | 11.7 |
| Kagithane1 | 88.8 | 56.8 | 52.9 | −40.5 | −6.9 | 72.4 | 47.6 | 29.5 | −59.2 | −38.1 | 58.2 | 62.9 | 65.3 | 12.1 | 3.7 | 138.4 | 113.1 | 112.2 | −19.0 | −0.8 | - | 42.0 | 32.1 | - | −23.5 |
| Sultangazi2 | 89.8 | 55.5 | 48.4 | −46.1 | −12.8 | - | - | - | - | - | - | - | - | - | - | 177.6 | 110.2 | 89.4 | −49.7 | −18.9 | - | - | - | - | - |
| Uskudar1 | 44.9 | 27.2 | 24.6 | −45.1 | −9.3 | - | 29.6 | 22.9 | - | −22.8 | 76.7 | 80.5 | 57.0 | −25.7 | −29.3 | 79.9 | 42.9 | 38.3 | −52.0 | −10.6 | - | - | - | - | - |
| Arnavutkoy | - | - | - | - | - | - | 29.2 | 29.0 | - | −0.7 | - | 44.6 | 41.0 | - | −8.1 | - | 72.1 | 78.5 | - | 8.9 | - | 73.6 | 63.0 | - | −14.4 |
| Basaksehir | 55.6 | 48.9 | 42.1 | −24.3 | −13.9 | - | - | - | - | - | 65.3 | 54.2 | 29.6 | −54.7 | −45.5 | 104.5 | 87.7 | 77.6 | −25.8 | −11.6 | 77.9 | 76.1 | 91.7 | 17.6 | 20.4 |
| Avcilar | 41.7 | 27.8 | 26.4 | −36.8 | −5.3 | 48.9 | 35.0 | 34.1 | −30.2 | −2.6 | 48.9 | 64.1 | 61.0 | 24.8 | −4.9 | 83.2 | 45.7 | 44.9 | −46.0 | −1.7 | - | - | 47.3 | - | - |
| Kandilli1 | 11.6 | 12.0 | 11.7 | 0.8 | −2.9 | - | - | - | - | - | - | - | - | - | - | 27.0 | 24.5 | 27.3 | 1.3 | 11.3 | 15.0 | 35.5 | 30.6 | 103.9 | −13.8 |
| Maslak | 29.0 | 42.8 | 37.3 | 28.6 | −12.8 | 87.1 | 33.9 | 26.7 | −69.3 | −21.2 | 74.8 | 47.1 | 37.4 | −50.0 | −20.6 | 54.8 | 84.5 | 77.3 | 40.9 | −8.5 | 63.5 | 34.8 | 26.8 | −57.7 | −23.0 |
| Umraniye1 | 47.9 | 33.6 | 31.4 | −34.5 | −6.5 | 45.0 | 38.9 | 37.0 | −17.9 | −5.0 | 56.7 | 64.7 | 64.4 | 13.5 | −0.4 | 86.5 | 65.2 | 61.7 | −28.7 | −5.4 | 76.8 | 54.0 | 28.9 | −62.3 | −46.4 |
| Sultangazi3 | 186.1 | 114.9 | 81.5 | −56.2 | −29.1 | - | - | - | - | - | - | - | - | - | - | 382.1 | 237.8 | 154.7 | −59.5 | −35.0 | - | - | - | - | - |
| Sultangazi1 | 141.3 | 101.7 | 64.9 | −54.0 | −36.1 | - | - | - | - | - | - | - | - | - | - | 327.8 | 210.9 | 126.1 | −61.6 | −40.2 | - | - | - | - | - |
| Catladikapi | 58.9 | 31.4 | 22.6 | −61.7 | −28.2 | 38.5 | 32.6 | 28.5 | −25.9 | −12.5 | 116.8 | 100.2 | 86.9 | −25.6 | −13.3 | 112.7 | 56.9 | 35.4 | −68.6 | −37.7 | 29.5 | 34.1 | 39.0 | 32.2 | 14.3 |
| Sirinevler | 36.4 | 47.3 | 41.5 | 14.1 | −12.2 | - | - | - | - | - | 98.6 | 108.3 | 79.0 | −19.9 | −27.0 | 62.8 | 75.1 | 68.2 | 8.6 | −9.2 | - | - | - | - | - |
| Mecidiyekoy | 51.5 | 62.3 | 52.6 | 2.1 | −15.5 | - | - | - | - | - | 108.2 | 97.2 | 70.9 | −34.5 | −27.1 | 109.0 | 101.5 | 84.9 | −22.1 | −16.4 | - | - | - | - | - |
| Besiktas | 41.1 | 35.1 | 27.3 | −33.6 | −22.1 | 53.9 | 36.6 | 28.6 | −46.8 | −21.7 | 135.3 | 93.8 | 79.7 | −41.1 | −15.0 | 69.4 | 70.3 | 49.6 | −28.5 | −29.4 | 40.3 | 42.1 | 30.1 | −25.3 | −28.4 |
| Aksaray | 59.1 | 49.3 | 39.2 | −33.6 | −20.4 | 53.2 | 44.8 | 34.5 | −35.1 | −22.9 | 106.1 | 118.3 | 114.4 | 7.8 | −3.3 | 104.9 | 74.3 | 62.5 | −40.5 | −15.9 | 28.2 | 28.1 | 24.8 | −12.2 | −11.7 |
| Selimiye | 55.7 | 31.9 | 24.4 | −56.1 | −23.5 | 35.4 | 27.0 | 27.8 | −21.5 | 3.1 | 88.0 | 97.2 | 86.3 | −1.9 | −11.2 | 95.8 | 50.8 | 40.7 | −57.5 | −19.8 | 48.8 | 48.1 | 39.0 | −20.1 | −18.9 |
| Goztepe | 64.0 | 59.4 | 68.5 | 7.0 | 15.3 | 119.8 | - | - | - | - | 109.4 | 120.5 | 90.2 | −17.6 | −25.1 | 123.0 | 110.5 | 145.8 | 18.6 | 32.0 | 17.7 | 36.6 | 37.2 | 110.0 | 1.8 |
| Umraniye2 | 51.7 | 36.9 | 37.1 | −28.3 | 0.5 | 37.3 | 35.6 | 26.0 | −30.3 | −26.9 | 121.5 | 102.0 | 64.4 | −47.0 | −36.8 | 94.7 | 66.1 | 69.2 | −27.0 | 4.6 | - | - | - | - | - |
| Average | 56.4 | 44.2 | 37.8 | −27.0 | −12.9 | 61.5 | 37.2 | 31.1 | −39.0 | −15.6 | 80.3 | 73.9 | 65.6 | −6.5 | −2.7 | 109.3 | 82.2 | 71.8 | −27.9 | −9.5 | 44.7 | 49.9 | 47.9 | 22.9 | −8.1 |
Appendix C. Exceedance Numbers
| Stations | PM10 | PM2.5 | NO2 | SO2 | O3 | ||||||||||||||||||||
|---|---|---|---|---|---|---|---|---|---|---|---|---|---|---|---|---|---|---|---|---|---|---|---|---|---|
| P I | P II | P III | III–I | III–II | P I | P II | P III | III–I | III–II | P I | P II | P III | III–I | III–II | P I | P II | P III | III–I | III–II | P I | P II | P III | III–I | III–II | |
| # | % | # | % | # | % | # | % | # | % | ||||||||||||||||
| Kumkoy | 9 | 12 | 1 | −88.9 | −91.7 | 0 | 74 | 36 | 38 | −51.4 | - | 66 | 72 | - | 9.1 | - | - | - | - | - | - | 23 | 8 | - | −65.2 |
| Sile | 7 | 7 | 18 | 157.1 | 157.1 | - | - | - | - | - | 4 | 6 | 3 | −25.0 | −50.0 | 87 | 72 | 142 | 63.2 | 97.2 | 40 | 176 | 73 | 82.5 | −58.5 |
| Buyukada | 12 | 15 | 11 | −8.3 | −26.7 | - | - | - | - | - | - | - | - | - | - | - | - | - | - | - | - | 16 | 4 | - | −75.0 |
| Kandilli2 | 112 | 44 | 36 | −67.9 | −18.2 | - | - | - | - | - | 307 | 323 | 116 | −62.2 | −64.1 | 297 | 212 | 178 | −40.1 | −16.0 | - | - | - | - | - |
| Esenyurt | 275 | 182 | 158 | −42.5 | −13.2 | - | - | - | - | - | 108 | 275 | 23 | −78.7 | −91.6 | 452 | 417 | 398 | −11.9 | −4.6 | 10 | 24 | 0 | −100 | −100 |
| Kagithane2 | - | - | - | - | - | - | - | - | - | - | 306 | 218 | 330 | 7.8 | 51.4 | - | - | - | - | - | 6 | 11 | 381 | 6250 | 3364 |
| Yenibosna | 143 | 67 | 97 | −32.2 | 44.8 | - | - | - | - | - | - | 287 | 348 | - | 21.3 | 362 | 251 | 252 | −30.4 | 0.4 | - | - | - | - | - |
| Alibeykoy | 133 | 151 | 145 | 9.0 | −4.0 | 149 | 99 | 90 | 9 | −9.1 | 413 | 284 | 280 | −32.2 | −1.4 | 267 | 348 | 332 | 24.3 | −4.6 | 8 | 1 | 3 | −62.5 | 200 |
| Sariyer | 44 | 7 | 7 | −84.1 | 0.0 | - | - | - | - | - | - | - | 39 | - | - | 210 | 121 | 121 | −42.4 | 0.0 | 2 | 2 | 5 | 150 | 150 |
| Esenler | 136 | 67 | 54 | −60.3 | −19.4 | 87 | 92 | 76 | 16 | −17.4 | 400 | 360 | 396 | −1.0 | 10.0 | 337 | 215 | 203 | −39.8 | −5.6 | - | - | - | - | - |
| Bagcilar | 0 | 96 | 116 | - | - | - | 153 | 124 | 29 | −19.0 | - | 375 | 356 | - | −5.1 | - | 287 | 291 | - | 1.4 | 0 | 15 | 4 | - | −73.3 |
| Sultanbeyli | 0 | 57 | 86 | - | 50.9 | - | - | - | - | - | 211 | 91 | 279 | 32.2 | 206.6 | - | 137 | 208 | - | 51.8 | 49 | 124 | 69 | 40.8 | −44.4 |
| Kartal | 112 | 135 | 120 | 7.1 | −11.1 | 0 | 98 | 127 | −29 | 29.6 | 136 | 339 | 325 | 139 | −4.1 | 397 | 310 | 280 | −29.5 | −9.7 | - | - | - | - | - |
| Kadikoy | 109 | 82 | 62 | −43.1 | −24.4 | 121 | 89 | 68 | 21 | −23.6 | 352 | 385 | 324 | −8 | −15.8 | 264 | 226 | 173 | −34.5 | −23.5 | 4 | 1 | 1 | −75 | 0 |
| Sancaktepe | 0 | 0 | 70 | - | - | - | - | - | - | - | - | - | 214 | - | - | - | - | 213 | - | - | 0 | 0 | 71 | - | - |
| Tuzla | 0 | 110 | 145 | - | - | - | 71 | 14 | 57 | −80.3 | - | 284 | 337 | - | 18.7 | - | 282 | 324 | - | 14.9 | 0 | 3 | 3 | - | 0 |
| Sultangazi4 | 0 | 143 | 208 | - | - | - | 57 | 63 | −6 | 10.5 | 324 | 307 | 230 | −29 | −25.1 | - | 236 | 410 | - | 73.7 | 3 | 1 | 50 | 1567 | 4900 |
| Kagithane1 | 29 | 149 | 130 | 348.3 | −12.8 | 120 | 136 | 50 | 86 | −63.2 | 135 | 238 | 212 | 57 | −10.9 | 54 | 288 | 214 | 296.3 | −25.7 | 0 | 1 | 4 | - | 300 |
| Sultangazi2 | 73 | 212 | 100 | 37 | −52.8 | - | - | - | - | - | - | - | - | - | - | - | - | - | - | - | - | - | - | - | - |
| Uskudar1 | 87 | 14 | 4 | −95.4 | −71.4 | - | 41 | 21 | - | −48.8 | 86 | 345 | 229 | 166.3 | −33.6 | 262 | 112 | 102 | −61.1 | −8.9 | - | - | - | - | - |
| Arnavutkoy | 0 | 89 | 123 | - | - | - | 62 | 60 | - | −3.2 | - | 146 | 148 | - | 1.4 | - | 279 | 310 | - | 11.1 | 0 | 14 | 4 | - | −71.4 |
| Basaksehir | 178 | 121 | 118 | −33.7 | −2.5 | - | - | - | - | - | 284 | 199 | 98 | −65.5 | −50.8 | 376 | 347 | 296 | −21.3 | −14.7 | 38 | 37 | 157 | 313.2 | 324.3 |
| Avcilar | 104 | 10 | 12 | −88.5 | 20 | 147 | 61 | 63 | −57.1 | 3.3 | 166 | 292 | 276 | 66.3 | −5.5 | 293 | 150 | 149 | −49.1 | −0.7 | - | - | - | - | - |
| Kandilli1 | 0 | 0 | 28 | - | - | - | - | - | - | - | - | - | - | - | - | - | - | - | - | - | 1 | 66 | 22 | 2100 | −66.7 |
| Maslak | 39 | 117 | 86 | 120.5 | −26.5 | 135 | 71 | 36 | −73.3 | −49.3 | 194 | 163 | 15 | −92.3 | −90.8 | 178 | 299 | 257 | 44.4 | −14.0 | 21 | 0 | 0 | −100 | - |
| Umraniye1 | 115 | 68 | 52 | −54.8 | −23.5 | 117 | 102 | 90 | −23.1 | −11.8 | 155 | 266 | 185 | 19.4 | −30.5 | 328 | 253 | 225 | −31.4 | −11.1 | 5 | 2 | 2 | −60 | 0 |
| Sultangazi3 | 71 | 322 | 340 | 378.9 | 5.6 | - | - | - | - | - | - | - | - | - | - | - | - | - | - | - | - | - | - | - | - |
| Sultangazi1 | 55 | 281 | 199 | 261.8 | −29.2 | - | - | - | - | - | - | - | - | - | - | - | - | - | - | - | - | - | - | - | - |
| Catladikapi | 258 | 23 | 1 | −99.6 | −95.7 | 96 | 44 | 27 | −71.9 | −38.6 | 445 | 434 | 315 | −29.2 | −27.4 | - | - | - | - | - | 0 | 1 | 1 | - | 0 |
| Sirinevler | 90 | 77 | 59 | −34.4 | −23.4 | - | - | - | - | - | 430 | 443 | 389 | −9.5 | −12.2 | 238 | 366 | 309 | 29.8 | −15.6 | - | - | - | - | - |
| Mecidiyekoy | 199 | 187 | 124 | −37.7 | −33.7 | - | - | - | - | - | 475 | 465 | 416 | −12.4 | −10.5 | - | - | - | - | - | - | - | - | - | - |
| Besiktas | 70 | 34 | 13 | −81.4 | −61.8 | 144 | 86 | 21 | −85.4 | −75.6 | 469 | 417 | 340 | −27.5 | −18.5 | 275 | 271 | 190 | −30.9 | −29.9 | 0 | 1 | 31 | - | 3000 |
| Aksaray | 155 | 81 | 50 | −67.7 | −38.3 | 147 | 126 | 70 | −52.4 | −44.4 | 408 | 463 | 461 | 13 | −0.4 | 341 | 363 | 263 | −22.9 | −27.5 | 43 | 15 | 0 | −100 | −100 |
| Selimiye | 120 | 25 | 5 | −95.8 | −80 | 63 | 29 | 21 | −66.7 | −27.6 | 385 | 415 | 374 | −2.9 | −9.9 | - | - | - | - | - | 4 | 1 | 3 | −25 | 200 |
| Goztepe | 208 | 194 | 231 | 11.1 | 19.1 | - | - | - | - | - | 112 | 417 | 425 | 279.5 | 1.9 | 123 | 110.5 | 145.8 | 18.6 | 32 | 2 | 1 | 2 | 0 | 100 |
| Umraniye2 | 150 | 53 | 92 | −38.7 | 73.6 | 90 | 71 | 37 | −58.9 | −47.9 | 473 | 396 | 369 | −22 | −6.8 | 409 | 298 | 273 | −33.3 | −8.4 | - | - | - | - | - |
| Average | 88.4 | 92.3 | 88.6 | 6.3 | −13.4 | 101.1 | 82.2 | 57.6 | −15.8 | −29.9 | 282.4 | 300 | 255.6 | 11.8 | −8.4 | 277.5 | 250 | 240.7 | −0.1 | 2.5 | 10.7 | 22.3 | 37.4 | 665.4 | 540.2 |
Appendix D. Nitrogen Oxides

Appendix E. Sulfur Dioxide

Appendix F. Ground-Level Ozone

References
- European Environment Agency. Europe’s Air Quality Status 2021-Update. Available online: https://www.eea.europa.eu/publications/air-quality-in-europe-2021/air-quality-status-briefing-2021 (accessed on 7 September 2022).
- Environmental Protection Agency. Particulate Matter (PM) Pollution. Available online: https://www.epa.gov/pm-pollution (accessed on 7 September 2022).
- Environmental Protection Agency. NO2 Pollution. Available online: https://www.epa.gov/NO2-pollution (accessed on 7 September 2022).
- Environmental Protection Agency. Ground Level Ozone Pollution. Available online: https://www.epa.gov/ground-level-ozone-pollution (accessed on 7 September 2022).
- Environmental Protection Agency. SO2 Pollution. Available online: https://www.epa.gov/SO2-pollution (accessed on 7 September 2022).
- Türkiye İstatistik Kurumu (Turkish Statistical Institute). Available online: https://data.tuik.gov.tr/Bulten/Index?p=The-Results-of-Address-Based-Population-Registration-System-2021-45500&dil=2 (accessed on 16 September 2022).
- Capraz, O.; Efe, B.; Deniz, A. Study on the association between air pollution and mortality in İstanbul, 2007–2012. Atmos. Pollut. Res. 2016, 7, 147–154. [Google Scholar] [CrossRef]
- Capraz, O.; Deniz, A.; Dogan, N. Effects of air pollution on respiratory hospital admissions in İstanbul, Turkey, 2013 to 2015. Chemosphere 2017, 181, 544–550. [Google Scholar] [CrossRef]
- Kroll, J.H.; Heald, C.L.; Cappa, C.D.; Farmer, D.K.; Fry, J.L.; Murphy, J.G.; Steiner, A.L. The complex chemical effects of COVID-19 shutdowns on air quality. Nat. Chem. 2020, 12, 777–779. [Google Scholar] [CrossRef] [PubMed]
- Dhital, N.B.; Bhattarai, D.R.; Sapkota, R.P.; Rijal, K.; Byanju, R.M.; Yang, H.H. Comparing the Change in Air Quality during the COVID-19 Lockdown between Dry and Wet Seasons in Nepal. Aerosol Air Qual. Res. 2022, 22, 220201. [Google Scholar] [CrossRef]
- Donzelli, G.; Cioni, L.; Cancellieri, M.; Llopis-Morales, A.; Morales-Suarez-Varela, M. Relations between Air Quality and Covid-19 Lockdown Measures in Valencia, Spain. Int. J. Environ. Res. Public Health 2021, 18, 2296. [Google Scholar] [CrossRef] [PubMed]
- Gualtieri, G.; Brilli, L.; Carotenuto, F.; Vagnoli, C.; Zaldei, A.; Gioli, B. Quantifying Road traffic impact on air quality in urban areas: A Covid19-induced lockdown analysis in Italy. Environ. Pollut. 2020, 267, 115682. [Google Scholar] [CrossRef]
- Matthias, V.; Quante, M.; Arndt, J.A.; Badeke, R.; Fink, L.; Petrik, R.; Feldner, J.; Schwarzkopf, D.; Link, E.-M.; Ramacher, M.O.P.; et al. The role of emission reductions and the meteorological situation for air quality improvements during the COVID-19 lockdown period in central Europe. Atmos. Chem. Phys. 2021, 21, 13931–13971. [Google Scholar] [CrossRef]
- Wang, H.L.; Tan, Y.; Zhang, L.X.; Shen, L.J.; Zhao, T.L.; Dai, Q.H.; Guan, T.Y.; Ke, Y.; Li, X. Characteristics of air quality in different climatic zones of China during the COVID-19 lockdown. Atmos. Pollut. Res. 2021, 12, 101247. [Google Scholar] [CrossRef]
- Dantas, J.; Siciliano, B.; França, B.B.; da Silva, C.M.; Arbilla, G. The Impact of COVID-19 Partial Lockdown on the Air Quality in the city of Rio de Janeiro, Brazil. Sci. Total Environ. 2022, 729, 139085. [Google Scholar] [CrossRef]
- Bitta, J.; Svozilik, V.; Svozilikova Krakovska, A. Effect of the COVID-19 Lockdown on Air Pollution in the Ostrava Region. Int. J. Environ. Res. Public Health 2021, 18, 8265. [Google Scholar] [CrossRef]
- Yavuz, V.; Özen, C.; Çapraz, Ö.; Özdemir, E.T.; Deniz, A.; Akbayır, I.; Temur, H. Analysing of atmospheric conditions and their effects on air quality in Istanbul using SODAR and CEILOMETER. Environ. Sci. Pollut. Res. Int. 2022, 29, 16213–16232. [Google Scholar] [CrossRef] [PubMed]
- Unal, Y.S.; Toros, H.; Deniz, A.; Incecik, S. Influence of meteorological factors and emission sources on spatial and temporal variations of PM10 concentrations in Istanbul metropolitan area. Atmos. Environ. 2011, 45, 5504–5513. [Google Scholar] [CrossRef]
- Bolaño-Ortiz, T.R.; Puliafito, S.E.; Berná-Peña, L.L.; Pascual-Flores, R.M.; Urquiza, J.; Camargo-Caicedo, Y. Atmospheric Emission Changes and Their Economic Impacts during the COVID-19 Pandemic Lockdown in Argentina. Sustainability 2020, 12, 8661. [Google Scholar] [CrossRef]
- Duc, H.; Salter, D.; Azzi, M.; Jiang, N.B.; Warren, L.; Watt, S.; Riley, M.; White, S.; Trieu, T.; Chang, L.T.-C.; et al. The Effect of Lockdown Period during the COVID-19 Pandemic on Air Quality in Sydney Region, Australia. Int. J. Environ. Res. Public Health 2021, 18, 3528. [Google Scholar] [CrossRef] [PubMed]
- Brancher, M. Increased ozone pollution alongside reduced nitrogen dioxide concentrations during Vienna’s first COVID-19 lockdown: Significance for air quality management. Environ. Pollut. 2021, 284, 117153. [Google Scholar] [CrossRef]
- Nakada, L.Y.K.; Urban, R.C. COVID-19 pandemic: Impacts on the air quality during the partial lockdown in Sao Paulo state, Brazil. Sci. Total Environ. 2020, 730, 139087. [Google Scholar] [CrossRef]
- Lian, X.; Huang, J.; Huang, R.; Liu, C.; Wang, L.; Zhang, T. Impact of city lockdown on the air quality of COVID-19-hit of Wuhan city. Sci. Total Environ. 2020, 742, 140556. [Google Scholar] [CrossRef]
- Li, K.; Ni, R.Q.; Jiang, T.L.; Tian, Y.Z.; Zhang, X.W.; Li, C.R.; Xie, C.Y. The regional impact of the COVID-19 lockdown on the air quality in Ji’nan, China. Sci. Rep. 2022, 12, 12099. [Google Scholar] [CrossRef]
- Lv, Y.Q.; Tian, H.Z.; Luo, L.N.; Liu, S.H.; Bai, X.X.; Zhao, H.Y.; Lin, S.M.; Zhao, S.; Guo, Z.H.; Xiao, Y.F.; et al. Meteorology-normalized variations of air quality during the COVID-19 lockdown in three Chinese megacities. Atmos. Pollut. Res. 2022, 13, 101452. [Google Scholar] [CrossRef]
- Dahech, S.; Abdmouleh, M.A.; Lagmiri, S. Spatiotemporal Variation of Air Quality (PM and NO2) in Southern Paris during COVID-19 Lockdown Periods. Atmosphere 2022, 13, 289. [Google Scholar] [CrossRef]
- Grivas, G.; Athanasopoulou, E.; Kakouri, A.; Bailey, J.; Liakakou, E.; Stavroulas, I.; Kalkavouras, P.; Bougiatioti, A.; Kaskaoutis, D.G.; Ramonet, M.; et al. Integrating In Situ Measurements and City Scale Modelling to Assess the COVID-19 Lockdown Effects on Emissions and Air Quality in Athens, Greece. Atmosphere 2020, 11, 1174. [Google Scholar] [CrossRef]
- Khan, A.; Khorat, S.; Khatun, R.; Doan, Q.V.; Nair, U.S.; Niyogi, D. Variable Impact of COVID-19 Lockdown on Air Quality across 91 Indian Cities. Earth Interact. 2021, 25, 57–75. [Google Scholar] [CrossRef]
- Nigam, R.; Pandya, K.; Luis, A.J.; Sengupta, R.; Kotha, M. Positive effects of COVID-19 lockdown on air quality of industrial cities (Ankleshwar and Vapi) of Western India. Sci. Rep.-UK 2021, 11, 1–12. [Google Scholar] [CrossRef] [PubMed]
- Alharbi, B.H.; Alhazmi, H.A.; Aldhafeeri, Z.M. Air Quality of Work, Residential, and Traffic Areas during the COVID-19 Lockdown with Insights to Improve Air Quality. Int. J. Environ. Res. Public Health 2022, 19, 727. [Google Scholar] [CrossRef] [PubMed]
- Mahato, S.; Pal, S. Revisiting air quality during lockdown persuaded by second surge of COVID-19 of megacity Delhi, India. Urban Clim. 2022, 41, 101082. [Google Scholar] [CrossRef] [PubMed]
- Jakob, A.; Hasibuan, S.; Fiantis, D. Empirical evidence shows that air quality changes during COVID-19 pandemic lockdown in Jakarta, Indonesia are due to seasonal variation, not restricted movements. Environ. Res. 2022, 208, 112391. [Google Scholar] [CrossRef]
- Hashim, B.M.; Al-Naseri, S.K.; Al-Maliki, A.; Al-Ansari, N. Impact of COVID-19 lockdown on NO2, O3, PM2.5 and PM10 concentrations and assessing air quality changes in Baghdad, Iraq. Sci. Total Environ. 2021, 754, 141978. [Google Scholar] [CrossRef]
- Agami, S.; Dayan, U. Impact of the first induced COVID-19 lockdown on air quality in Israel. Atmos. Environ. 2021, 262, 118627. [Google Scholar] [CrossRef]
- Donzelli, G.; Cioni, L.; Cancellieri, M.; Morales, A.L.; Suarez-Varela, M.M.M. The Effect of the Covid-19 Lockdown on Air Quality in Three Italian Medium-Sized Cities. Atmosphere 2020, 11, 1118. [Google Scholar] [CrossRef]
- Vultaggio, M.; Varrica, D.; Alaimo, M.G. Impact on Air Quality of the COVID-19 Lockdown in the Urban Area of Palermo (Italy). Int. J. Environ. Res. Public Health 2020, 17, 7375. [Google Scholar] [CrossRef]
- Slezakova, K.; Pereira, M.C. 2020 COVID-19 lockdown and the impacts on air quality with emphasis on urban, suburban and rural zones. Sci. Rep.-UK 2021, 11, 1–11. [Google Scholar] [CrossRef] [PubMed]
- Han, B.S.; Park, K.; Kwak, K.H.; Park, S.B.; Jin, H.G.; Moon, S.; Kim, J.-W.; Baik, J.-J. Air Quality Change in Seoul, South Korea under COVID-19 Social Distancing: Focusing on PM2.5. Int. J. Environ. Res. Public Health 2020, 17, 6208. [Google Scholar] [CrossRef] [PubMed]
- Gorrochategui, E.; Hernandez, I.; Perez-Gabucio, E.; Lacorte, S.; Tauler, R. Temporal air quality (NO2, O3, and PM10) changes in urban and rural stations in Catalonia during COVID-19 lockdown: An association with human mobility and satellite data. Environ. Sci. Pollut. Res. 2022, 29, 18905–18922. [Google Scholar] [CrossRef]
- Lorenzo-Saez, E.; Coll-Aliaga, E.; Oliver-Villanueva, J.V.; del Campo, F.P.; Lerma-Arce, V. Analysis of the COVID-19 Lockdown’s Impact on Air Quality in the Larger Cities of Spain. Sustainability 2022, 14, 5613. [Google Scholar] [CrossRef]
- Rodenas, M.; Soler, R.; Borras, E.; Vera, T.; Dieguez, J.J.; Munoz, A. Assessment of COVID-19 Lockdown Impact on the Air Quality in Eastern Spain: PM and BTX in Urban, Suburban and Rural Sites Exposed to Different Emissions. Atmosphere 2022, 13, 97. [Google Scholar] [CrossRef]
- Sahin, U.A. The Effects of COVID-19 Measures on Air Pollutant Concentrations at Urban and Traffic Sites in Istanbul. Aerosol Air Qual. Res. 2020, 20, 1874–1885. [Google Scholar] [CrossRef]
- Ozer, A. Effects of Pandemic Duration on Air Quality of Istanbul; BSc Graduation Project, Istanbul Technical University, Department of Meteorological Engineering: Istanbul, Turkish, 2021. [Google Scholar]
- Efe, B. Air quality improvement and its relation to mobility during COVID-19 lockdown in Marmara Region, Turkey. Environ. Monit. Assess. 2022, 194, 1–19. [Google Scholar] [CrossRef]
- Ropkins, K.; Tate, J.E. Early observations on the impact of the COVID-19 lockdown on air quality trends across the UK. Sci. Total Environ. 2021, 754, 142374. [Google Scholar] [CrossRef]
- Munir, S.; Luo, Z.W.; Dixon, T. Comparing different approaches for assessing the impact of COVID-19 lockdown on urban air quality in Reading, UK. Atmos. Res. 2021, 261, 105730. [Google Scholar] [CrossRef]
- Chen, L.W.A.; Chien, L.C.; Li, Y.; Lin, G. Nonuniform impacts of COVID-19 lockdown on air quality over the United States. Sci. Total Environ. 2020, 745, 141105. [Google Scholar] [CrossRef]
- Bekbulat, B.; Apte, J.S.; Millet, D.B.; Robinson, A.L.; Wells, K.C.; Presto, A.A.; Marshall, J.D. Changes in criteria air pollution levels in the US before, during, and after Covid-19 stay-at-home orders: Evidence from regulatory monitors. Sci. Total Environ. 2021, 769, 144693. [Google Scholar] [CrossRef] [PubMed]
- Yang, J.N.; Wen, Y.F.; Wang, Y.; Zhang, S.J.; Pinto, J.P.; Pennington, E.A.; Wang, Z.; Wu, Y.; Sander, S.P.; Jiang, J.H.; et al. From COVID-19 to future electrification: Assessing traffic impacts on air quality by a machine-learning model. Proc. Natl. Acad. Sci. USA 2021, 118, e2102705118. [Google Scholar] [CrossRef] [PubMed]
- Shehzad, K.; Bilgili, F.; Kocak, E.; Xiaoxing, L.; Ahmad, M. COVID-19 outbreak, lockdown, and air quality: Fresh insights from New York City. Environ. Sci. Pollut. R. 2021, 28, 41149–41161. [Google Scholar] [CrossRef] [PubMed]
- Istanbul Metropolitan Municipality. Available online: https://havakalitesi.ibb.gov.tr/Pages/Reports (accessed on 27 October 2022).
- Mentese, S.; Ogurtani, S.O. Spatial and temporal look at ten-years air quality of Istanbul city. Int. J. Environ. Sci. Tech. 2021, 19, 925–938. [Google Scholar] [CrossRef]
- Carslaw, D.C.; Ropkins, K. Openair—An R package for air quality data analysis. Environ. Model. Softw. 2012, 27–28, 52–61. [Google Scholar] [CrossRef]
- R Core Team. R: A Language and Environment for Statistical Computing; R Foundation for Statistical Computing: Vienna, Austria, 2022; Available online: https://www.R-project.org (accessed on 16 September 2022).
- EU Air Quality Standards. Available online: https://www.eea.europa.eu/themes/air/air-quality-concentrations/air-quality-standards (accessed on 16 September 2022).
- WHO Global Air Quality Guidelines. Particulate Matter (PM2.5 and PM10), Ozone, Nitrogen Dioxide, Sulfur Dioxide, and Carbon MoNOxide. Available online: https://apps.who.int/iris/bitstream/handle/10665/345329/9789240034228-eng.pdf?sequence=1&isAllowed=y (accessed on 14 July 2022).
- Çapraz, Ö.; Deniz, A. Particulate matter (PM10 and PM2.5) concentrations during a Saharan dust episode in Istanbul. Air Qual. Atmos. Health 2020, 14, 109–116. [Google Scholar] [CrossRef]
- Wang, L.Q.; Li, M.Y.; Yu, S.C.; Chen, X.; Li, Z.; Zhang, Y.B.; Jiang, L.H.; Xia, Y.; Li, J.L.; Liu, W.F.; et al. Unexpected rise of ozone in urban and rural areas, and sulfur dioxide in rural areas during the coronavirus city lockdown in Hangzhou, China: Implications for air quality. Environ. Chem. Lett. 2020, 18, 1713–1723. [Google Scholar] [CrossRef]
- Wang, Y.J.; Wen, Y.F.; Wang, Y.; Zhang, S.J.; Zhang, K.M.; Zheng, H.T.; Xing, J.; Wu, Y.; Hao, J.M. Four-Month Changes in Air Quality during and after the COVID-19 Lockdown in Six Megacities in China. Environ. Sci. Tech. Let. 2020, 7, 802–808. [Google Scholar] [CrossRef]
- Zeng, J.H.; Wang, C. Temporal characteristics and spatial heterogeneity of air quality changes due to the COVID-19 lockdown in China. Resour. Conserv. Recycl. 2022, 181, 106223. [Google Scholar] [CrossRef]
- Müngen, A.A. Measurement of the effects of parks on air pollution in megacities: Do parks support health betterment? Edge-Things Pers. Healthc. Support Syst. 2022, 359–375. [Google Scholar] [CrossRef]
- Zhou, M.G.; Hu, T.T.; Zhang, W.Q.; Wang, Q.; Kong, L.; Zhou, M.L.; Rao, P.H.; Peng, W.M.; Chen, X.X.; Song, X.J. COVID-19 pandemic: Impacts on air quality and economy before, during and after lockdown in China in 2020. Environ. Technol. Latest Issue. 2022. [Google Scholar] [CrossRef] [PubMed]
- Ethan, C.J.; Mokoena, K.K.; Yu, Y. Air Quality Status in Wuhan City during and One Year after the COVID-19 Lockdown. Aerosol Air Qual. Res. 2022, 22, 210282. [Google Scholar] [CrossRef]
- Zangari, S.; Hill, D.T.; Charette, A.T.; Mirowsky, J.E. Air quality changes in New York City during the COVID-19 pandemic. Sci. Total Environ. 2020, 742, 140496. [Google Scholar] [CrossRef] [PubMed]

| PM10 (μg/m3) | Daily Mean | Hourly Maximum | Hourly Mean | |||||||||
|---|---|---|---|---|---|---|---|---|---|---|---|---|
| Station Type | Station ID and Name | 2016 | 2017 | 2018 | 2019 | 2020 | Before | After | Before | After | p-Value | Change % |
| Background | 0134000 Kumkoy | 28.1 | 23.9 | 22.4 | 19.0 | 14.3 | 222.2 | 111.9 | 22.4 | 12.0 | <0.05 | −46.6 |
| 0134016 Sile | 24.9 | 30.2 | 25.7 | 24.6 | 24.6 | 733.5 | 470.0 | 26.1 | 26.2 | 0.9691 | 0.2 | |
| 0134021 Buyukada | 25.9 | 25.9 | 23.9 | 21.9 | 18.0 | 492.9 | 1113.0 | 24.0 | 17.2 | <0.05 | −28.2 | |
| Sea Traffic | 0134005 Kandilli-II | 42.9 | 40.4 | 35.5 | 34.0 | 28.5 | 985.0 | 202.0 | 37.9 | 29.6 | <0.05 | −22.0 |
| Urban | 0134011 Esenyurt | 75.1 | 75.9 | 64.7 | 61.1 | 52.4 | 985.0 | 642.0 | 69.0 | 53.5 | <0.05 | −22.4 |
| 0134013 Kagithane-II | - | - | - | - | - | - | - | - | - | - | - | |
| 0134025 Yenibosna | 55.6 | 51.8 | 42.6 | 35.3 | 39.7 | 567.3 | 299.9 | 46.1 | 37.9 | <0.05 | −17.8 | |
| 0134026 Alibeykoy | 57.9 | 56.3 | 54.4 | 71.0 | 65.8 | 864.2 | 575.0 | 61.3 | 58.3 | <0.05 | −4.9 | |
| 0134028 Sariyer | 38.0 | 27.3 | 23.9 | 15.8 | 18.7 | 436.6 | 166.2 | 26.0 | 21.8 | <0.05 | −15.9 | |
| 0134031 Esenler | 52.1 | 51.1 | 38.4 | 39.1 | 32.8 | 849.5 | 317.0 | 44.3 | 33.3 | <0.05 | −24.9 | |
| 0134041 Bagcilar | - | - | - | 44.2 | 39.9 | 341.3 | 400.1 | 43.2 | 40.0 | <0.05 | −7.4 | |
| 0134012 Sultanbeyli | - | - | - | 33.4 | 32.9 | 143.4 | 140.6 | 35.2 | 32.5 | <0.05 | −7.4 | |
| 0134029 Kartal | 48.9 | 57.6 | 50.0 | 47.2 | 39.5 | 707.6 | 706.6 | 49.9 | 37.6 | <0.05 | −24.7 | |
| 0134033 Kadikoy | 51.9 | 48.1 | 43.9 | 36.6 | 32.2 | 974.0 | 779.6 | 44.3 | 31.7 | <0.05 | −28.4 | |
| 0134042 Sancaktepe | - | - | - | - | - | - | - | - | - | - | - | |
| 0134044 Tuzla | - | - | - | 45.9 | 34.0 | 625.6 | 468.8 | 43.5 | 41.2 | <0.05 | −5.3 | |
| Urban Traffic | 0134014 Sultangazi-IV | - | - | - | 58.5 | 54.7 | 454.5 | 467.6 | 59.1 | 51.1 | <0.05 | −13.5 |
| 0134020 Kagithane-I | 87.4 | - | 50.2 | 71.6 | 60.7 | 663.6 | 612.7 | 69.3 | 52.1 | <0.05 | −24.8 | |
| 0134036 Sultangazi-II | - | 88.3 | 55.1 | 53.1 | 50.9 | 1801.4 | 394.5 | 62.6 | 48.6 | <0.05 | −22.3 | |
| 0134030 Uskudar-I | 44.3 | 39.8 | 27.0 | 28.1 | 26.1 | 603.0 | 150.3 | 33.9 | 24.8 | <0.05 | −26.9 | |
| Rural | 0134043 Arnavutkoy | - | - | 36.5 | 34.7 | 41.4 | 344.4 | 238.2 | 35.9 | 39.2 | <0.05 | 9.1 |
| Industry Urban | 0134010 Basaksehir | 54.4 | 58.9 | 54.0 | 44.9 | 40.3 | 766.3 | 284.7 | 52.6 | 42.0 | <0.05 | −20.2 |
| Urban Background | 0134003 Avcilar | 42.5 | 36.1 | 27.7 | 28.2 | 26.7 | 356.8 | 409.4 | 31.7 | 26.3 | <0.05 | −17.1 |
| 0134018 Kandilli-I | - | 10.5 | 7,8 | 14.7 | 13.0 | 494.2 | 231.9 | 11.2 | 11.6 | <0.05 | 3.3 | |
| 0134017 Maslak | 28.1 | 31.7 | 43.5 | 35.0 | 34.3 | 631.6 | 2398.4 | 34.6 | 33.0 | <0.05 | −4.5 | |
| 0134027 Umraniye-I | 42.8 | 48.8 | 35.3 | 32.6 | 30.7 | 461.1 | 377.5 | 39.1 | 31.1 | <0.05 | −20.3 | |
| Quarry | 0134035 Sultangazi-III | - | 207.3 | 144.0 | 78.1 | 85.0 | 4213.5 | 1322.8 | 127.8 | 80.3 | <0.05 | −37.2 |
| 0134037 Sultangazi-I | - | 169.6 | 127.3 | 56.3 | 62.6 | 2540.8 | 823.4 | 104.6 | 64.0 | <0.05 | −38.9 | |
| Traffic | 0134002 Catladikapi | 69.0 | 46.5 | 29.7 | 32.2 | 23.0 | 583.2 | 108.7 | 44.2 | 22.6 | <0.05 | −48.9 |
| 0134007 Sirinevler | 23.8 | 57.0 | 48.6 | 45.1 | 42.6 | 398.6 | 338.6 | 43.7 | 41.1 | <0.05 | −5.9 | |
| 0134008 Mecidiyekoy | 52.3 | 48.4 | 55.9 | 64.6 | 52.1 | 887.4 | 322.1 | 55.3 | 52.1 | <0.05 | −5.7 | |
| 0134024 Besiktas | 42.0 | 43.2 | 33.5 | 35.3 | 26.6 | 5855.3 | 288.6 | 37.7 | 26.7 | <0.05 | −29.1 | |
| 0134032 Aksaray | 68.7 | 59.1 | 51.5 | 47.8 | 40.7 | 633.4 | 376.8 | 55.1 | 39.2 | <0.05 | −28.9 | |
| 0134001 Selimiye | 65.2 | 45.1 | 32.9 | 30.4 | 25.1 | 518.6 | 163.6 | 41.1 | 24.5 | <0.05 | −40.2 | |
| 0134019 Goztepe | 65.7 | 71.1 | 65.7 | 54.4 | 73.0 | 681.8 | 660.4 | 63.0 | 69.0 | <0.05 | 9.5 | |
| 0134069 Umraniye-II | 56.1 | 39.5 | 40.8 | 29.2 | 32.6 | 668.3 | 380.5 | 41.0 | 36.3 | <0.05 | −11.3 | |
Publisher’s Note: MDPI stays neutral with regard to jurisdictional claims in published maps and institutional affiliations. |
© 2022 by the author. Licensee MDPI, Basel, Switzerland. This article is an open access article distributed under the terms and conditions of the Creative Commons Attribution (CC BY) license (https://creativecommons.org/licenses/by/4.0/).
Share and Cite
Tan, E. The Long-Term Impact of COVID-19 Lockdowns in Istanbul. Int. J. Environ. Res. Public Health 2022, 19, 14235. https://doi.org/10.3390/ijerph192114235
Tan E. The Long-Term Impact of COVID-19 Lockdowns in Istanbul. International Journal of Environmental Research and Public Health. 2022; 19(21):14235. https://doi.org/10.3390/ijerph192114235
Chicago/Turabian StyleTan, Elçin. 2022. "The Long-Term Impact of COVID-19 Lockdowns in Istanbul" International Journal of Environmental Research and Public Health 19, no. 21: 14235. https://doi.org/10.3390/ijerph192114235
APA StyleTan, E. (2022). The Long-Term Impact of COVID-19 Lockdowns in Istanbul. International Journal of Environmental Research and Public Health, 19(21), 14235. https://doi.org/10.3390/ijerph192114235