Evaluation and Prediction of Ecological Sustainability in the Upper Reaches of the Yellow River Based on Improved Three-Dimensional Ecological Footprint Model
Abstract
1. Introduction
2. Literature Review
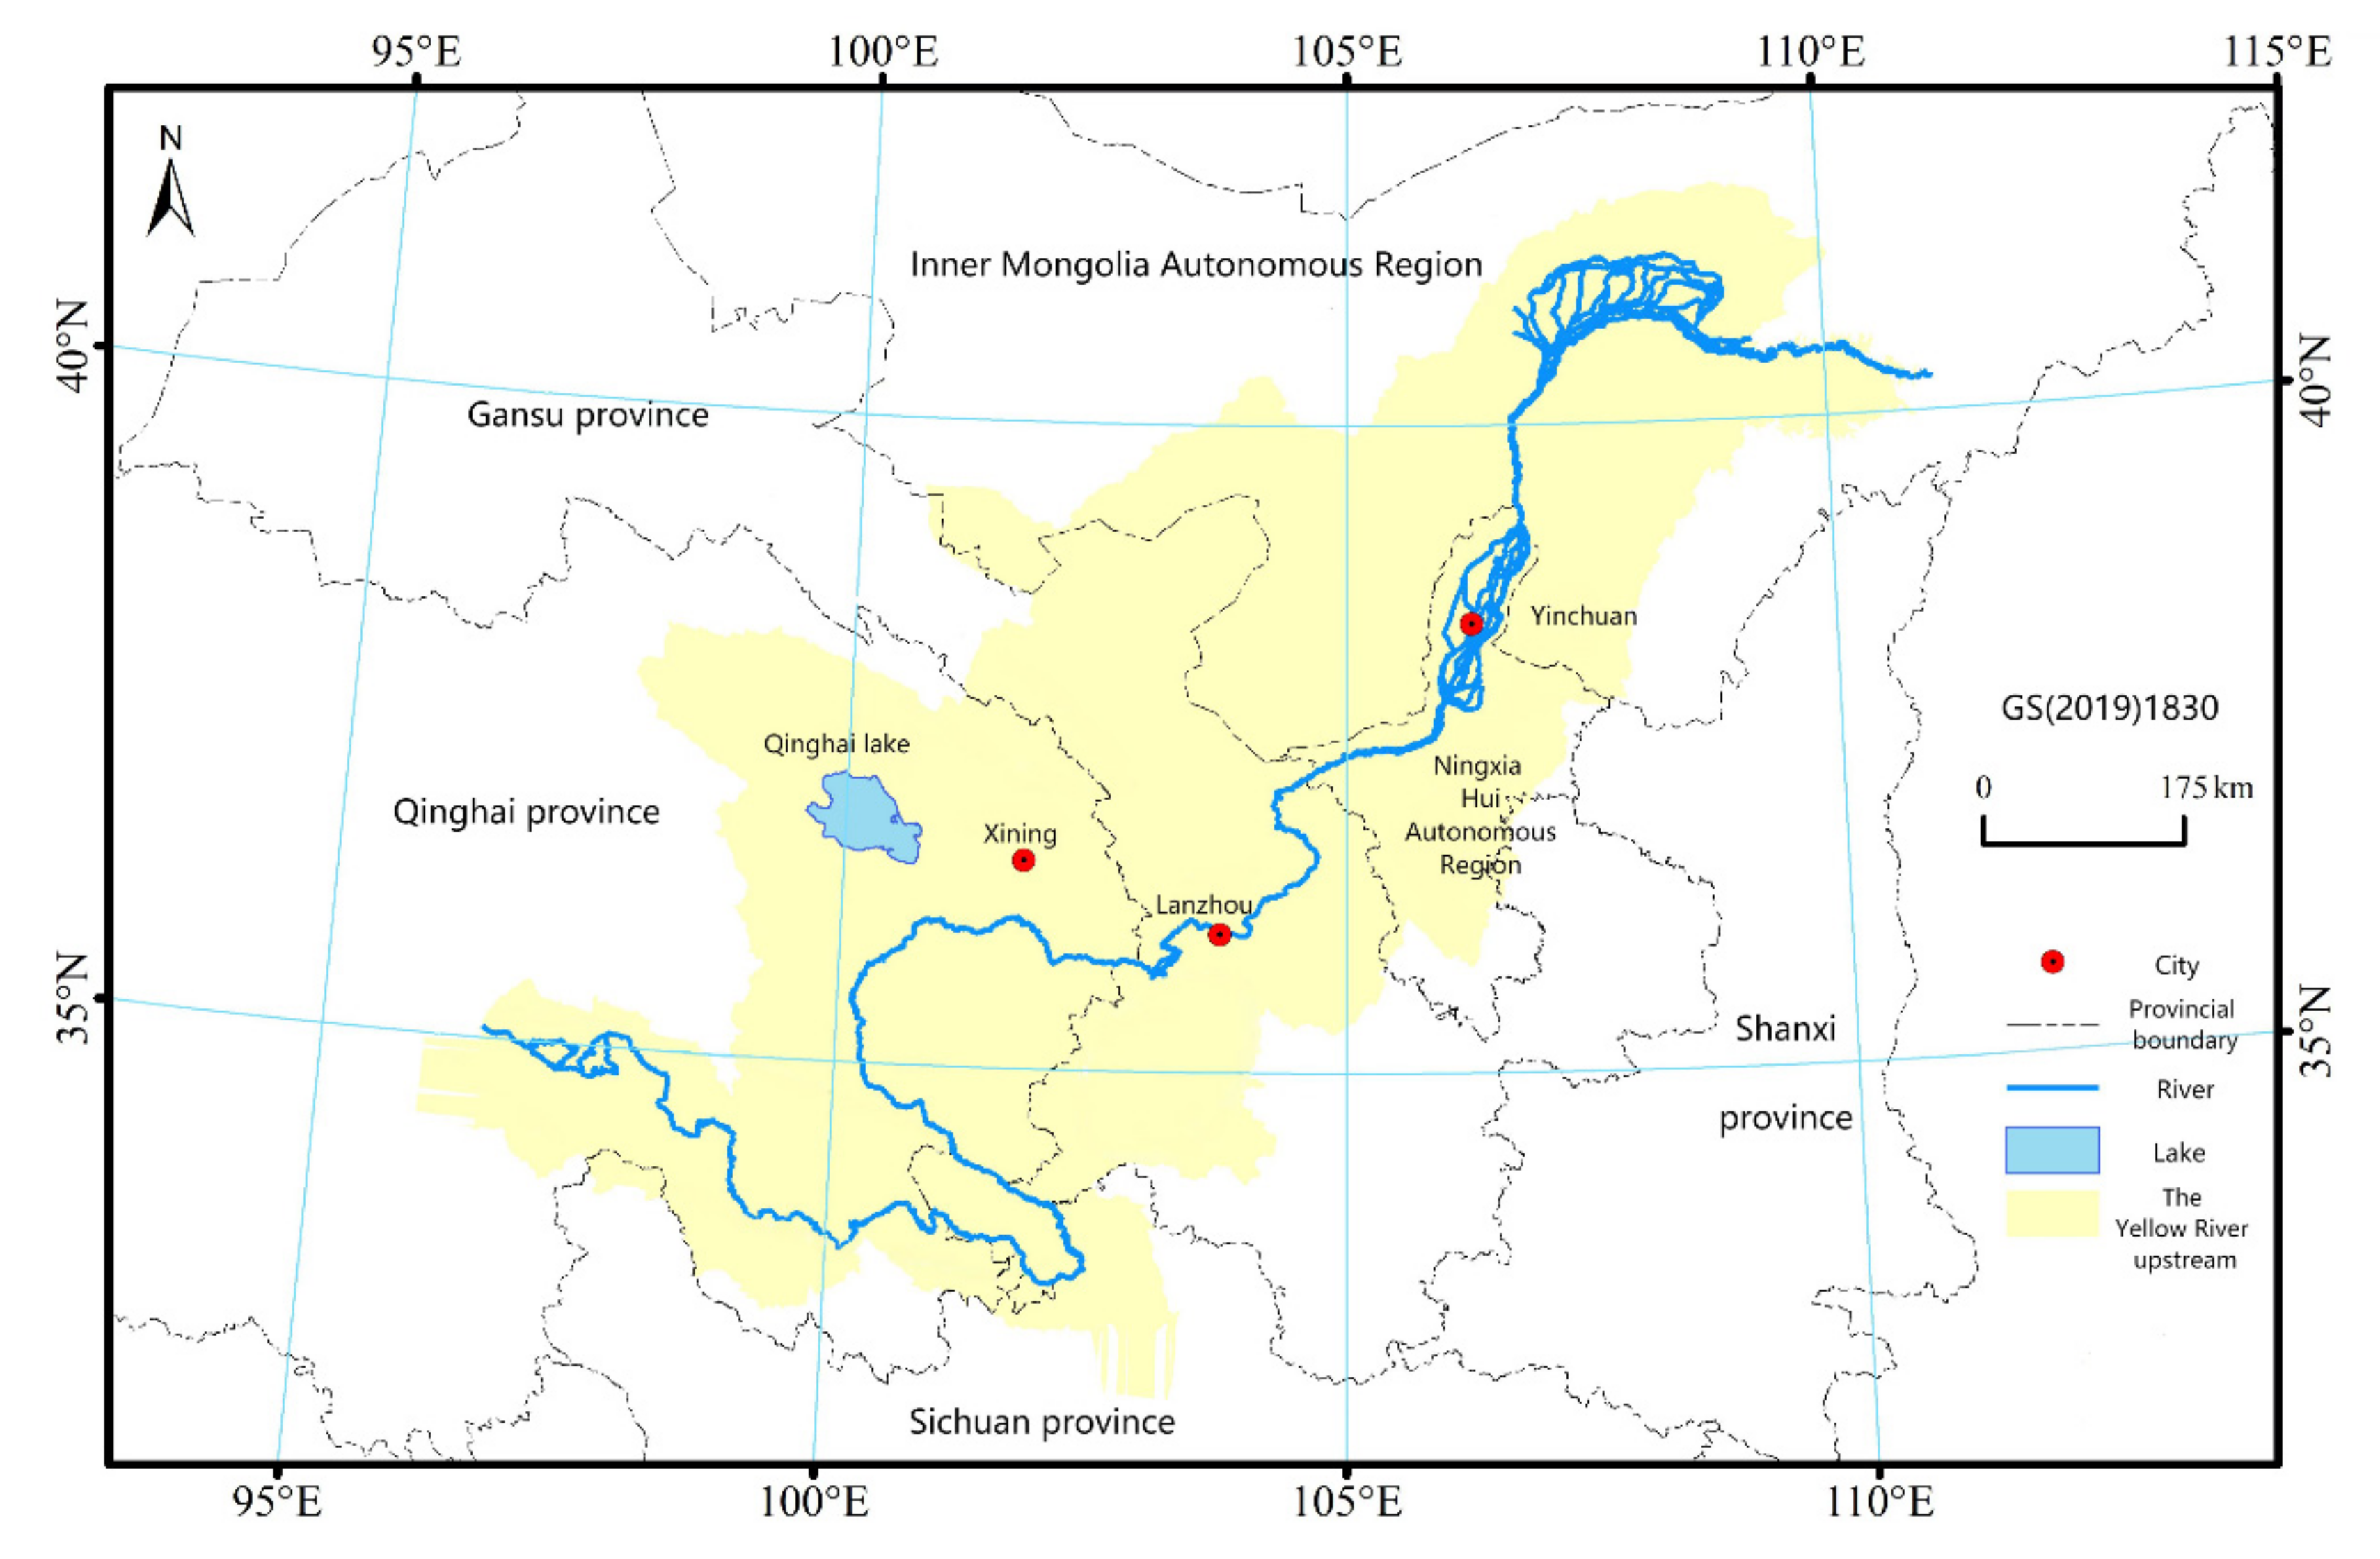
3. Study Area Overview
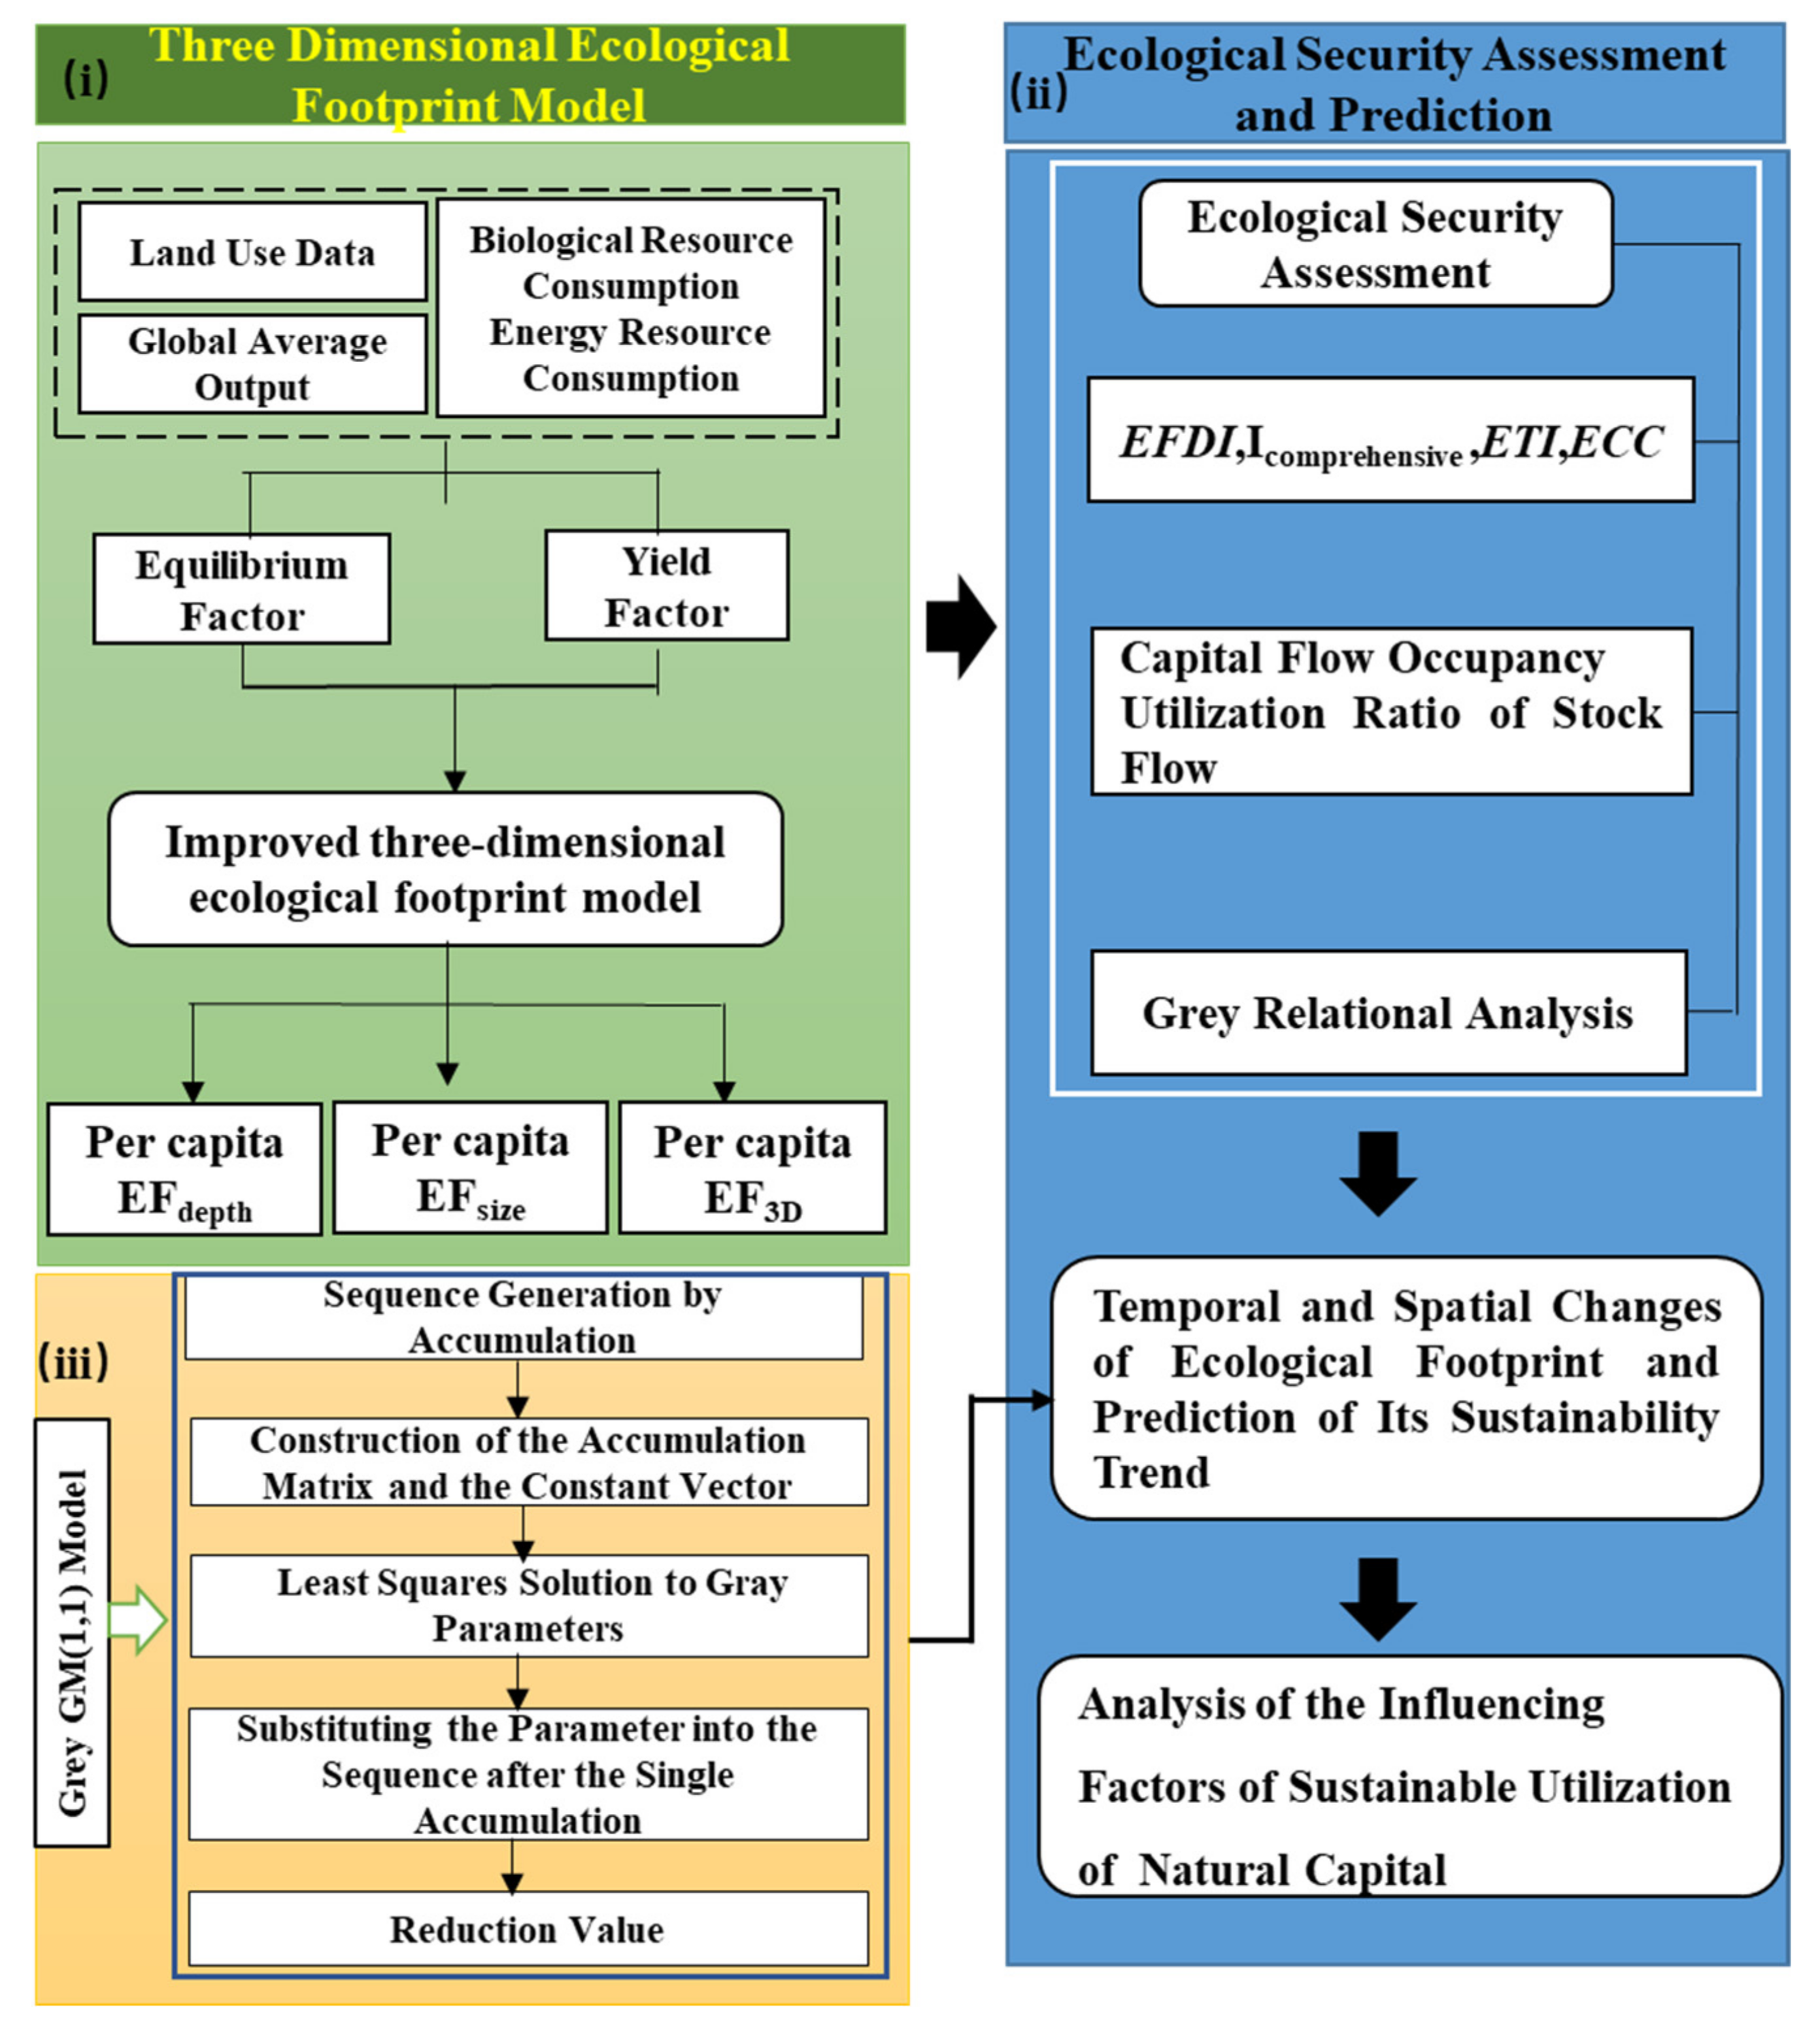
4. Research Methods and Data Sources
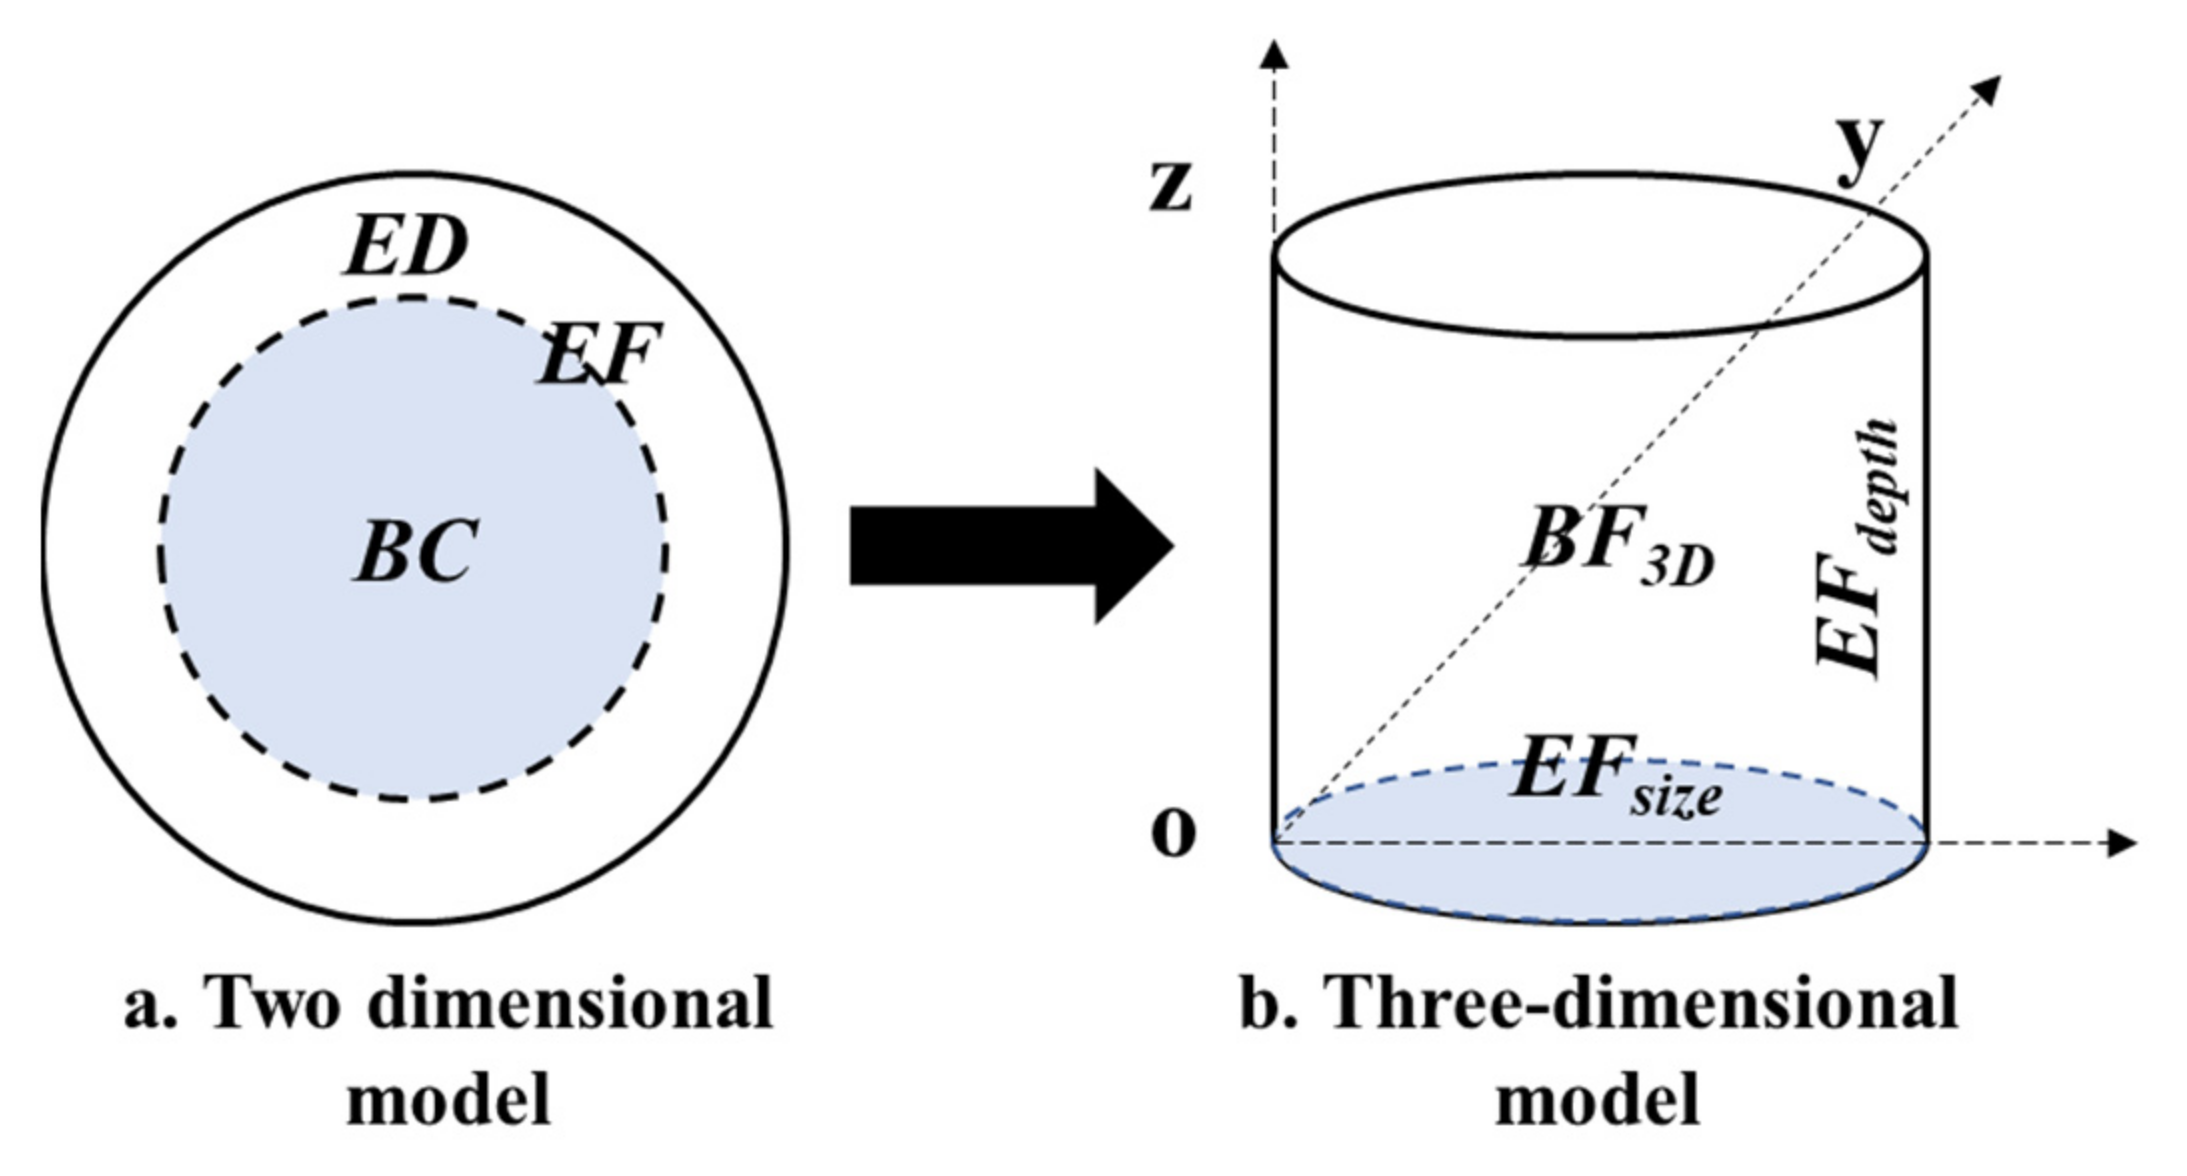
4.1. Three-Dimensional Ecological Footprint Model
4.2. Ecological Sustainability Evaluation Indicators
4.2.1. Ecological Footprint Diversity Index
4.2.2. Comprehensive Land Pressure Index
4.2.3. Ecological Pressure Index
4.2.4. Ecological Coordination Coefficient
4.2.5. Capital Flow Occupancy Rate and Stock Flow Utilization Ratio
- (1)
- Capital flow occupancy rate
- (2)
- Stock flow utilization ratio
4.3. Gray Correlation Analysis
4.4. The Gray GM (1,1) Model
- (1)
- Sequence generation by accumulation
- (2)
- Construction of the accumulation matrix, B, and the constant vector,where:
- (3)
- Determination of the least squares solution to the gray parameter vector,
- (4)
- Substitution of the parameter into the sequence after the single accumulation
- (5)
- Retrieval of the reduction value
- (6)
- Calculation of the residual error and the relative errorwhere is the residual error and is the relative error.
- (7)
- Evaluation of model accuracy
4.5. Data Source and Processing
5. Results and Analysis
5.1. Three-Dimensional Ecological Footprint Analysis of Provinces and Regions in the Upper Reaches of the Yellow River
5.2. Dynamic Analysis of Ecological Security in the Upper Reaches of the Yellow River
5.3. Prediction and Analysis of Spatio-Temporal Changes and Sustainability Trend of Ecological Footprint in Four Provinces
5.4. Correlation Analysis of Sustainable Utilization of Natural Capital in the Upper Reaches of the Yellow River
6. Discussion
6.1. Advantages and Applicability of the Method
6.1.1. Advantages and Uncertainties of Three-Dimensional Ecological Footprint Model
6.1.2. Selection of Ecological Security Evaluation Index System
6.2. Discussion and Suggestions
7. Conclusions
- (1)
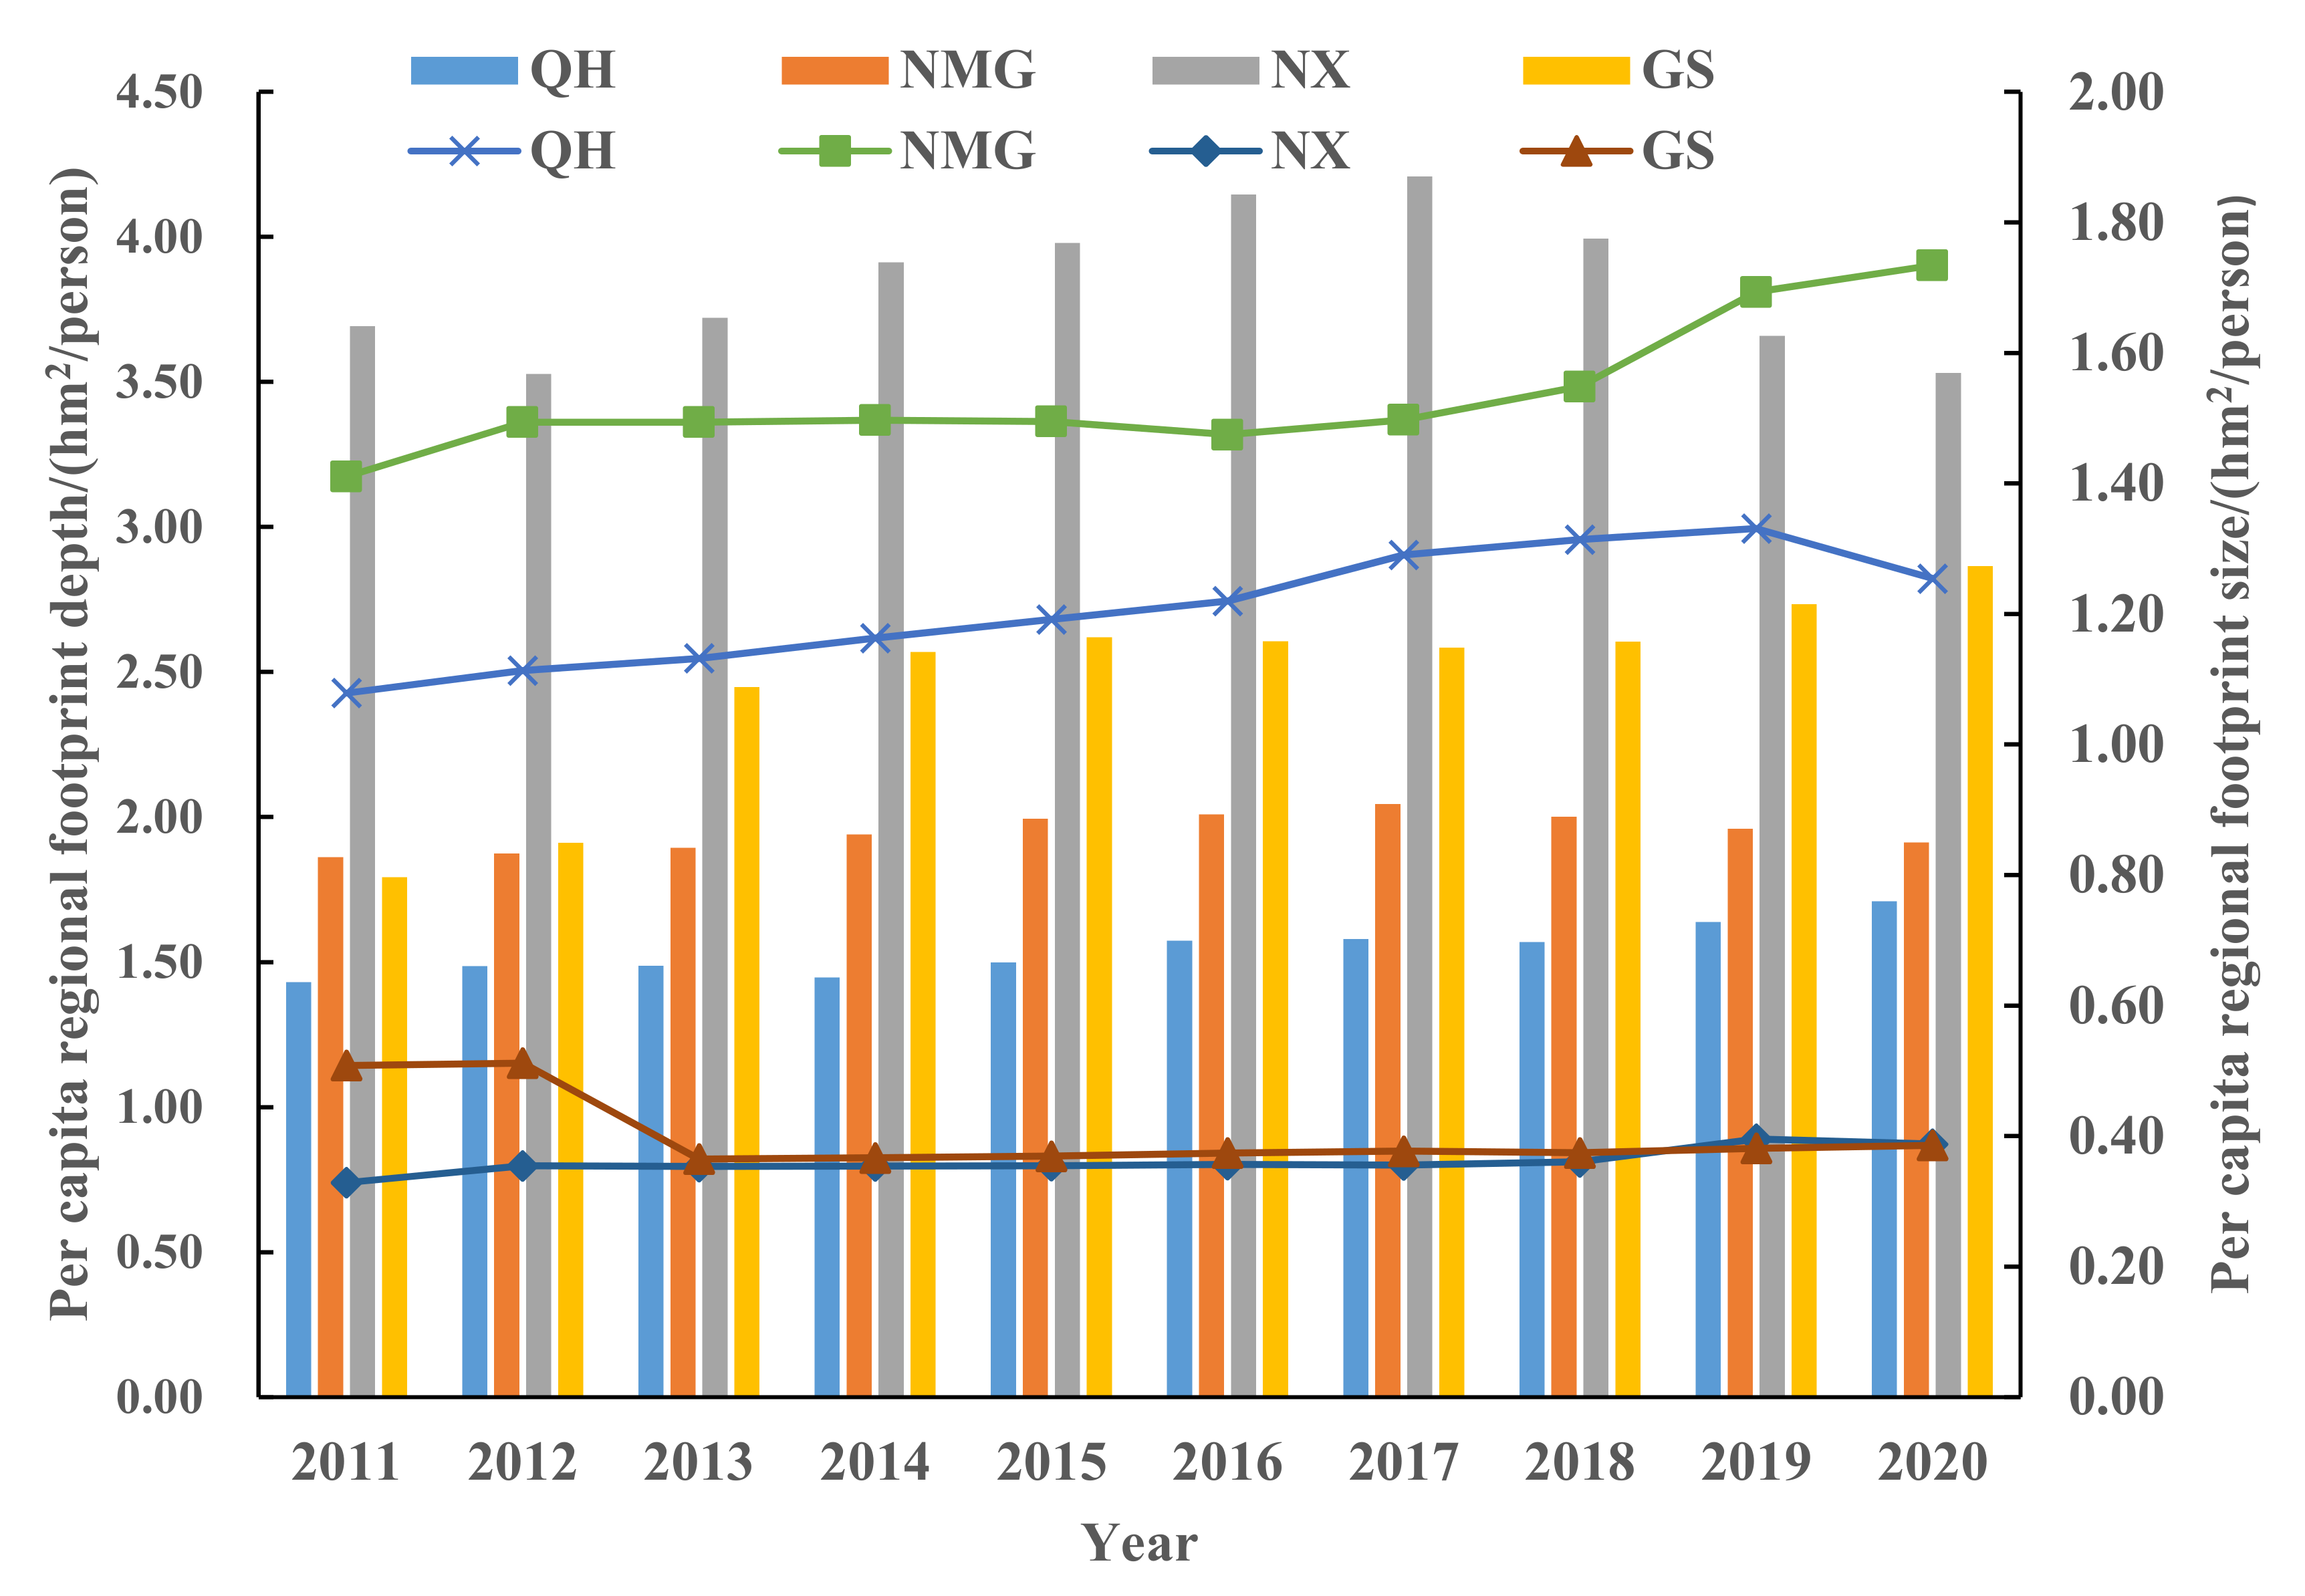
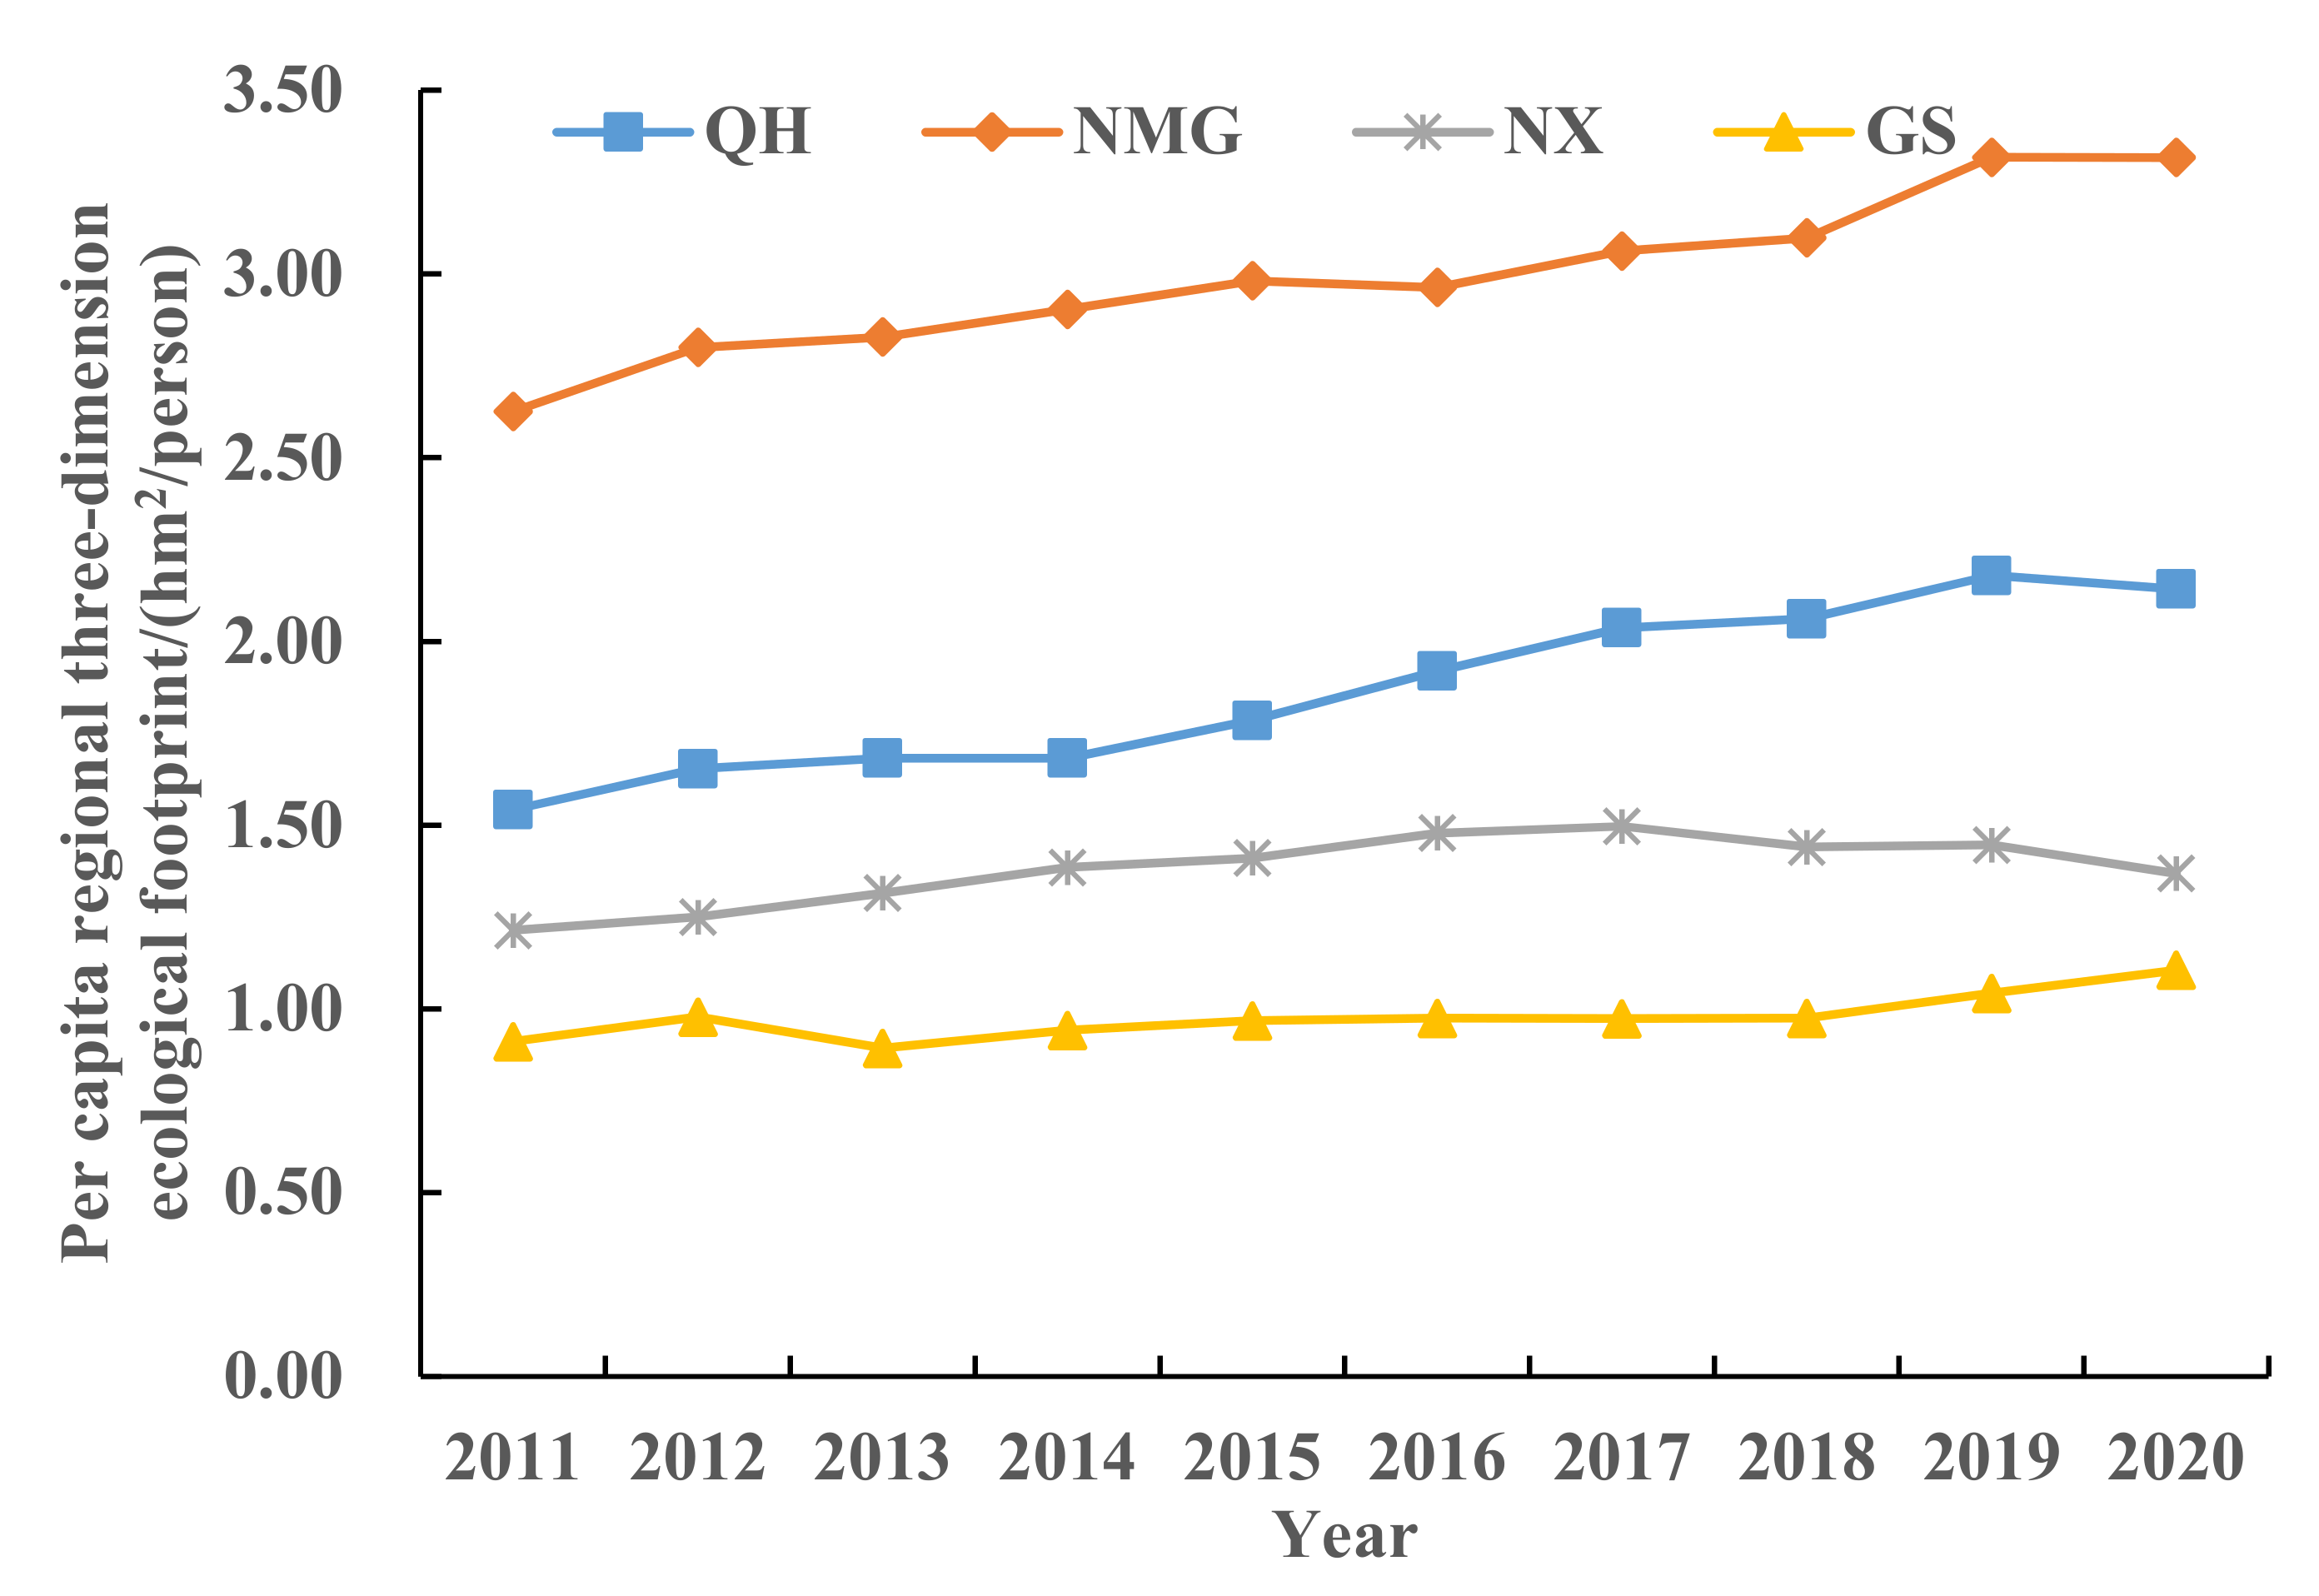
- From 2011 to 2020, the per capita footprint of all provinces and regions increased first and then decreased. In addition to the significant increase in QH and GS, the per capita footprint depth in NX and NMG increased first and then decreased. The order of numerical value is: NX > GS > NMG > QH. The distribution of the three-dimensional ecological footprint is unbalanced, and the whole is in a fluctuating upward trend, with the highest growth in NMG, from 2.6256 hm2/person in 2011 to 3.3163 hm2/person in 2020, with an average annual growth rate of 2.36%.
- (2)
- The land comprehensive pressure index (Icomprehensive) in the upper reaches of the Yellow River increased slowly year by year, from 1.4440 in 2011 to 1.7029 in 2020. From the perspective of ecological supply and demand, the ETI of the upper reaches of the Yellow River has increased significantly since 2015, from 2.13 in 2011 to 3.28 in 2020, which is a serious insecurity. The EFDI index fluctuates slightly, but increases year by year. The ECC value decreases year by year, from 1.4068 in 2011 to 1.2482 in 2020, indicating that the coordination is weakening year by year.
- (3)
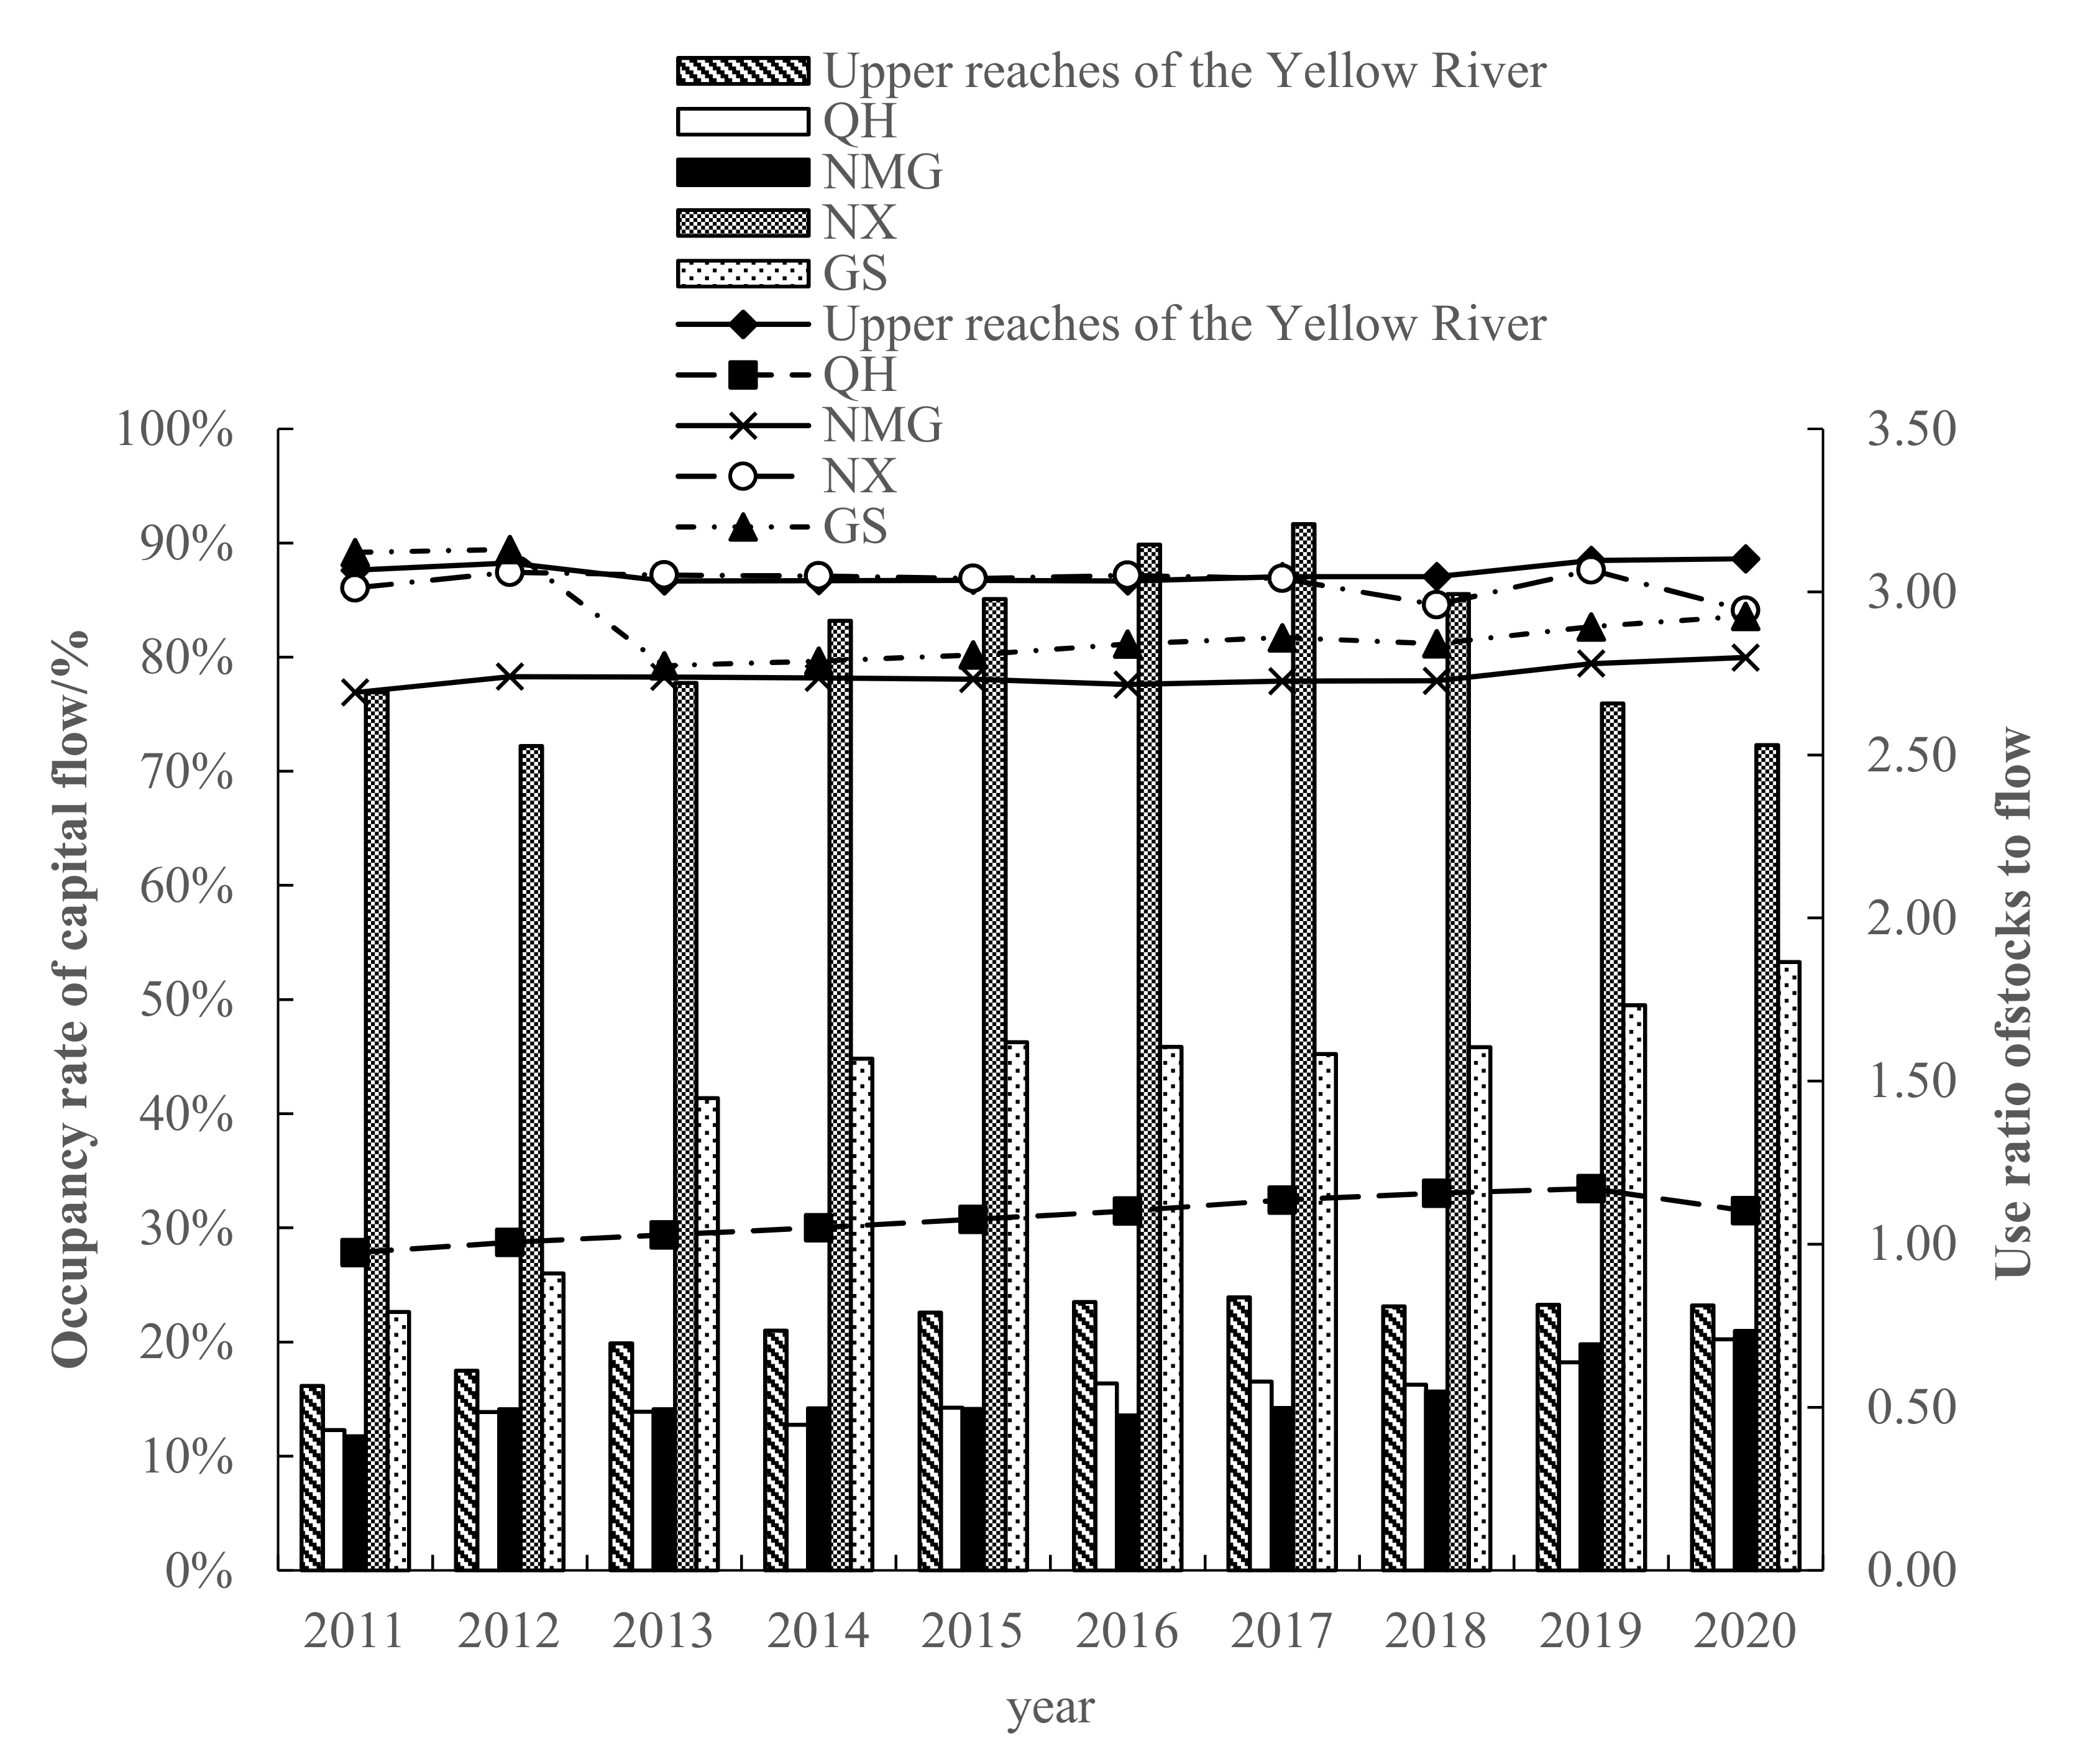
- From the perspective of the share of capital flow and the utilization ratio of stock flow, the upper reaches of the Yellow River has been above 86.67% and fluctuated for a long time during the study period, reaching a peak of 88.61% in 2020. has increased year by year, from 0.57 to 0.82, indicating that there is an ecological surplus in the upper reaches of the Yellow River. Although the region has good resource endowment conditions, the consumption of capital stock is still increasing. In addition, the ecological environment is fragile, and the overall ecological security is relatively poor.
- (4)
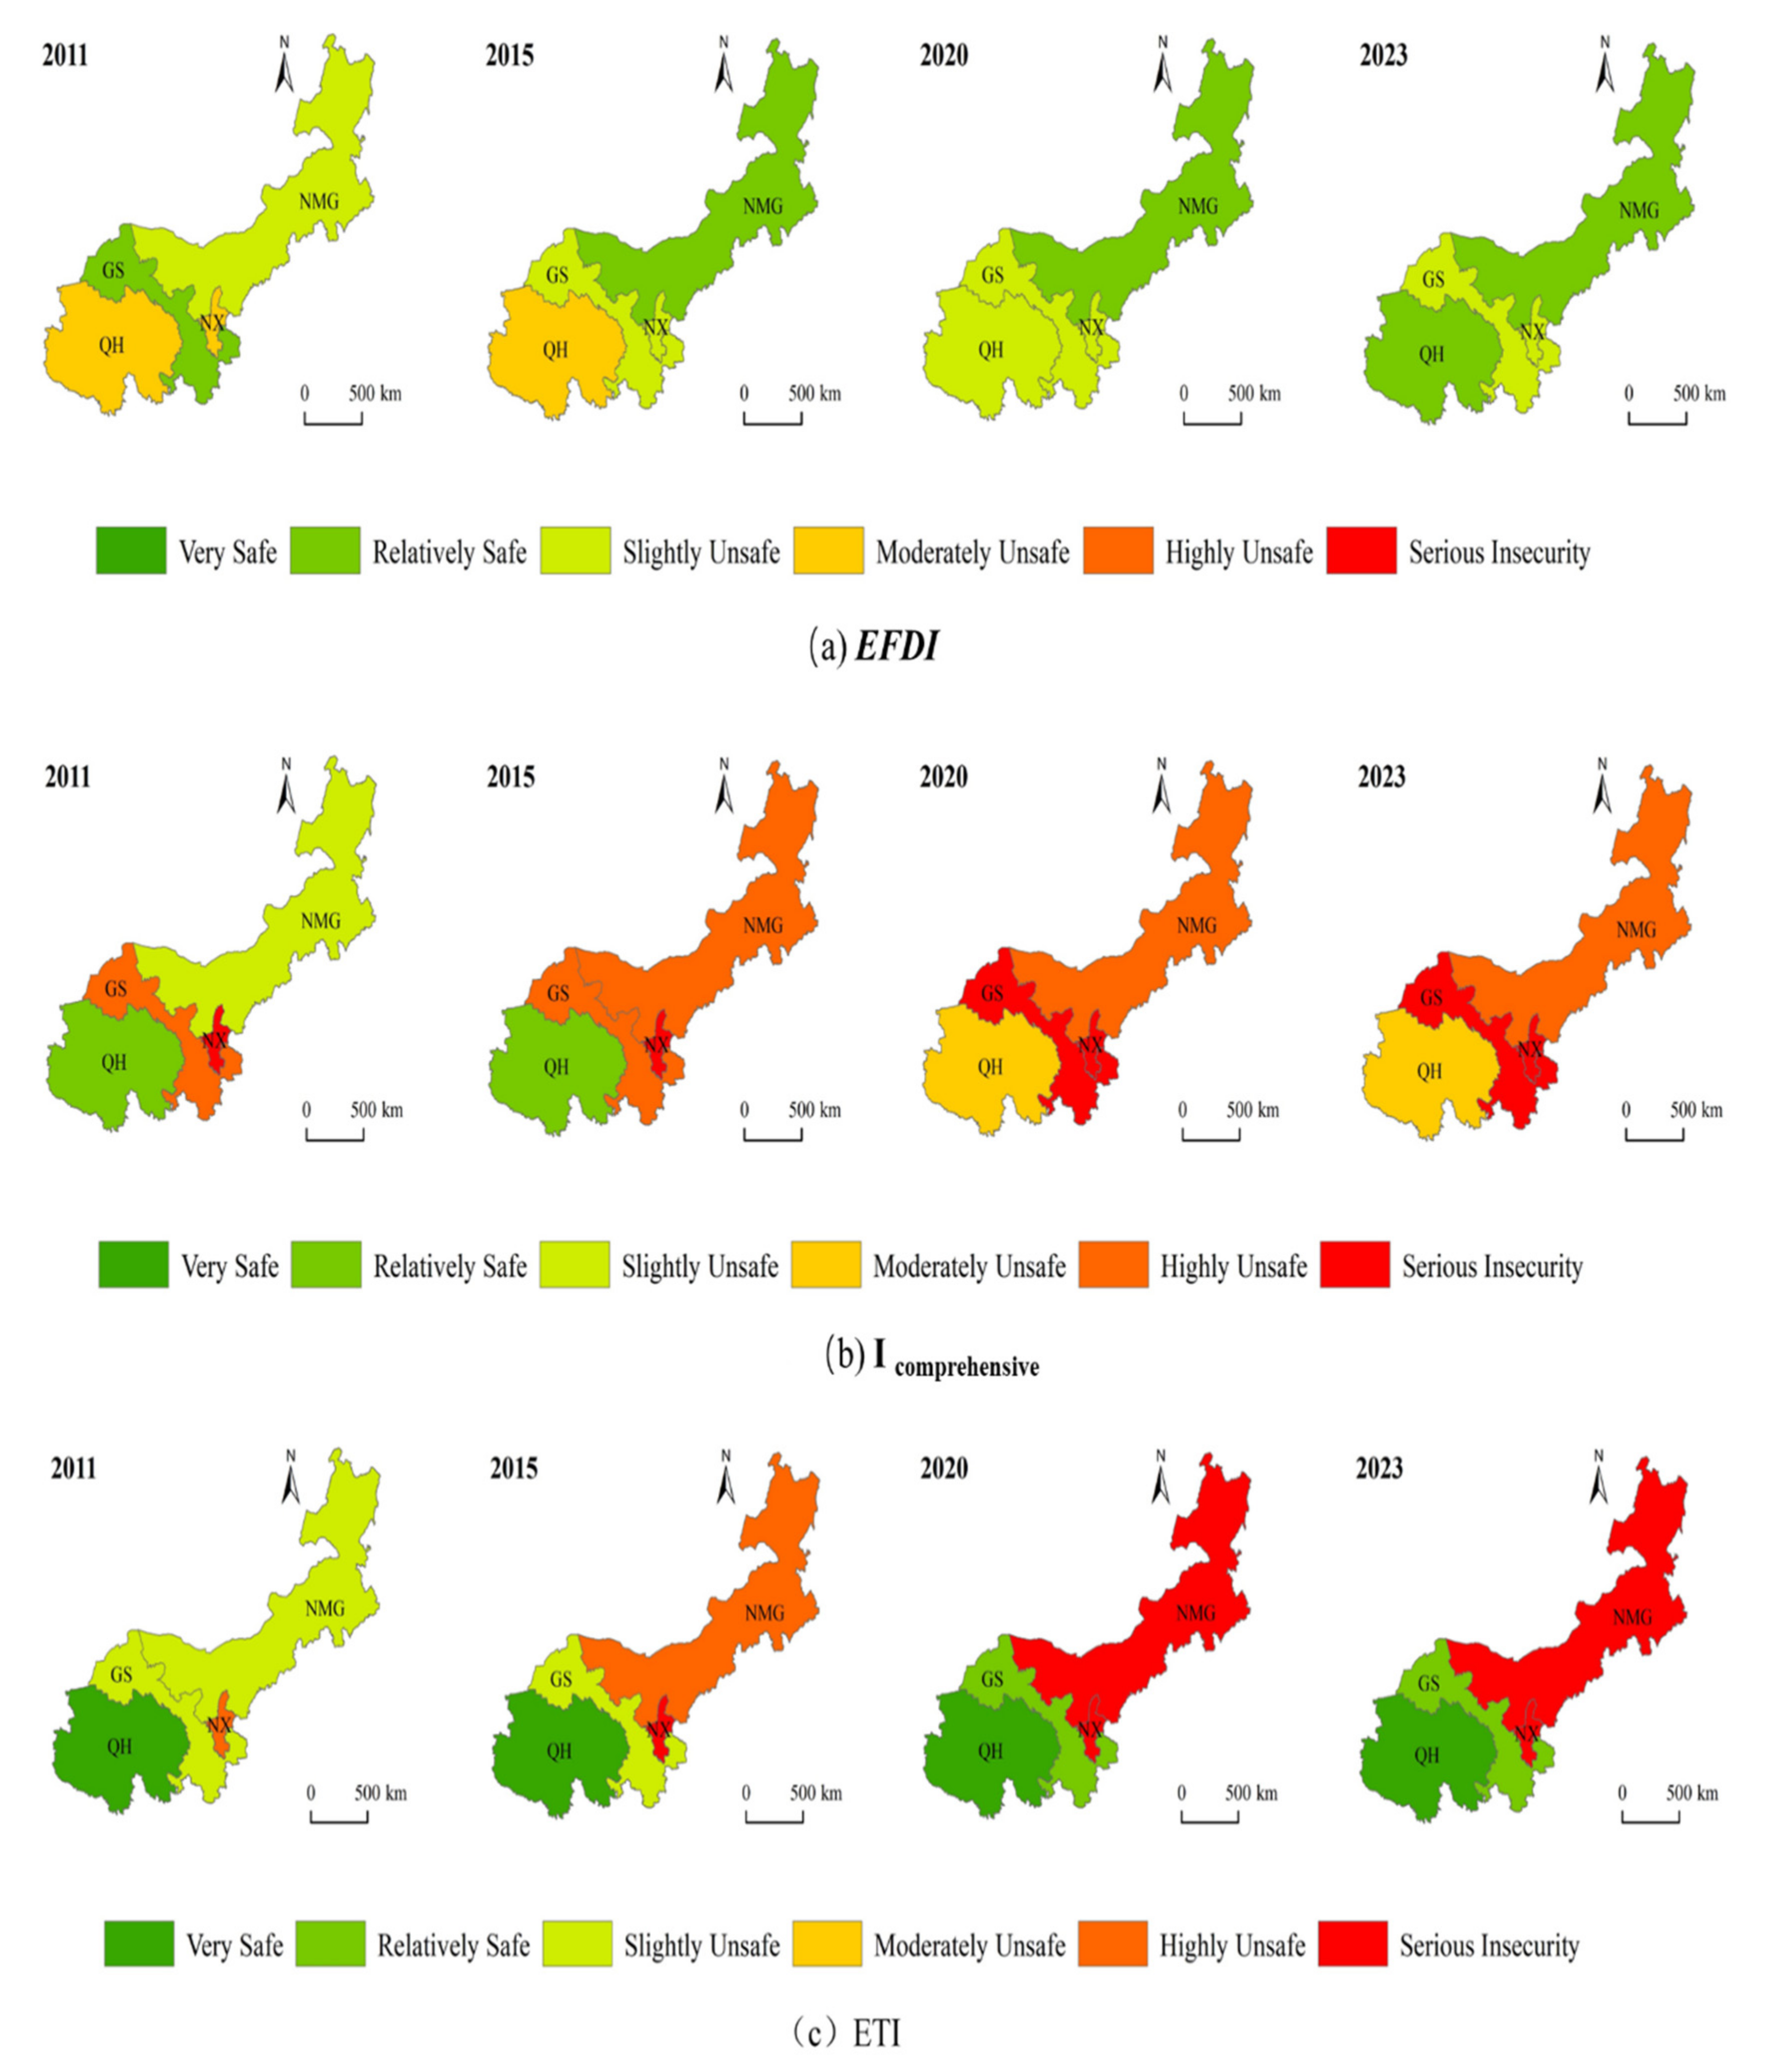
- From the perspective of spatial distribution characteristics, the number of land comprehensive pressure states and ecological security pressure states of the provinces and regions in the upper reaches of the Yellow River in the four periods are better in the northeast than in the southwest. The distribution trend of ecological footprint diversity is “high in the southwest and low in the northeast”. In 2011, except for NX, all provinces and autonomous regions were in a state of mild insecurity or above. However, by 2015, the ecological pressure in NMG had changed to a state of high insecurity, and then from 2020 to 2023, it showed an increase and a decrease in all regions.
- (5)
- Correlation and driver analysis: ETI has the largest correlation coefficient with GDP per capita, disposable income of urban residents, and urbanization rate, reaching 0.97–0.98. The correlation between EFdepth and fiscal revenue, industrial output value, arable land area, fixed asset investment, and disposable income of urban residents is strong, ranging from 0.87–0.94. Except for EFsize, which is significantly correlated with total energy consumption, the correlation between other factors is weak. EF3D was significantly correlated with GDP per capita, fiscal revenue, disposable income of urban residents, urbanization rate, industrial output value, and total energy consumption, with correlation coefficients of 0.91–0.98.
Funding
Data Availability Statement
Acknowledgments
Conflicts of Interest
References
- Wei, L.; Liu, X.; Ma, C.; Cheng, J.; Wei, J.; Zeng, D. Poverty reduction turn and high-quality development in the upper reaches of the Yellow River. Resour. Sci. 2020, 42, 197–205. [Google Scholar]
- Xu, H.; Shi, N.; Wu, L.; Zhang, D. High-quality development level and its spatiotemporal changes in the Yellow River Basin. Resour. Sci. 2020, 42, 115–126. [Google Scholar] [CrossRef]
- Yang, Y.; Zhang, X.; Mu, Y.; Zhang, W. The Basic Logic and Core Strategies of Ecological Protection and High-Quality Development in the Upper Reaches of the Yellow River. Econ. Geogr. 2020, 40, 9–20. [Google Scholar]
- Lan, J.Q.; Xie, S.Y. Sustainable Analysis of Water Resources in Qingdao Based on Ecological Footprint Theory. J. Southwest China Norm. Univ. (Nat. Sci. Ed.) 2020, 45, 55–62. [Google Scholar]
- Lu, Y.; Shen, Y.J.; Huang, S.Z.; Yang, X.Y.; Li, X.G. Research on Sustainable Development Evaluation of Xiuning County Based on Ecological Footprint Theory. J. Fudan Univ. (Nat. Sci.) 2019, 58, 756–764. [Google Scholar]
- Yue, S.P.; Yan, Y.C.; Zhang, Y.W. Spatiotemporal differentiation of ecological sustainability in Northeast China transect in recent 30 years. J. Nat. Disasters 2010, 19, 31–37. [Google Scholar]
- Fang, X.; Liu, D.L.; Cao, Y.; Li, B.C. Dynamic Changes of Ecological Footprint and Its Driving Model in Shaanxi Province. Bull. Soil Water Conserv. 2013, 33, 54–58+63. [Google Scholar]
- Rees, W.E. Ecological footprints and appropriated carrying capacity: What urban economics leaves out. Environ. Urban. 1992, 4, 121–130. [Google Scholar] [CrossRef]
- Xiong, Y.; Ai, G.X.; Zhou, C.; Yao, Y.; Xie, Q. Temporal and spatial evolution of ecological sustainability in Dongting Lake area based on the improved three-dimensional ecological footprint model. Acta Ecol. Sin. 2022, 42, 1165–1179. [Google Scholar]
- Liu, C.; Xu, y.; Sun, P.; Liu, J. Evaluation of Ecological Sustainability Based on Revised Three-dimensional Model of Ecological Footprint in Zhangjiakou City. Bulletion Soil Water Conserv. 2016, 36, 169–176. [Google Scholar]
- Peng, J.; Du, Y.; Ma, J.; Liu, Z.; Liu, Y.; Wei, H. Sustainability evaluation of natural capital utilization based on 3DEF model: A case study in Beijing City, China. Ecol. Indic. 2015, 58, 254–266. [Google Scholar] [CrossRef]
- Bagliani, M.; Galli, A.; Niccolucci, V.; Marchettini, N. Ecological footprint analysis applied to a sub-national area: The case of the Province of Siena (Italy). J. Environ. Manag. 2008, 86, 354–364. [Google Scholar] [CrossRef] [PubMed]
- Muñiz, I.; Galindo, A. Urban form and the ecological footprint of commuting. The case of Barcelona. Ecol. Econ. 2005, 55, 499–514. [Google Scholar] [CrossRef]
- Xu, Z.; Cheng, D.; Zhang, Z.; Cheng, G. Calculation and analysis on ecological footprints of China. Acta Pedol. Sin. 2002, 3, 441–445. [Google Scholar]
- Liu, M.; Li, W.-H.; Xie, G.-D. Estimation of China ecological footprint producation coeffient based on net primary productivity. Chin. J. Ecol. 2010, 29, 592–597. [Google Scholar]
- Dong, J.; Zhang, Z.; Zhang, H.; Gao, F.W.; Zhang, W.B.; Gong, W.M. Sustainable utilization and driving mechanism of natural capital in ecologically fragile areas. China Popul. Resour. Environ. 2021, 31, 162–173. [Google Scholar]
- Zhu, G.-L.; Wang, X.-Q.; Li, F.-Z.; Zou, W. Characteristics of Natural Capital of Yancheng Based on an Improved Three—Dimensional Model of Ecological Footprint. Chin. J. Soil Sci. 2017, 48, 1304–1311. [Google Scholar]
- Wackernagel, M.; Monfreda, C.; Schulz, N.B.; Erb, K.-H.; Haberl, H.; Krausmann, F. Calculating national and global ecological footprint time series: Resolving conceptual challenges. Land Use Policy 2004, 21, 271–278. [Google Scholar] [CrossRef]
- Lu, Y.; Li, X.S.; Jiang, D.M.; Lang, W.J.; Shen, C.Z.; Wei, X.C. Study on the calculation and spatial characteristics of regional ecological footprint profit and loss: Jiangsu Province as a case study. Acta Ecol. Sin. 2018, 38, 8574–8583. [Google Scholar]
- Liu, H.-Y.; Cheng, Q.-G.; Wei, J.-B.; Huang, X. Dynamics of natural capital in Shenyang based on improved three-dimensional ecological footprint. Chin. J. Appl. Ecol. 2017, 28, 4067–4074. [Google Scholar]
- Gottlieb, D.; Kissinger, M.; Vigoda-Gadot, E.; Haim, A. Analyzing the ecological footprint at the institutional scale—The case of an Israeli high- school. Ecol. Indic. 2012, 18, 91–97. [Google Scholar] [CrossRef]
- Qian, K. Ecological Footprint Analysis of Building Project Based on Energy Comsumption. Master’s Thesis, Tsinghua University, Beijing, China, 2010. [Google Scholar]
- Tan, D.; He, H. Emergy Ecological Footprint Analysis of Energy Consumption of China. Econ. Geogr. 2016, 36, 176–182. [Google Scholar]
- Li, B.; Cheng, D. Hotel ecological footprint model:Its construction and appliacation. Chin. J. Ecol. 2010, 29, 1463–1468. [Google Scholar]
- Niccolucci, V.; Bastianoni, S.; Tiezzi, E.B.P.; Wackernagel, M.; Marchettini, N. How deep is the footprint? A 3D representation. Ecol. Model. 2009, 220, 2819–2823. [Google Scholar] [CrossRef]
- Niccolucci, V.; Galli, A.; Reed, A.; Neri, E.; Wackernagel, M.; Bastianoni, S. Towards a 3D national ecological footprint geography. Ecol. Model. 2011, 222, 2939–2944. [Google Scholar] [CrossRef]
- Kai, F.; Reinout, H. A Review on Three-Dimensional Ecological Footprint Model for Natural Capital Accounting. Prog. Geogr. 2012, 31, 1700–1707. [Google Scholar]
- Fang, K. Ecological footprint depth and size: New indicators for a 3D model. Acta Ecol. Sin. 2013, 33, 267–274. [Google Scholar] [CrossRef]
- Fang, K.; Gao, K.; Li, H. International comparison of natural capital use: A three-dimensional model optimization of ecological footprint. Geogr. Res. 2013, 32, 1657–1667. [Google Scholar]
- Wei, L.L.; Li, L.B.; Lin, Y.; Wu, Y.; Qi, X.H. Evaluation of the ecological security of Urban Agglomeration on Min Delta based on ecological footprint. Acta Ecol. Sin. 2018, 38, 4317–4326. [Google Scholar]
- Jin, Y.; Liu, Q.; Li, C. Evaluation of Cultivated Land Carrying Capacity Based on an Improved Three-dimension Ecological Footprint Model: A Case Study of Jiangsu Province. China Land Sci. 2020, 34, 96–104. [Google Scholar]
- Li, P.-h.; Xu, L.-p.; Liu, X.; Wu, P.-r. Ecological security evaluation of an oasis in the north of the Tianshan Mountains based on three-dimensional ecological footprint model. Arid. Zone Res. 2020, 37, 1337–1345. [Google Scholar]
- Li, P.H.; Xu, L.P.; Zhang, J.M.; Jin, M.T.; Zhang, R.Q. Spatio-temporal changes of three-dimensional ecological footprint in inland river basins in Arid Region: A case study of the Manas River Basin. Acta Ecol. Sin. 2020, 40, 6776–6787. [Google Scholar]
- Wen, Y.; Gao, J.; Huang, L.; Lin, Z. Spatiotemporal Dynamics of Ecological Footprint and Efficiency of Natural Capital Utilization of Urban Agglomeration in Yangtze River Delta. Res. Soil Water Conserv. 2020, 27, 225–238. [Google Scholar]
- Chen, Y. Ecological base area and the thought of cherishing thrift. J. Tongji Univ. (Soc. Sci. Ed.) 1996, 1. [Google Scholar]
- Ewing, B.; Reed, A.; Rizk, S.; Galli, A.; Wackernagel, M.; Kitzes, J. Calculation Methodology for the National Footprint Accounts; Global Footprint Network: Oakland, CA, USA, 2008. [Google Scholar]
- Peng, X.Z.; Liu, Y.H. Ecological Footprint and Regional Eco-Optimum Population: Take China’s Western Provinces as an Example. Popul. Dev. 2004, 10, 9–15. [Google Scholar]
- Wu, L.J. Dynamic evaluation of China sustainable development based on the ecological footprint index. J. China Agric. Univ. 2005, 10, 94–99. [Google Scholar]
- Ma, X.Y. Ecological overpopulation based on ecological footprint theory. Soc. Sci. Guangdong 2007, 5, 189–194. [Google Scholar]
- Shen, W.D.; Xu, H. Study of ecological carrying capacity index based on three-dimension ecological footprint model-A case study of Hebei Province. Chin. J. Eco-Agric. 2018, 26, 505–515. [Google Scholar]
- Wang, Y.N.; Zhou, Q.; Wang, H.W. Assessing three-dimensional ecological footprint of 34 provinces in China. Acta Ecol. Sin. 2020, 40, 6434–6444. [Google Scholar]
- Su, Z.; Yuan, G.; Zhou, W. Evaluation of Land Carrying Capacity in Anhui Province Based on Revised Three-Dimensional Ecological Footprint Model. Res. Soil Water Conserv. 2020, 27, 256–262. [Google Scholar]
- Wu, R.; Li, C. Study on ecological sustainability of Xining City Based on three-dimensional ecological footprint model. New Height. 2020, 39, 83–88. [Google Scholar]
- Sheng, R.; Ji, R.; Chen, S.; Cai, J.; Chen, M.; Zhao, Z.; Liu, C.; Su, L.; Zeng, Y. Dynamic sustainable utilization of natural capital change of the Yangtze River Delta urban agglomeration based on the two-dimensional and three-dimensional ecological footprint model. J. Environ. Eng. Technol. 2022, 1–14. [Google Scholar]
- Wu, C.; Cao, G.; Chen, K.; Ba, D.; Liu, B.; Wang, R.; Shi, Y.E.C. Spatio-temporal Variation in Soil Conservation Service and Its Influencing Factors in the Upper Reaches of the Yellow River. J. Soil Water Conserv. 2022, 36, 143–150. [Google Scholar]
- National Bureau of Statistics. China Statistical Yearbook (2012–2021); China Statistics Press: Beijing, China, 2021.
- Dong, J.-h.; Zhang, Z.-b.; Zhang, W.-b. Dynamic change and driving force of natural capital utilization in Gansu Province based on three-dimensional ecological footprint. Chin. J. Ecol. 2019, 38, 3075–3085. [Google Scholar]
- Shannon, C.E.; Weaver, W. The mathematical theory of communication: MD Computing. Comput. Med. Pract. 1997, 14, 306–317. [Google Scholar]
- Jin, X.M.; Liu, Q.K. A nalysis of a land carrying capacity index based on an expanded three-dimensional ecological footprint model: A case study of Wenzhou. Acta Ecol. Sin. 2017, 37, 2982–2993. [Google Scholar]
- Zhao, X.-G.; Wei, L.-H.; Ma, C.-H.; Wang, J. Dynamics of Ecological Footprint and Ecological Safety in Xi’an. J. Arid. Land Resour. Environ. 2007, 21, 1–5. [Google Scholar]
- Liu, Y.-j.; Lu, W.-q.; Li, R. Hubei provice ecological footprint’s calculation and analysis. J. Cent. China Norm. Univ. (Nat. Sci.) 2004, 38, 259–262. [Google Scholar]
- Deng, J. Overview of grey system. World Sci. 1983, 1–5. [Google Scholar]
- Liu, S.F.; Yang, Y.J.; Wu, L.F. Grey System Theory and its Application, 7th ed.; Science Press: Beijing, China, 2014. [Google Scholar]
- Zhang, J.; Wu, Y.; Ge, Y.; Wang, C.; Hsiangte, K. Eco-security assessments of poor areas based on gray correlation model: A case study in Enshi. Geogr. Res. 2014, 33, 1457–1466. [Google Scholar]
- Deng, J.L. Grey Controlling System. Cent. Inst. Technol. 1982, 10, 9–18. [Google Scholar]
- Wang, Z.X.; Li, Q.; Pei, L.L. A seasonal GM (1,1) model for forecasting the electricity consumption of the primary economic sectors. Energy 2018, 154, 522–534. [Google Scholar] [CrossRef]
- Liu, X.Y.; Peng, H.Q.; Bai, Y.; Zhu, Y.J.; Liao, L.L. Tourism Flows Prediction Based on an Improved Grey GM (1,1) Model. Procedia-Soc. Behav. Sci. 2014, 138, 767–777. [Google Scholar] [CrossRef]
- Liu, S.F.; Deng, J.L. Applicative scope of the GM (1,1) model. Syst. Eng. Theory Pract. 2000, 20, 121–124. [Google Scholar]
- Wackernagel, M.; Onisto, L.; Bello, P.; Linares, A.C.; Falfán, I.S.L.; García, J.M.; Guerrero, A.I.S.; Guerrero, M.G.S. National natural capital accounting with the ecological footprint concept. Ecol. Econ. 1999, 29, 375–390. [Google Scholar] [CrossRef]
- Wang, H.; Li, J.; Tian, P.; Jiao, H.Y.; Wang, Z.Y.; Gao, Y. Research of spatial and temporal evolution and driving mechanism of local three-dimensional ecological footprint in Ningbo. Ecol. Sci. 2021, 40, 57–65. [Google Scholar]
- Lu, C.-x.; Xie, G.-d.; Cheng, S.-k.; Zhang, Y.-i.l. Evaluation of natural capital utilization with ecological footprint on the qinghai-tibet plateau. Resour. Sci. 2001, 29–35. [Google Scholar]
- WWF. Living Planet Report. 2006. Available online: http://www.panda.org/ (accessed on 30 August 2021).
- Wang, Y.; Wang, H. Assessing the ecological footprint and carrying capacity of Inner Mongolia in recent 20 years. Environ. Sci. Technol. 2020, 43, 218–224. [Google Scholar]
- Li, Y.-l.; Dai, G.-z.; Zhu, Y.-h. Text tendency categorization method based on class space model. Comput. Appl. 2007, 2194–2196. [Google Scholar]
- Du, Y.Y.; Peng, J.; Gao, Y.; Zhao, H. Sustainability evaluation of natural capital utilization based on a three-dimensional ecological footprint model: A case study of the Beijing-Tianjin-Hebei Metropolitan region. Prog. Geogr. 2016, 35, 1186–1196. [Google Scholar]
- Jin, M.T.; Xu, L.P.; Li, P.H. Spatial and temporal evolution of natural capital utilization in the three-dimensional ecological footprint under the regional economic differentiation in north and south Xinjiang. Acta Ecol. Sin. 2020, 40, 4327–4339. [Google Scholar]
- Fang, K. Assessing the natural capital use of eleven nations: An application of a revised three-dimensional model of ecological footprint. Acta Ecol. Sin. 2015, 35, 3766–3777. [Google Scholar]
- Xiao, D.; Chen, W. On the basic concepts and contents of ecological security. J. Appl. Ecol. 2002, 13, 354–358. [Google Scholar]
- Zhao, X.-G.; Ma, C.-H.; Gao, L.-F.; Wei, L.-H. Assessment of ecological safety under different scales based on ecological tension index. Chin. J. Eco-Agric. 2007, 135–138. [Google Scholar]
- Liu, J.-Q.; Ru, S.-F. Sustainability Evaluation Based on Ecological Footprints Theory in Yellow River Basin. Reform 2020, 139–148. [Google Scholar]
- Zhang, K.-Y.; Fu, S.-X.; Zhang, W.-B. Ecological Carrying Capacity of 31 Provinces Based on Improved Ecological Footprint Model. Sci. Geogr. Sin. 2011, 31, 1084–1089. [Google Scholar]



| Ecological Security Level | Ecological Pressure Index Range | Degree |
|---|---|---|
| I | <0.5 | Very safe |
| II | 0.51–0.80 | Relatively safe |
| III | 0.81–1.00 | Slightly unsafe |
| IV | 1.01–1.50 | Moderately unsafe |
| V | 1.51–2.00 | Highly unsafe |
| VI | >2 | Serious insecurity |
| Items | Indicator Selection | Data Source |
|---|---|---|
| Biological resources account | Arable land: cereals, wheat, corn, beans, potatoes, oilseeds, vegetables and edible mushrooms, melons and fruits | Statistical Yearbook of Qinghai Province (2012–2021), Statistical Yearbook of Gansu Province (2012–2021), Statistical Yearbook of Ningxia Hui Autonomous Region (2012–2021), Statistical Yearbook of Inner Mongolia Autonomous Region (2012–2021) |
| Grassland: pork, beef, lamb, milk, wool, honey, poultry eggs | ||
| Woodland: Fruits | ||
| Waters: aquatic products | ||
| Energy consumption accounts | Energy consumption: coal, oil, natural gas | China Energy Statistics Yearbook (2012–2021) |
| Building land | Electricity | ditto |
| Land data | Utilization area by category | Survey statistics of natural resources departments of provinces and autonomous regions |
| Global average production | Global average production of each primary product | The world average output of biological resources refers to the latest FAOSTAT (FAO Statistics) from 2011 to 2020 |
| Equalization factors | Arable land (2.21), water (0.36), forest land (1.34), grassland (0.49), building land (2.21), fossil energy land (1.34) | WWF. Living Planet Report, 2006 [62]. |
| Yield factors | Arable land (0.46), water (1.13), forest land (0.50), grassland (1.13), building land (0.19), fossil energy land (0.00) | Calculation of China’s ecological footprint yield factor based on net primary productivity [15] |
Publisher’s Note: MDPI stays neutral with regard to jurisdictional claims in published maps and institutional affiliations. |
© 2022 by the author. Licensee MDPI, Basel, Switzerland. This article is an open access article distributed under the terms and conditions of the Creative Commons Attribution (CC BY) license (https://creativecommons.org/licenses/by/4.0/).
Share and Cite
Guo, J. Evaluation and Prediction of Ecological Sustainability in the Upper Reaches of the Yellow River Based on Improved Three-Dimensional Ecological Footprint Model. Int. J. Environ. Res. Public Health 2022, 19, 13550. https://doi.org/10.3390/ijerph192013550
Guo J. Evaluation and Prediction of Ecological Sustainability in the Upper Reaches of the Yellow River Based on Improved Three-Dimensional Ecological Footprint Model. International Journal of Environmental Research and Public Health. 2022; 19(20):13550. https://doi.org/10.3390/ijerph192013550
Chicago/Turabian StyleGuo, Jing. 2022. "Evaluation and Prediction of Ecological Sustainability in the Upper Reaches of the Yellow River Based on Improved Three-Dimensional Ecological Footprint Model" International Journal of Environmental Research and Public Health 19, no. 20: 13550. https://doi.org/10.3390/ijerph192013550
APA StyleGuo, J. (2022). Evaluation and Prediction of Ecological Sustainability in the Upper Reaches of the Yellow River Based on Improved Three-Dimensional Ecological Footprint Model. International Journal of Environmental Research and Public Health, 19(20), 13550. https://doi.org/10.3390/ijerph192013550


