Article

Fabrication of PbO2 Electrodes with Different Doses of Er Doping for Sulfonamides Degradation

Department of Environmental Science, College of Life and Environmental Science, Minzu University of China, Beijing 100081, China
*
Authors to whom correspondence should be addressed.
Int. J. Environ. Res. Public Health 2022, 19(20), 13503; https://doi.org/10.3390/ijerph192013503
Submission received: 24 August 2022 / Revised: 8 October 2022 / Accepted: 12 October 2022 / Published: 19 October 2022
(This article belongs to the Section Water Science and Technology)

Abstract

:
In the present study, PbO2 electrodes, doped with different doses of Er (0%, 0.5%, 1%, 2%, and 4%), were fabricated and characterized. Surface morphology characterization by SEM-EDS and XRD showed that Er was successfully doped into the PbO2 catalyst layer and the particle size of Er-PbO2 was reduced significantly. Electrochemical oxidation of sulfamerazine (SMR) in the Er-PbO2 anode system obeyed te pseudo first-order kinetic model with the order of 2% Er-PbO2 > 4% Er-PbO2 > 1% Er-PbO2 > 0.5% Er-PbO2 > 0% PbO2. For 2% Er-PbO2, kSMR was 1.39 h−1, which was only 0.93 h−1 for 0% PbO2. Effects of different operational parameters on SMR degradation in 2% Er-PbO2 anode system were investigated, including the initial pH of the electrolyte and current density. Under the situation of an initial pH of 3, a current density of 30 mA·cm−2, a concentration of SMR 30 mg L−1, and 0.2 M Na2SO4 used as supporting electrolyte, SMR was totally removed in 3 h, and COD mineralization efficiency was achieved 71.3% after 6 h electrolysis. Furthermore, the degradation pathway of SMR was proposed as combining the active sites identification by density functional calculation (DFT) and intermediates detection by LC-MS. Results showed that Er-PbO2 has great potential for antibiotic wastewater treatment in practical applications.

1. Introduction

Antibiotics have been commonly used in the therapy of human diseases and the development of animal husbandry [1]. Global antibiotic use, which was only 22.1 DDDs (defined daily doses) in 2000, had reached 34.8 billion DDDs by 2015 [2]. What is more, antibiotics cannot be completely metabolized and some of them are excreted by feces and urine. Based on Ying Guangguo’s study, about 53,800 tons of antibiotics in China are discharged into the surroundings each year and the average concentration value is up to 303 ng L−1 in surface water [3]. The massive proliferation of antibiotics threatens environmental safety and human health even at an occasional level, by inducing resistance mechanisms on microorganisms. In addition, the persistent presence of organic pollution will catalyze the generation of superbugs, posing a great threat to human health [4]. Among all the antibiotics, sulfamerazine (SMR) is one amongst the foremost well-liked used antibiotics in animal treatment [5]. Therefore, an effective and efficient degradation method for SMR removal is urgently required.
Many technologies have been applied for antibiotics degradation, such as adsorption [6], ozone oxidation [7], photo-catalyst oxidation [8], persulfate oxidation [9] and electrochemical oxidation [10]. Among all ways, electrochemical oxidation has attracted increasing consideration because of its simple manipulation, the mild conditions of the process, lack of secondary pollution, and high oxidation power [11,12,13]. The anode is the key issue for electrochemical oxidation process. Among all the electrode materials, PbO2 electrode has been widely used because of its low price, high oxygen evolution potential, strong oxidation, and corrosion-resistance ability [14,15,16].
The doping method has been applied to improve the oxidation ability of PbO2 electrodes [17,18] and many kinds of materials have been investigated, including metal ions (Bi3+, Fe3+, Co2+) [19], non-metallic ions (F) [20], metal oxide particles [21], and surface active substances of polytetrafluoroethylene (PTFE) [22]. Among them, rare earth elements are widely used because of their special 4f orbital structure and excellent catalytic properties in catalytic modification [23]. Four kinds of rare earth elements (Gd, La, Nd, Ce)-doped PbO2 electrodes were prepared by Shen Hong [24,25] and the results demonstrated that different rare earth elements have different catalytic effects on the electrodes. As a typical rare earth lanthanide, Er has a large ionic radius and a stable electron saturation structure, which makes it an advantageous doping material. For example, Wang Ying [26] designed Er-chitosan-PbO2 electrode for degradation of 2,4-DCP. Li Shuanghui [27] introduced Er3+ ions into SnO2 lattice to synthesize Er3+-SnO2 nanobelts via thermal evaporation methodology, which obviously improved the sensing performance of SnO2 electrodes. Wang Yanping [28] prepared Ti/SnO2-Sb/Er-PbO2 electrodes for the electrochemical degradation of SMX. However, the electrodes were not characterized and the effect of Er doping amount was not discussed. Zhou Yuanzhen [29] investigated the electrochemical degradation performance for methylene blue based on the novel step-to-step fabricated Ti/Sb2O3-SnO2/Er-PbO2 anodes. On the basis of this study, we added a discussion on the amount of Er incorporation and changed the pollutant from dye to SMR, which is more difficult to degrade. In summary, Er doped in PbO2 electrode has not been investigated comprehensively, and the research limitation should be remedied.
In this work, Er-PbO2 electrode was fabricated (Ti/SnO2/α-PbO2/Er-β-PbO2) with SnO2 [30] and an α-PbO2 [28] layer was inserted between the Ti substrate and β-PbO2 layer to reduce interface resistance and extend service life. The Er-PbO2 electrode was characterized by X-ray diffraction (XRD) and scanning electronic microscopy with energy dispersive spectroscopy (SEM-EDS) systematically. At the same time, effects of current density and pH value on the degradation of SMR using the prepared Er-PbO2 electrode were researched. In addition, the possible degradation pathways of SMR were analyzed by density function theory (DFT) calculation and LC-MS intermediates detection. This work aims to develop an efficient and green SMR treatment system that can be used to prevent SMR from spreading pollution and threatening human health.

2. Experimental

2.1. Chemicals

All chemical reagents employed in the experiments were of analytical quality. Acetone, lead oxide, sodium hydroxide, lead nitrate, potassium dichromate, silver sulfate, and mercury sulfate were purchased from traditional Chinese Medicine Group Chemical Reagent Co., Ltd., Beijing, China. Ammonium fluoride, hydrofluoric acid, nitric acid, phosphate, concentrated acid, and n-butanol were purchased from Beijing Chemical Plant, Beijing, China. Antimony trichloride were bought from Tianjin Dachen Chemical Reagent, Tianjin, China. Tin tetrachloride pentahydrate and sodium fluoride were bought from Tianjin Fuchen Chemical Reagent Plant, Tianjin, China. Ethylene glycol was obtained from Tianjin Zhiyuan Chemical Reagent Co., Ltd., Tianjin, China. Nitrate bait was obtained from Shaanxi Ruikexin material Co., Ltd., Shaanxi, China. Polytetrafluoroethylene was obtained from Dongguan Jianyang Polymer material Co., Ltd., Guangdong, China. Sulfamerazine was obtained from Beijing Solaibao Technology Co., Ltd., Beijing, China. Ultrapure water from a Millipore Milli-Q system (>18 mΩ cm−1) was used for all the solutions preparation at 25 ± 1 °C.

2.2. Electrode Preparation

Titanium sheets (20 mm × 15 mm× 1.5 mm) were polished with 240 mesh, 320 mesh, and 600 mesh sandpaper successively and ultrasonically cleaned in deionized water and acetone for 15 min, then the titanium sheets were etched in the solution with a HF:H2O:HNO3 ratio of 1:5:4. After pretreatment, using the etched Ti plate as an anode and the noble metal sheet as cathode, with electrode spacing of 1.5 cm, at 30 V constant pressure, the electrode was electrolyzed in 2 V% H2O and 0.3 wt% NH4F ethylene glycol solution for 0.5 h and in ethylene glycol solution containing 5 wt% H3PO4 for 1 h. Then the titanium nanotube was prepared after sintering at a rate of 5 °C min−1 to 450 °C in a tube furnace.
The titanium nanotube was brushed with the solution containing 3.2 g SbCl3 and 15 g SnCl4-5H2O in 5 mL concentrated hydrochloric acid and 30 mL n-butanol at 25 °C, and then dried in an oven at 145 °C for 20 min. This step was repeated 6 times and then the electrode was baked in a tubular furnace at 500 °C for 2 h. All the operations were repeated once, and the SnO2-Sb2O3 mixed oxides on the face of titanium plate were procured after cooling.
The Ti/SnO2-Sb substrate was electrodeposited with the middle layer of α-PbO2 in basic solution (0.1M PbO, 4M NaOH) at 50 °C and application of ampere density of 5 mA cm−2 for 1 h. Lastly, pure and doped β-PbO2 membranes were electrodeposited on the α-PbO2 middle layer in acidic solution at 65 °C, applying ampere density of 50 mA cm−2 for 1.5 h. The synthetic acidic solution consisted of 0.5 M Pb(NO3)2, 0.05 M NaF, and 1.8 mL PTFE in 1 M HNO3. When the Ti/Sb2O3-SnO2/Er-PbO2 anodes were prepared, 2.5 mM, 5 mM, 10 mM, and 20 mM of Er(NO3)3 •5H2O were supplemental into the acidic electroplating answer for the deposit, separately.

2.3. Electrode Characterization

In this experiment, the element composition and surface morphology of the electrodes were inspected by SEM-EDS (Japanese Hitachi s4800, Hitachi Limited, Tokyo, Japan). The crystal phase composition and the grain size were analyzed by XRD, which was XD-DI type, using Cu Kα radiation (36 KV, 30 mA). Scanning speed was 4°min−1, 2θ = 20°–80°.

2.4. Electrocatalytic Degradation of SMR

The electrocatalytic degradation experiments of SMR were carried out under galvanostatic conditions in a 500 mL beaker with a magnetic stirrer. The prepared Er-PbO2 electrode served as the anode and a stainless-steel electrode of the uniform dimension served as the cathode. They were placed vertically and parallel to one another at an interval of 1.5 cm. The initial concentration of SMR was 30 mg L−1, and 0.2 M Na2SO4 was used as a supporting electrolyte. During the experiments, samples (10 mL) were taken from the reactor at specific time intervals and then analyzed for SMR concentration and chemical oxygen demand (COD). The reaction temperature was maintained at 25 °C throughout all the experimental runs.

2.5. Analytical and Calculation Methods

The linear sweep voltammetry experiment was executed to acquire their oxygen evolution overpotential at room temperature using a computerized electrochemical workstation (CHI 630E, Shanghai Chenhua, Shanghai, China) with a conventional three-electrode system, where the prepared electrodes served as working electrodes, while a platinum sheet and a saturated calomel electrode (SCE) were used as the counter and reference electrodes, respectively. The concentrations of SMR were measured by high performance liquid chromatography system (HPLC, LC-20A, Shimadzu Company, Kyoto, Japan). The mobile liquid phase was a mixed solution with 60% (by volume) methanol and 40% water. The separation was implemented using an Agilent SB-C18 (4.6 mm × 250 mm, 5 μm) at a pillar temperature of 25 °C and at a flow rate of 1 mL min−1, The UV detector wavelength was set at 265 nm. The injection volume was 25 μL.
COD was determined according to the national standard method (GB11914-1989). The current efficiency was computed as Equation (1) [31]:
C E = C O D 0 C O D t 8 I t F V × 100 %
where CODt and COD0 are the chemical oxygen demand (g L−1) at time t (s) and zero, separately, I is the current (A), t is the electrolysis time (h), F is the Faraday constant (96,287 C mol−1), and V is the electrolyte volume (L).
The energy consumption (EC) in the process of electrochemical oxidation was computed using Equation (2) [32]:
E C = U I t 1000 V
where U is the average cell voltage (V), I is the current (A), t is the degradation time (h), V is the wastewater volume (m3).
The intermediates during the degradation of SMR were determined with LC-MS (LC-20ADXR, Shimadzu, Tokyo, Japan and API3200 Qtrap, Applied Biosystems, Waltham, Mass, USA). The mobile phase consisted of two solutions, namely, A and B. Solution A was high pure water containing 0.01% formic acid, whereas solution B was methanol. The flow velocity was 0.4 mL min−1 and the temperature was kept at 40 °C.
The active point of SMR in the degradation process of electrocatalytic system was inferred by DFT calculation, and the related work was carried out by the Gaussian 09 program. Optimization of SMR geometry at the atomic level of the DFT theory B3LYP/6-31G (d, p). Afterwards, the active sites of SMR molecules vulnerable to free radical attack were identified by calculating the Fukui function (Equation (3)).
f k 0 = [ ( q k N 1 ) ( q k N + 1 ) ] / 2  

3. Results and Discussion

3.1. Characteristics of Er-PbO2 Anodes

3.1.1. Life Comparison between Titanium Nanotubes and Titanium Plates

According to previous research [33], the Ti plate is oxidized into nanotubes (nanocrystalline coral-like TiO2, TiO2-NCs) substrate before deposition of catalytic layer (Figure S1). The accelerated service life of TiO2-NCs/Sb-SnO2/PbO2 has been compared with Ti/Sb-SnO2/PbO2, in which Ti plates are used without any treatment. Results in Table S1 showed that the accelerated life time is 10 h and 25 h and the service life time is 2.85 y and 9.99 y, respectively. These results indicate that the conversion of Ti-based oxygen to TiO2-NCs can effectively extend the lifetime of the electrode.

3.1.2. SEM-EDS Analysis of Er-PbO2 Anodes

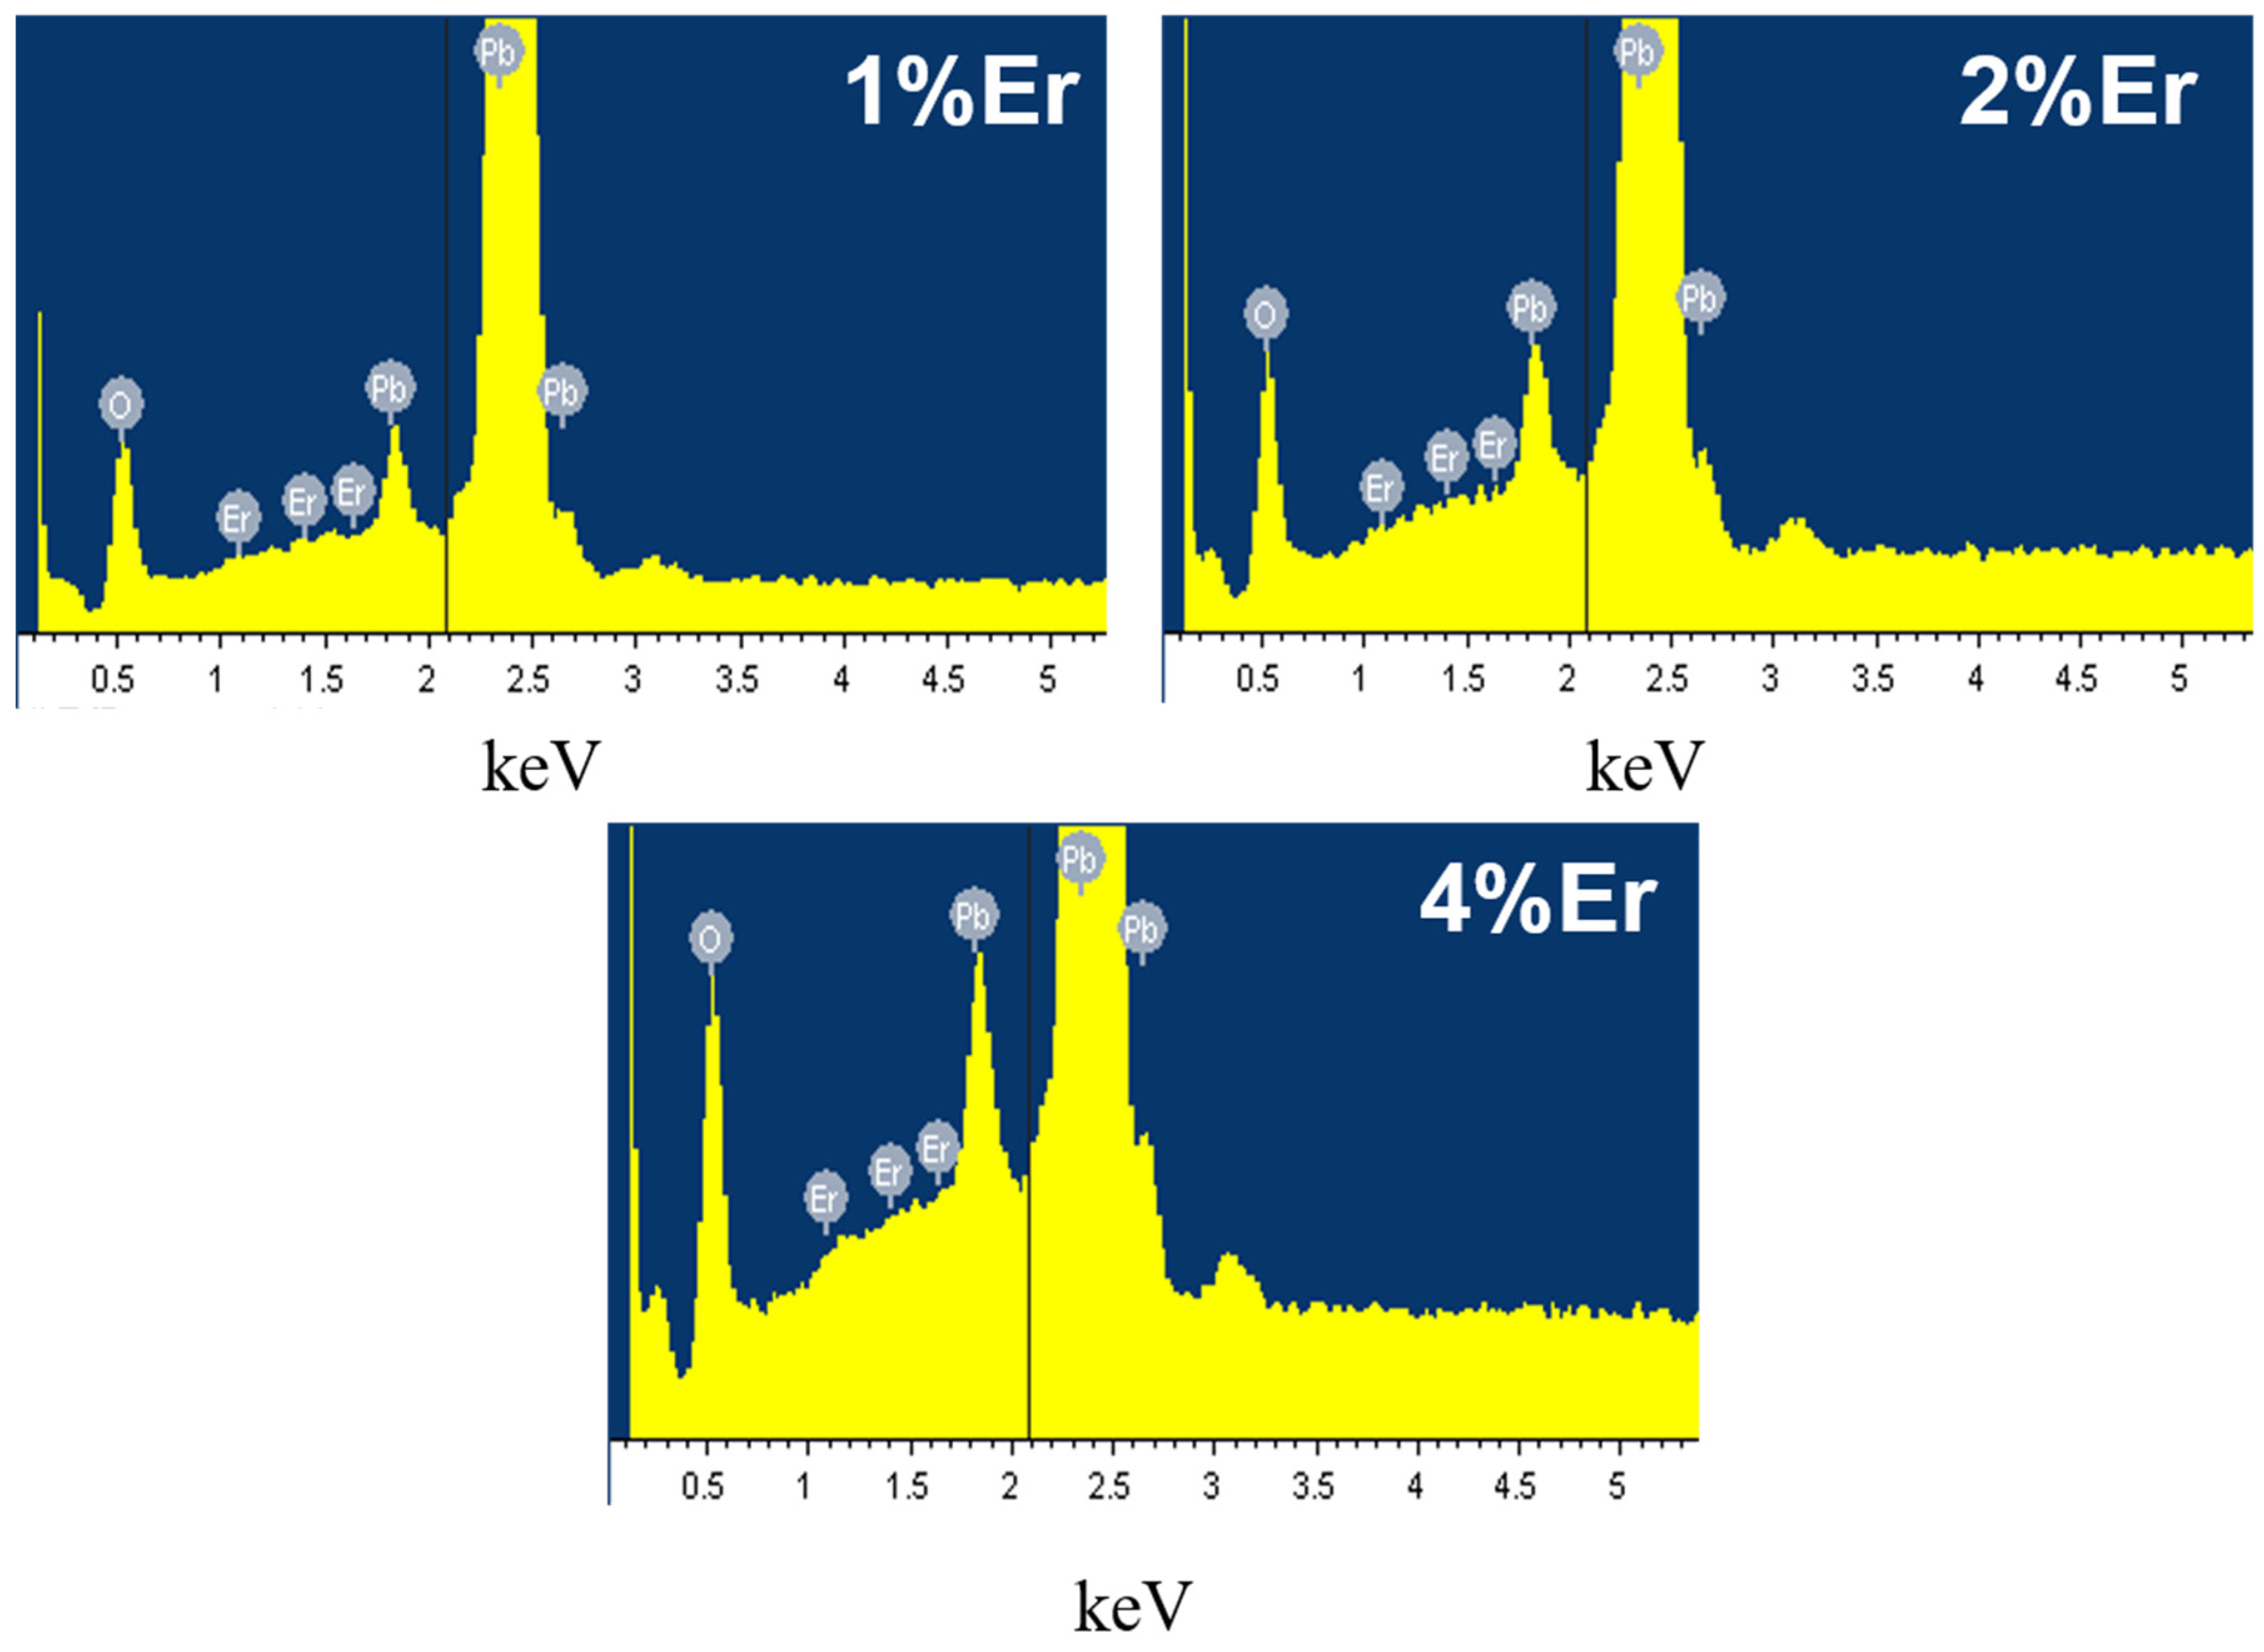
The elemental morphology and composition of the prepared Er-PbO2 anodes were analyzed by SEM-EDS (Figure 1 and Figure 2, respectively). Results showed that a large number of cracks appeared on the electrode surface without Er doping (Figure 1a). These cracks would permit reactive oxygen species to penetrate into the titanium matrix during electrochemical oxidation process, passivate the Ti substrate, increase internal stress of inside electrode, and then cause the PbO2 layer to peel off. However, with a certain dose of Er doped into PbO2, the electrode surface is smooth and dense and the cracks are obviously reduced (Figure 1b–d) [34]. However, when the dose of Er is increased to 4%, the surface gap is enlarged again (Figure 1e), which would reduce the electro-catalytic activity [35]. In addition, EDS analysis of different electrodes showed that an Er element existed on the surface of electrodes (Figure 2) and weight and atomic percentage is shown in Table S2, EDS results of different Er-PbO2 electrodes in Figure S2.

3.1.3. XRD Analysis of Er-PbO2 Anodes

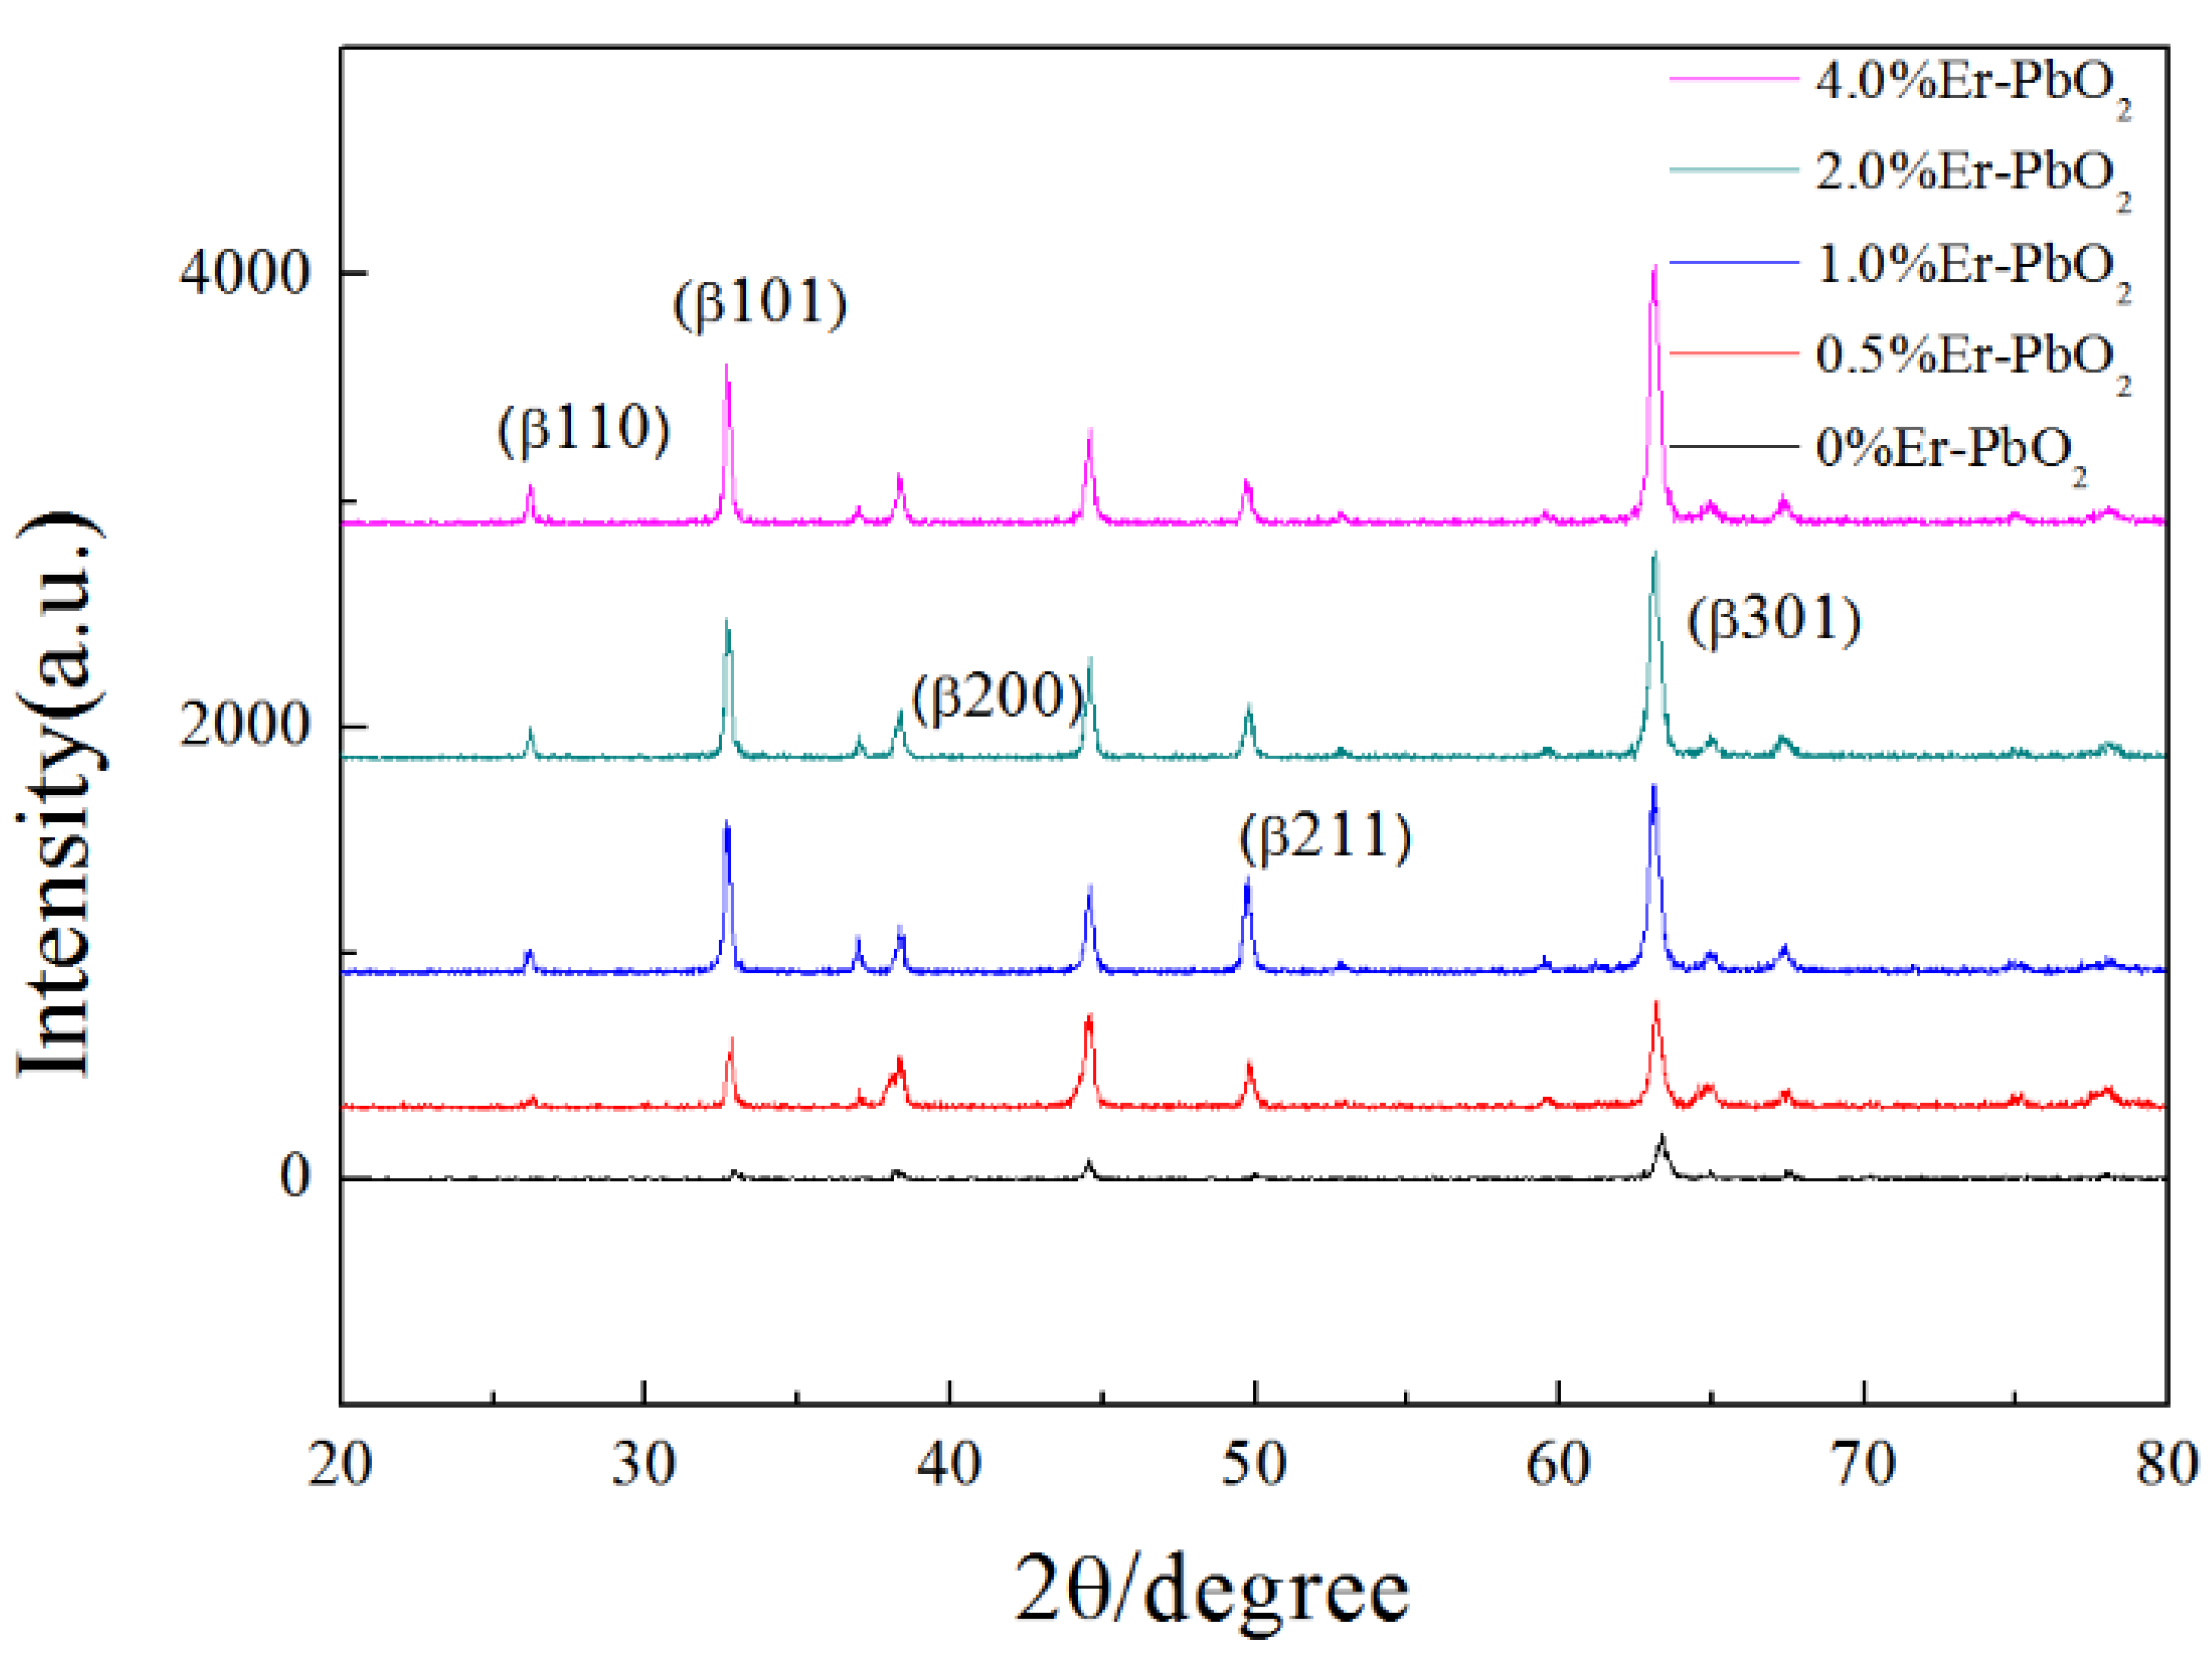
Diffraction peaks of XRD observed at 2θ of 25.3°, 31.8°, 36.1°, 49.0°, and 62.4° were assigned to (110), (101), (200), (211), (220), and (301) planes of β-PbO2, respectively (Figure 3). These results have a fine consistency with the standard data of the JCPDS card (number: 760564) [36,37]. However, diffraction peaks corresponding to rare earth elements Er did not appear after doping. In the present study, Er doped into PbO2 would replace the position of Pb4+ in the lattice. If the dose was not large enough, the lattice structure would change significantly, so that the doping could not be detected by XRD [38].
Crystal sizes of PbO2 electrodes with different dose of Er doping have been calculated according to the Scherrer equation (Table 1). This phenomenon could be attributed to the doping of Er introducing a fresh nucleation site for the growth of PbO2 crystals, which increased the quantity of crystal nuclei and hindered the expansion of particle size at the same time as the crystallization process [39]. Among them, the 2% Er-PbO2 had the smallest particle size (39.96 nm), while the particle size of undoped PbO2 was 43.43 nm. Smaller granularity size will give a bigger specific surface area, increase the active sites, and accelerate the reaction rate.

3.1.4. OEP Analysis of Er-PbO2 Anodes

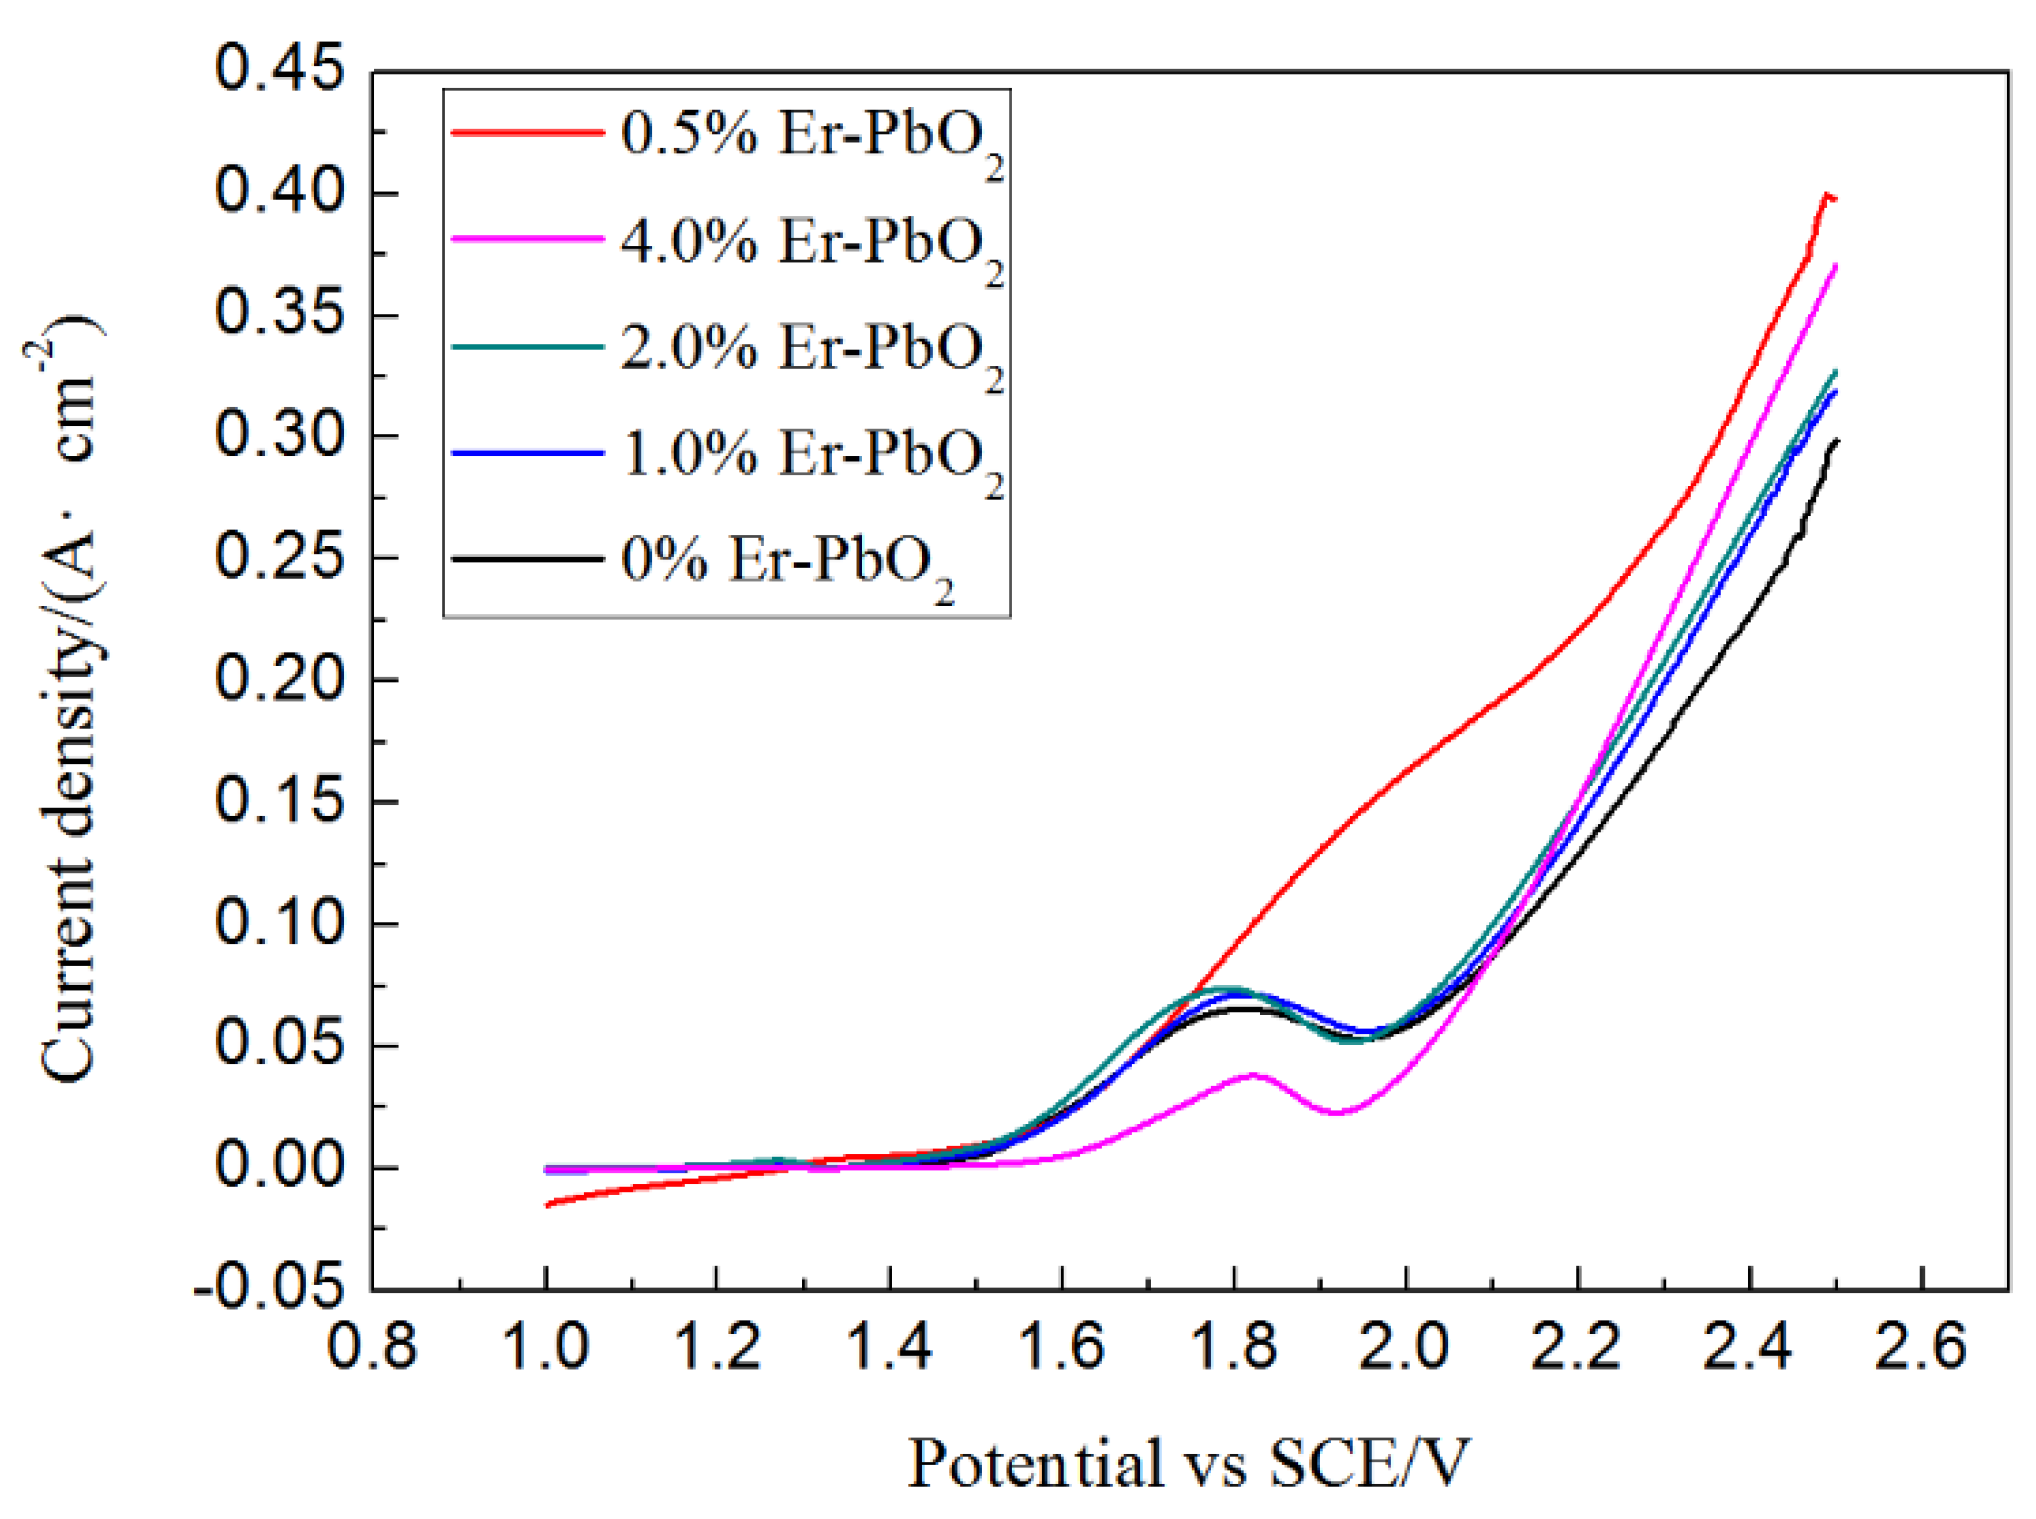
The curves of linear sweep voltammetry of Er-PbO2 with the sampling rate of 10 mV s−1 were investigated to examine the oxygen evolution potential (OEP) (Figure 4). The OEP increased in the order of 0% PbO2, 1% Er-PbO2, 4% Er-PbO2, 0.5% Er-PbO2, and 2% Er-PbO2 electrodes. It is obvious that Er doping enhanced the OEP of PbO2 electrode, which can shorten the aspect reaction of oxygen evolution, improve the current efficiency, and enhance the electrochemical oxidation ability [40].

3.2. Electrochemical Oxidation of SMR

3.2.1. SMR Degradation of Er-PbO2 Anodes

The electrochemical oxidation of SMR utilization Er doped PbO2 electrodes was investigated with operating conditions of current density 30 mA cm−2, initial SMR thickness 30 mg L−1, and electrolyte Na2SO4 0.2 M (Figure 5). The first-order kinetic fitting of the electrochemical decomposition process is shown in Equation (4).
ln(C0/C) = kt
where C0 and C is the concentration of SMR (mg L−1) at electrolysis time of 0 and t (h), k was the reaction rate constant (h−1).
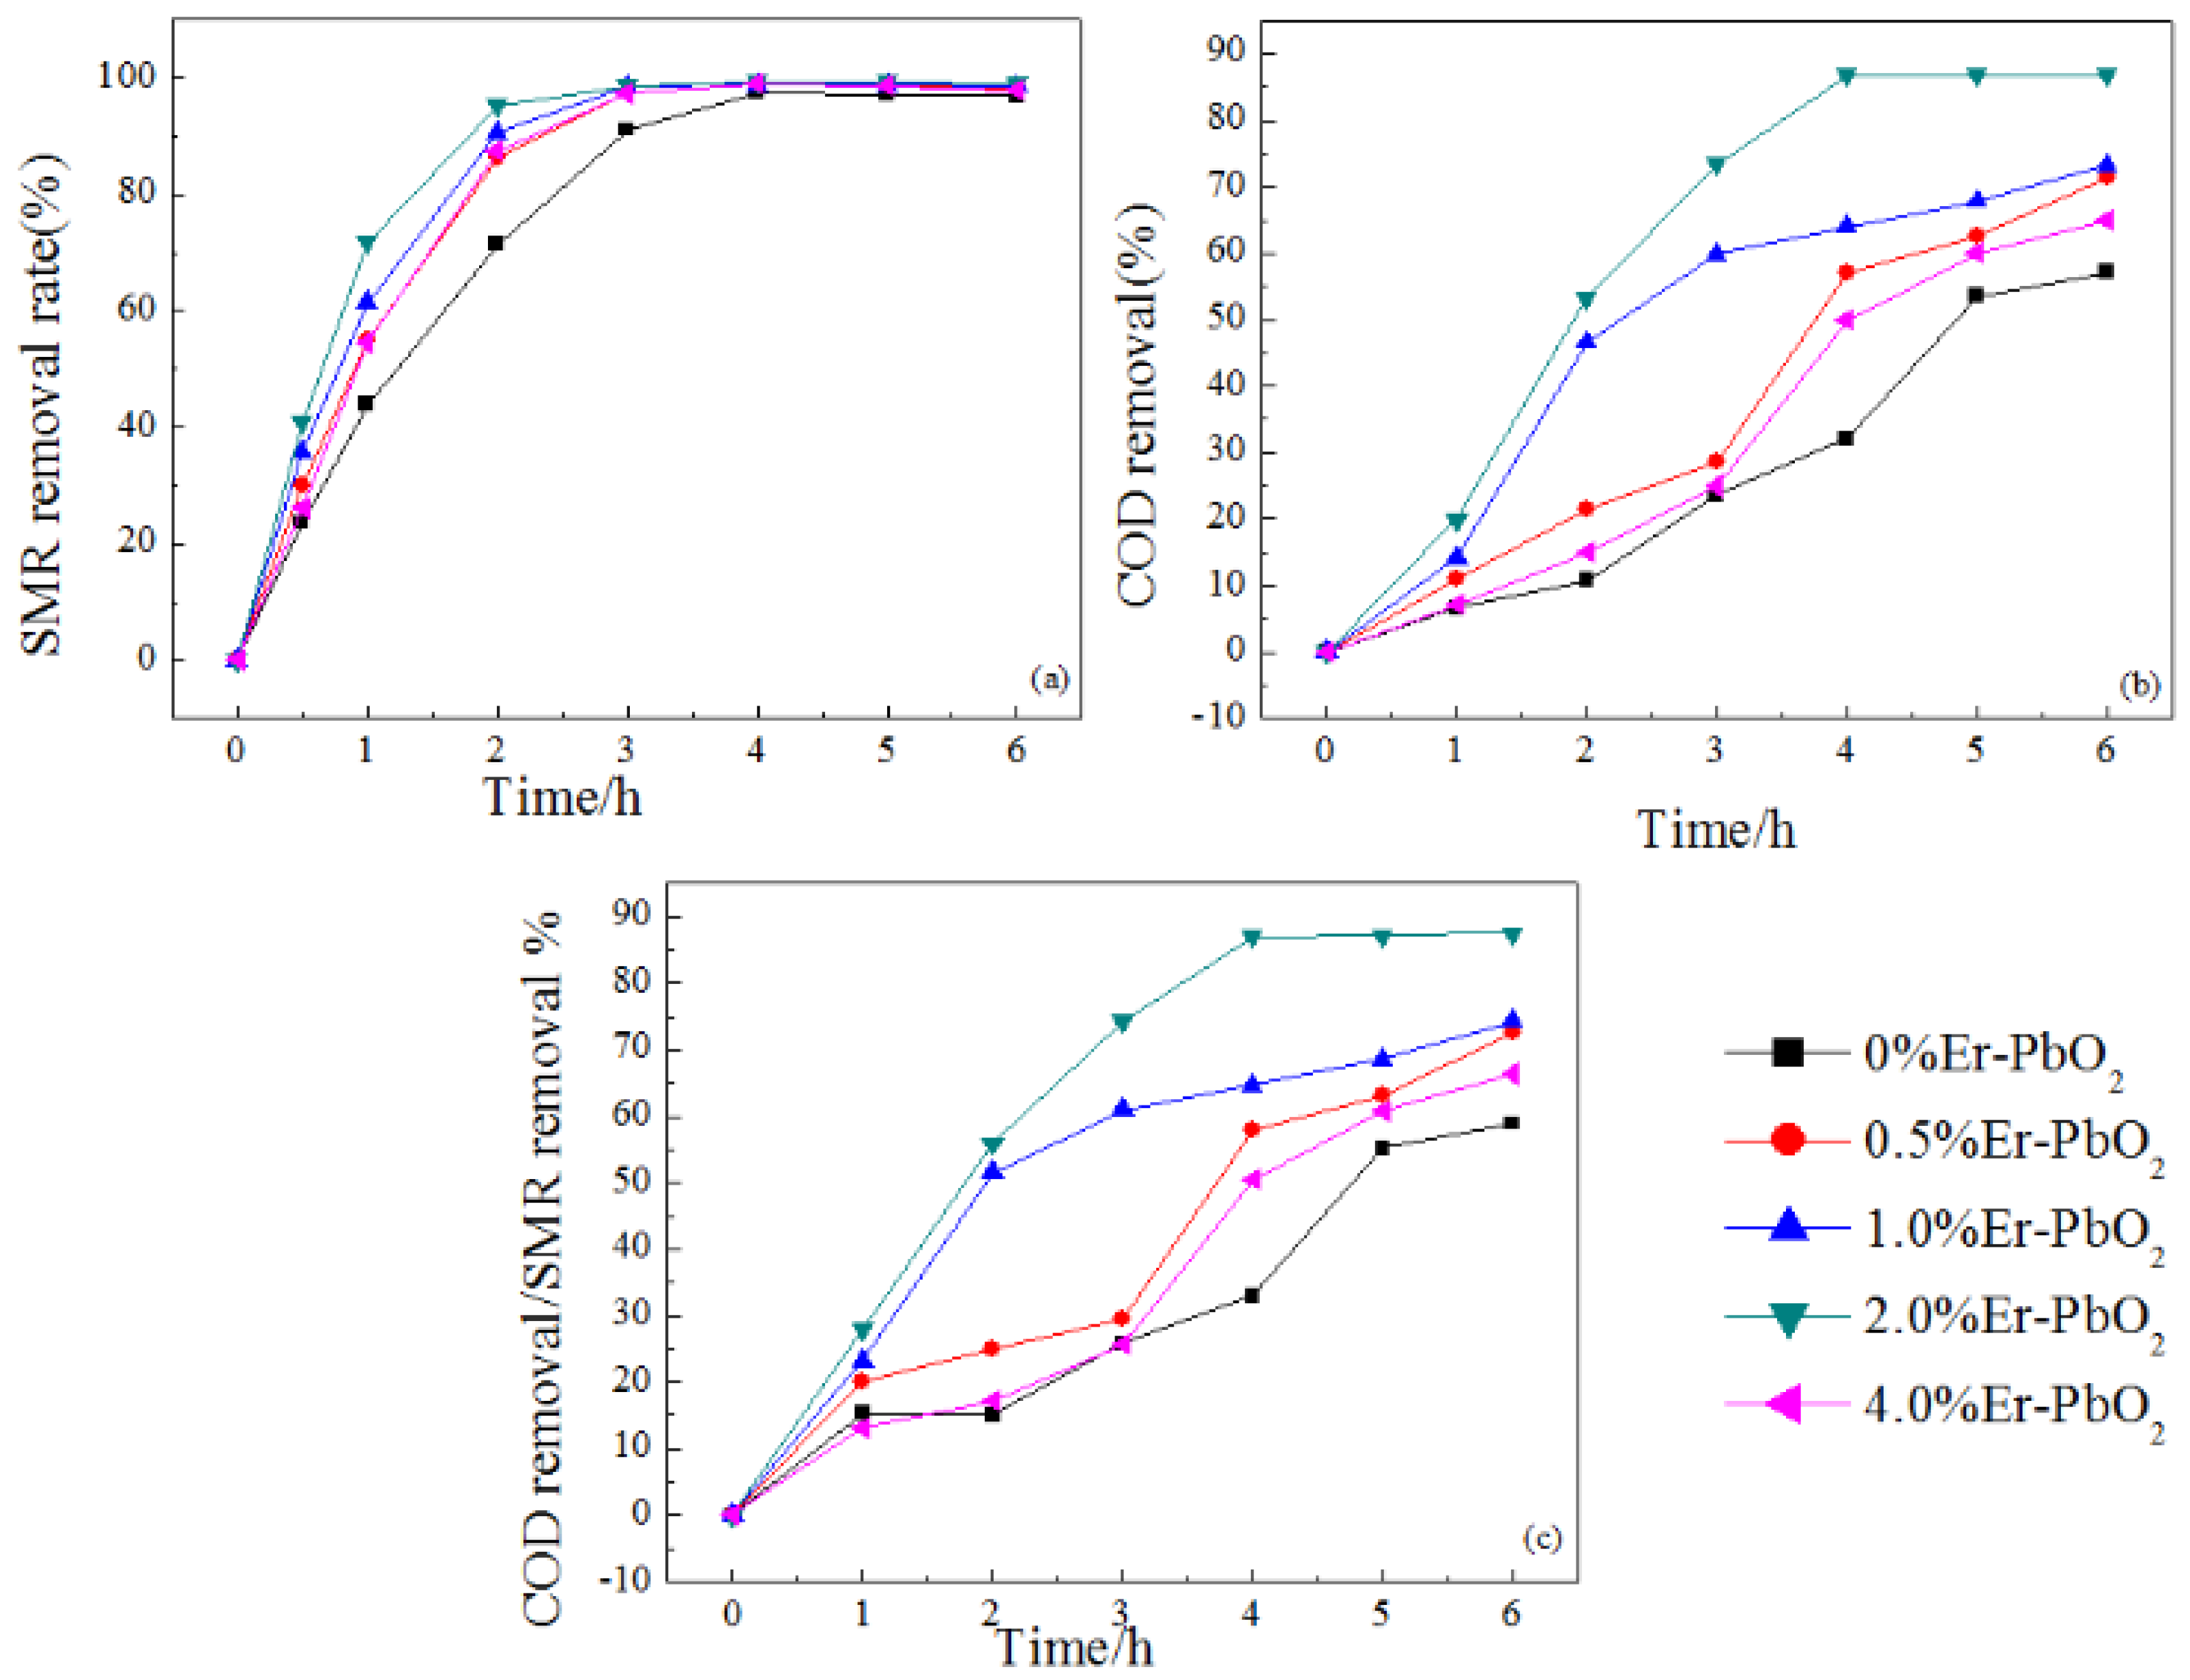
After 6 h electrolysis, the removal efficiency of SMR was 99% in all PbO2 electrode systems (Figure 5a). The plot of time (t) versus ln (C/C0) showed a straight line, reflecting that the oxidation reaction followed pseudo-first-order kinetics (Figure S3). The highest reaction rate constant of k with the value of 1.39 h−1 was obtained in 2% Er-PbO2 system. This value was higher than that in 4% Er-PbO2 (1.25 h−1), 1% Er-PbO2 (1.22 h−1), 0.5% Er-PbO2 (1.19 h−1) and 0% PbO2 (0.93 h−1) (Table S2). Er-doped PbO2 electrodes showed excellent performance for SMR degradation, especially for 2% Er-PbO2, which is consistent with SEM and XRD detection results [41].
COD removal rates of 0% Er-PbO2, 0.5% Er-PbO2, 1% Er-PbO2, 2% Er-PbO2, and 4% Er-PbO2 were 57%, 71%, 73%, 86%, and 65% after 6 h electrolysis (Figure 5b). The mineralization ability order was the same with SMR degradation and 2% Er-PbO2 also showed excellent mineralization ability compared to other electrodes. The relationship between COD and SMR removal rate represented the accumulation of intermediate products during the degradation process [34]. The ratio of COD/SMR for 2% Er-PbO2 was 87%, indicating that the mineralization ability was strong with little accumulation of intermediates (Figure 5c).

3.2.2. Effect of Current Density

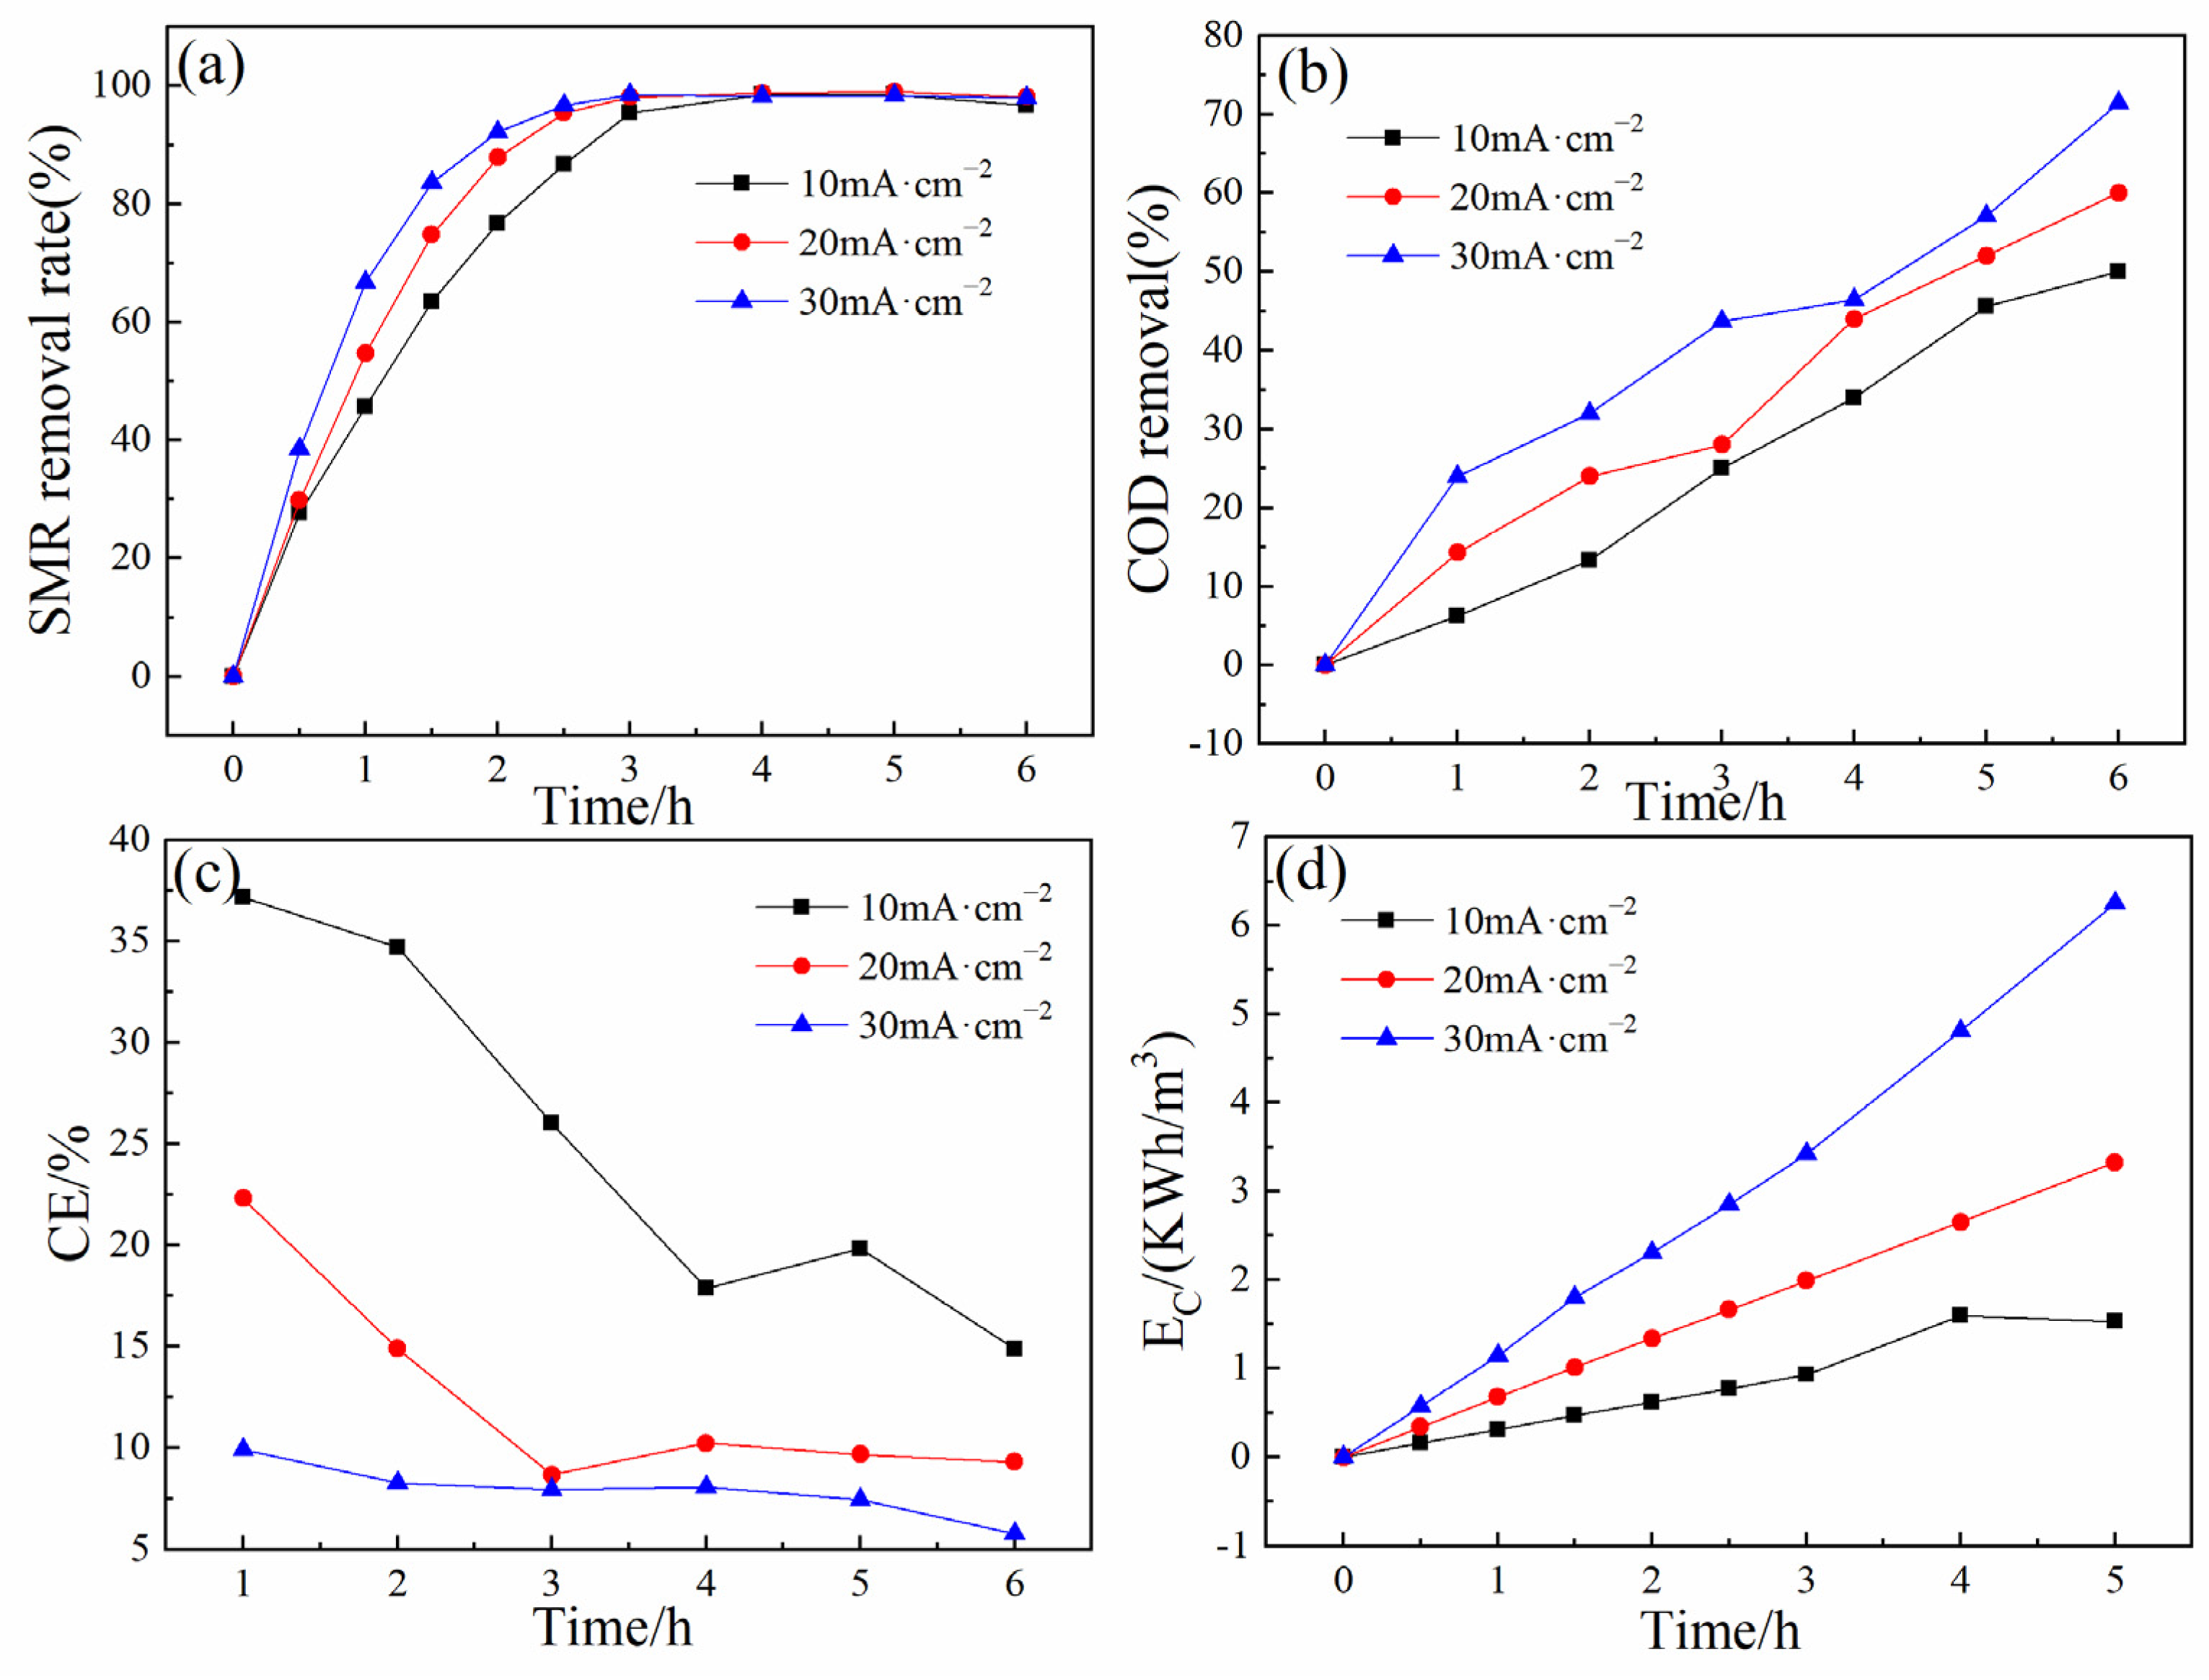
The effects of current density on SMR degradation in 2% Er-PbO2 electrochemical oxidation system were investigated (Figure 6) [42,43]. Degradation efficiency of SMR and COD increased with current density increases. After 6 h degradation, the removal rates of SMR achieved 96.61%, 97.88%, and 98.11% and the first order pseudo-kinetic constant of k was 0.96, 1.33, and 1.42 with current densities of 10, 20 and 30 mA cm−2, respectively (Table S3). The difference between COD removal was more significant compared with SMR. Degradation efficiency was 50%, 60%, and 71.4% with current densities of 10, 20, and 30 mA cm−2 after 6 h electrolysis, respectively.
Current efficiency (CE) (Figure 6c) and the energy consumption (Ec) have also been analyzed (Figure 6d). Results show that along with electrolysis time extension, Ec increased while CE decreased [44]. When current density is 10 mA cm−2, CE was as high as 37.19% after 1 h reaction, but dropped to 14.87% after 6 h reaction. At the same time, CE decreased along with current density increasing. When the current density is increased from 10 to 30 mA cm−2, CE decreased from 14.87% to 5.78% after 6 h reaction. Ec increased along with current density rising and electrolysis time extension. When current density increased from 10 to 30 mA cm−2, Ec heightened from 1.52 to 6.25 kWh m−3. This result was mainly because of the increase of side reaction for oxygen evolution by •OH decomposition which induced energy waste during electrolysis process [13,45].

3.2.3. Effect of pH Value

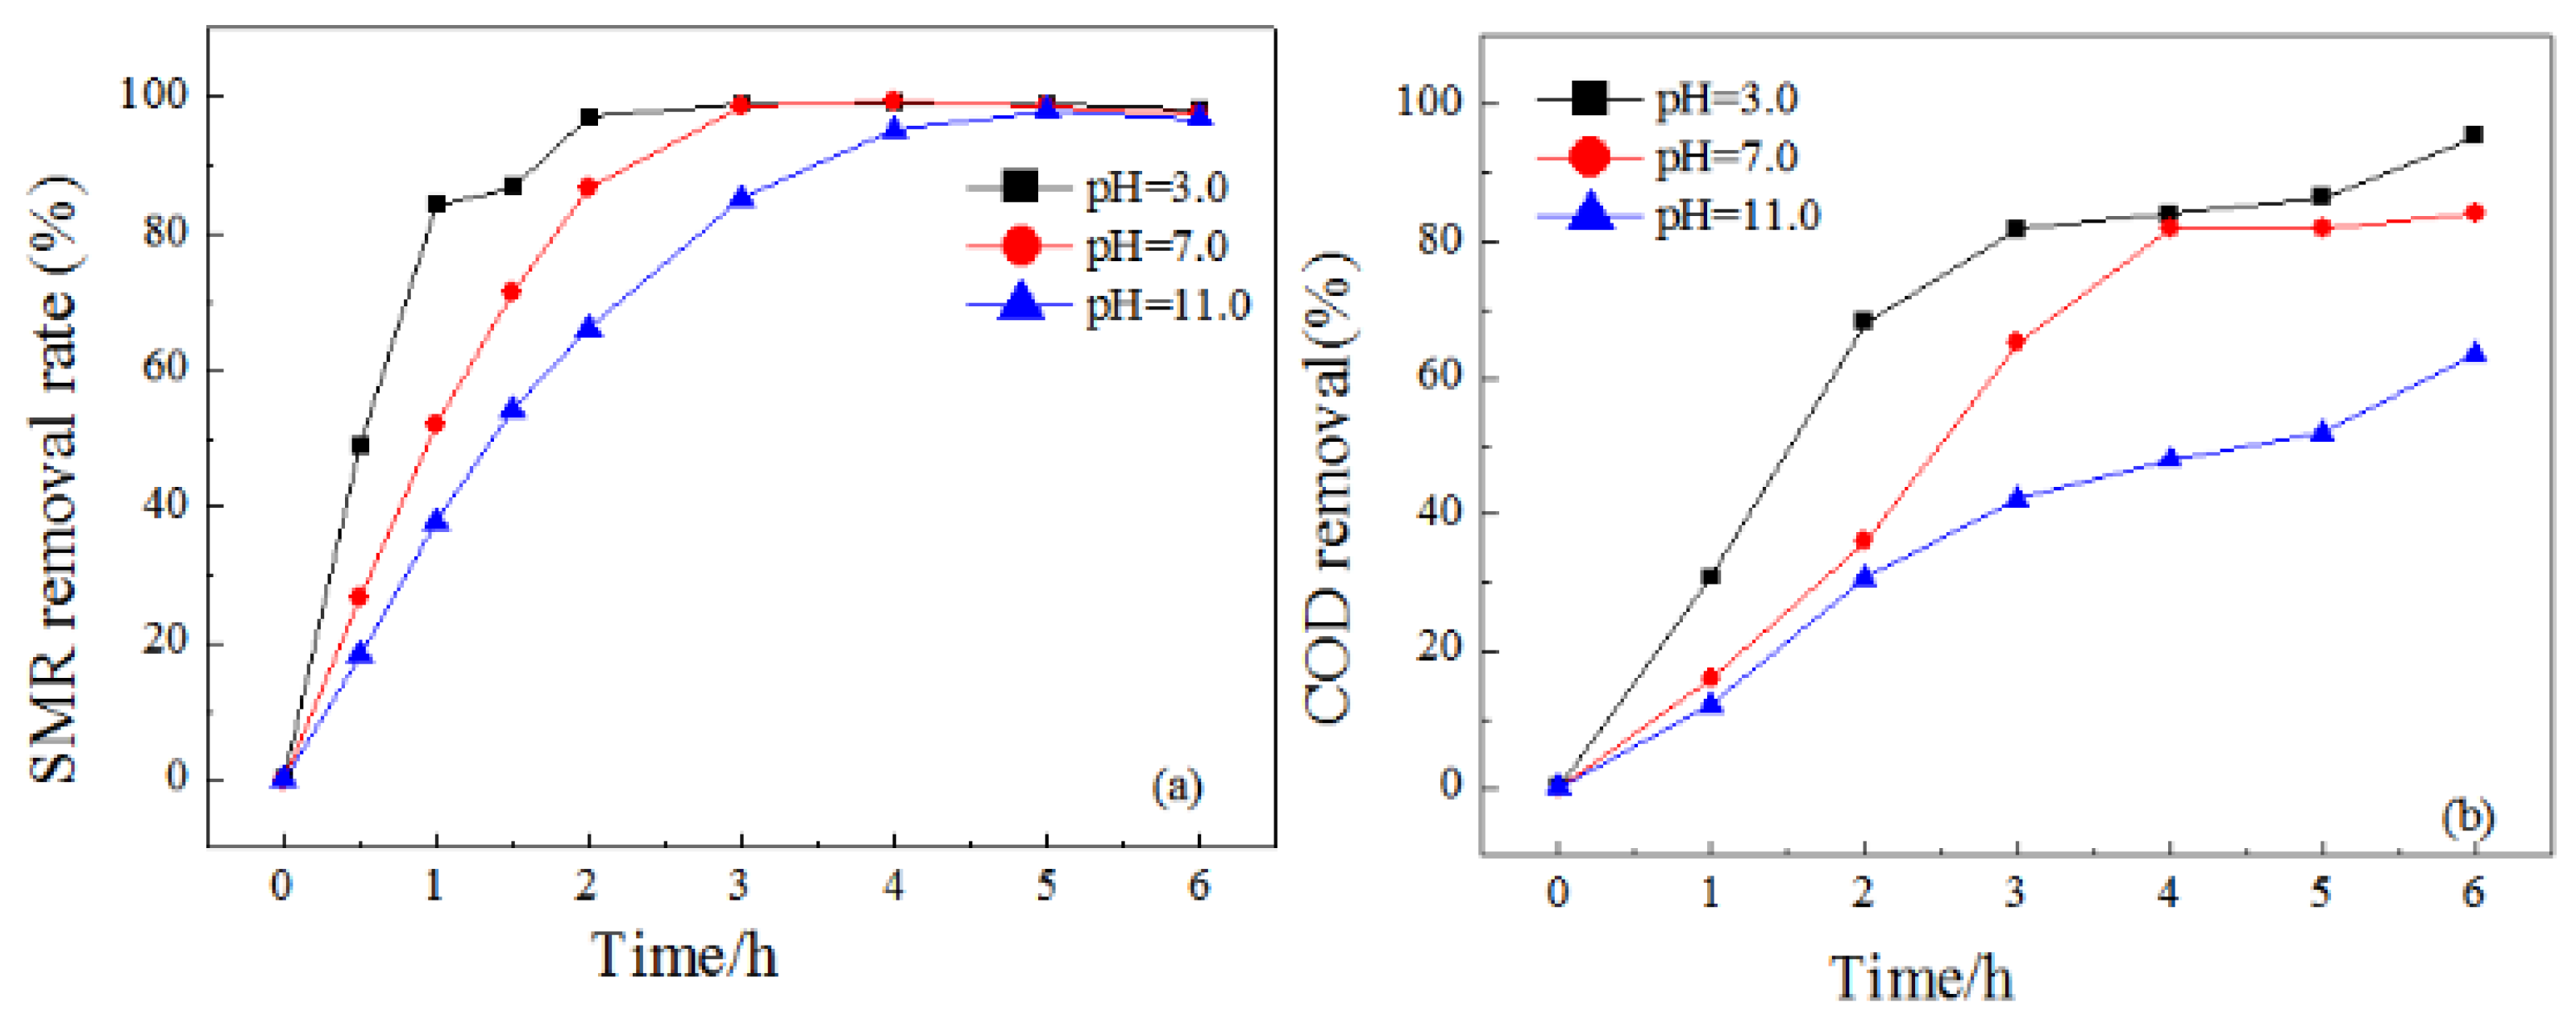
Effects of different pH value on SMR degradations were investigated (Figure 7). The removal rate of SMR and COD decreased when pH value increased from 3 to 11. The highest degradability was found at a pH value of 3, with the first order pseudo-kinetic constant k of 1.59 h−1, which was much higher than that of 1.38 h−1 and 0.63 h−1 under pH of 7 and 11 (Table S3). The difference between COD removal was also significant under different pH conditions. After 6 h electrolysis, the efficiency of COD removal was as high as 95.4%, 84%, and 63.5% with pH of 3, 7, and 11, respectively.
This phenomenon was mostly because of the following two aspects. On one hand, •OH production was affected by pH condition, as shown in Equation (5). In acidic circumstances, H+ would restrain the dissolution of •OH into oxygen, which would improve the oxidation ability and current efficiency [46]
H2O → •OH + H+ + e
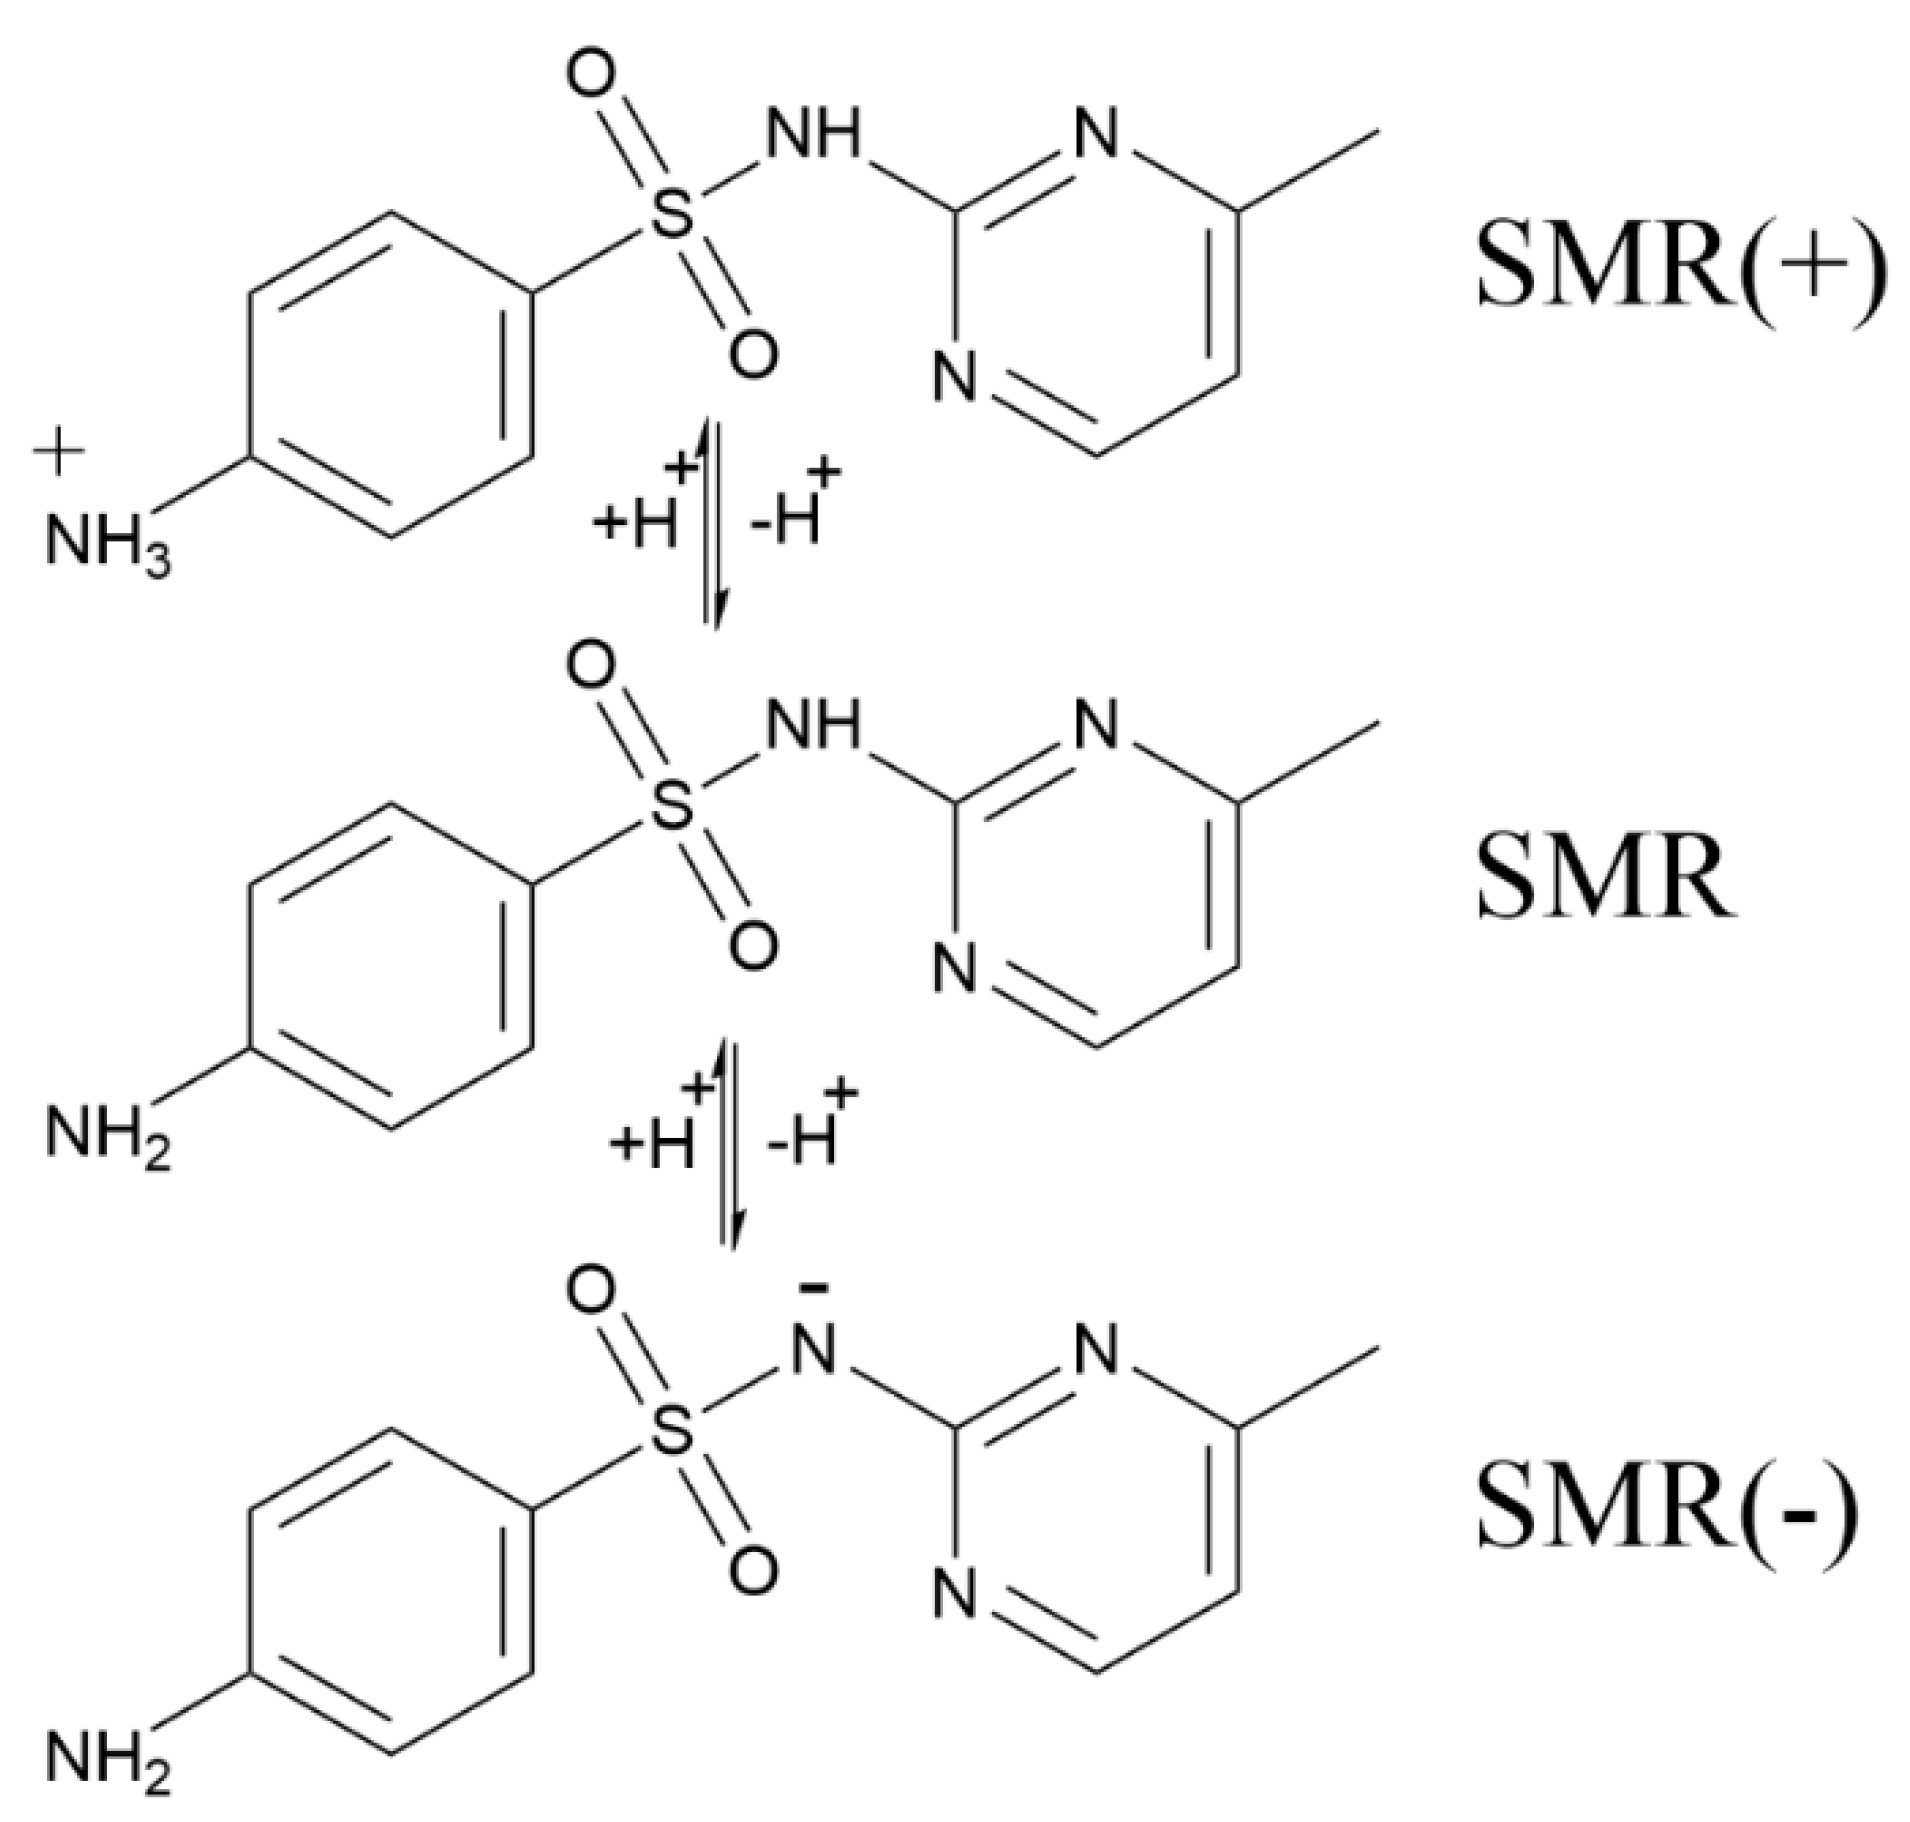
On the other hand, morphology of SMR changes under different pH conditions because of the contents of functional groups such as aniline and heterocyclic alkali (Figure 8). The pKa1 value of SMR was 2.13 and the pKa2 value was 6.70 [47]. When the pH value of the solution is less than 2.13, SMR will be positively charged, which is not conducive to the detachment of N atoms from the aromatic ring. When the pH value of solution is higher than 6.70, the radical oxidation activity of aniline group will be enhanced [48,49].

3.3. Degradation Mechanism of SMR

3.3.1. DFT Calculation

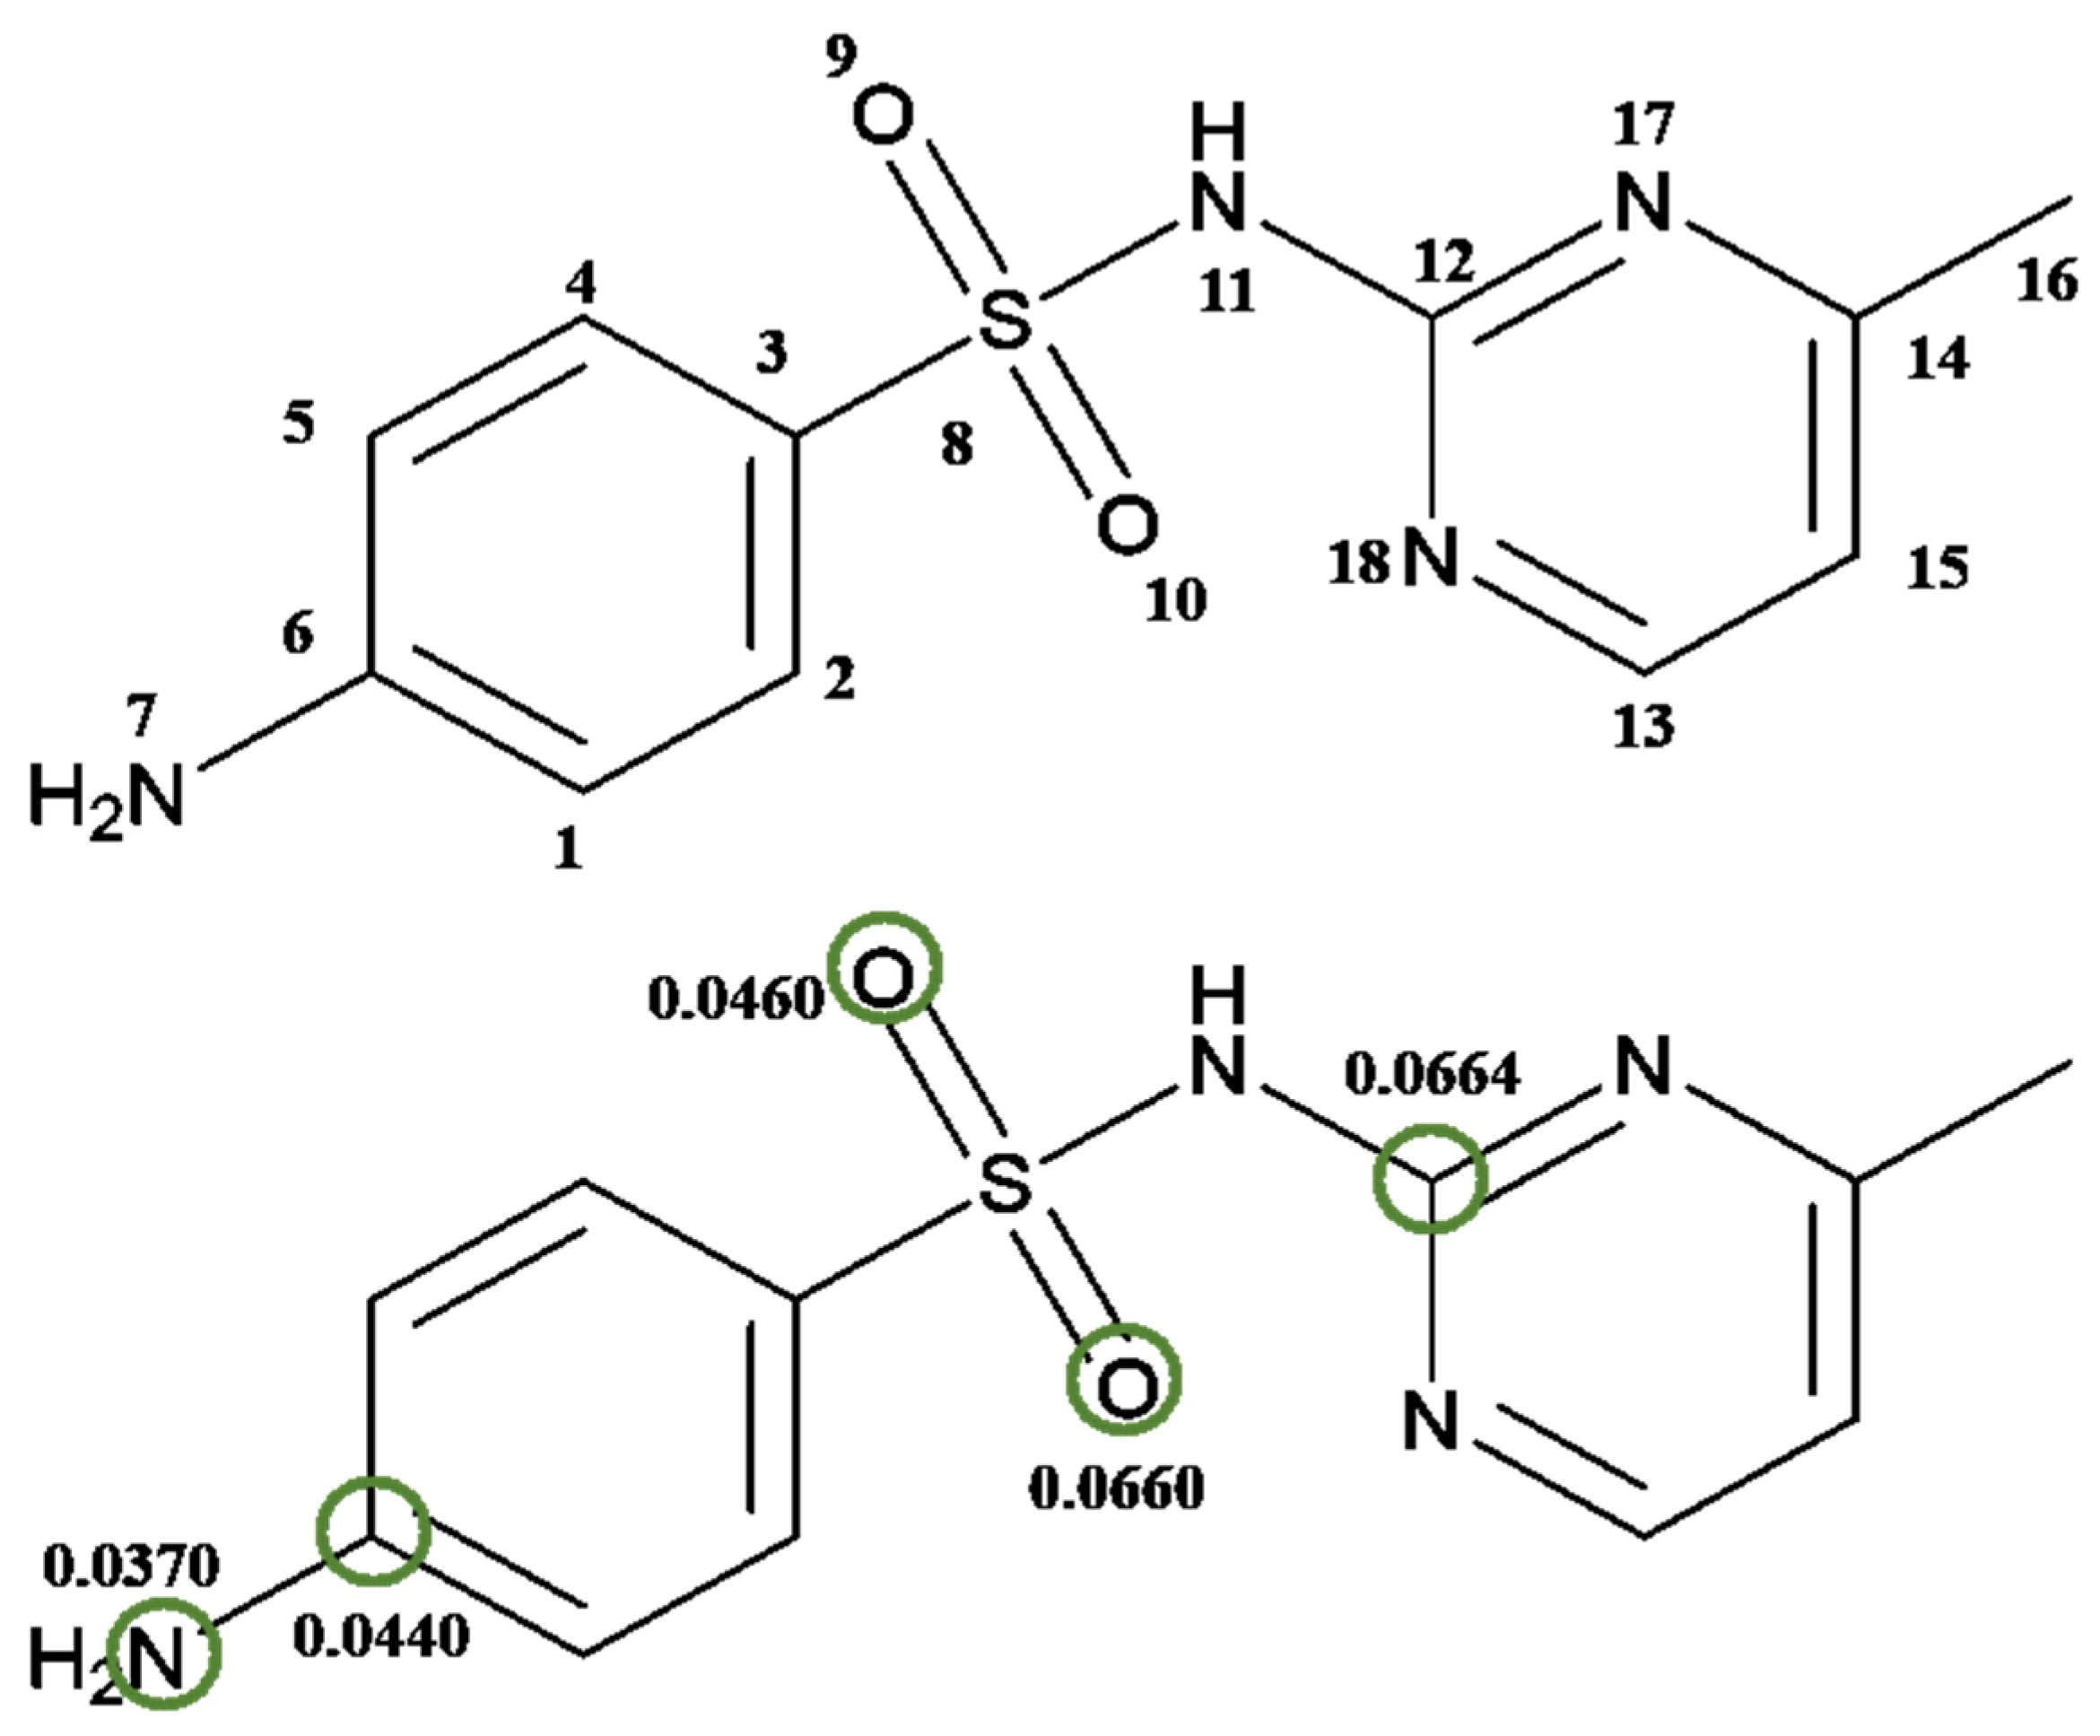
The Gaussian 09W calculation software was used in this study to optimize the geometry of SMR at the atomic level of DFT theory B3LYP/6-31G (d, p). The optimized structure and electron density distribution of SMR molecules are shown in Table S4 and Figure S4. The active site of SMR, expressed in terms of the Fukui index ( f k 0 ) for each atom, is shown in Table 2, with -OH attacking the atom with higher f k 0 (Figure 9). Therefore, the •OH attack on C6, C12, O9, O10 and N7 may be the cause of SMR degradation.

3.3.2. Intermediates Identification

Four intermediates of SMR shaped in electrochemical oxidation processes have been identified by LC-MS (Figure S5). The mass charge ratio (m/z), molecular formula, and molecular structure are summarized in Table 3. The results of LC-MS analysis showed that intermediates of T3 and T11 were formed by oxidation of C6 and N7 atoms. The atoms of C6 and N7 react preferentially with •OH due to their higher f k 0 values. The production of T2 may be due to the high value of f0 for the reaction between •OH and O9 and O10 atoms. However, atoms such as C12 have high f 0 values, but it is difficult for them to be attacked by -OH due to the presence of spatial site resistance [48].
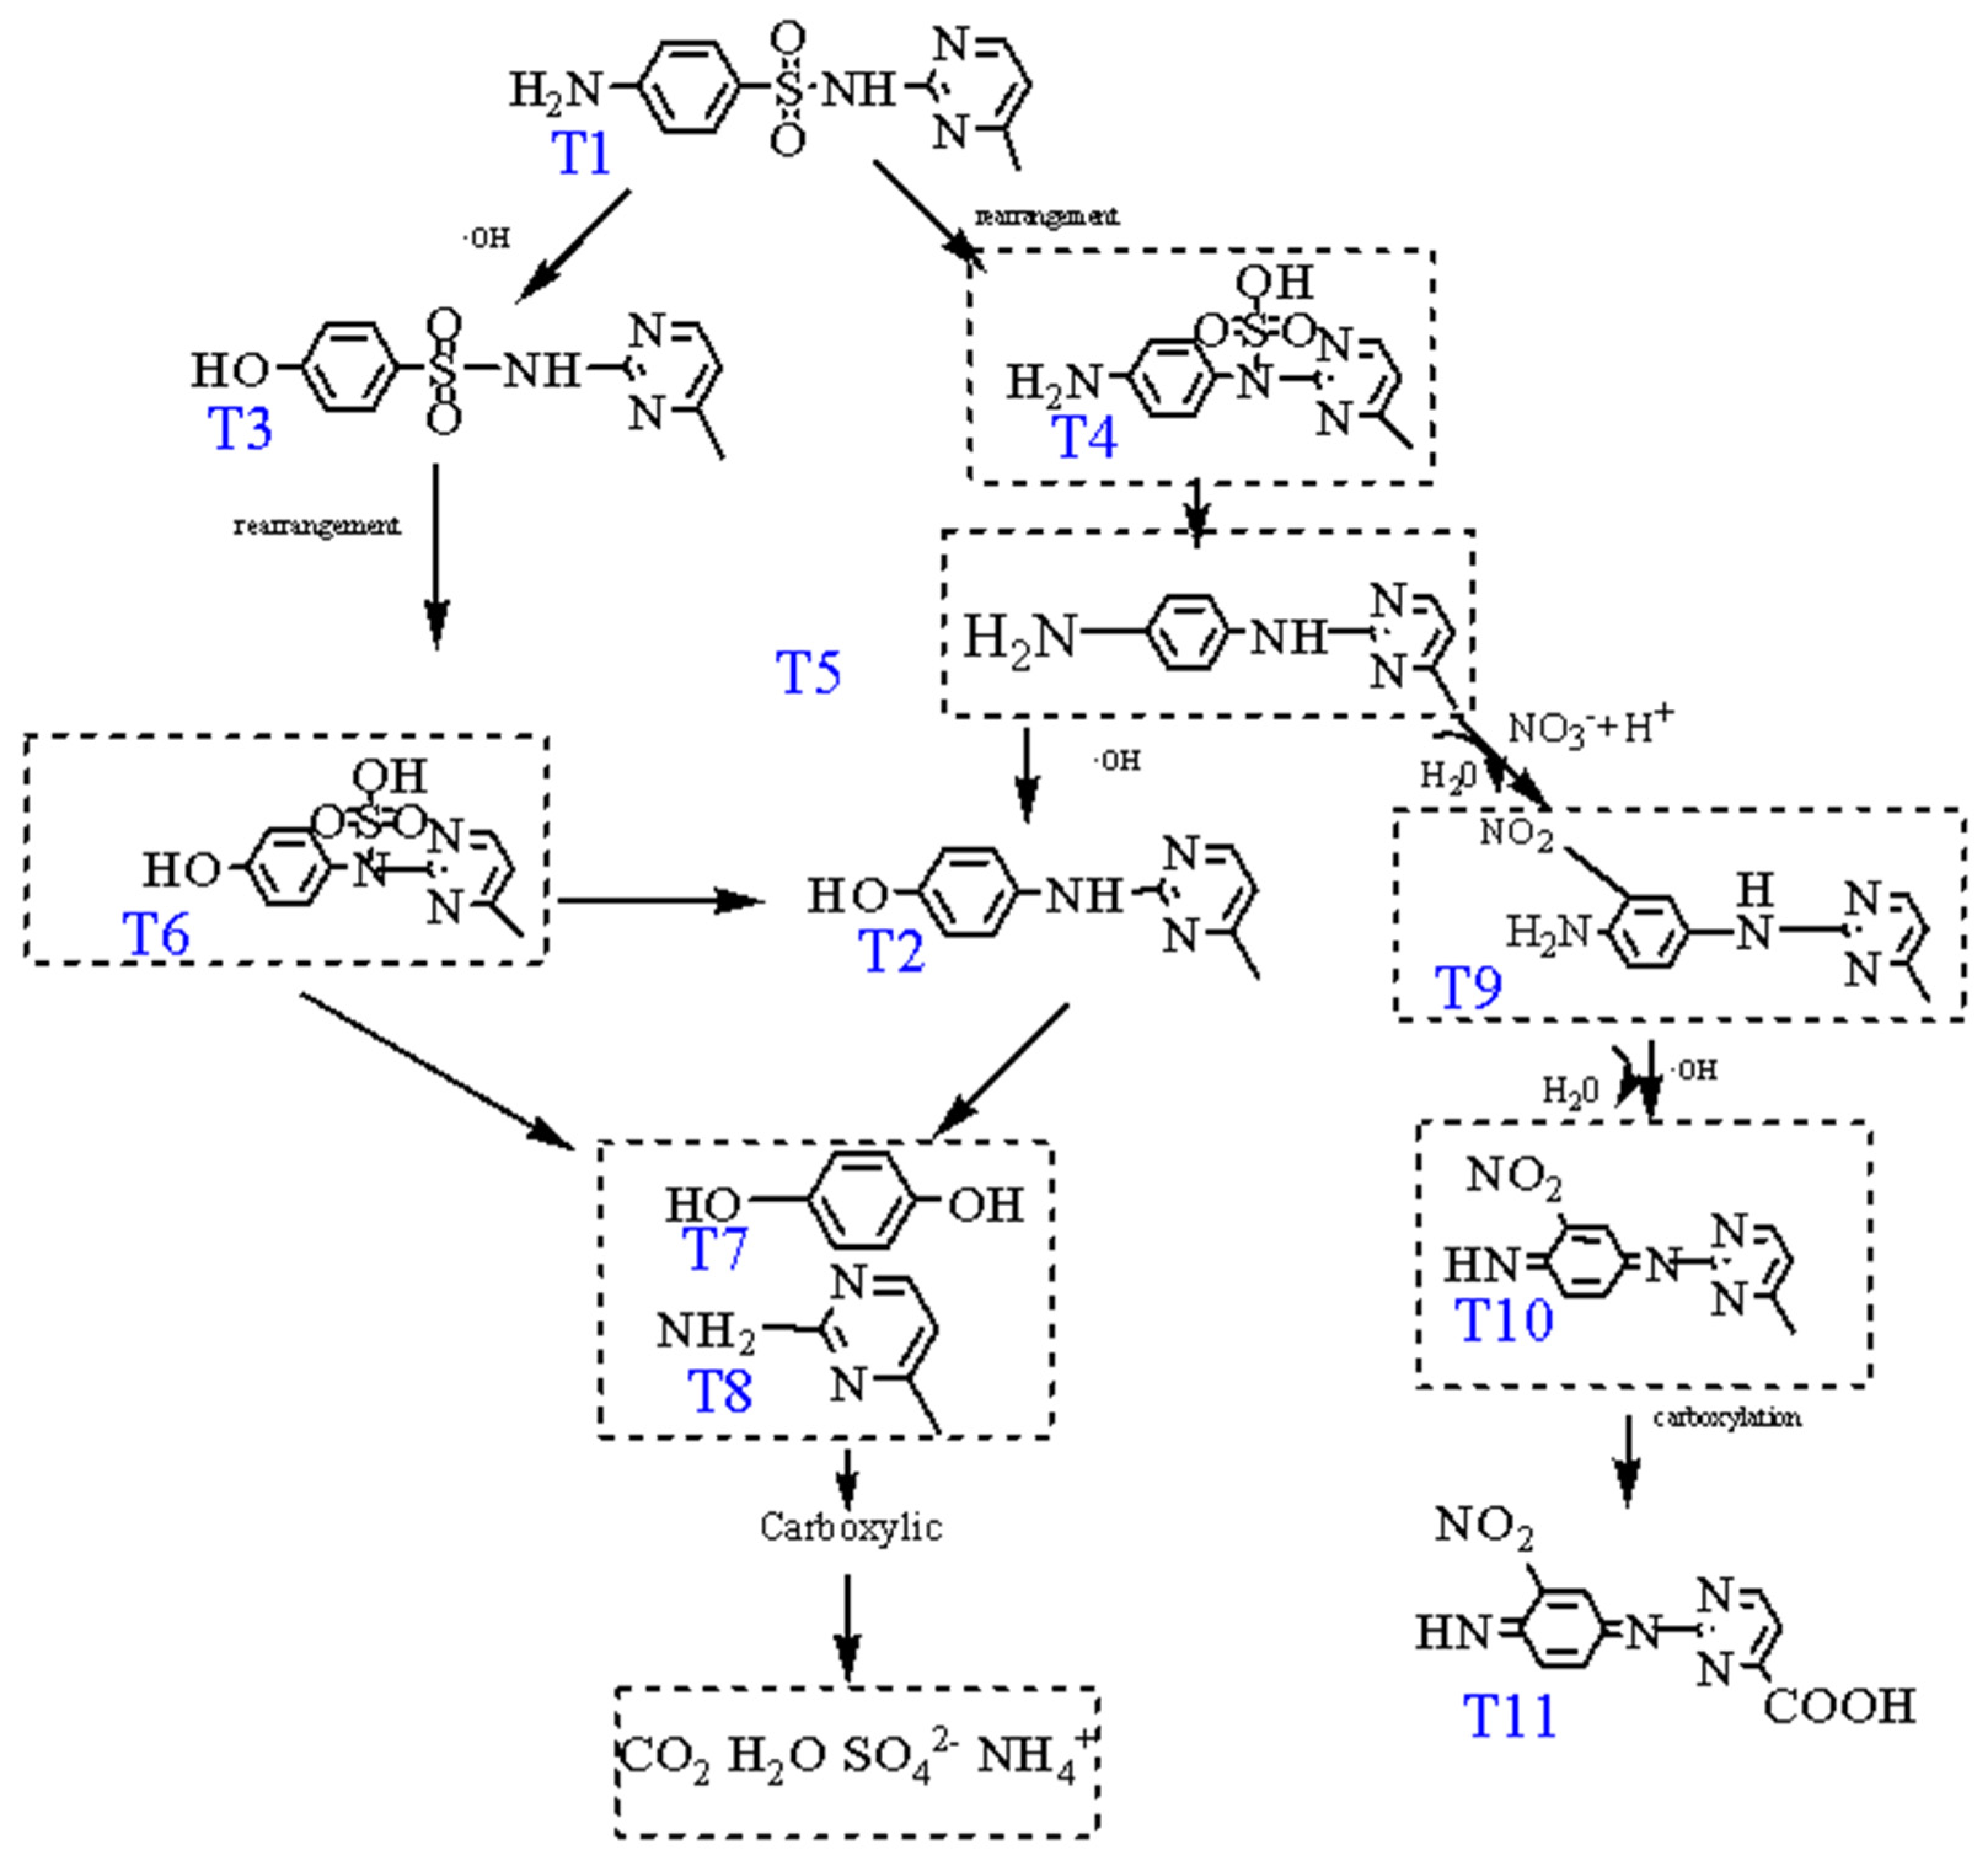
Based on the experimental results, a reasonable degradation principle of the electrochemical degradation of SMR has been proposed. As shown in Figure 10, the formation of T3 is formed by the hydroxylation of the sulfonamide bond. SMILEs rearrangement and fragmentation of S-N link result in the formation of T2. For the formation of T11, SMR was nitrified first (T9), then amidogen on the benzene ring was oxidized (T10). Finally, the methyl group on SMR was carboxylation (T11). Above all the aromatic intermediates were oxidized to carboxylic acid and eventually undergo mineralization to SO42, CO2, H2O, and NH4+.

4. Conclusions

In summary, PbO2 electrodes with different doses of Er doping were fabricated and characterized systematically. Results showed that Er had been successfully doped into a PbO2 catalyst layer and its doping smoothed the surface, increased electrode OEP, and enhanced the oxidation ability of PbO2, especially for 2% Er-PbO2. Electrochemical oxidation of SMR in Er-PbO2 system has been investigated. The pseudo first-order reaction kinetics constant obeyed the sequence of 2% Er-PbO2 > 4% Er-PbO2 > 1% Er-PbO2 > 0.5% Er-PbO2 > 0% PbO2. Effects of pH value and current density on SMR degradation have been analysed. The degradation pathway was proposed based on the active sites identified by DFT calculation and LC-MS analysis of the intermediates. All laboratorial results show that the electrochemical degradation of SMR using 2% Er-PbO2 electrodes as anodes has great potential for application. The efficient removal of SMR by this electrochemical system prevents both the enrichment of SMR in the human body through the biological chain and the creation of superbugs. This can effectively prevent the human body from developing resistance to sulfonamide antibiotics, which has great significance for the treatment of human bacterial infections and contributes to the maintenance of human health.

Supplementary Materials

The following supporting information can be downloaded at: https://www.mdpi.com/article/10.3390/ijerph192013503/s1, Figure S1: SEM of TiO2-NCs and TiO2-NCs/SnO2-Sb; Figure S2: EDS results of different Er-PbO2 electrodes; Figure S3: Kinetics Analysis at different Electrodes (a), current densities (b), pH (c) in Electrochemical degradation process; Figure S4: The optimized SMR configuration; Figure S5: HPLC-Q-TOF-MS/MS images of intermediate products degraded under neutral conditions; Table S1: Accelerate life time of prepared electrodes; Table S2: Percentage of different elements in Er-PbO2 by EDS; Table S3: Parameters of the first-order reaction kinetics; Table S4: Electron density of each atom of SMR.

Author Contributions

Data curation, T.Z., C.W., J.X. and X.X.; Formal analysis, C.W.; Funding acquisition, X.X.; Investigation, T.Z. and H.C.; Methodology, T.Z., H.C., Y.W. and X.X. All authors have read and agreed to the published version of the manuscript.

Funding

This work was supported by National Natural Science Foundation of China (No. 51409285, 51809087) and Basic research funds for the central universities (2022QNPY51).

Institutional Review Board Statement

Not applicable.

Informed Consent Statement

Not applicable.

Data Availability Statement

Not applicable.

Conflicts of Interest

The authors declare no conflict of interest.

References

  1. Oturan, N.; Wu, J.; Zhang, H.; Sharma, V.K.; Oturan, M.A. Electrocatalytic destruction of the antibiotic tetracycline in aqueous medium by electrochemical advanced oxidation processes: Effect of electrode materials. Appl. Catal. B Environ. 2013, 140, 92–97. [Google Scholar] [CrossRef]
  2. Klein, E.Y.; Van Boeckel, T.P.; Martinez, E.M.; Pant, S.; Gandra, S.; Levin, S.A.; Goossens, H.; Laxminarayan, R. Global increase and geographic convergence in antibiotic consumption between 2000 and 2015. Proc. Natl. Acad. Sci. USA 2018, 115, E3463–E3470. [Google Scholar] [CrossRef] [Green Version]
  3. Zhang, Q.Q.; Ying, G.G.; Pan, C.G.; Liu, Y.S.; Zhao, J.L. Comprehensive Evaluation of Antibiotics Emission and Fate in the River Basins of China: Source Analysis, Multimedia Modeling, and Linkage to Bacterial Resistance. Environ. Sci. Technol. 2015, 49, 6772–6782. [Google Scholar] [CrossRef]
  4. Cheng, D.L.; Ngo, H.H.; Guo, W.S.; Chang, S.W.; Nguyen, D.D.; Liu, Y.W.; Wei, Q.; Wei, D. A critical review on antibiotics and hormones in swine wastewater: Water pollution problems and control approaches. J. Hazard. Mater. 2020, 387, 121682. [Google Scholar] [CrossRef]
  5. Baran, W.; Adamek, E.; Sobczak, A.; Makowski, A. Photocatalytic degradation of sulfa drugs with TiO2, Fe salts and TiO2/FeCl3 in aquatic environment-Kinetics and degradation pathway. Appl. Catal. B Environ. 2009, 90, 516–525. [Google Scholar] [CrossRef]
  6. Wang, S.L.; Wang, H. Adsorption behavior of antibiotic in soil environment: A critical review. Front. Env. Sci. Eng. 2015, 9, 565–574. [Google Scholar] [CrossRef]
  7. Uslu, M.O.; Balcioglu, I.A. Comparison of the ozonation and Fenton process performances for the treatment of antibiotic containing manure. Sci. Total Environ. 2009, 407, 3450–3458. [Google Scholar] [CrossRef]
  8. Hermosilla, D.; Han, C.; Nadagouda, M.N.; Machala, L.; Gasco, A.; Campo, P.; Dionysiou, D.D. Environmentally friendly synthesized and magnetically recoverable designed ferrite photo-catalysts for wastewater treatment applications. J. Hazard. Mater. 2020, 381, 121200. [Google Scholar] [CrossRef]
  9. Gao, Y.; Wang, Q.; Ji, G.Z.; Li, A.M. Degradation of antibiotic pollutants by persulfate activated with various carbon materials. Chem. Eng. J. 2022, 429, 132387. [Google Scholar] [CrossRef]
  10. Kitazono, Y.; Ihara, I.; Yoshida, G.; Toyoda, K.; Umetsu, K. Selective degradation of tetracycline antibiotics present in raw milk by electrochemical method. J. Hazard. Mater. 2012, 243, 112–116. [Google Scholar] [CrossRef]
  11. Sires, I.; Brillas, E. Remediation of water pollution caused by pharmaceutical residues based on electrochemical separation and degradation technologies: A review. Environ. Int. 2012, 40, 212–229. [Google Scholar] [CrossRef] [PubMed]
  12. Brillas, E.; Martinez-Huitle, C.A. Decontamination of wastewaters containing synthetic organic dyes by electrochemical methods. An updated review. Appl. Catal. B Environ. 2015, 166, 603–643. [Google Scholar] [CrossRef]
  13. Salazar, C.; Contreras, N.; Mansilla, H.D.; Yanez, J.; Salazar, R. Electrochemical degradation of the antihypertensive losartan in aqueous medium by electro-oxidation with boron-doped diamond electrode. J. Hazard. Mater. 2016, 319, 84–92. [Google Scholar] [CrossRef] [PubMed]
  14. Zhao, J.; Zhu, C.Z.; Lu, J.; Hu, C.J.; Peng, S.C.; Chen, T.H. Electro-catalytic degradation of bisphenol A with modified Co3O4/beta-PbO2/Ti electrode. Electrochim. Acta 2014, 118, 169–175. [Google Scholar] [CrossRef]
  15. Wang, Q.; Jin, T.; Hu, Z.X.; Zhou, L.; Zhou, M.H. TiO2-NTs/SnO2-Sb anode for efficient electrocatalytic degradation of organic pollutants: Effect of TiO2-NTs architecture. Sep. Purif. Technol. 2013, 102, 180–186. [Google Scholar] [CrossRef]
  16. Lin, H.; Niu, J.F.; Xu, J.L.; Li, Y.; Pan, Y.H. Electrochemical mineralization of sulfamethoxazole by Ti/SnO2-Sb/Ce-PbO2 anode: Kinetics, reaction pathways, and energy cost evolution. Electrochim. Acta 2013, 97, 167–174. [Google Scholar] [CrossRef]
  17. An, H.; Li, Q.; Tao, D.J.; Cui, H.; Xu, X.T.; Ding, L.; Sun, L.; Zhai, J.P. The synthesis and characterization of Ti/SnO2-Sb2O3/PbO2 electrodes: The influence of morphology caused by different electrochemical deposition time. Appl. Surf. Sci. 2011, 258, 218–224. [Google Scholar] [CrossRef]
  18. Dai, Q.Z.; Xia, Y.J.; Chen, J.M. Mechanism of enhanced electrochemical degradation of highly concentrated aspirin wastewater using a rare earth La-Y co-doped PbO2 electrode. Electrochim. Acta 2016, 188, 871–881. [Google Scholar] [CrossRef]
  19. Yao, Y.W.; Li, M.Y.; Yang, Y.; Cui, L.L.; Guo, L. Electrochemical degradation of insecticide hexazinone with Bi-doped PbO2 electrode: Influencing factors, intermediates and degradation mechanism. Chemosphere 2019, 216, 812–822. [Google Scholar] [CrossRef]
  20. Wang, C.Y.; Wang, F.W.; Xu, M.; Zhu, C.G.; Fang, W.Y.; Wei, Y.J. Electrocatalytic degradation of methylene blue on Co doped Ti/TiO2 nanotube/PbO2 anodes prepared by pulse electrodeposition. J. Electroanal. Chem. 2015, 759, 158–166. [Google Scholar] [CrossRef]
  21. Xu, M.; Mao, Y.L.; Song, W.L.; OuYang, X.M.; Hu, Y.H.; Wei, Y.J.; Zhu, C.G.; Fang, W.Y.; Shao, B.C.; Lu, R.; et al. Preparation and characterization of Fe-Ce co-doped Ti/TiO2 NTs/PbO2 nanocomposite electrodes for efficient electrocatalytic degradation of organic pollutants. J. Electroanal. Chem. 2018, 823, 193–202. [Google Scholar] [CrossRef]
  22. Yang, B.; Wang, J.B.; Jiang, C.J.; Li, J.Y.; Yu, G.; Deng, S.B.; Lu, S.Y.; Zhang, P.X.; Zhu, C.Z.; Zhuo, Q.F. Electrochemical mineralization of perfluorooctane sulfonate by novel F and Sb co-doped Ti/SnO2 electrode containing Sn-Sb interlayer. Chem. Eng. J. 2017, 316, 296–304. [Google Scholar] [CrossRef]
  23. Niu, J.F.; Lin, H.; Xu, J.L.; Wu, H.; Li, Y.Y. Electrochemical Mineralization of Perfluorocarboxylic Acids (PFCAs) by Ce-Doped Modified Porous Nanocrystalline PbO2 Film Electrode. Environ. Sci. Technol. 2012, 46, 10191–10198. [Google Scholar] [CrossRef]
  24. Dai, Q.Z.; Shen, H.; Xia, Y.J.; Chen, F.; Wang, J.D.; Chen, J.M. The application of a novel Ti/SnO2-Sb2O3/PTFE-La-Ce-beta-PbO2 anode on the degradation of cationic gold yellow X-GL in sono-electrochemical oxidation system. Sep. Purif. Technol. 2013, 104, 9–16. [Google Scholar] [CrossRef]
  25. Dai, Q.Z.; Li, W.D.; Shen, H.; Chen, J.M. Enhanced Mineralization of Cationic Red X-GRL with Rare Earth doped materials: Gd for example. Int. J. Electrochem. Sci. 2013, 8, 12287–12295. [Google Scholar]
  26. Wang, Y.; Shen, Z.Y.; Chen, X.C. Effects of experimental parameters on 2,4-dichlorphenol degradation over Er-chitosan-PbO2 electrode. J. Hazard. Mater. 2010, 178, 867–874. [Google Scholar] [CrossRef]
  27. Li, S.H.; Liu, Y.K.; Wu, Y.M.; Chen, W.W.; Qin, Z.J.; Gong, N.L.; Yu, D.P. Highly sensitive formaldehyde resistive sensor based on a single Er-doped SnO2 nanobelt. Phys. B Condens. Matter 2016, 489, 33–38. [Google Scholar] [CrossRef]
  28. Wang, Y.; Zhou, C.; Wu, J.; Niu, J. Insights into the electrochemical degradation of sulfamethoxazole and its metabolite by Ti/SnO2-Sb/Er-PbO2 anode. Chin. Chem. Lett. 2020, 31, 2673–2677. [Google Scholar] [CrossRef]
  29. Zhou, Y.Z.; Li, Z.L.; Hao, C.T.; Zhang, Y.C.; Chai, S.N.; Han, G.P.; Xu, H.N.; Lu, J.S.; Dang, Y.; Sun, X.Q.; et al. Electrocatalysis enhancement of alpha, beta-PbO2 nanocrystals induced via rare earth Er(III) doping strategy: Principle, degradation application and electrocatalytic mechanism. Electrochim. Acta 2020, 333, 135535. [Google Scholar] [CrossRef]
  30. Wang, W.Y.; Duan, X.Y.; Sui, X.Y.; Wang, Q.; Xu, F.; Chang, L.M. Surface characterization and electrochemical properties of PbO2/SnO2 composite anodes for electrocatalytic oxidation of m-nitrophenol. Electrochim. Acta 2020, 335, 135649. [Google Scholar] [CrossRef]
  31. Yao, Y.; Teng, G.; Yang, Y.; Ren, B.; Cui, L. Electrochemical degradation of neutral red on PbO2/α-Al2O3 composite electrodes: Electrode characterization, byproducts and degradation mechanism. Separ. Purif. Technol. 2019, 227, 115684. [Google Scholar] [CrossRef]
  32. Yao, Y.; Teng, G.; Yang, Y.; Huang, C.; Liu, B.; Guo, L. Electrochemical oxidation of acetamiprid using Yb-doped PbO2 electrodes: Electrode characterization, influencing factors and degradation pathways. Separ. Purif. Technol. 2019, 211, 456–466. [Google Scholar] [CrossRef]
  33. Gao, B.; Sun, M.; Ding, W.; Ding, Z.; Liu, W. Decoration of γ-graphyne on TiO2 nanotube arrays: Improved photoelectrochemical and photoelectrocatalytic properties. Appl. Catal. B Environ. 2021, 281, 119492. [Google Scholar] [CrossRef]
  34. Ansari, A.; Nematollahi, D. A comprehensive study on the electrocatalytic degradation, electrochemical behavior and degradation mechanism of malachite green using electrodeposited nanostructured beta-PbO2 electrodes. Water Res. 2018, 144, 462–473. [Google Scholar] [CrossRef]
  35. Qiu, J.P.; Tang, J.T.; Shen, J.; Wu, C.W.; Qian, M.Q.; He, Z.Q.; Chen, J.M.; Song, S. Preparation of a silver electrode with a three-dimensional surface and its performance in the electrochemical reduction of carbon dioxide. Electrochim. Acta 2016, 203, 99–108. [Google Scholar]
  36. Xu, H.; Shao, D.; Zhang, Q.; Yang, H.H.; Wei, Y. Preparation and characterization of PbO2 electrodes from electro-deposition solutions with different copper concentration. Rsc Adv. 2014, 4, 25011–25017. [Google Scholar]
  37. Souri, Z.; Ansari, A.; Nematollahi, D.; Mazloum-Ardakani, M. Electrocatalytic degradation of dibenzoazepine drugs by fluorine doped beta-PbO2 electrode: New insight into the electrochemical oxidation and mineralization mechanisms. J. Electroanal. Chem. 2020, 862, 114037. [Google Scholar] [CrossRef]
  38. Kong, J.T.; Shi, S.Y.; Kong, L.C.; Zhu, X.P.; Ni, J.R. Preparation and characterization of PbO2 electrodes doped with different rare earth oxides. Electrochim. Acta 2007, 53, 2048–2054. [Google Scholar] [CrossRef]
  39. Chang, L.M.; Zhou, Y.; Duan, X.Y.; Liu, W.; Xu, D.D. Preparation and characterization of carbon nanotube and Bi co-doped PbO2 electrode. J. Taiwan Inst. Chem. Eng. 2014, 45, 1338–1346. [Google Scholar] [CrossRef]
  40. Xia, Y.J.; Bian, X.Z.; Xia, Y.; Zhou, W.; Wang, L.; Fan, S.Q.; Xiong, P.; Zhan, T.T.; Dai, Q.Z.; Chen, J.M. Effect of indium doping on the PbO2 electrode for the enhanced electrochemical oxidation of aspirin: An electrode comparative study. Sep. Purif. Technol. 2020, 237, 116321. [Google Scholar] [CrossRef]
  41. Tahar, N.B.; Savall, A. Electropolymerization of phenol on a vitreous carbon electrode in acidic aqueous solution at different temperatures. J. Appl. Electrochem. 2011, 41, 983–989. [Google Scholar] [CrossRef] [Green Version]
  42. Xia, Y.J.; Dai, Q.Z. Electrochemical degradation of antibiotic levofloxacin by PbO2 electrode: Kinetics, energy demands and reaction pathways. Chemosphere. 2018, 205, 215–222. [Google Scholar] [CrossRef]
  43. Bian, X.Z.; Xia, Y.; Zhan, T.T.; Wang, L.; Zhou, W.; Dai, Q.Z.; Chen, J.M. Electrochemical removal of amoxicillin using a Cu doped PbO2 electrode: Electrode characterization, operational parameters optimization and degradation mechanism. Chemosphere 2019, 233, 762–770. [Google Scholar] [CrossRef] [PubMed]
  44. Li, H.; Yu, Q.N.; Yang, B.; Li, Z.J.; Lei, L.C. Electrochemical treatment of artificial humidity condensate by large-scale boron doped diamond electrode. Sep. Purif. Technol. 2014, 138, 13–20. [Google Scholar] [CrossRef]
  45. Fan, Y.; Ai, Z.H.; Zhang, L.Z. Design of an electro-Fenton system with a novel sandwich film cathode for wastewater treatment. J. Hazard. Mater. 2010, 176, 678–684. [Google Scholar] [CrossRef]
  46. Wang, C.; Yin, L.F.; Xu, Z.S.; Niu, J.F.; Hou, L.A. Electrochemical degradation of enrofloxacin by lead dioxide anode: Kinetics, mechanism and toxicity evaluation. Chem. Eng. J. 2017, 326, 911–920. [Google Scholar] [CrossRef]
  47. Hazhir, N.; Kiani, F.; Tahermansouri, H.; Hasan Saraei, A.G.; Koohyar, F. Prediction of Thermodynamic and Structural Properties of Sulfamerazine and Sulfamethazine in Water Using DFT and ab Initio Methods. J. Mex. Chem. Soc. 2018, 62, 1–13. [Google Scholar] [CrossRef] [Green Version]
  48. Wu, J.; Zhang, H.; Oturan, N.; Wang, Y.; Chen, L.; Oturan, M.A. Application of response surface methodology to the removal of the antibiotic tetracycline by electrochemical process using carbon-felt cathode and DSA (Ti/RuO2-IrO2) anode. Chemosphere 2012, 87, 614–620. [Google Scholar] [CrossRef]
  49. Hai, H.; Xing, X.; Li, S.; Xia, S.; Xia, J. Electrochemical oxidation of sulfamethoxazole in BDD anode system: Degradation kinetics, mechanisms and toxicity evaluation. Sci. Total Environ. 2020, 738, 139909. [Google Scholar] [CrossRef]
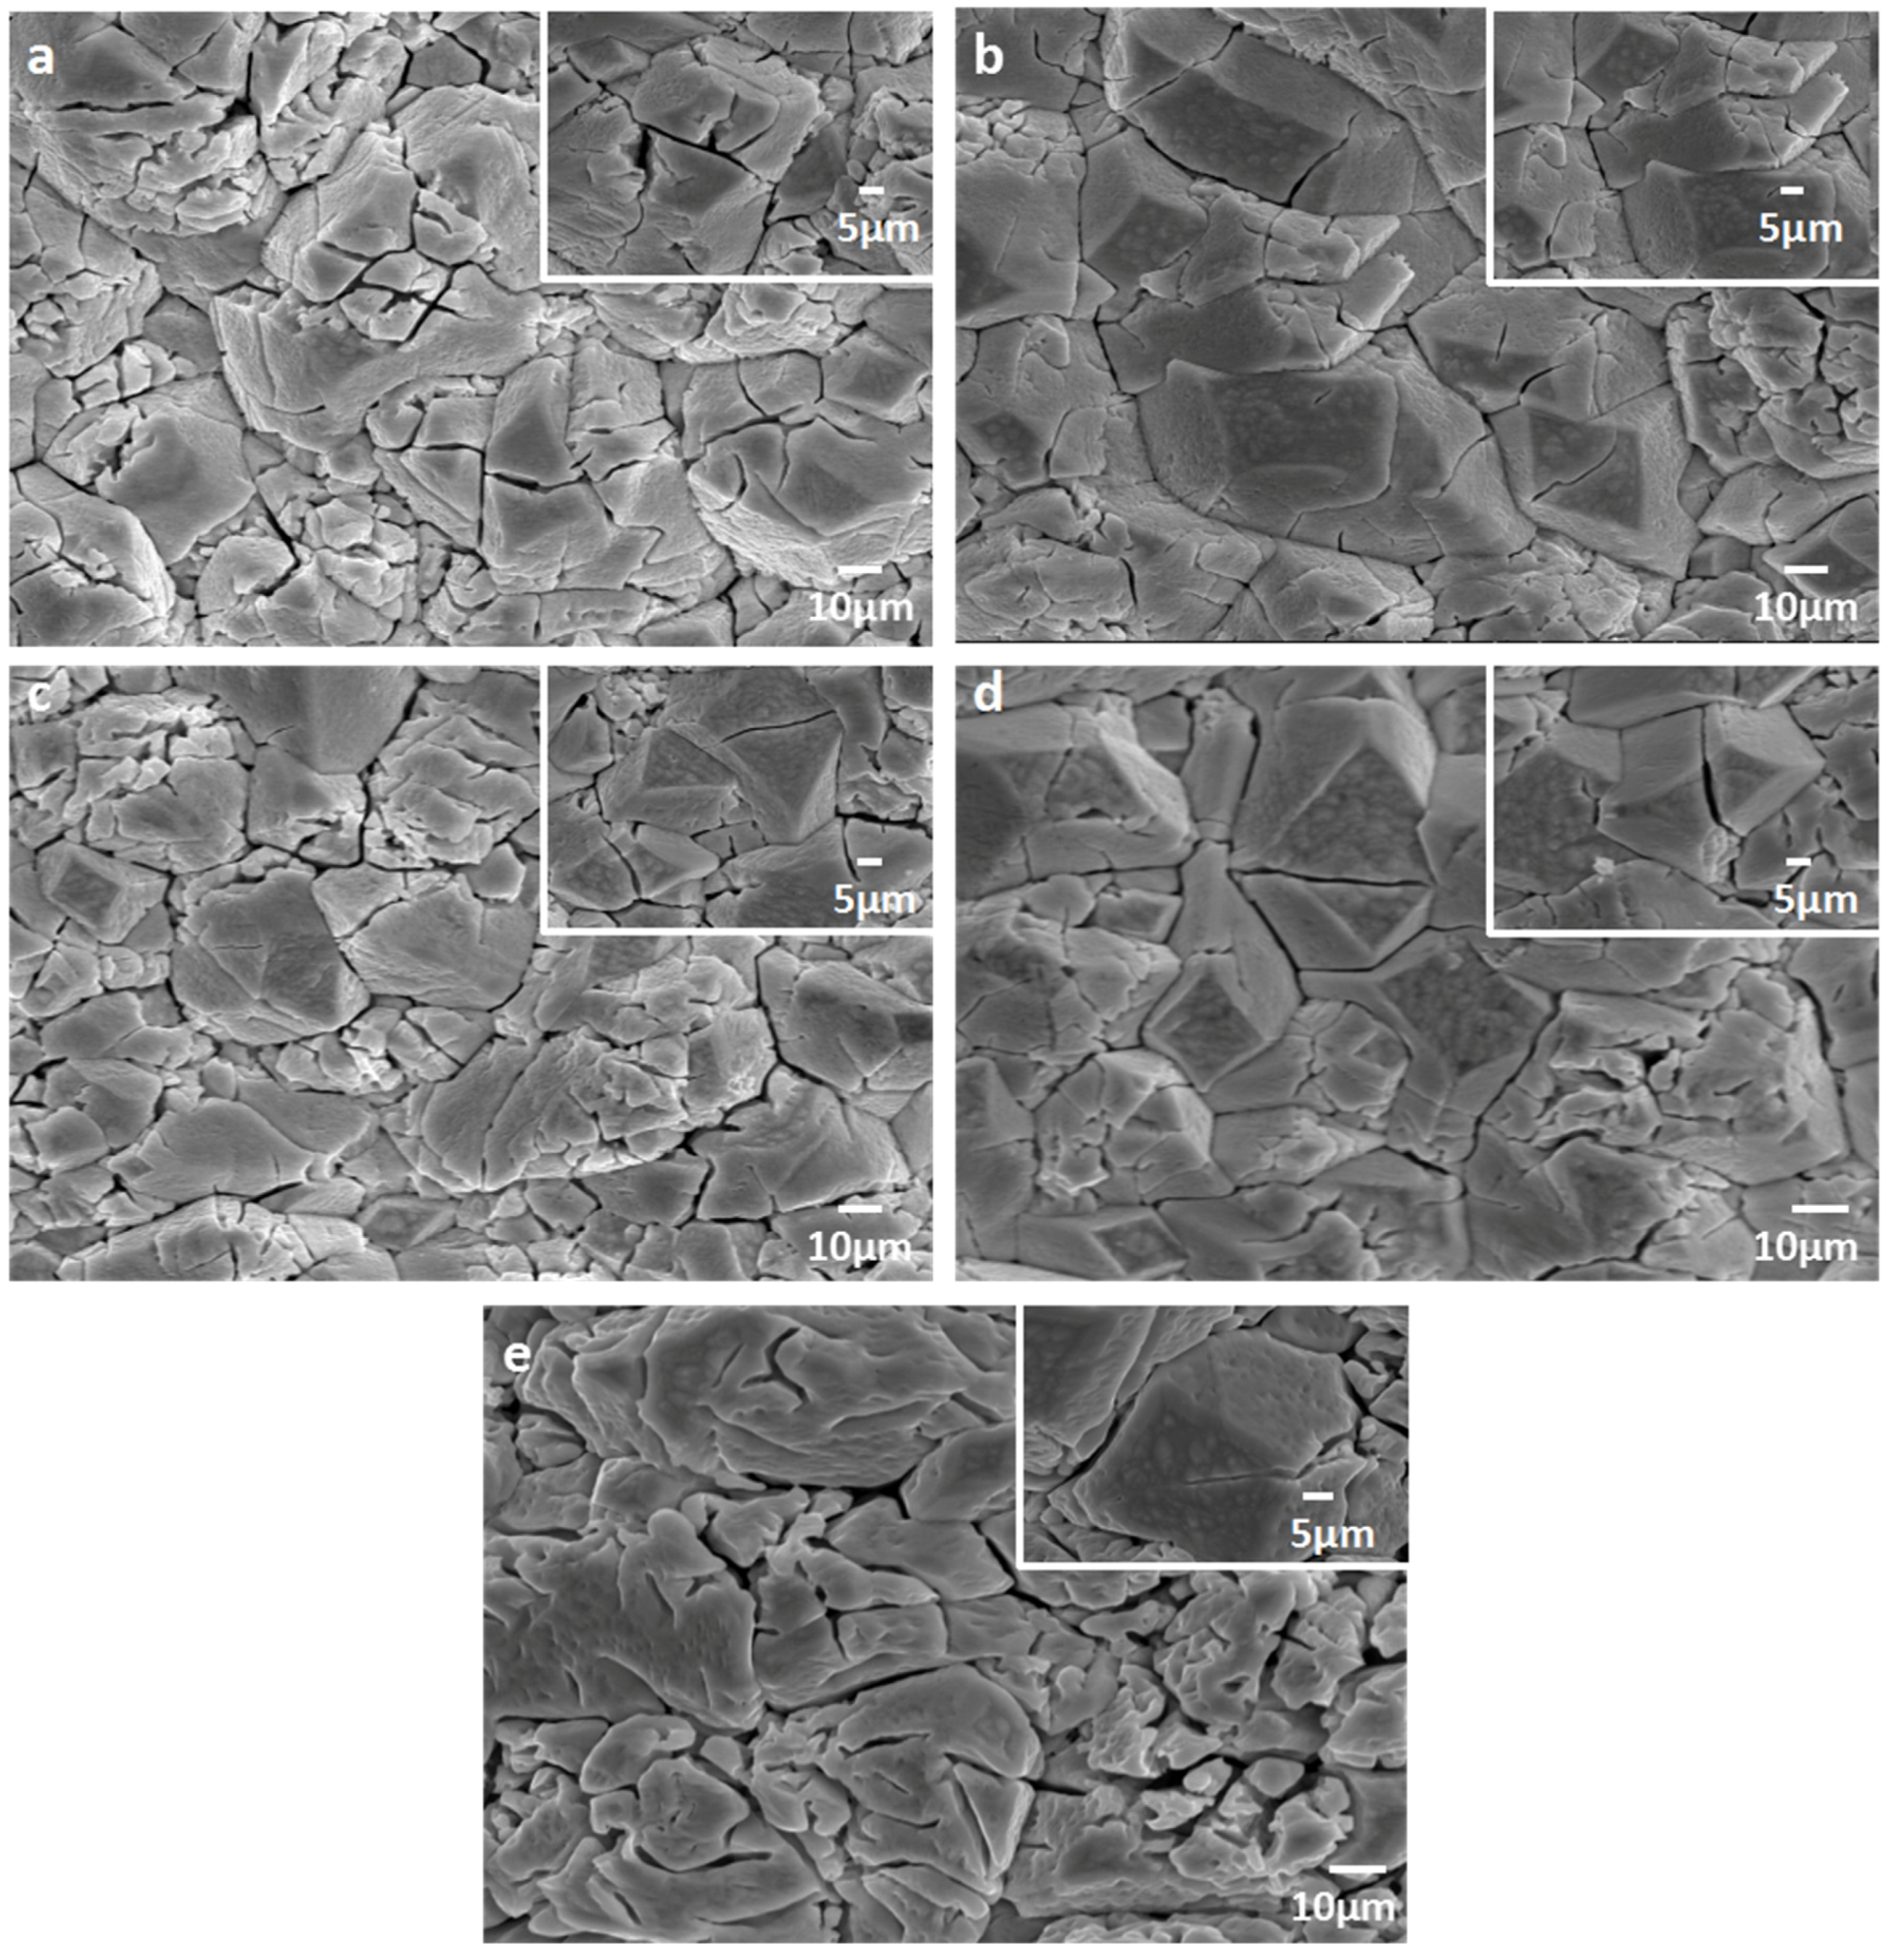
Figure 1. SEM diagram of distinct Er doped PbO2 electrodes: (a) (0% PbO2 electrode), (b) (0.5% Er-PbO2 electrode), (c) (1.0% Er-PbO2 electrode), (d) (2.0% Er-PbO2 electrode), (e) (4.0% Er-PbO2 electrode).
Ijerph 19 13503 g001
Figure 2. EDS spectra of different electrodes.
Ijerph 19 13503 g002
Figure 3. XRD pattern of distinct Er-PbO2 electrodes.
Ijerph 19 13503 g003
Figure 4. LSV of distinct Er-PbO2 measured in 0.5 M H2SO4 at 25 °C, scan rate: 10 mV·s−1.
Ijerph 19 13503 g004
Figure 5. Removal rate of SMR (a) and COD removal rate (b), COD removal rate to SMR removal rate (c) in electrochemical degradation process of different electrodes.
Ijerph 19 13503 g005
Figure 6. Removal rate of SMR at distinct current densities (a), removal rate of COD (b), current efficiency of electrochemical degradation of SMR (c), energy consumption (d).
Ijerph 19 13503 g006
Figure 7. Removal rate of SMR (a), removal rate of COD (b) at different pH conditions.
Ijerph 19 13503 g007
Figure 8. Hydrolysis structure of SMR.
Ijerph 19 13503 g008
Figure 9. (top) Structure of SMR molecules. (bottom) possible active sites inferred from the Fukui index (f 0).
Ijerph 19 13503 g009
Figure 10. SMR degradation pathway of electrochemical oxidation.
Ijerph 19 13503 g010
Table 1. Lattice dimensions of different Er-PbO2 electrodes.
ElectrodesWHM (301)D (nm)
0% PbO20.3907243.43
0.5% Er-PbO20.4065941.73
1.0% Er-PbO20.4242939.99
2.0% Er-PbO20.4246239.96
4.0% Er-PbO20.4048141.92
Table 2. Fukui index ( f k 0 ) distribution on SMX.
Atomqk (N − 1)qk (N)qk (N + 1) f k 0
1C−0.084593−0.118527−0.1115590.013483
2C−0.044314−0.056261−0.0953930.0255395
3C−0.180775−0.199223−0.1824520.0008385
4C−0.069064−0.080553−0.0982210.0145785
5C−0.079208−0.114647−0.1157760.018284
6C0.3432550.2988170.2552460.0440045
7N−0.582625−0.655931−0.6566880.0370315
8S1.2856321.2424650.9258130.1799095
9O−0.500962−0.551447−0.5928880.045963
10O−0.467286−0.517021−0.5992610.0659875
11N−0.681021−0.698172−0.597924−0.0415485
12C0.6660930.6525610.5333120.0663905
13C0.1335490.1249840.1137740.0098875
14C0.3002350.2974060.301063−0.000414
15C−0.118096−0.139383−0.1572660.019585
16C−0.370212−0.363920−0.363191−0.0035105
17N−0.490604−0.516130−0.5287660.019081
18N−0.476218−0.468657−0.448271−0.0139735
Bold data: sites vulnerable to free radical attack.
Table 3. m/z chart for the analysis of intermediates by LC-MS.
NumberMolecular Formulam/zMolecular WeightMolecular Structure
T1C11H12N4O2S265.0756264Ijerph 19 13503 i001
T2C11H11N3O202.0982201Ijerph 19 13503 i002
T3C11H11N3O3S266.0775265Ijerph 19 13503 i003
T11C11H7N5O4274.2759273Ijerph 19 13503 i004
Publisher’s Note: MDPI stays neutral with regard to jurisdictional claims in published maps and institutional affiliations.