
Discrimination Experiences during COVID-19 among a National, Multi-Lingual, Community-Based Sample of Asian Americans and Pacific Islanders: COMPASS Findings

 ,
,  ,
,
Abstract
:1. Introduction
2. Materials and Methods
2.1. Study Eligibility, Recruitment and Procedures
2.2. Measurement Framework
2.3. Measures
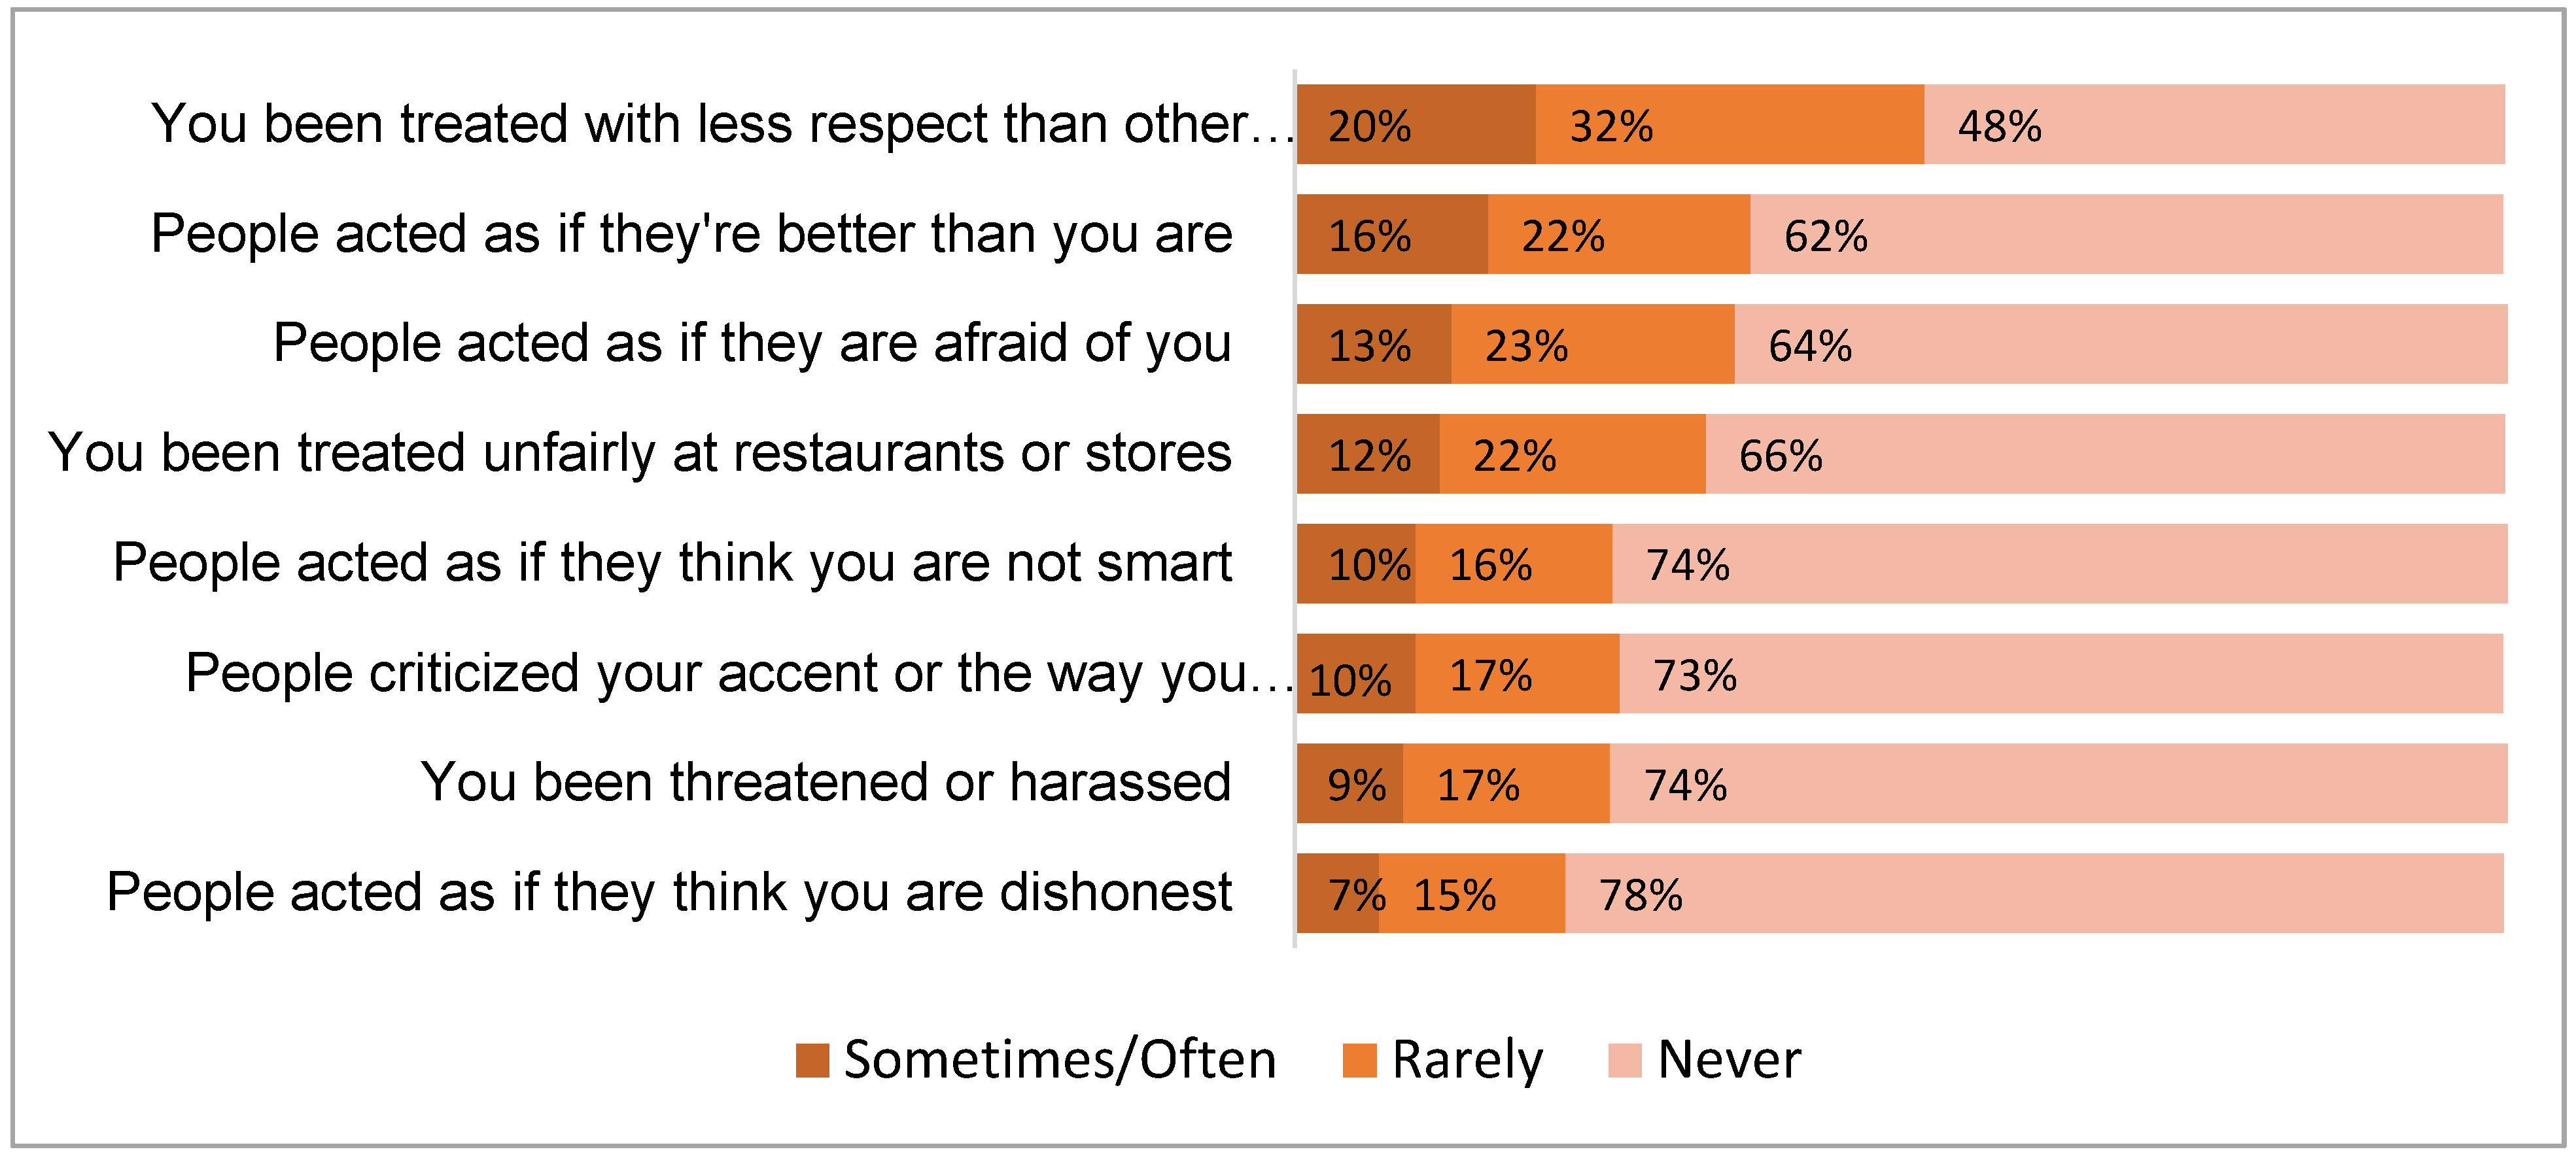
2.3.1. Discrimination Experiences during COVID-19 Pandemic
- you been treated with less respect than other people…
- you been treated unfairly at restaurants or stores…
- people criticized your accent or the way you speak…
- people acted as if they think you are not smart…
- people acted as if they are afraid of you…
- people acted as if they think you are dishonest…
- people acted as if they’re better than you are…
- you been threatened or harassed…
2.3.2. Sociodemographic Characteristics
2.3.3. Individual Level Characteristics
2.3.4. Interpersonal Level Characteristics
2.3.5. Community Level Characteristics
2.3.6. Societal Level Characteristics
2.4. Statistical Analysis
3. Results
3.1. Sample Characteristics
3.2. COVID-19-Related Discrimination Experience
3.3. Bivarate and Multivariable Analyses
4. Discussion
5. Conclusions
Author Contributions
Funding
Institutional Review Board Statement
Informed Consent Statement
Data Availability Statement
Acknowledgments
Conflicts of Interest
References
- Human Rights Watch. COVID-19 Fueling Anti-Asian Racism and Xenophobia Worldwide. Available online: https://www.hrw.org/news/2020/05/12/covid-19-fueling-anti-asian-racism-and-xenophobia-worldwide# (accessed on 27 December 2021).
- Stop AAPI Hate. Stop AAPI Hate National Report. Available online: https://stopaapihate.org/wp-content/uploads/2021/08/Stop-AAPI-Hate-National-Report-Final.pdf (accessed on 18 August 2021).
- American Psychological Association. Discrimination: What It Is, and How to Cope. Available online: http://www.apa.org/topics/racism-bias-discrimination/types-stress (accessed on 22 April 2021).
- McMurtry, C.L.; Findling, M.G.; Casey, L.S.; Blendon, R.J.; Benson, J.M.; Sayde, J.M.; Miller, C. Discrimination in the United States: Experiences of Asian Americans. Health Serv. Res. 2019, 54 (Suppl. 2), 1419–1430. [Google Scholar] [CrossRef] [Green Version]
- Gee, G.C.; Hing, A.; Mohammed, S.; Tabor, D.C.; Williams, D.R. Racism and the Life Course: Taking Time Seriously. Am. J. Public Health 2019, 109, S43–S47. [Google Scholar] [CrossRef]
- Shariff-Marco, S.; Breen, N.; Landrine, H.; Reeve, B.B.; Krieger, N.; Gee, G.C.; Williams, D.R.; Mays, V.M.; Ponce, N.A.; Alegria, M.; et al. Measuring Everyday Racial/Ethnic Discrimination in Health Surveys: How Best to Ask the Questions, in One or Two Stages, Across Multiple Racial/Ethnic Groups? Du Bois Rev. 2011, 8, 159–177. [Google Scholar] [CrossRef] [Green Version]
- Liu, E. COVID-19 Has Inflamed Racism against Asian-Americans. Here’s How to Fight Back. CNN Opin. 2020. Available online: https://edition.cnn.com/2020/04/10/opinions/how-to-fight-bias-against-asian-americans-covid-19-liu/index.html (accessed on 1 May 2021).
- AAPI Data; PRRI. The Working Lives and Struggles of Asian Americans and Pacific Islanders in Califronia: Findings from the 2019 AAPI California Workers Survey. 2019. Available online: https://www.prri.org/research/the-working-lives-and-struggles-of-asian-americans-and-pacific-islanders-in-california/ (accessed on 1 May 2021).
- Oh, H.; Stickley, A.; Koyanagi, A.; Yau, R.; DeVylder, J.E. Discrimination and suicidality among racial and ethnic minorities in the United States. J. Affect. Disord. 2019, 245, 517–523. [Google Scholar] [CrossRef]
- Woo, B. Racial Discrimination and Mental Health in the USA: Testing the Reverse Racism Hypothesis. J. Racial Ethn. Health Disparities 2018, 5, 766–773. [Google Scholar] [CrossRef]
- Ao, B. Asian Americans Already Face a Mental Health Crisis. Coronavirus Racism Could Make It Worse. Available online: https://www.inquirer.com/health/coronavirus/coronavirus-racism-asian-americans-mental-health-20200422.html (accessed on 22 April 2020).
- Centers for Disease Control and Prevention. Coronavirus DIsease 2019 (COVID-19): Reducing Stigma. Available online: https://www.cdc.gov/coronavirus/2019-ncov/daily-life-coping/reducing-stigma.html?CDC_AA_refVal=https%3A%2F%2Fwww.cdc.gov%2Fcoronavirus%2F2019-ncov%2Fsymptoms-testing%2Freducing-stigma.html (accessed on 30 November 2021).
- Ellerbeck, A. Survey: More than 30 Percent of Americans Have Witnessed COVID-19 Bias Against Asians. Coronavirus Inequal. 2020. Available online: https://publicintegrity.org/health/coronavirus-and-inequality/survey-majority-of-asian-americans-have-witnessed-covid-19-bias/ (accessed on 1 May 2021).
- Jeung, R.; Nham, K. Incidents of Coronavirus-Related Discrimination: A Report for A3PCON and CAA. 2020. Available online: http://www.asianpacificpolicyandplanningcouncil.org/wp-content/uploads/STOP_AAPI_HATE_MONTHLY_REPORT_4_23_20.pdf (accessed on 1 May 2021).
- Pew Research Center. Key Facts about Asian Americans, a Diverse and Growing Population. Available online: https://www.pewresearch.org/fact-tank/2017/09/08/key-facts-about-asian-americans/ (accessed on 9 January 2021).
- AAPI DATA. Infographic—Percentage of Asian Americans with Limited English Proficiency. Available online: https://aapidata.com/infographic-limited-english-2-2/ (accessed on 26 July 2021).
- Ramakrishnan, K.; Ahmad, F.Z. Language Diversity and English Proficiency. Available online: https://cdn.americanprogress.org/wp-content/uploads/2014/04/AAPI-LanguageAccess1.pdf (accessed on 2 August 2021).
- Harris, P.A.; Taylor, R.; Thielke, R.; Payne, J.; Gonzalez, N.; Conde, J.G. Research electronic data capture (REDCap)--a metadata-driven methodology and workflow process for providing translational research informatics support. J. Biomed. Inform. 2009, 42, 377–381. [Google Scholar] [CrossRef] [Green Version]
- Harris, P.A.; Taylor, R.; Minor, B.L.; Elliott, V.; Fernandez, M.; O’Neal, L.; McLeod, L.; Delacqua, G.; Delacqua, F.; Kirby, J.; et al. The REDCap consortium: Building an international community of software platform partners. J. Biomed. Inform. 2019, 95, 103208. [Google Scholar] [CrossRef]
- Collaborative Approach for AAPI Research and Education. Collaborative Approach for AAPI Research and Education (CARE). Available online: https://careregistry.ucsf.edu/ (accessed on 25 August 2021).
- World Health Organization. Process of Translation and Adaptation of Instruments. Available online: http://www.who.int/substance_abuse/research_tools/translation/en/ (accessed on 11 September 2021).
- National Institute on Minority Health and Health Disparities. NIMHD Minority Health and Health Disparities Research Framework. Available online: https://www.nimhd.nih.gov/about/overview/research-framework/adaptation-framework.html (accessed on 19 August 2021).
- Williams, D.R.; Yan, Y.; Jackson, J.S.; Anderson, N.B. Racial Differences in Physical and Mental Health: Socio-economic Status, Stress and Discrimination. J. Health Psychol. 1997, 2, 335–351. [Google Scholar] [CrossRef] [Green Version]
- Kessler, R.C.; Mickelson, K.D.; Williams, D.R. The prevalence, distribution, and mental health correlates of perceived discrimination in the United States. J. Health Soc. Behav. 1999, 40, 208–230. [Google Scholar] [CrossRef]
- Reeve, B.B.; Willis, G.; Shariff-Marco, S.N.; Breen, N.; Williams, D.R.; Gee, G.C.; Alegria, M.; Takeuchi, D.T.; Kudela, M.S.; Levin, K.Y. Comparing Cognitive Interviewing and Psychometric Methods to Evaluate a Racial/Ethnic Discrimination Scale. Field Methods 2011, 23, 397–419. [Google Scholar] [CrossRef]
- Krieger, N.; Smith, K.; Naishadham, D.; Hartman, C.; Barbeau, E.M. Experiences of discrimination: Validity and reliability of a self-report measure for population health research on racism and health. Soc. Sci. Med. 2005, 61, 1576–1596. [Google Scholar] [CrossRef] [Green Version]
- Taylor, T.R.; Kamarck, T.W.; Shiffman, S. Validation of the Detroit Area Study Discrimination Scale in a community sample of older African American adults: The Pittsburgh healthy heart project. Int. J. Behav. Med. 2004, 11, 88–94. [Google Scholar] [CrossRef]
- Chan, K.T.-K.; Tran, T.V.; Nguyen, T.-N. Cross-cultural equivalence of a measure of perceived discrimination between Chinese-Americans and Vietnamese-Americans. J. Ethn. Cult. Divers. Soc. Work 2012, 21, 20–36. [Google Scholar] [CrossRef]
- Kim, G.; Sellbom, M.; Ford, K.L. Race/ethnicity and measurement equivalence of the Everyday Discrimination Scale. Psychol. Assess. 2014, 26, 892–900. [Google Scholar] [CrossRef] [Green Version]
- Lewis, T.T.; Yang, F.M.; Jacobs, E.A.; Fitchett, G. Racial/ethnic differences in responses to the everyday discrimination scale: A differential item functioning analysis. Am. J. Epidemiol. 2012, 175, 391–401. [Google Scholar] [CrossRef] [Green Version]
- Gonzales, K.L.; Noonan, C.; Goins, R.T.; Henderson, W.G.; Beals, J.; Manson, S.M.; Acton, K.J.; Roubideaux, Y. Assessing the Everyday Discrimination Scale among American Indians and Alaska Natives. Psychol. Assess. 2016, 28, 51–58. [Google Scholar] [CrossRef]
- Gee, G.C.; Spencer, M.S.; Chen, J.; Takeuchi, D. A nationwide study of discrimination and chronic health conditions among Asian Americans. Am. J. Public Health 2007, 97, 1275–1282. [Google Scholar] [CrossRef]
- EuroQol, G. EuroQol—A new facility for the measurement of health-related quality of life. Health Policy 1990, 16, 199–208. [Google Scholar] [CrossRef]
- Rabin, R.; de Charro, F. EQ-5D: A measure of health status from the EuroQol Group. Ann. Med. 2001, 33, 337–343. [Google Scholar] [CrossRef]
- Cawthon, P.; Orwoll, E.; Ensrud, K.; Cauley, J.A.; Kritchevsky, S.B.; Cummings, S.R.; Newman, A. Assessing the impact of the COVID-19 pandemic and accompanying mitigation efforts on older adults. J. Gerontol. A Biol. Sci. Med. Sci. 2020, 75, e123–e125. [Google Scholar] [CrossRef]
- Bureau, U.S.C. Census Regions and Divisions of the United States. Available online: https://www2.census.gov/geo/pdfs/maps-data/maps/reference/us_regdiv.pdf (accessed on 29 January 2021).
- Michaels, E.; Thomas, M.; Reeves, A.; Price, M.; Hasson, R.; Chae, D.; Allen, A. Coding the Everyday Discrimination Scale: Implications for exposure assessment and associations with hypertension and depression among a cross section of mid-life African American women. J. Epidemiol. Community Health 2019, 73, 577–584. [Google Scholar] [CrossRef]
- Pachter, L.M.; Caldwell, C.H.; Jackson, J.S.; Bernstein, B.A. Discrimination and Mental Health in a Representative Sample of African-American and Afro-Caribbean Youth. J. Racial Ethn. Health Disparities 2018, 5, 831–837. [Google Scholar] [CrossRef]
- Schulz, A.J.; Gravlee, C.C.; Williams, D.R.; Israel, B.A.; Mentz, G.; Rowe, Z. Discrimination, symptoms of depression, and self-rated health among african american women in detroit: Results from a longitudinal analysis. Am. J. Public Health 2006, 96, 1265–1270. [Google Scholar] [CrossRef]
- Lee, S.; Waters, S.F. Asians and Asian Americans’ experiences of racial discrimination during the COVID-19 pandemic: Impacts on health outcomes and the buffering role of social support. Stigma Health 2021, 6, 70. [Google Scholar] [CrossRef]
- Pew Research Center. Many Black and Asian Americans Say They Have Experienced Discrimination Amid the COVID-19 OUTBREAK. Available online: https://www.pewresearch.org/social-trends/2020/07/01/many-black-and-asian-americans-say-they-have-experienced-discrimination-amid-the-covid-19-outbreak/ (accessed on 27 April 2021).
- Statistics Canada. Experiences of Discrimination during the COVID-19 Pandemic. Available online: https://www150.statcan.gc.ca/n1/daily-quotidien/200917/dq200917a-eng.htm (accessed on 27 December 2021).
- Biddle, N.; Gray, M.; Lo, J.Y. The Experience of Asian-Australians during the COVID-19 Pandemic: Discrimination and Wellbeing. Available online: https://csrm.cass.anu.edu.au/sites/default/files/docs/2020/11/The_experience_of_Asian-Australians_during_the_COVID-19_pandemic.pdf (accessed on 27 December 2021).
- Paradies, Y.; Ben, J.; Denson, N.; Elias, A.; Priest, N.; Pieterse, A.; Gupta, A.; Kelaher, M.; Gee, G. Racism as a Determinant of Health: A Systematic Review and Meta-Analysis. PLoS ONE 2015, 10, e0138511. [Google Scholar] [CrossRef] [Green Version]
- Mukkamala, S.; Suyemoto, K.L. Racialized sexism/sexualized racism: A multimethod study of intersectional experiences of discrimination for Asian American women. Asian Am. J. Psychol. 2018, 9, 32–46. [Google Scholar] [CrossRef]
- Alencar Albuquerque, G.; de Lima Garcia, C.; da Silva Quirino, G.; Alves, M.J.; Belem, J.M.; dos Santos Figueiredo, F.W.; da Silva Paiva, L.; do Nascimento, V.B.; da Silva Maciel, E.; Valenti, V.E.; et al. Access to health services by lesbian, gay, bisexual, and transgender persons: Systematic literature review. BMC Int. Health Hum. Rights 2016, 16, 2. [Google Scholar] [CrossRef] [Green Version]
- Gee, G.C.; Ro, A.; Shariff-Marco, S.; Chae, D. Racial discrimination and health among Asian Americans: Evidence, assessment, and directions for future research. Epidemiol. Rev. 2009, 31, 130–151. [Google Scholar] [CrossRef] [PubMed]
- Kamp, A.; Denson, N.; Atie, R.; Dunn, K.; Sharples, R.; Vergani, M.; Walton, J.; Sisko, S. Asian Australians’ Experiences of Racism during the COVID-19 Pandemic. Available online: https://static1.squarespace.com/static/5d48cb4d61091100011eded9/t/60f655dd3ca5073dfd636d88/1626756586620/COVID+racism+report+190721.pdf (accessed on 28 December 2021).
- History. Chinese Exclusion Act-1882, Definition and Purpose. Available online: https://www.history.com/topics/immigration/chinese-exclusion-act-1882 (accessed on 24 April 2021).
- Huynh, Q.L.; Devos, T.; Smalarz, L. Perpetual Foreigner in One’s Own Land: Potential Implications for Identity and Psychological Adjustment. J. Soc. Clin. Psychol. 2011, 30, 133–162. [Google Scholar] [CrossRef]
- Person, B.; Sy, F.; Holton, K.; Govert, B.; Liang, A.; National Center for Inectious Diseases, S.C.O.T. Fear and stigma: The epidemic within the SARS outbreak. Emerg. Infect. Dis. 2004, 10, 358–363. [Google Scholar] [CrossRef]
- Croucher, S.M.; Nguyen, T.; Rahmani, D. Prejudice toward Asian Americans in the COVID-19 pandemic: The effects of social media use in the United States. Front. Commun. 2020, 5, 39. [Google Scholar] [CrossRef]
- Hswen, Y.; Xu, X.; Hing, A.; Hawkins, J.B.; Brownstein, J.S.; Gee, G.C. Association of “#covid19” Versus “#chinesevirus” With Anti-Asian Sentiments on Twitter: March 9–23, 2020. Am. J. Public Health 2021, 111, 956–964. [Google Scholar] [CrossRef]
- Yang, C.C.; Tsai, J.Y.; Pan, S. Discrimination and Well-Being Among Asians/Asian Americans During COVID-19: The Role of Social Media. Cyberpsychol. Behav. Soc. Netw. 2020, 23, 865–870. [Google Scholar] [CrossRef] [PubMed]
- Savoia, E.; Piltch-Loeb, R.; Goldberg, B.; Miller-Idriss, C.; Hughes, B.; Montrond, A.; Kayyem, J.; Testa, M.A. Predictors of COVID-19 Vaccine Hesitancy: Socio-Demographics, Co-Morbidity, and Past Experience of Racial Discrimination. Vaccines 2021, 9, 767. [Google Scholar] [CrossRef] [PubMed]
- Ta Park, V.; Dougan, M.; Meyer, O.; Nam, B.; Tzuang, M.; Park, L.; Vuong, Q.; Tsoh, J. Differences in COVID-19 Vaccine Concerns Among Asian Americans and Pacific Islanders: The COMPASS Survey. J. Racial Ethn. Health Disparities 2021, 1–13. [Google Scholar] [CrossRef] [PubMed]
- Ta Park, V.M.; Dougan, M.; Meyer, O.L.; Nam, B.; Tzuang, M.; Park, L.G.; Vuong, Q.; Tsoh, J.Y. Vaccine willingness: Findings from the COVID-19 effects on the mental and physical health of Asian Americans & Pacific Islanders survey study (COMPASS). Prev. Med. Rep. 2021, 23, 101480. [Google Scholar] [CrossRef]
- Chen, A.H.; Youdelman, M.K.; Brooks, J. The legal framework for language access in healthcare settings: Title VI and beyond. J. Gen. Intern. Med. 2007, 22 (Suppl. 2), 362–367. [Google Scholar] [CrossRef] [Green Version]
- Jacobs, E.; Chen, A.H.; Karliner, L.S.; Agger-Gupta, N.; Mutha, S. The need for more research on language barriers in health care: A proposed research agenda. Milbank Q. 2006, 84, 111–133. [Google Scholar] [CrossRef] [Green Version]
- Watson, J.L.; Ryan, L.; Silverberg, N.; Cahan, V.; Bernard, M.A. Obstacles and opportunities in Alzheimer’s clinical trial recruitment. Health Aff. 2014, 33, 574–579. [Google Scholar] [CrossRef] [Green Version]
- Naff, K.C. Subjective vs. objective discrimination in government: Adding to the picture of barriers to the advancement of women. Political Res. Q. 1995, 48, 535–557. [Google Scholar] [CrossRef]
- Lavrakas, P.J. Encyclopedia of Survey Research Methods; Sage Publications: Thousand Oaks, CA, USA, 2008; Volume 1-0. [Google Scholar]
- Chen, J.A.; Zhang, E.; Liu, C.H. Potential Impact of COVID-19-Related Racial Discrimination on the Health of Asian Americans. Am. J. Public Health 2020, 110, 1624–1627. [Google Scholar] [CrossRef] [PubMed]
- The White House Briefing Room. Fact Sheet: President Biden Establishes the White House Initiative on Asian Americans, Native Hawaiians, and Pacific Islanders. Available online: https://www.whitehouse.gov/briefing-room/statements-releases/2021/05/28/fact-sheet-president-biden-establishes-the-white-house-initiative-on-asian-americans-native-hawaiians-and-pacific-islanders/ (accessed on 2 August 2021).
- COVID-19 Hate Crimes Act. 2021. Available online: https://www.congress.gov/bill/117th-congress/senate-bill/937/text (accessed on 20 May 2021).

| N | % | |
|---|---|---|
| Cultural Group | ||
| Asian Indian | 287 | 5.8 |
| Ethnic Chinese 1 | 1685 | 33.9 |
| Filipino | 173 | 3.5 |
| Hmong | 110 | 2.2 |
| Japanese | 220 | 4.4 |
| Korean | 1119 | 22.5 |
| Mixed 2 | 219 | 4.4 |
| NHPI | 116 | 2.3 |
| Other | 28 | 0.6 |
| Other South-East Asian | 36 | 0.6 |
| Other South Asian | 20 | 0.4 |
| Vietnamese | 958 | 19.3 |
| Sex | ||
| Female | 3186 | 64.1 |
| Male | 1744 | 35.1 |
| Other/Decline to State 3 | 41 | 0.8 |
| Sexual Orientation | ||
| Heterosexual | 4533 | 91.2 |
| Not Heterosexual | 224 | 4.5 |
| Decline to State | 214 | 4.3 |
| Age (in years) | 45.2 (16.4) 4; Range: 18–97 | |
| <30 | 1107 | 22.3 |
| 30–39 | 872 | 17.5 |
| 40–49 | 909 | 18.3 |
| 50–59 | 590 | 20.6 |
| >60 | 1057 | 21.3 |
| Nativity | ||
| US-born | 1753 | 35.3 |
| Foreign-born | 3152 | 63.4 |
| Years in U.S. | 25.6 (15.1) 4; Range: 0–82 | |
| Don’t know | 65 | 1.3 |
| Limited English Proficiency (LEP) 5 | ||
| Yes | 1109 | 22.3 |
| No | 3862 | 77.7 |
| Caregiver | ||
| Yes | 1197 | 24.1 |
| No | 3774 | 75.9 |
| Marital Status | ||
| Single | 1380 | 27.8 |
| Married/Living with Partner | 3219 | 64.8 |
| Separated/Divorced/Widowed | 333 | 6.7 |
| Declined | 39 | 0.8 |
| Employment Status | ||
| Full-time | 2313 | 46.5 |
| Part-time | 842 | 16.9 |
| Homemaker | 417 | 8.4 |
| Unemployed | 515 | 10.4 |
| Retired | 559 | 11.3 |
| Other/Decline to state | 325 | 6.5 |
| Education | ||
| High school or less | 779 | 15.9 |
| Some college or technical school | 582 | 11.9 |
| Bachelor’s degree | 1803 | 36.9 |
| Master’s degree or higher | 1724 | 35.3 |
| Annual Household Income ($) | ||
| ≤25,000 | 805 | 16.2 |
| >25,000–75,000 | 1373 | 27.6 |
| >75,000–150,000 | 1248 | 25.1 |
| >150,000 | 970 | 19.5 |
| Decline to state | 575 | 11.6 |
| Census Region | ||
| West | 3219 | 64.8 |
| Midwest | 431 | 8.7 |
| Northeast | 607 | 12.2 |
| South | 713 | 14.3 |
| Self-reported Health Quintiles (range of health score) | 77.9 (15.2) 4; Range: 0–100 | |
| Q1 (0–69) | 823 | 17.5 |
| Q2 (70–78) | 1073 | 22.8 |
| Q3 (79–83) | 934 | 19.9 |
| Q4 (84–89) | 778 | 16.6 |
| Q5 (90–100) | 1092 | 23.2 |
| Length of SIP 6 Order | ||
| No order | 327 | 6.6 |
| <1 month | 270 | 5.5 |
| 1 to <2 months | 563 | 11.4 |
| 2 to <3 months | 570 | 11.5 |
| 3 months or longer | 2783 | 56.2 |
| Do not know | 438 | 8.9 |
| The Severity of COVID-19 Where You Live | ||
| A lot less | 415 | 8.4 |
| Somewhat less | 862 | 17.4 |
| About the same | 1098 | 22.2 |
| Somewhat more | 1475 | 29.8 |
| A lot more | 1098 | 22.2 |
| COVID-19 Effect on Family Income/Employment | ||
| No Change | 2034 | 41.1 |
| Mild | 1520 | 30.7 |
| Moderate | 1236 | 25 |
| Severe | 161 | 3.2 |
| All | Asian Indian (n = 287) | Ethnic Chinese 1 (n = 1685) | Filipino (N = 173) | Hmong (n = 110) | Japanese (n = 220) | Korean (n = 1119) | NHPI 2 (n = 116) | Vietnamese (n = 958) | Other/Mixed (n = 303) | |
|---|---|---|---|---|---|---|---|---|---|---|
| EDS_Overall: Any Discrimination Experience During COVID-19 Due to Being Asian American/Pacific Islander | ||||||||||
| Yes | 3018 (60.7) | 119 (41.5) | 1090 (64.7) | 106 (61.3) | 88 (80.0) | 127 (57.7) | 718 (64.2) | 47 (40.5) | 534 (55.7) | 189 (62.4) |
| No | 1953 (39.3) | 168 (58.5) | 595 (35.3) | 67 (38.7) | 22 (20.0) | 93 (42.3) | 401 (35.8) | 69 (59.5) | 424 (44.3) | 114 (37.6) |
| EDS_1: you been treated with less respect than other people... | ||||||||||
| Yes | 2562 (51.5) | 96 (32.7) | 961 (57.0) | 79 (45.7) | 76 (69.1) | 107 (48.6) | 607 (54.2) | 25 (30.2) | 438 (45.7) | 165 (54.5) |
| No | 2409 (48.5) | 193 (67.3) | 724 (43.0) | 94 (54.3) | 34 (30.9) | 113 (51.4) | 512 (45.8) | 91 (69.8) | 520 (54.3) | 138 (45.5) |
| EDS_2: you been treated unfairly at restaurants or stores... | ||||||||||
| Yes | 1685 (33.9) | 67 (23.3) | 649 (48.5) | 52 (30.1) | 60 (54.5) | 65 (29.5) | 349 (31.2) | 26 (22.4) | 303 (31.6) | 114 (37.6) |
| No | 3286 (66.1) | 220 (76.7) | 1036 (61.5) | 121 (69.9) | 50 (45.5) | 155 (70.5) | 770 (68.8) | 90 (77.6) | 655 (68.4) | 189 (62.4) |
| EDS_3: people criticized your accent or the way you speak... | ||||||||||
| Yes | 1344 (27.0) | 73 (35.4) | 488 (39.0) | 41 (23.7) | 43 (39.1) | 33 (15.0) | 318 (28.4) | 22 (19.0) | 244 (25.5) | 82 (27.1) |
| No | 3627 (73.0) | 214 (74.6) | 1197 (71.0) | 132 (76.3) | 67 (60.9) | 187 (85.0) | 801 (71.6) | 94 (81.0) | 714 (74.5) | 221 (72.9) |
| EDS_4: people acted as if they think you are not smart... | ||||||||||
| Yes | 1278 (25.7) | 60 (20.9) | 486 (28.8) | 43 (24.9) | 58 (57.7) | 34 (15.4) | 257 (23.0) | 31 (26.7) | 234 (24.4) | 75 (24.7) |
| No | 3693 (74.3) | 227 (79.1) | 1199 (71.2) | 130 (75.1) | 52 (42.3) | 186 (84.6) | 862 (77.0) | 85 (73.3) | 724 (75.6) | 228 (75.3) |
| EDS_5: people acted as if they are afraid of you... | ||||||||||
| Yes | 1781 (35.8) | 55 (19.2) | 705 (41.8) | 50 (28.9) | 73 (66.4) | 72 (32.7) | 359 (32.1) | 31 (26.7) | 313 (32.7) | 123 (40.6) |
| No | 3190 (64.2) | 232 (80.8) | 980 (58.2) | 123 (71.1) | 37 (33.6) | 148 (67.3) | 760 (67.9) | 85 (73.3) | 645 (67.3) | 180 (59.4) |
| EDS_6: people acted as if they think you are dishonest... | ||||||||||
| Yes | 1113 (22.4) | 53 (18.5) | 447 (26.5) | 33 (19.1) | 47 (42.7) | 38 (17.3) | 184 (16.4) | 25 (21.5) | 209 (21.8) | 77 (25.4) |
| No | 3858 (77.6) | 234 (81.5) | 1238 (73.5) | 140 (80.9) | 63 (57.3) | 182 (82.7) | 935 (83.6) | 91 (78.5) | 749 (78.2) | 226 (74.6) |
| EDS_7: people acted as if they’re better than you are… | ||||||||||
| Yes | 1878 (37.8) | 84 (29.3) | 699 (41.5) | 75 (43.3) | 69 (62.7) | 75 (34.1) | 409 (36.5) | 34 (29.3) | 309 (32.2) | 124 (40.9) |
| No | 3093 (62.2) | 203 (70.7) | 986 (58.5) | 98 (56.7) | 41 (37.3) | 145 (65.9) | 710 (63.5) | 82 (70.7) | 649 (67.8) | 179 (59.1) |
| EDS_8: you been threatened or harassed… | ||||||||||
| Yes | 1282 (25.8) | 53 (18.5) | 562 (33.3) | 41 (23.7) | 49 (44.5) | 50 (22.7) | 231 (20.6) | 18 (15.5) | 195 (20.3) | 83 (27.4) |
| No | 3689 (74.2) | 234 (81.5) | 1123 (66.7) | 132 (76.3) | 61 (55.5) | 170 (77.3) | 888 (79.4) | 98 (84.5) | 763 (79.7) | 220 (72.6) |
| Variables | Experience of Discrimination | |||
|---|---|---|---|---|
| Yes N = 3018 (%) | No N = 1953 (%) | Crude OR (95% CI) | Adjusted OR (95% CI) | |
| Cultural Group | ||||
| Asian Indian | 119 (41.5) | 168 (58.5) | Reference | Reference |
| Ethnic Chinese 1 | 1090 (64.7) | 595 (35.3) | 2.59 (2.00–3.34) | 2.38 (1.79–3.17) |
| Filipino | 106 (61.3) | 67 (38.7) | 2.23 (1.52–3.29) | 1.81 (1.18–2.78) |
| Hmong | 88 (80.0) | 22 (20.0) | 5.65 (3.35–9.53) | 2.09 (1.10–3.97) |
| Japanese | 127 (57.7) | 93 (42.3) | 1.93 (1.35–2.75) | 2.21 (1.49–3.28) |
| Korean | 718 (64.2) | 401 (35.8) | 2.53 (1.94–3.29) | 2.04 (1.50–2.78) |
| NHPI 2 | 47 (40.5) | 69 (59.5) | 0.96 (0.62–1.49) | 1.06 (0.64–1.76) |
| Vietnamese | 534 (55.7) | 424 (44.3) | 1.78 (1.36–2.32) | 1.61 (1.18–2.20) |
| Other/Mixed | 189 (62.4) | 114 (37.6) | 2.34 (1.68–3.26) | 1.78 (1.23–2.57) |
| Sex | ||||
| Female | 1976 (62.0) | 1210 (38.0) | 1.17 (1.04–1.32) | 1.24 (1.08–1.43) |
| Male | 1015 (58.2) | 729 (41.8) | Reference | Reference |
| Other/Decline to State | 27 (65.9) | 14 (34.1) | 1.39 (0.72–2.66) | 1.16 (0.48–2.85) |
| Sexual Orientation | ||||
| Heterosexual | 2716 (59.9) | 1817 (40.1) | Reference | Reference |
| Not Heterosexual | 166 (74.1) | 78 (25.9) | 1.91 (1.41–2.60) | 1.70 (1.21–2.39) |
| Decline to State | 136 (63.6) | 78 (36.4) | 1.17 (0.88–1.55) | 1.45 (1.02–2.06) |
| Age (in years) | ||||
| <30 | 773 (69.8) | 334 (30.2) | 2.48 (2.08–2.96) | 1.93 (1.46–2.56) |
| 30–39 | 579 (66.4) | 293 (33.6) | 2.12 (1.76–2.55) | 1.60 (1.23–2.06) |
| 40–49 | 566 (62.3) | 343 (37.7) | 1.77 (1.48–2.12) | 1.36 (1.07–1.74) |
| 50–59 | 590 (57.5) | 436 (42.5) | 1.45 (1.22–1.73) | 1.22 (0.97–1.53) |
| >60 | 510 (48.2) | 547 (51.8) | Reference | Reference |
| Nativity | ||||
| US-born | 1104 (63.0) | 649 (37.0) | 1.16 (1.03–1.31) | NA |
| Foreign-born | 1876 (59.5) | 1276 (40.5) | Reference | |
| LEP 3 | ||||
| Yes | 626 (56.6) | 483 (43.5) | Reference | Reference |
| No | 2392 (61.9) | 1470 (38.1) | 1.25 (1.10–1.43) | 1.21 (1.00–1.47) |
| Caring | ||||
| Yes | 736 (61.5) | 461 (38.5) | 1.04 (0.91–1.19) | NA |
| No | 2282 (60.5) | 1492 (39.5) | Reference | |
| Marital Status | ||||
| Single | 907 (65.7) | 473 (34.3) | 1.32 (1.16–1.51) | 0.89 (0.74–1.08) |
| Married/Living with Partner | 1907 (59.3) | 1312 (40.8) | Reference | Reference |
| Separated/Divorced/Widowed | 178 (53.5) | 155 (46.5) | 0.79 (0.63–0.99) | 1.06 (0.82–1.38) |
| Declined | 26 (66.7) | 13 (33.3) | 1.04 (0.53–2.05) | 1.16 (0.47–2.85) |
| Employment Status | ||||
| Full-time | 1451 (62.7) | 862 (37.3) | 2.04 (1.69–2.45) | 1.27 (0.97–1.66) |
| Part-time | 533 (63.3) | 309 (36.7) | 2.09 (1.68–2.59) | 1.15 (0.87–1.52) |
| Homemaker | 253 (60.7) | 164 (39.3) | 1.87 (1.44–2.41) | 1.17 (0.84–1.63) |
| Unemployed | 328 (63.7) | 187 (36.3) | 2.12 (1.66–2.71) | 1.10 (0.79–1.51) |
| Retired | 253 (45.3) | 306 (54.7) | Reference | Reference |
| Other/Decline to state | 200 (61.5) | 125 (38.5) | 0.95 (0.75–1.21) | 0.93 (0.65–1.34) |
| Education | ||||
| High school or less | 436 (56.0) | 343 (44.0) | Reference | Reference |
| Some college/technical school | 380 (65.3) | 202 (34.7) | 1.48 (1.19–1.85) | 1.16 (0.90–1.49) |
| Bachelor’s degree | 1090 (60.5) | 713 (39.5) | 1.20 (1.02–1.43) | 0.95 (0.77–1.17) |
| Master’s degree or higher | 1064 (61.7) | 660 (38.3) | 1.27 (1.07–1.51) | 1.19 (0.94–1.50) |
| Annual Household Income ($) | ||||
| ≤25,000 | 451 (56.0) | 354 (44.0) | Reference | N/A |
| >25,000–75,000 | 881 (64.2) | 492 (35.8) | 1.41 (1.18–1.68) | |
| >75,000–150,000 | 823 (66.0) | 425 (34.0) | 1.52 (1.27–1.82) | |
| >150,000 | 548 (56.5) | 422 (43.5) | 1.02 (0.94–1.23) | |
| Decline to state | 315 (54.8) | 260 (45.2) | 0.95 (0.77–1.18) | |
| Census Region | ||||
| West | 1825 (56.7) | 1394 (43.3) | Reference | Reference |
| Midwest | 328 (76.1) | 103 (23.9) | 2.43 (1.93–3.07) | 2.14 (1.60–2.86) |
| Northeast | 387 (63.8) | 220 (36.2) | 1.34 (1.12–1.61) | 1.32 (1.07–1.63) |
| South | 478 (67.0) | 235 (33.0) | 1.55 (1.31–1.84) | 1.55 (1.27–1.89) |
| Self-reported Health Quintiles | ||||
| Q1 (lowest) | 568 (69.0) | 255 (31.0) | 2.13 (1.76–2.58) | 2.02 (1.64–2.47) |
| Q2 | 692 (64.5) | 381 (35.5) | 1.74 (1.46–2.07) | 1.59 (1.32–1.92) |
| Q3 | 570 (61.0) | 364 (39.0) | 1.50 (1.26–1.79) | 1.43 (1.18–1.72) |
| Q4 | 466 (59.9) | 312 (40.1) | 1.43 (1.19–1.72) | 1.38 (1.13–1.69) |
| Q5 (highest) | 558 (51.1) | 534 (48.9) | Reference | Reference |
| Length of SIP 4 Order | ||||
| No order | 166 (50.8) | 161 (49.2) | Reference | Reference |
| <1 month | 161 (59.6) | 109 (40.4) | 1.59 (1.21–2.10) | 1.20 (0.84–1.73) |
| 1 to <2 months | 350 (62.2) | 213 (37.8) | 2.24 (1.69–2.97) | 1.43 (1.04–1.96) |
| 2 to <3 months | 398 (69.8) | 172 (30.2) | 1.44 (1.15–1.82) | 1.85 (1.34–2.57) |
| 3 months or longer | 1665 (59.8) | 1118 (40.2) | 1.43 (1.03–1.98) | 1.43 (1.09–1.89) |
| Do not know | 268 (61.2) | 170 (38.8) | 1.53 (1.14–2.04) | 1.30 (0.93–1.82) |
| The severity of COVID-19 where you live | ||||
| A lot less | 199 (47.9) | 216 (52.1) | Reference | Reference |
| Somewhat less | 487 (56.5) | 375 (43.5) | 1.41 (1.11–1.78) | 1.15 (0.89–1.50) |
| About the same | 701 (63.8) | 397 (36.2) | 1.92 (1.53–2.41) | 1.52 (1.18–1.97) |
| Somewhat more | 942 (63.9) | 533 (36.1) | 1.92 (1.54–2.39) | 1.52 (1.18–1.94) |
| A lot more | 676 (61.6) | 422 (38.4) | 1.74 (1.39–2.18) | 1.37 (1.06–1.77) |
| COVID-19 Effect on Family Income/Employment | ||||
| No Change | 1078 (53.0) | 956 (47.0) | Reference | Reference |
| Mild | 970 (63.8) | 550 (36.2) | 1.56 (1.37–1.79) | 1.46 (1.25–1.69) |
| Moderate | 838 (67.8) | 398 (32.2) | 1.87 (1.61–2.16) | 1.95 (1.64–2.32) |
| Severe | 123 (76.4) | 38 (23.6) | 2.87 (1.98–4.17) | 3.19 (2.10–4.85) |
Publisher’s Note: MDPI stays neutral with regard to jurisdictional claims in published maps and institutional affiliations. |
© 2022 by the authors. Licensee MDPI, Basel, Switzerland. This article is an open access article distributed under the terms and conditions of the Creative Commons Attribution (CC BY) license (https://creativecommons.org/licenses/by/4.0/).
Share and Cite
Ta Park, V.M.; Dougan, M.M.; Meyer, O.L.; Nam, B.; Tzuang, M.; Park, L.G.; Vuong, Q.; Bang, J.; Tsoh, J.Y. Discrimination Experiences during COVID-19 among a National, Multi-Lingual, Community-Based Sample of Asian Americans and Pacific Islanders: COMPASS Findings. Int. J. Environ. Res. Public Health 2022, 19, 924. https://doi.org/10.3390/ijerph19020924
Ta Park VM, Dougan MM, Meyer OL, Nam B, Tzuang M, Park LG, Vuong Q, Bang J, Tsoh JY. Discrimination Experiences during COVID-19 among a National, Multi-Lingual, Community-Based Sample of Asian Americans and Pacific Islanders: COMPASS Findings. International Journal of Environmental Research and Public Health. 2022; 19(2):924. https://doi.org/10.3390/ijerph19020924
Chicago/Turabian StyleTa Park, Van M., Marcelle M. Dougan, Oanh L. Meyer, Bora Nam, Marian Tzuang, Linda G. Park, Quyen Vuong, Joon Bang, and Janice Y. Tsoh. 2022. "Discrimination Experiences during COVID-19 among a National, Multi-Lingual, Community-Based Sample of Asian Americans and Pacific Islanders: COMPASS Findings" International Journal of Environmental Research and Public Health 19, no. 2: 924. https://doi.org/10.3390/ijerph19020924
APA StyleTa Park, V. M., Dougan, M. M., Meyer, O. L., Nam, B., Tzuang, M., Park, L. G., Vuong, Q., Bang, J., & Tsoh, J. Y. (2022). Discrimination Experiences during COVID-19 among a National, Multi-Lingual, Community-Based Sample of Asian Americans and Pacific Islanders: COMPASS Findings. International Journal of Environmental Research and Public Health, 19(2), 924. https://doi.org/10.3390/ijerph19020924