

Muscle Quality and Functional and Conventional Ratios of Trunk Strength in Young Healthy Subjects: A Pilot Study

 ,
,  ,
,  ,
, 

Abstract
:1. Introduction
2. Materials and Methods
2.1. Participants
2.2. Anthropometrics Measurements
2.3. Procedures
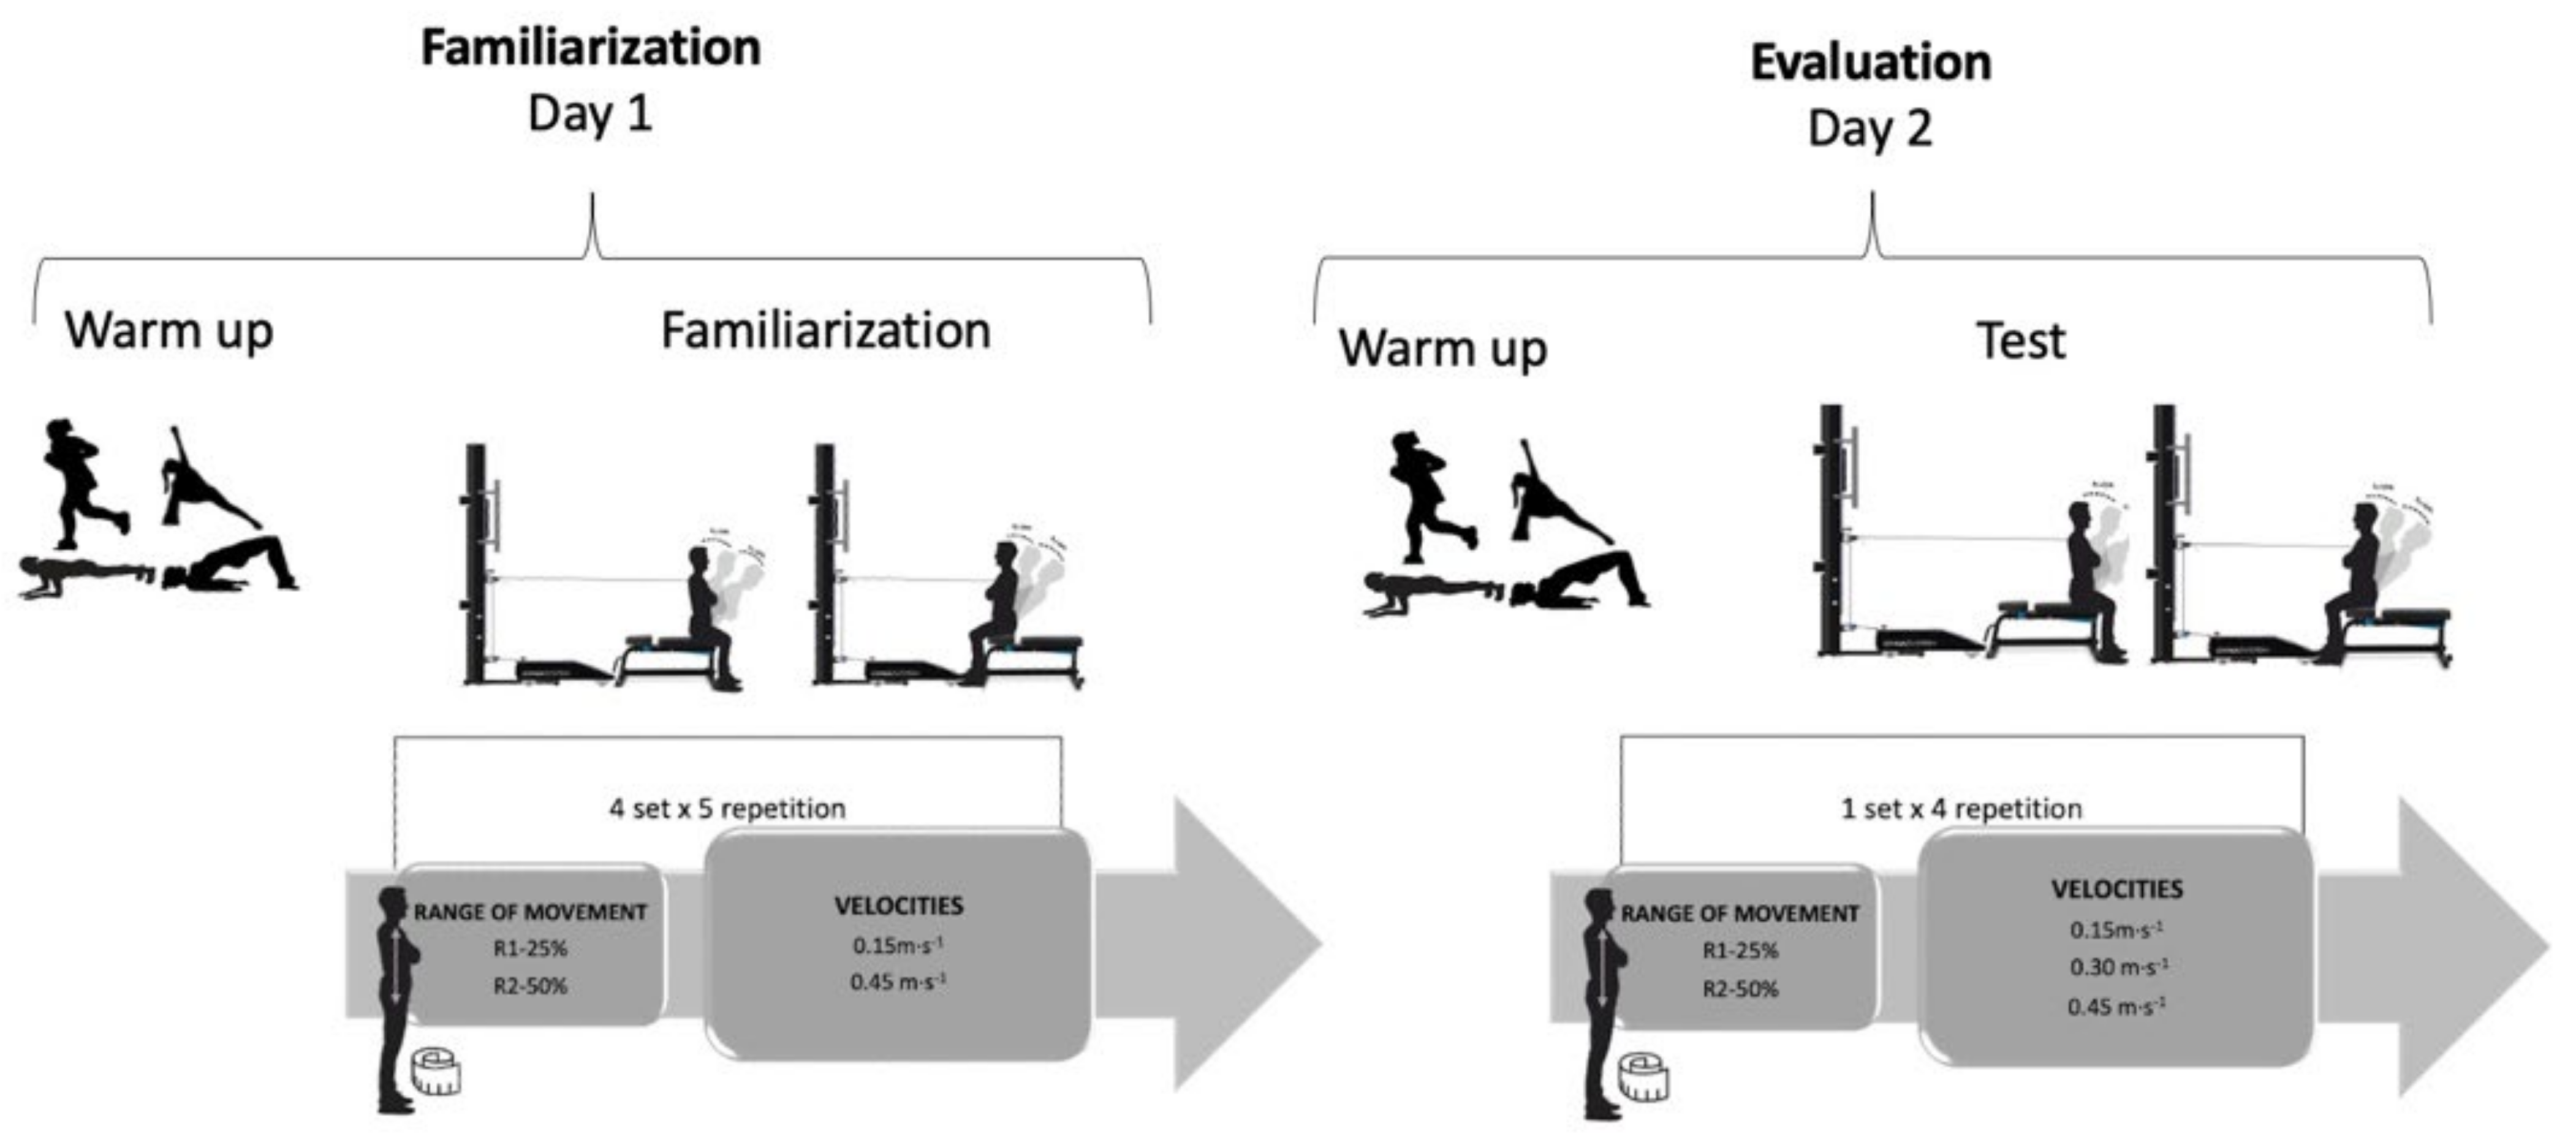
2.4. Test Protocol
2.5. Muscle Quality and Trunk Ratios Strength
2.6. Statistical Analysis
3. Results
4. Discussion
5. Conclusions
Author Contributions
Funding
Institutional Review Board Statement
Informed Consent Statement
Data Availability Statement
Acknowledgments
Conflicts of Interest
References
- Oxland, T.R. Fundamental biomechanics of the spine-What we have learned in the past 25 years and future directions. J. Biomech. 2016, 49, 817–832. [Google Scholar] [CrossRef]
- Borghuis, J.; Hof, A.L.; Lemmink, K.A.P.M. The Importance of Sensory-Motor Control in Providing Core Stability. Sports Med. 2008, 38, 893–916. [Google Scholar] [CrossRef]
- Reeves, N.P.; Cholewicki, J.; Milner, T.; Lee, A.S. Trunk antagonist co-activation is associated with impaired neuromuscular performance. Exp. Brain Res. 2008, 188, 457–463. [Google Scholar] [CrossRef] [Green Version]
- Latash, M.L. Muscle coactivation: Definitions, mechanisms, and functions. J. Neurophysiol. 2018, 120, 88–104. [Google Scholar] [CrossRef]
- Ruas, C.V.; Pinto, R.S.; Haff, G.G.; Lima, C.D.; Pinto, M.D.; Brown, L.E. Alternative Methods of Determining Hamstrings-to-Quadriceps Ratios: A Comprehensive Review. Sport. Med.–Open 2019, 5, 11. [Google Scholar] [CrossRef]
- Ruas, C.V.; Minozzo, F.; Pinto, M.D.; Brown, L.E.; Pinto, R.S. Lower-extremity strength ratios of professional soccer players according to field position. J. Strength Cond. Res. 2015, 29, 1220–1226. [Google Scholar] [CrossRef]
- Stickley, C.D.; Hetzler, R.K.; Freemyer, B.G.; Kimura, I.F. Isokinetic Peak Torque Ratios and Shoulder Injury History in Adolescent Female Volleyball Athletes. J. Athl. Train. 2008, 43, 571–577. [Google Scholar] [CrossRef] [Green Version]
- Duarte, J.P.; Valente-Dos-Santos, J.; Coelho-E-Silva, M.J.; Couto, P.; Costa, D.; Martinho, D.; Seabra, A.; Cyrino, E.; Conde, J.; Rosado, J.; et al. Reproducibility of isokinetic strength assessment of knee muscle actions in adult athletes: Torques and antagonist-agonist ratios derived at the same angle position. PLoS ONE 2018, 13, e0202261. [Google Scholar] [CrossRef] [Green Version]
- Mueller, S.; Stoll, J.; Mueller, J.; Mayer, F. Validity of isokinetic trunk measurements with respect to healthy adults, athletes and low back pain patients. Isokinet. Exerc. Sci. 2012, 20, 255–266. [Google Scholar] [CrossRef]
- Dvir, Z. Isokinetics: Muscle Testing, Interpretation, and Clinical Applications; Elsevier Health Sciences: Amsterdam, The Netherlands, 2004. [Google Scholar]
- Bliven, K.C.H.; Anderson, B.E. Core Stability Training for Injury Prevention. Sport Health Multidiscip. Approach 2013, 5, 514–522. [Google Scholar] [CrossRef] [PubMed]
- Barbado, D.; Barbado, L.C.; Elvira, J.L.L.; Dieën, J.H.; Vera-Garcia, F.J. Sports-related testing protocols are required to reveal trunk stability adaptations in high-level athletes. Gait Posture 2016, 49, 90–96. [Google Scholar] [CrossRef] [Green Version]
- Cozette, M.; Leprêtre, P.-M.; Doyle, C.; Weissland, T. Isokinetic Strength Ratios: Conventional Methods, Current Limits and Perspectives. Front. Physiol. 2019, 10, 1–4. [Google Scholar] [CrossRef]
- Shirado, O.; Ito, T.; Kaneda, K.; Strax, T.E. Concentric and eccentric strength of trunk muscles: Influence of test postures on strength and characteristics of patients with chronic low-back pain. Arch. Phys. Med. Rehabil. 1995, 76, 604–611. [Google Scholar] [CrossRef]
- Ramond-Roquin, A.; Bodin, J.; Serazin, C.; Parot-Schinkel, E.; Ha, C.; Richard, I.; Le Manach, A.P.; Fouquet, N.; Roquelaure, Y. Biomechanical constraints remain major risk factors for low back pain. Results from a prospective cohort study in French male employees. Spine J. 2015, 15, 559–569. [Google Scholar] [CrossRef] [Green Version]
- Ebenbichler, G.R.; Oddsson, L.I.E.; Kollmitzer, J.; Erim, Z. Sensory-motor control of the lower back: Implications for rehabilitation. Med. Sci. Sport. Exerc. 2001, 33, 1889–1898. [Google Scholar] [CrossRef] [PubMed]
- Jaric, S. Muscle strength testing: Use of normalisation for body size. Sports Med. 2002, 32, 615–631. [Google Scholar] [CrossRef]
- Barbat-Artigas, S.; Rolland, Y.; Zamboni, M.; Aubertin-Leheudre, M. How to assess functional status: A new muscle quality index. J. Nutr. Health Aging 2012, 16, 67–77. [Google Scholar] [CrossRef] [PubMed]
- Spudić, D.; Vodičar, J.; Vodičar, M.; Hadžić, V. Isometric Trunk Strength Assessment of Athletes: Effects of Sex, Sport, and Low Back Pain History. J. Sport Rehabil. 2022, 31, 38–46. [Google Scholar] [CrossRef] [PubMed]
- Okada, T.; Hakkaku, T.; Iwai, K.; Nakazato, K. Weight Category-dependent Trunk Muscle Strength and its Relation with LBP in Elite Judokas. Sports Med. Int. Open 2020, 5, E14–E21. [Google Scholar] [CrossRef]
- Zouita, A.B.M.; Ben Salah, F.Z.; Dziri, C.; Beardsley, C. Comparison of isokinetic trunk flexion and extension torques and powers between athletes and nonathletes. J. Exerc. Rehabil. 2018, 14, 72–77. [Google Scholar] [CrossRef] [PubMed]
- Lees, M.J.; Wilson, O.J.; Hind, K.; Ispoglou, T. Muscle quality as a complementary prognostic tool in conjunction with sarcopenia assessment in younger and older individuals. Eur. J. Appl. Physiol. 2019, 119, 1171–1181. [Google Scholar] [CrossRef] [PubMed]
- Stewart, A.; Marfell-Jones, M.; Olds, T.; De Ridder, H. International Society for Advancement of Kinanthropometry. Int. Stand. Anthr. Assess. Int. Soc. Adv. Kinanthropometry 2011, 50, 115. [Google Scholar]
- Kerr, D.A. An Anthropometric Method for Fractionation of Skin, Adipose, Bone, Muscle and Residual Tissue Masses in Males and Females Age 6 to 77 Years. Master’s Thesis, Simon Fraser University, Burnaby, BC, Canada, 1988. [Google Scholar]
- Rodriguez-Perea, A.; Ríos, L.J.C.; Martínez-García, D.; Ulloa-Díaz, D.; Guede-Rojas, F.; Jerez-Mayorga, D.; Rios, I.J.C. Reliability of isometric and isokinetic trunk flexor strength using a functional electromechanical dynamometer. PeerJ 2019, 7, e7883. [Google Scholar] [CrossRef] [PubMed]
- Reyes-Ferrada, W.; Barboza-Gonzalez, P.; Jerez-Mayorga, D.; Chirosa-Ríos, L.; Chirosa-Ríos, I.; Martínez-García, D.; Ulloa-Díaz, D.; RodríGuez-Perea, A. A New Reliable Device to Assess Trunk Extensors Strength. Acta Bioeng. Biomech. 2022; in press. [Google Scholar] [CrossRef]
- Rodriguez-Perea, Á.; Jerez-Mayorga, D.; García-Ramos, A.; Martínez-García, D.; Ríos, L.J.C. Reliability and concurrent validity of a functional electromechanical dynamometer device for the assessment of movement velocity. Proc. Inst. Mech. Eng. Part P J. Sports Eng. Technol. 2021, 235, 176–181. [Google Scholar] [CrossRef]
- Hopkins, W.G.; Marshall, S.W.; Batterham, A.M.; Hanin, J. Progressive Statistics for Studies in Sports Medicine and Exercise Science. Med. Sci. Sports Exerc. 2009, 41, 3–13. [Google Scholar] [CrossRef] [Green Version]
- Cohen, J. Statistical Power Analysis for the Behavioral Sciences; Lawrence Erlbaum Associates: Hillsdale, NJ, USA, 1988; pp. 20–26. [Google Scholar]
- Dervišević, E.; Hadžić, V.; Burger, H. Reproducibility of trunk isokinetic strength findings in healthy individuals. Isokinet. Exerc. Sci. 2007, 15, 99–109. [Google Scholar] [CrossRef]
- Zouita, A.B.M.; Zouita, S.; Dziri, C.; Brughelli, M.; Behm, D.G.; Chaouachi, A. Differences in Trunk Strength Between Weightlifters and Wrestlers. J. Hum. Kinet. 2019, 67, 5–15. [Google Scholar] [CrossRef] [Green Version]
- Guilhem, G.; Giroux, C.; Couturier, A.; Maffiuletti, N.A. Validity of trunk extensor and flexor torque measurements using isokinetic dynamometry. J. Electromyogr. Kinesiol. 2014, 24, 986–993. [Google Scholar] [CrossRef]
- Müller, J.; Müller, S.; Stoll, J.; Fröhlich, K.; Baur, H.; Mayer, F. Reproducibility of maximum isokinetic trunk strength testing in healthy adolescent athletes. Sports Orthop. Traumatol. 2014, 30, 229–237. [Google Scholar] [CrossRef]


| Peak Strength (n = 27) | Mean Strength (n = 27) | ||||||
|---|---|---|---|---|---|---|---|
| Strength (kg) | Normalized by Weight | Normalized by Muscular Mass | Strength (kg) | Normalized by Weight | Normalized by Muscular Mass | ||
| Extensors | Concentric | ||||||
| 0.15 m·s−1 (V1) | 95.91 ± 19.70 | 1.37 ± 0.26 | 2.97 ± 0.64 | 63.38 ± 15.61 | 0.91 ± 0.22 | 1.96 ± 0.51 | |
| 0.30 m·s−1 (V2) | 95.87 ± 20.57 | 1.37 ± 0.28 | 2.98 ± 0.69 | 62.41 ± 16.94 | 0.89 ± 0.23 | 1.94 ± 0.55 | |
| 0.45 m·s−1 (V3) | 101.34 ± 21.66 | 1.45 ± 0.32 | 3.16 ± 0.78 | 60.25 ± 16.39 | 0.86 ± 0.24 | 1.88 ± 0.55 | |
| Eccentric | |||||||
| 0.15 m·s−1 (V1) | 136.30 ± 27.19 | 1.95 ± 0.36 | 4.23 ± 0.91 | 112.41 ± 24.25 | 1.61 ± 0.33 | 3.49 ± 0.80 | |
| 0.30 m·s−1 (V2) | 141.23 ± 25.35 | 2.02 ± 0.34 | 4.38 ± 0.84 | 114.03 ± 24.10 | 1.63 ± 0.31 | 3.53 ± 0.76 | |
| 0.45 m·s−1 (V3) | 149.26 ± 24.78 | 2.14 ± 0.37 | 4.64 ± 0.91 | 116.06 ± 25.19 | 1.66 ± 0.37 | 3.61 ± 0.88 | |
| Isometric | 93.73 ± 21.86 | 1.34 ± 0.29 | 2.90 ± 0.68 | 76.03 ± 20.37 | 1.09 ± 0.27 | 2.35 ± 0.62 | |
| Flexors | Concentric | ||||||
| 0.15 m·s−1 (V1) | 39.40 ± 5.45 | 0.56 ± 0.84 | 1.22 ± 0.20 | 25.34 ± 4.40 | 0.36 ± 0.06 | 0.78 ± 0.13 | |
| 0.30 m·s−1 (V2) | 40.31 ± 6.45 | 0.58 ± 0.09 | 1.25 ± 0.22 | 24.64 ± 4.89 | 0.35 ± 0.06 | 0.76 ± 0.14 | |
| 0.45 m·s−1 (V3) | 43.25 ± 7.49 | 0.62 ± 0.11 | 1.34 ± 0.27 | 24.19 ± 4.68 | 0.34 ± 0.06 | 0.74 ± 0.13 | |
| Eccentric | |||||||
| 0.15 m·s−1 (V1) | 57.74 ± 7.49 | 0.83 ± 0.89 | 1.79 ± 0.23 | 46.93 ± 6.98 | 0.67 ± 0.09 | 1.45 ± 0.22 | |
| 0.30 m·s−1 (V2) | 62.81 ± 8.48 | 0.90 ± 0.11 | 1.95 ± 0.26 | 49.21 ± 7.52 | 0.70 ± 0.09 | 1.52 ± 0.20 | |
| 0.45 m·s−1 (V3) | 70.27 ± 9.51 | 1.01 ± 0.14 | 2.18 ± 0.35 | 51.95 ± 8.35 | 0.74 ± 0.10 | 1.61 ± 0.25 | |
| Isometric | 37.00 ± 5.69 | 0.53 ± 0.06 | 1.14 ± 0.15 | 30.47 ± 5.64 | 0.43 ± 0.06 | 0.94 ± 0.13 | |
| Ratio | V1 Mean (SD) (n = 27) | V2 Mean (SD) (n = 27) | V3 Mean (SD) (n = 27) | ISO Mean (SD) (n = 27) | Repeated Measures ANOVA |
|---|---|---|---|---|---|
| CR—Peak | 0.42 (0.09) | 0.44 (0.10) | 0.44 (0.09) | 0.41 (0.10) | F (2,60) = 1.94, p = 0.145 ω2 = 0.006 |
| FFR—Peak | 0.62 (0.12) | 0.68 (0.15) | 0.72 (0.16) | 0.41 (0.09) | F (2,59) = 121.16, p = 0.001 ω2 = 0.436 |
| FER—Peak | 3.49 (0.71) | 3.55 (0.66) | 3.51 (0.66) | 2.55 (0.55) | F (2,60) = 52.59, p = 0.001, ω2 = 0.292 |
| CR—Mean | 0.42 (0.12) | 0.42 (0.11) | 0.43 (0.13) | 0.42 (0.11) | F (2,54) = 0.19, p = 0.832 ω2 = 0.000 |
| FFR—Mean | 0.78 (0.21) | 0.83 (0.21) | 0.92 (0.27) | 0.42 (0.11) | F (2,64) = 92.21, p = 0.001, ω2 = 0.447 |
| FER—Mean | 4.51 (1.03) | 4.73 (1.09) | 4.92 (1.26) | 2.53 (0.65) | F (2,53) = 103.34, p = 0.001, ω2 = 0.461 |
Publisher’s Note: MDPI stays neutral with regard to jurisdictional claims in published maps and institutional affiliations. |
© 2022 by the authors. Licensee MDPI, Basel, Switzerland. This article is an open access article distributed under the terms and conditions of the Creative Commons Attribution (CC BY) license (https://creativecommons.org/licenses/by/4.0/).
Share and Cite
Reyes-Ferrada, W.; Rodríguez-Perea, Á.; Chirosa-Ríos, L.; Martínez-García, D.; Jerez-Mayorga, D. Muscle Quality and Functional and Conventional Ratios of Trunk Strength in Young Healthy Subjects: A Pilot Study. Int. J. Environ. Res. Public Health 2022, 19, 12673. https://doi.org/10.3390/ijerph191912673
Reyes-Ferrada W, Rodríguez-Perea Á, Chirosa-Ríos L, Martínez-García D, Jerez-Mayorga D. Muscle Quality and Functional and Conventional Ratios of Trunk Strength in Young Healthy Subjects: A Pilot Study. International Journal of Environmental Research and Public Health. 2022; 19(19):12673. https://doi.org/10.3390/ijerph191912673
Chicago/Turabian StyleReyes-Ferrada, Waleska, Ángela Rodríguez-Perea, Luis Chirosa-Ríos, Darío Martínez-García, and Daniel Jerez-Mayorga. 2022. "Muscle Quality and Functional and Conventional Ratios of Trunk Strength in Young Healthy Subjects: A Pilot Study" International Journal of Environmental Research and Public Health 19, no. 19: 12673. https://doi.org/10.3390/ijerph191912673
APA StyleReyes-Ferrada, W., Rodríguez-Perea, Á., Chirosa-Ríos, L., Martínez-García, D., & Jerez-Mayorga, D. (2022). Muscle Quality and Functional and Conventional Ratios of Trunk Strength in Young Healthy Subjects: A Pilot Study. International Journal of Environmental Research and Public Health, 19(19), 12673. https://doi.org/10.3390/ijerph191912673