
Deaths of Despair: A Scoping Review on the Social Determinants of Drug Overdose, Alcohol-Related Liver Disease and Suicide


 ,
,
Abstract
1. Introduction
“[DoD] come from a long-standing process of cumulative disadvantage for those with less than a college degree. The story is rooted in the labor market, but involves many aspects of life…Although we do not see the supply of opioids as the fundamental factor, the prescription of opioids for chronic pain added fuel to the flames, making the epidemic much worse than it otherwise would have been…Controlling opioids is an obvious priority, as is trying to counter the longer term negative effects of a poor labor market on marriage and child rearing, perhaps through a better safety net….” [6].
2. Materials and Methods
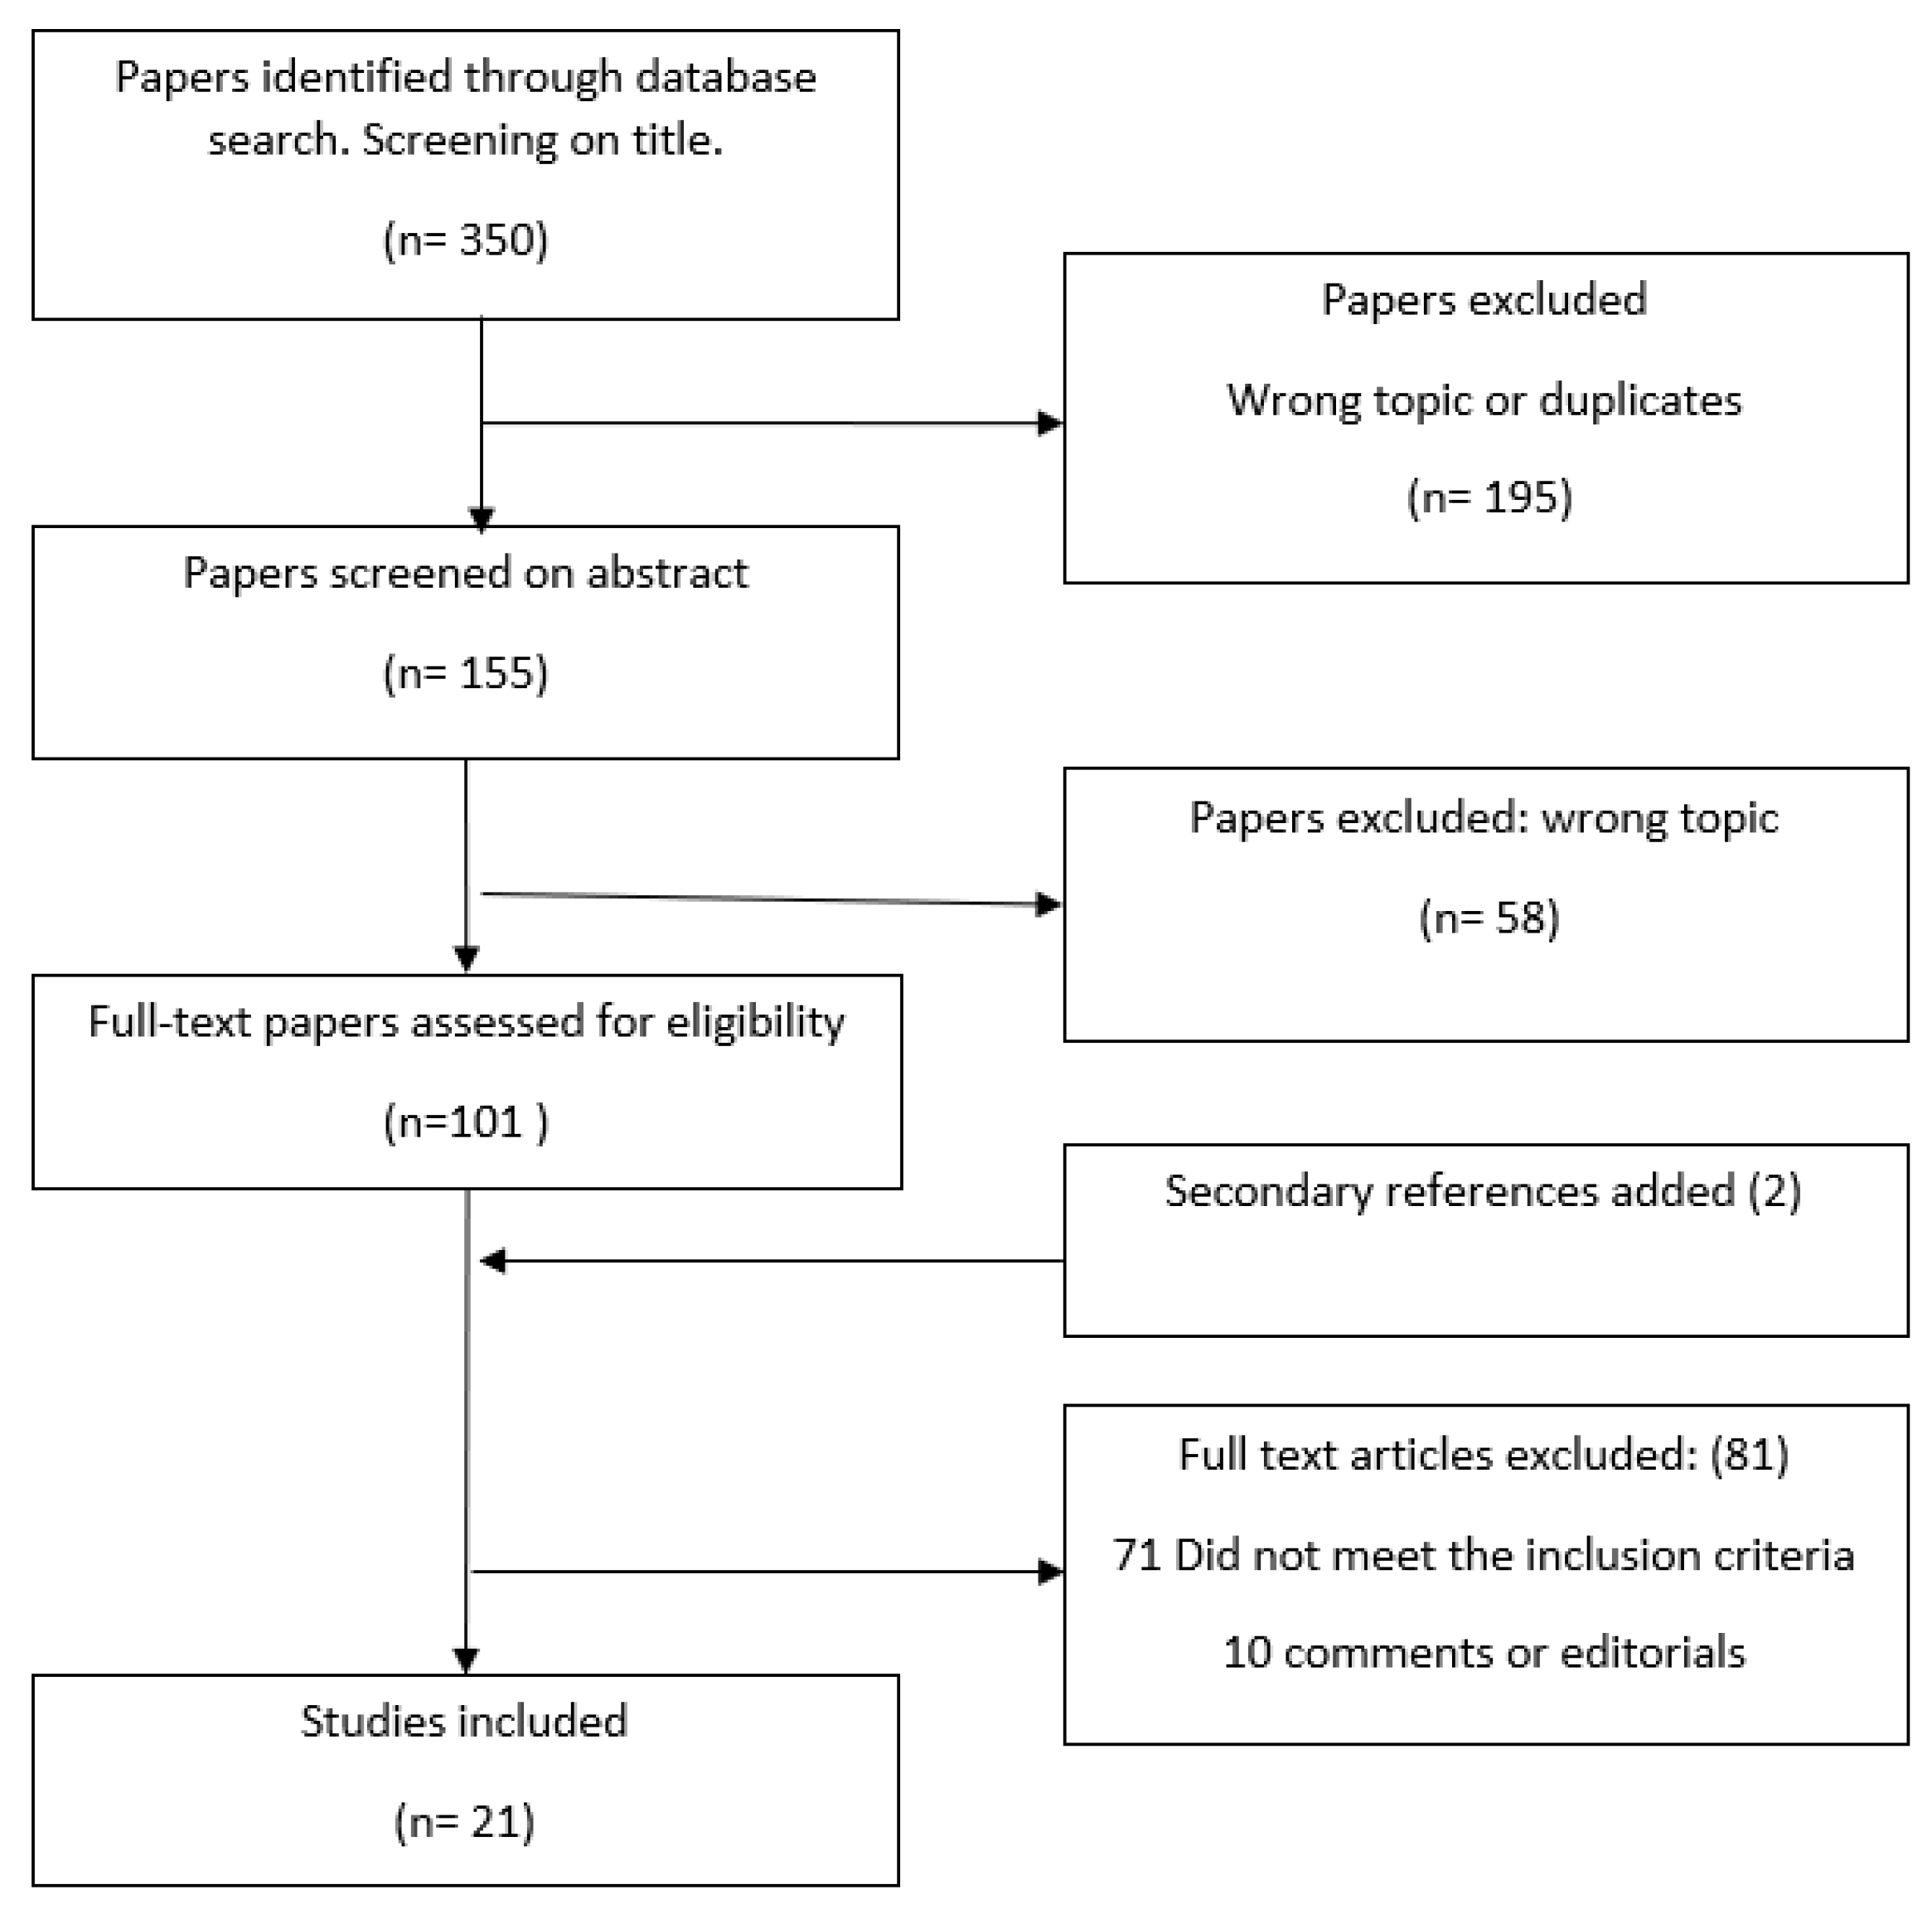
2.1. Search Strategy
2.2. Inclusion and Exclusion Criteria
2.3. Data Extraction
2.4. Definitions
3. Results
3.1. Economic Conditions
3.2. Occupational Hazards
3.3. Education Level
3.4. Geographical Settings
3.5. Ethnicity/Race
4. Discussion
5. Conclusions
Author Contributions
Funding
Institutional Review Board Statement
Informed Consent Statement
Data Availability Statement
Acknowledgments
Conflicts of Interest
References
- Rogers, R.G.; Hummer, R.A.; Vinneau, J.M.; Lawrence, E.M. Greater mortality variability in the United States in comparison with peer countries. Demogr. Res. 2020, 42, 1039–1956. [Google Scholar] [CrossRef] [PubMed]
- Faust, J.S.; Du, C.; Mayes, K.D.; Li, S.-X.; Lin, Z.; Barnett, M.L.; Krumholz, H.M. Mortality From Drug Overdoses, Homicides, Unintentional Injuries, Motor Vehicle Crashes, and Suicides During the Pandemic, March–August 2020. JAMA 2021, 326, 84–86. [Google Scholar] [CrossRef] [PubMed]
- Case, A.; Deaton, A. Rising morbidity and mortality in midlife among white non-Hispanic Americans in the 21st century. Proc. Natl. Acad. Sci. USA 2015, 112, 15078–15083. [Google Scholar] [CrossRef] [PubMed]
- National Institute of Drug Abuse. Opioid Overdose Crisis. National Institute of Drug Abuse Website. Available online: drugabuse.gov/drug-topics/opioids/opioid-overdose-crisis (accessed on 15 June 2021).
- Singh, G.K.; Kim, I.E.; Girmay, M.; Perry, C.; Daus, G.P.; Vedamuthu, I.P.; De Los Reyes, A.A.; Ramey, C.T.; Martin, E.K.; Allender, M. Opioid Epidemic in the United States: Empirical Trends, and A Literature Review of Social Determinants and Epidemiological, Pain Management, and Treatment Patterns. Int. J. MCH AIDS 2019, 8, 89–100. [Google Scholar] [CrossRef]
- Case, A.; Deaton, A. Mortality and morbidity in the 21st century. Brook. Pap. Econ. Act. 2017, 2017, 397–476. [Google Scholar] [CrossRef] [PubMed]
- Krieger, N. A glossary for social epidemiology. J. Epidemiol. Community Health 2001, 55, 693–700. [Google Scholar] [CrossRef]
- Brignone, E.; George, D.R.; Sinoway, L.; Katz, C.; Sauder, C.; Murray, A.; Gladden, R.; Kraschnewski, J.L. Trends in the diagnosis of diseases of despair in the United States, 2009-2018: A retrospective cohort study. BMJ Open 2020, 10, e037679. [Google Scholar] [CrossRef]
- Shanahan, L.; Hill, S.N.; Gaydosh, L.M.; Steinhoff, A.; Costello, E.J.; Dodge, K.A.; Harris, K.M.; Copeland, W.E. Does Despair Really Kill? A Roadmap for an Evidence-Based Answer. Am. J. Public Health 2019, 109, 854–858. [Google Scholar] [CrossRef]
- Scutchfield, F.D.; Keck, C.W. Deaths of despair: Why? what to do? Am. J. Public Health 2017, 107, 1564–1565. [Google Scholar] [CrossRef]
- Diez Roux, A.V. Despair as a cause of death: More complex than it first appears. Am. J. Public Health 2017, 107, 1566–1567. [Google Scholar] [CrossRef]
- The Vaccine Class Gap. New York Times. Available online: Nytimes.com/2021/05/24/briefing/vaccination-class-gap-us.html (accessed on 12 June 2021).
- Gold, M.S. The Role of Alcohol, Drugs, and Deaths of Despair in the U.S.’s Falling Life Expectancy. Mo. Med. 2020, 117, 99–101. [Google Scholar] [PubMed]
- Pham, M.T.; Rajić, A.; Greig, J.D.; Sargeant, J.M.; Papadopoulos, A.; McEwen, S.A. A scoping review of scoping reviews: Advancing the approach and enhancing the consistency. Res. Synth. Methods 2014, 5, 371–385. [Google Scholar] [CrossRef] [PubMed]
- Knapp, E.A.; Bilal, U.; Dean, L.T.; Lazo, M.; Celentano, D.D. Economic insecurity and deaths of despair in US counties. Am. J. Epidemiol. 2019, 188, 2131–2139. [Google Scholar] [CrossRef] [PubMed]
- Fishman, S.H.; Gutin, I. Debts of despair: Education, financial losses, and precursors of deaths of despair. SSM-Popul. Health 2021, 14, 100759. [Google Scholar] [CrossRef] [PubMed]
- Jou, A.; Mas, N.; Vergara-Alert, C. Housing Wealth, Health and Deaths of Despair. J. Real. Estate Financ. Econ. 2020, 34, 1–33. [Google Scholar] [CrossRef]
- Dow, W.H.; Godøy, A.; Lowenstein, C.; Reich, M. Can Labor Market Policies Reduce Deaths of Despair? J. Health Econ. 2020, 74, 102372. [Google Scholar] [CrossRef]
- Geronimus, A.T.; Bound, J.; Waidmann, T.A.; Rodriguez, J.M.; Timpe, B. Weathering, Drugs, and Whack-a-Mole: Fundamental and Proximate Causes of Widening Educational Inequity in U.S. Life Expectancy by Sex and Race, 1990–2015. J. Health Soc. Behav. 2019, 60, 222–239. [Google Scholar] [CrossRef]
- Monnat, S.M. Trends in U.S. Working-Age non-Hispanic White Mortality: Rural–Urban and Within-Rural Differences. Popul. Res. Policy Rev. 2020, 39, 805–834. [Google Scholar] [CrossRef]
- Elo, I.T.; Hendi, A.S.; Ho, J.Y.; Vierboom, Y.C.; Preston, S.H. Trends in Non-Hispanic White Mortality in the United States by Metropolitan-Nonmetropolitan Status and Region, 1990–2016. Popul. Dev. Rev. 2019, 45, 549–583. [Google Scholar] [CrossRef]
- Witte, H.D. Job Insecurity and Psychological Well-being: Review of the Literature and Exploration of Some Unresolved Issues. Eur. J. Work. Organ. Psychol. 1999, 8, 155–177. [Google Scholar] [CrossRef]
- Borrell, C.; Artazcoz, L. [Policies to diminish the inequality in health in Spain: A few precisions]. Gac. Sanit. 2009, 23, 254. [Google Scholar] [CrossRef][Green Version]
- Hawkins, D.; Punnett, L.; Davis, L.; Kriebel, D. The Contribution of Occupation-Specific Factors to the Deaths of Despair, Massachusetts, 2005–2015. Ann. Work. Expo. Health 2021, 65, 819–832. [Google Scholar] [CrossRef] [PubMed]
- Stein, E.M.; Gennuso, K.P.; Ugboaja, D.C.; Remington, P.L. The epidemic of despair among White americans: Trends in the leading causes of premature death, 1999–2015. Am. J. Public Health 2017, 107, 1541–1547. [Google Scholar] [CrossRef] [PubMed]
- Monnat, S.M. Deaths of despair from the cities to the hollers: Explaining spatial differences in US drug, alcohol, and suicide mortality rates. In Population Association of America Annual Meeting; Pennsylvania State University: State College, PA, USA, 2017. [Google Scholar]
- Zeglin, R.J.; Niemela, D.R.M.; Baynard, C.W. Deaths of Despair in Florida: Assessing the Role of Social Determinants of Health. Health Educ. Behav. 2019, 46, 329–339. [Google Scholar] [CrossRef] [PubMed]
- Hawkins, D.; Davis, L.; Punnett, L.; Kriebel, D. Disparities in the Deaths of Despair by Occupation, Massachusetts, 2000 to 2015. J. Occup. Environ. Med. 2020, 62, 484–492. [Google Scholar] [CrossRef]
- Gaydosh, L.; Hummer, R.A.; Hargrove, T.W.; Halpern, C.T.; Hussey, J.M.; Whitsel, E.A.; Dole, N.; Harris, K.M. The depths of despair among US adults entering midlife. Am. J. Public Health 2019, 109, 774–780. [Google Scholar] [CrossRef]
- Gutin, I.; Hummer, R.A. Occupation, employment status, and “despair”-associated mortality risk among working-aged U.S. adults, 1997–2015. Prev. Med. 2020, 137, 106129. [Google Scholar] [CrossRef]
- Fulmer, S.; Jain, S.; Kriebel, D. Commercial fishing as an occupational determinant of opioid overdoses and deaths of despair in two Massachusetts fishing ports, 2000–2014. New Solut. 2021, 31, 252–258. [Google Scholar] [CrossRef]
- Rayhall, C.; Hawkins, D. Occupational differences in deaths of despair in the United States, using data from the using the National Occupational Mortality Surveillance System. J. Occup. Environ. 2022, 64, 356–360. [Google Scholar] [CrossRef]
- Kaki, S.; Hawkins, D. Deaths of despair among healthcare workers, Massachusetts, 2011 to 2015. J. Occup. Environ. 2021, 63, 449. [Google Scholar] [CrossRef]
- Siddiqi, A.; Sod-Erdene, O.; Hamilton, D.; Cottom, T.M.M.; Darity, W. Growing sense of social status threat and concomitant deaths of despair among whites. SSM–Popul Health 2019, 9, 100449. [Google Scholar] [CrossRef] [PubMed]
- Pierce, J.R.; Schott, P.K. Trade Liberalization and Mortality: Evidence from U.S. Counties. AER 2016, 2, 47–64. [Google Scholar]
- Simon, D.H.; Masters, R.K. Do Deaths of Despair Move Together? County-level Mortality Changes by Sex and Urbanization, 1990–2017. Am. J. Epidemiol. 2021, 190, 1169–1171. [Google Scholar] [CrossRef] [PubMed]
- Mutyambizi, C.; Booysen, F.; Stornes, P.; Eikemo, T.A. Subjective social status and inequalities in depressive symptoms: A gender-specific decomposition analysis for South Africa. Int. J. Equity Health 2019, 18, 87. [Google Scholar] [CrossRef] [PubMed]
- Bharat, V.; Habarth, J.; Keledjian, N.; Leykin, Y. Association between subjective social status and facets of depression self-stigma. J. Community Psychol. 2020, 48, 1059–1065. [Google Scholar] [CrossRef]
- Rohde, N.; Tang, K.K.; Osberg, L.; Rao, P. The effect of economic insecurity on mental health: Recent evidence from Australian panel data. Soc. Sci. Med. 2016, 151, 250–258. [Google Scholar] [CrossRef]
- Kopasker, D.; Montagna, C.; Bender, K.A. Economic insecurity: A socioeconomic determinant of mental health. SSM–Popul. Health 2018, 6, 184–194. [Google Scholar] [CrossRef]
- Vandoros, S.; Avendano, M.; Kawachi, I. The association between economic uncertainty and suicide in the short-run. Soc. Sci. Med. 2019, 220, 403–410. [Google Scholar] [CrossRef]
- Forbes, M.K.; Krueger, R.F. The Great Recession and Mental Health in the United States. Clin. Psychol. Sci. 2019, 7, 900–913. [Google Scholar] [CrossRef]
- Benach, J.; Julià, M.; Tarafa, G.; Mir, J.; Molinero, E.; Vives, A. Multidimensional measurement of precarious employment: Social distribution and its association with health in Catalonia (Spain). Gac. Sanit. 2015, 29, 375–378. [Google Scholar] [CrossRef]
- Aram, J.; Johnson, N.J.; Lee, M.L.T.; Slopen, N. Drug overdose mortality is associated with employment status and occupation in the National Longitudinal Mortality Study. Am. J. Drug Alcohol. Abuse 2020, 46, 769–776. [Google Scholar] [CrossRef] [PubMed]
- Kposowa, A.J. Unemployment and suicide: A cohort analysis of social factors predicting suicide in the US National Longitudinal Mortality Study. Psychol. Med. 2001, 31, 127–138. [Google Scholar] [CrossRef] [PubMed]
- Roberts, S.E.; Jaremin, B.; Lloyd, K. High-risk occupations for suicide. Psychol. Med. 2013, 43, 1231–1240. [Google Scholar] [CrossRef] [PubMed]
- Hahn, R.A.; Truman, B.I. Education improves public health and promotes health equity. Int. J. Health Serv. 2015, 45, 657–678. [Google Scholar] [CrossRef]
- Phillips, J.A.; Hempstead, K. Differences in U.S. Suicide Rates by Educational Attainment, 2000–2014. Am. J. Prev. Med. 2017, 53, e123–e130. [Google Scholar] [CrossRef]
- Douthit, N.; Kiv, S.; Dwolatzky, T.; Biswas, S. Exposing some important barriers to health care access in the rural USA. Public Health 2015, 129, 611–620. [Google Scholar] [CrossRef]
- Woolf, S.H.; Chapman, D.A.; Buchanich, J.M.; Bobby, K.J.; Zimmerman, E.B.; Blackburn, S.M. Changes in midlife death rates across racial and ethnic groups in the United States: Systematic analysis of vital statistics. BMJ 2018, 362, k3096. [Google Scholar] [CrossRef]
- Gennuso, K.P.; Blomme, C.K.; Givens, M.L.; Pollock, E.A.; Roubal, A.M. Deaths of Despair(ity) in Early 21st Century America: The Rise of Mortality and Racial/Ethnic Disparities. Am. J. Prev. Med. 2019, 57, 585–591. [Google Scholar] [CrossRef]
- Tilstra, A.M.; Simon, D.H.; Masters, R.K. Trends in “Deaths of Despair” among Working Aged White and Black Americans, 1990–2017. Am. J. Epidemiol. 2021, 190, 1751–1759. [Google Scholar] [CrossRef]
- Walsh, D.; McCartney, G.; Minton, J.; Parkinson, J.; Shipton, D.; Whyte, B. Deaths from ‘diseases of despair’ in Britain: Comparing suicide, alcohol-related and drug-related mortality for birth cohorts in Scotland, England and Wales, and selected cities. J. Epidemiol. Community Health 2021, 75, 1195–1201. [Google Scholar] [CrossRef]
- Wilsnack, R.W.; Wilsnack, S.C.; Gmel, G.; Kantor, L.W. Gender differences in binge drinking prevalence, predictors, and consequences. Alcohol. Res. Curr. Rev. 2018, 39, 57–76. [Google Scholar]
- Freeman, A.; Mergl, R.; Kohls, E.; Székely, A.; Gusmao, R.; Arensman, E.; Koburger, N.; Hegerl, U.; Rummel-Kluge, C. A cross-national study on gender differences in suicide intent. BMC Psychiatry 2017, 17, 234. [Google Scholar] [CrossRef] [PubMed]
- Muntaner, C.; Gunn, V.; Prins, S.J. On Case and Deaton’s deaths of despair: Implications for health inequalities research in the post-COVID-19 era. Gac. Sanit. 2021, 35, 409–410. [Google Scholar] [CrossRef]
- Brown, A.F.; Ma, G.X.; Miranda, J.; Eng, E.; Castille, D.; Brockie, T.; Jones, P.; Airhihenbuwa, C.O.; Farhat, T.; Zhu, L.; et al. Structural Interventions to Reduce and Eliminate Health Disparities. Am. J. Public Health 2019, 109, S72–S78. [Google Scholar] [CrossRef] [PubMed]


| Author | Year | Aim/s | Methods | Results | Race/ethnicity | Limitations | Sample, Region/State, Year of Data Collection |
|---|---|---|---|---|---|---|---|
| Brignone E, et al. [8] | 2020 | To characterize rates of clinically documented DoD over the last decade and identify sociodemographic risk factors. | Retrospective study using healthcare claims database extracted from Highmark, with 10 years of follow-up. Use of logistic regression modeling. | From 2009 to 2018, the prevalence of deaths of alcohol-related, substance-related, and suicide-related diagnoses, respectively, increased by 37%, 94%, and 170% and were associated with higher physical and mental conditions, especially among those with Affordable Care Act or Medicare coverage relative to commercial coverage (Adjusted Odds Ratio (AOR) 1.30, 1.24 to 1.37; AOR 1.51, 1.46 to 1.55). Overall, odds for current-year diagnosis were higher among men (AOR 1.49, 95% CI 1.47 to 1.51). | Details on race/ethnicity were not available for the sample used. | There is an incomplete nature of social determinants of health data in administrative health records. | Healthcare database with 12,144,252 participants. USA. Data was collected from 2009–2018 |
| Knapp EA, et al. [15] | 2019 | Evaluate the association between changes in economic insecurity and increases in DoD during 2000–2015 | Ecological longitudinal study. Measure economic insecurity using indicators from the Census and Federal Reserve Bank in USA counties for the years 2000 and 2010. | Counties in the highest tertile of economic insecurity in 2000 and 2010 had 41% (95% CI: 1.36, 1.47) higher midlife mortality rates at baseline and a rate of increase of 2% more per 5-year period (95% CI: 1.00, 1.03) than counties with stable low economic insecurity. 20% of counties experienced an increase in economic insecurity between 2000 and 2010. The regions experiencing a more acute increase in economic insecurity were the Midwest and South. | The study only estimated associations among all races in the subgroup of counties where non-Hispanic White death rates were not missing. The racial composition did not account for differences. | Deaths were counted only in smaller counties. Approximately 10% of counties had missing data on our primary outcome. The measure of economic insecurity may mask intercounty variation. Some of these changes seen may be due to changes in the coding. | Sample size not available in the USA. Data were collected from 2000–2010 |
| Zeglin RJ, et al. [27] | 2019 | Determine what country-level social determinants of health are associated with DoD in Florida | Background regression methodology | Higher than average income (p = 0.007), median age (p < 0.001), and mental health professionals in a Florida county (p = 0.027) were associated with significantly higher DoD rates in that county. Higher than average levels of education (p = 0.066) and recent checkups in a Florida county (p = 0.046) were associated with a significant decrease in DoD in that county. Also, the interaction between income and age was significant in the negative direction (p = 0.04) This accounts for 44% of the variance in county level. | Race was not retained in the final model. | The removal of 10% of the counties from analysis due to outliers Small sample size The study did not address assessing for regional effects | Data for all 67 Florida Counties. Florida, USA. Data was collected in 2018. |
| Fishman SH, et al. [16] | 2021 | To assess empirically the significance of financial losses as a key mechanism through which education is associated with a higher risk of DoD. | Extract data from the National Longitudinal Study of Adolescent and Adult Health (Add Health). Use of logistic regression modeling. | Financial losses mediate 20% of the association between drug use and suicide ideation among those with those with a high school degree or less. It is possible that other mechanisms operate through financial loss to influence DoD mortality. | Did not report racial differences. | The models do not account for the selection of unobserved characteristics not included in Add Health.The results apply to the association between young adulthood and middle adulthood but may not apply to older ages. | 8.000 responders USA Data were collected from 1994–1995 2007–2008 2016–2018 |
| Jou A, et al. [17] | 2020 | To assess the role of housing as a driver of DoD. | Data were extracted from the Panel Study of Income Dynamics (PSDI). | One Standard Deviation positive shock in housing wealth increases the probability of an improvement in self-reported health by 1.13% points and decreases the drug-related mortality rate by 0.27%. These results are not significant for alcohol or suicide death rates. | Did not find racial differences. | Housing Wealth, Health and DoD | Sample size is not available. USA. Data was collected from 1984–2013. |
| Dow WH, et al. [18] | 2020 | To investigate if minimum wages and earn income tax mitigate the rise of DoD | Causal models (difference-in-differences models) | A 10% minimum wage increase reduces non-drug suicides among low-educated adults by 2.7 percent, and the comparable Earned Income Tax Credit figure is 3.0 percent. There are no significant effects on drug- or alcohol-related mortality. | Did not estimate heterogeneity by race or ethnicity. | Potential heterogeneity by race or ethnicity was not estimatedThe models did not pick up long-run effects | Sample size not available. USA. Data was collected from 1999–2017 |
| Pierce R, et al. [35] | 2020 | To investigate the impact of a large and persistent economic shock on DoD. | Data was extracted from CDC’s National Center for Health Statistics. It provides death certificates from 1990 to 2013. Age-adjusted and crude rates were calculated. Baseline differences specifications to examine the link between deaths of despair and permanent normal trade relations. | Areas more exposed to a plausibly exogenous change in international trade policy exhibit relative increases in fatal drug overdoses (2 to 3 per 100,000), specifically among whites, controlling for state-level legislation pertaining to opioid availability and health care. | The associations between exogenous trade in USA policy and drug overdoses were seen only among whites. | The findings do not provide an assessment of the overall welfare impact of liberalization. | All death certificates in USA. Data were collected from 1990–2013 |
| Author | Year | Aim/s | Methods | Results | Race/Ethnicity | Limitations | Sample, Region/State, Year Data Collection, |
|---|---|---|---|---|---|---|---|
| Rayhall, et al. [32] | 2022 | To assess occupational differences in proportional mortality ratios (PMRs) and trends in these PMRs due to the DoD in the United States | PMRs for deaths due to drug overdoses, suicide, and alcoholic liver disease were obtained from the National Occupational Mortality Surveillance system. Data came from various states for the years 1985 to 1998, 1999, 2003 to 2004, and 2007 to 2014. | Occupations with a higher risk of Deads of Despair were: construction, architects, food preparation, and service. In addition, personal care and home aides had the highest increase in death due to deaths of despair. | Differences between race/ethnicity were not reported. | The occupational codes only consider the occupation of the deceased individual during the majority of their life. It does not consider the occupation of the individual when they passed. | Sample size not available. USA. Data were collected from: 1985–1999 2003–2004 2007–2014 |
| Kaki S et al. [33] | 2021 | To explore DoD mortality rates among healthcare workers in Massachusetts from 2011 to 2015 | Deaths certificated due to DoD were coded by the occupation of the healthcare workers. Mortality rates and rate ratios were calculated according to the occupation of healthcare workers. | The highest mortality rate for DoDs was among medical assistants; nursing, psychiatric, and home health aides; miscellaneous; health technologists and technicians; emergency medical technicians, and paramedics. | Differences between race/ethnicity were not reported, | Misclassification with respect to occupation, as death certificates have only information about the usual occupation of the individual. | Sample size not available Massachusetts, USA. Data were collected from 2011–2015 |
| Fulmer S, et al. [31] | 2021 | To determine the differences in DoD between fisherman and non-fisherman workers in two Massachusetts fishing ports between 2000–2014 | Death certificates were obtained from the Massachusetts Department of Public Health’s Registry of Vital Records and Statistics. The mortality analysis was used to quantify the differences between fishing and non-fishing workers residing in the two cities. | Fishermen were more than four times more likely to die from opioid poisoning than non-fishermen residents. | Racial differences were not reported. | Unique specific fishery characteristics were not determined. It was not possible to differentiate between recreational use and prescription use of opioids. | 26,000 deats certificates records Massachusetts, USA 2000–2014 |
| Hawkins D, et al. [24] | 2021 | To determine whether differences in the risk of DoD were associated with the rate of occupational injuries and illnesses, job insecurity, and temporal changes in employment. | Usual occupation information was collected from death certificates of Massachusetts residents aged 16–64 with relevant causes of death between 2005 and 2015. These data were combined with occupation-level data about occupational injuries and illnesses, job insecurity, and non-standard work arrangements. | The highest number of all deaths of despair occurred in occupations with injury rates of at least 100 per 10,000 full-time workers. Workers in occupations with more job insecurity had higher rates of DoD (RR 1.05 (1.00, 1.09)). Rates of DoD increased most rapidly for occupations with the increasing prevalence of workers employed in non-standard work arrangements (RR 7.6 (6.7, 8.5)) | Racial differences were not found | The measures of exposure utilized for this study were assessed at the group level. Within groups, there is likely variation in exposure and individual-level misclassification. The wide variety of data sources that were combined at the national level, certain occupations and workers could have been misclassified with respect to the exposures analyzed. Death certificates only have information about the usual occupation. | Sample size not available Massachusetts, USA Data were collected from 2005–2015. |
| Hawkins D, et al. [28] | 2020 | To explore mortality rates and trends according to the occupation of workers who died from DoD | Death certificates for deaths due to poisoning, suicides, and alcoholic liver disease occurring in Massachusetts from 2000 to 2015 were collected and coded according to the occupation of the deceased. Mortality rates and trends in mortality were calculated for each occupation. | DoD increased more than 50% between 2000 and 2004 and 2011–2015. Workers with elevated trends for these deaths were construction, farming, fishing, and forestry workers. | Mortality rates from deaths of despair caused among white, non- Hispanics were about 50% higher than those among Hispanics of all races and black, non-Hispanics. Asian, non-Hispanics accounted for less than 1% of all deaths of despair. | The occupation information listed on a death certificate is the ‘‘usual’’ occupation in an individual’s lifetime. It is not known whether those who died were working at the time of death, which may have resulted in some misclassification of causes of death. | Sample size not available Massachusetts, USA Data were collected from 2000–2015 |
| Gutin I, et al. [30] | 2020 | To estimate associations between an individual’s occupation and employment status and alcoholic liver disease, suicide, or poisoning mortality risk. | Data of 360,146 adults aged 25–65 from the National Health Interview Survey-Linked mortality Files (1997–2015) | Adults in service jobs (OR 3.10 [1.38–6.94]), manual labor (OR 2.22 [1.00–4.96]), and transport occupations (OR 2.38 [1.08–5.25]) had two to three times the risk of accidental poisoning mortality. Health professionals exhibited the highest accidental poisoning mortality risk (OR 3.35 [1.18–9.47]). Long-term unemployed adults had elevated risk of accidental poisoning (OR 6.44 [2.69–15.41]).Adults not in the labor force had double the suicide risk (2.28 [1.49–3.49]) and seven times the accidental poisoning risk (OR 12.71 [7.46–21.67]). | Racial differences are not found. | Temporal trends were not assessed because of the moderate number of deaths available.Employment status and occupation were obtained at the time of the survey and may change during the follow-up. The accidental poisoning category encompasses a diverse set of deaths. Comprehensive data on individuals’ workplace experiences, exposures, and rewards would allow for a better measure of “precariousness.” | Sample size not available USA. Data were collected from 1997–2015 |
| Monnat [26] | 2017 | To determine associations between county factors and drug, alcohol, and suicide mortality rates. | Mortality rates were obtained from the U.S Centers for Disease Control and Prevention’s Wide-Ranging Online Data for Epidemiological Research 2006–2015. Spatial analyses were conducted on country-level factors. | Mortality rates are higher among counties with socioeconomically disadvantaged residents, declines in income, military residents, and population aged 65+. Counties with occupational losses experience higher mortality rates due to alcohol, suicide, and drugs. | Racial differences were not reported. | There was no disaggregation by sex or age. Death certificates might misclassify the cause of death. Changes in mortality were not examined. | Sample size not available USA. Data were collected from 2011–2015 |
| Author | Year | Aim/s | Methods | Results | Race/Ethnicity | Limitations | Sample, State/Region, Year Data Collection, Region |
|---|---|---|---|---|---|---|---|
| Case A, et al. [3] | 2015 | To analyze the mortality trends in the USA population of all-cause deaths. | Data extracted from CDC Wonder Compressed and Detailed mortality files Ethnicity and educational data were extracted from the American Community Surveys and before 2000 from Popular Surveys. | Over the 15-year period, midlife all-cause mortality fell by more than 200 per 100,000 for black non-Hispanics, and by more than 60 per 100,000 for Hispanics. White non-Hispanic mortality rose by 34 per 100,000 for ages 45–54. The change in all-cause mortality for white non-Hispanics 45–54 is largely accounted for by an increasing death rate in drug and alcohol poisoning and suicide. | There is an increase in non-Hispanic mortality. | No mortality trends analyzed from 2013 onwards. | Sample size not available USA. Data was collected from 1999–2013 |
| Gaydosh L, et al. [29] | 2019 | To test if the indicators of despairs are rising among middle-aged US adults. To test if this rise is concentrated among low-educated white adults and in rural areas. | Data were extracted from the National Longitudinal Study of Adolescent to Adult Health. The individuals were non-Hispanic White, non-Hispanic Black, or Hispanic. Changes in indicators of despair from adolescence to adulthood were examined using multilevel regression analysis. | Generalized increase in multiple despair indicators among all White, Black, and Hispanic adults in their 30s. Midlife mortality increased across racial/ethnic groups. | There is a general increase in despair across racial/ethnic, educational, and geographical groups. | Indicators may not completely capture all domains of despair. The authors did not examine adults in their 30s because of the lack of data in Add Health sample. | 18,446 responders USA. Data were collected from 1994–2017. |
| Geronimus AT, et al. [19] | 2019 | To test the empirical evidence of DoD | Using data from Census and Vital Statistics, the authors applied table methods to calculate cause-specific years of life lost between ages 25 and 84 by sex and educational rank for non-Hispanic blacks and whites in 1990 and 2015. | Drug overdose deaths increased over the period 1990 and 2015, particularly in the 25–64 years old group (73% and 44% for men and women, respectively), especially for Whites but trivially for blacks. Both blacks and whites show increased mortality between the lowest and highest education categories. | The contribution of drug overdose deaths increased substantially over the study period for whites, particularly in the 25- to 64-year-old age group. | Deaths due to opioids may be undercounted on death certificates. Deaths may be misclassified. | 2,151,890 men and 2,718,198 women USA, not state/region specified. Data were collected from 1990–2015. |
| Siddiqi A, et al. [34] | 2019 | To investigate if mortality increases are attributable to (false) perceptions of whites that they are losing social status. | Administrative, survey data, trends, and correlations between race, age, education-specific mortality, and economic and social indicators were examined to determine whether changes in the Republican share of voters during presidential elections were associated with changes in working-age white mortality from 2000 to 2016. | Rising white mortality is not restricted to the lowest education bracket and is occurring deeper into the educational distribution. Parallel trends of economic factors (and more adverse levels) of these factors were being experienced by blacks, whose mortality rates are not rising. | Mortality rates for Blacks are not rising. | It is difficult to completely isolate the influence of Republican vote share because of the interconnectedness of this variable with other socioeconomic conditions. | Sample size not available USA, not state/region specified. Data were collected from 2000–2016. |
| Author | Year | Aim/s | Methods | Results | Race/ethnicity | Limitations | Sample, Year State/Region, Data Collection, Region |
|---|---|---|---|---|---|---|---|
| Monnat SM [20] | 2020 | To examine metropolitan versus non-metropolitan and intra-non-metropolitan all-cause-specific mortality trends among working age (25–64) non-Hispanic males and females 1990–2018. | Obtain all-cause and cause-specific mortality rates by sex and age group (25–44 and 45–64). Rates are age-adjusted within each 20-year age group using 10-year population counts and weights. | 81% of the non-metropolitan mortality death rate increase is due to increases in drugs, alcohol, suicide, and mental/behavioral disorders (DoD). | The non-metropolitan working-age mortality penalty is growing for all ethnic groups and especially for non-Hispanic whites. | The study only examined the white population.The analysis did not adjust for compositional differences.The study only divided two-division and economic types. | 9,211,413 deaths in metro counties and 2,465,300 deaths in nonmetro counties USA. Data were collected from 1990–2018. |
| Stein EM, et al. [25] | 2017 | To evaluate trends in premature deaths by cause of death, age, race, and urbanization level in the USA. | Calculate cause-specific death rates using Compressed Mortality File, National Center for Health Statistic data for adults 25 to 64 years [two periods 1999–2001 and 2013–2015]. Define 48 subpopulations | Death rates in rural subpopulations for all races/ethnicities increased among those aged 25 to 64 years by 6%, whereas large urban, suburban, and small or medium metropolitan subpopulations had decreases in death rates by 2% to 20%. These disparities were most pronounced in Whites relative to other racial/ethnic subpopulations and among those aged 45 to 54 years. Most increases in death rates were attributable to suicide, poisoning, and liver disease. | Deaths of despair were most pronounced among non-Hispanic whites relative to other racial groups. | The study was limited by the lack of information about the educational and economic status of descendants and the effects of racial/ethnic misclassification. | Sample size not available USA. Data were collected from 1999–2001 and 2013–2015. |
| Elo IT, et al. [21] | 2019 | Estimate the contributions of four key age groups to changes in life expectancy at birth between 1990 and 2016 by metropolitan-nonmetropolitan status and region. | Use of 1990–2016 Multiple Cause of Death data files to tabulate deaths by age, sex, race/ethnicity, cause of death, county, and year. These data were combined to estimate age-specific death rates for all causes. | Mortality from drug overdose, suicide, and alcohol-related causes of death increased and contributed to life expectancy reductions across the metropolitan and no-metropolitan categories, especially from a drug overdose. | The study only focused on non-Hispanic groups | Analyses did not adjust for compositional differences. The study focused on Non-Hispanic whites. | Sample size not available USA Data were collected from 1990–2016. |
Publisher’s Note: MDPI stays neutral with regard to jurisdictional claims in published maps and institutional affiliations. |
© 2022 by the authors. Licensee MDPI, Basel, Switzerland. This article is an open access article distributed under the terms and conditions of the Creative Commons Attribution (CC BY) license (https://creativecommons.org/licenses/by/4.0/).
Share and Cite
Beseran, E.; Pericàs, J.M.; Cash-Gibson, L.; Ventura-Cots, M.; Porter, K.M.P.; Benach, J. Deaths of Despair: A Scoping Review on the Social Determinants of Drug Overdose, Alcohol-Related Liver Disease and Suicide. Int. J. Environ. Res. Public Health 2022, 19, 12395. https://doi.org/10.3390/ijerph191912395
Beseran E, Pericàs JM, Cash-Gibson L, Ventura-Cots M, Porter KMP, Benach J. Deaths of Despair: A Scoping Review on the Social Determinants of Drug Overdose, Alcohol-Related Liver Disease and Suicide. International Journal of Environmental Research and Public Health. 2022; 19(19):12395. https://doi.org/10.3390/ijerph191912395
Chicago/Turabian StyleBeseran, Elisabet, Juan M. Pericàs, Lucinda Cash-Gibson, Meritxell Ventura-Cots, Keshia M. Pollack Porter, and Joan Benach. 2022. "Deaths of Despair: A Scoping Review on the Social Determinants of Drug Overdose, Alcohol-Related Liver Disease and Suicide" International Journal of Environmental Research and Public Health 19, no. 19: 12395. https://doi.org/10.3390/ijerph191912395
APA StyleBeseran, E., Pericàs, J. M., Cash-Gibson, L., Ventura-Cots, M., Porter, K. M. P., & Benach, J. (2022). Deaths of Despair: A Scoping Review on the Social Determinants of Drug Overdose, Alcohol-Related Liver Disease and Suicide. International Journal of Environmental Research and Public Health, 19(19), 12395. https://doi.org/10.3390/ijerph191912395