

Correlation between Cardiopulmonary Indices and Running Performance in a 14.5 km Endurance Running Event
 , ,
, ,  , and
, and
Abstract
1. Introduction
2. Materials and Methods
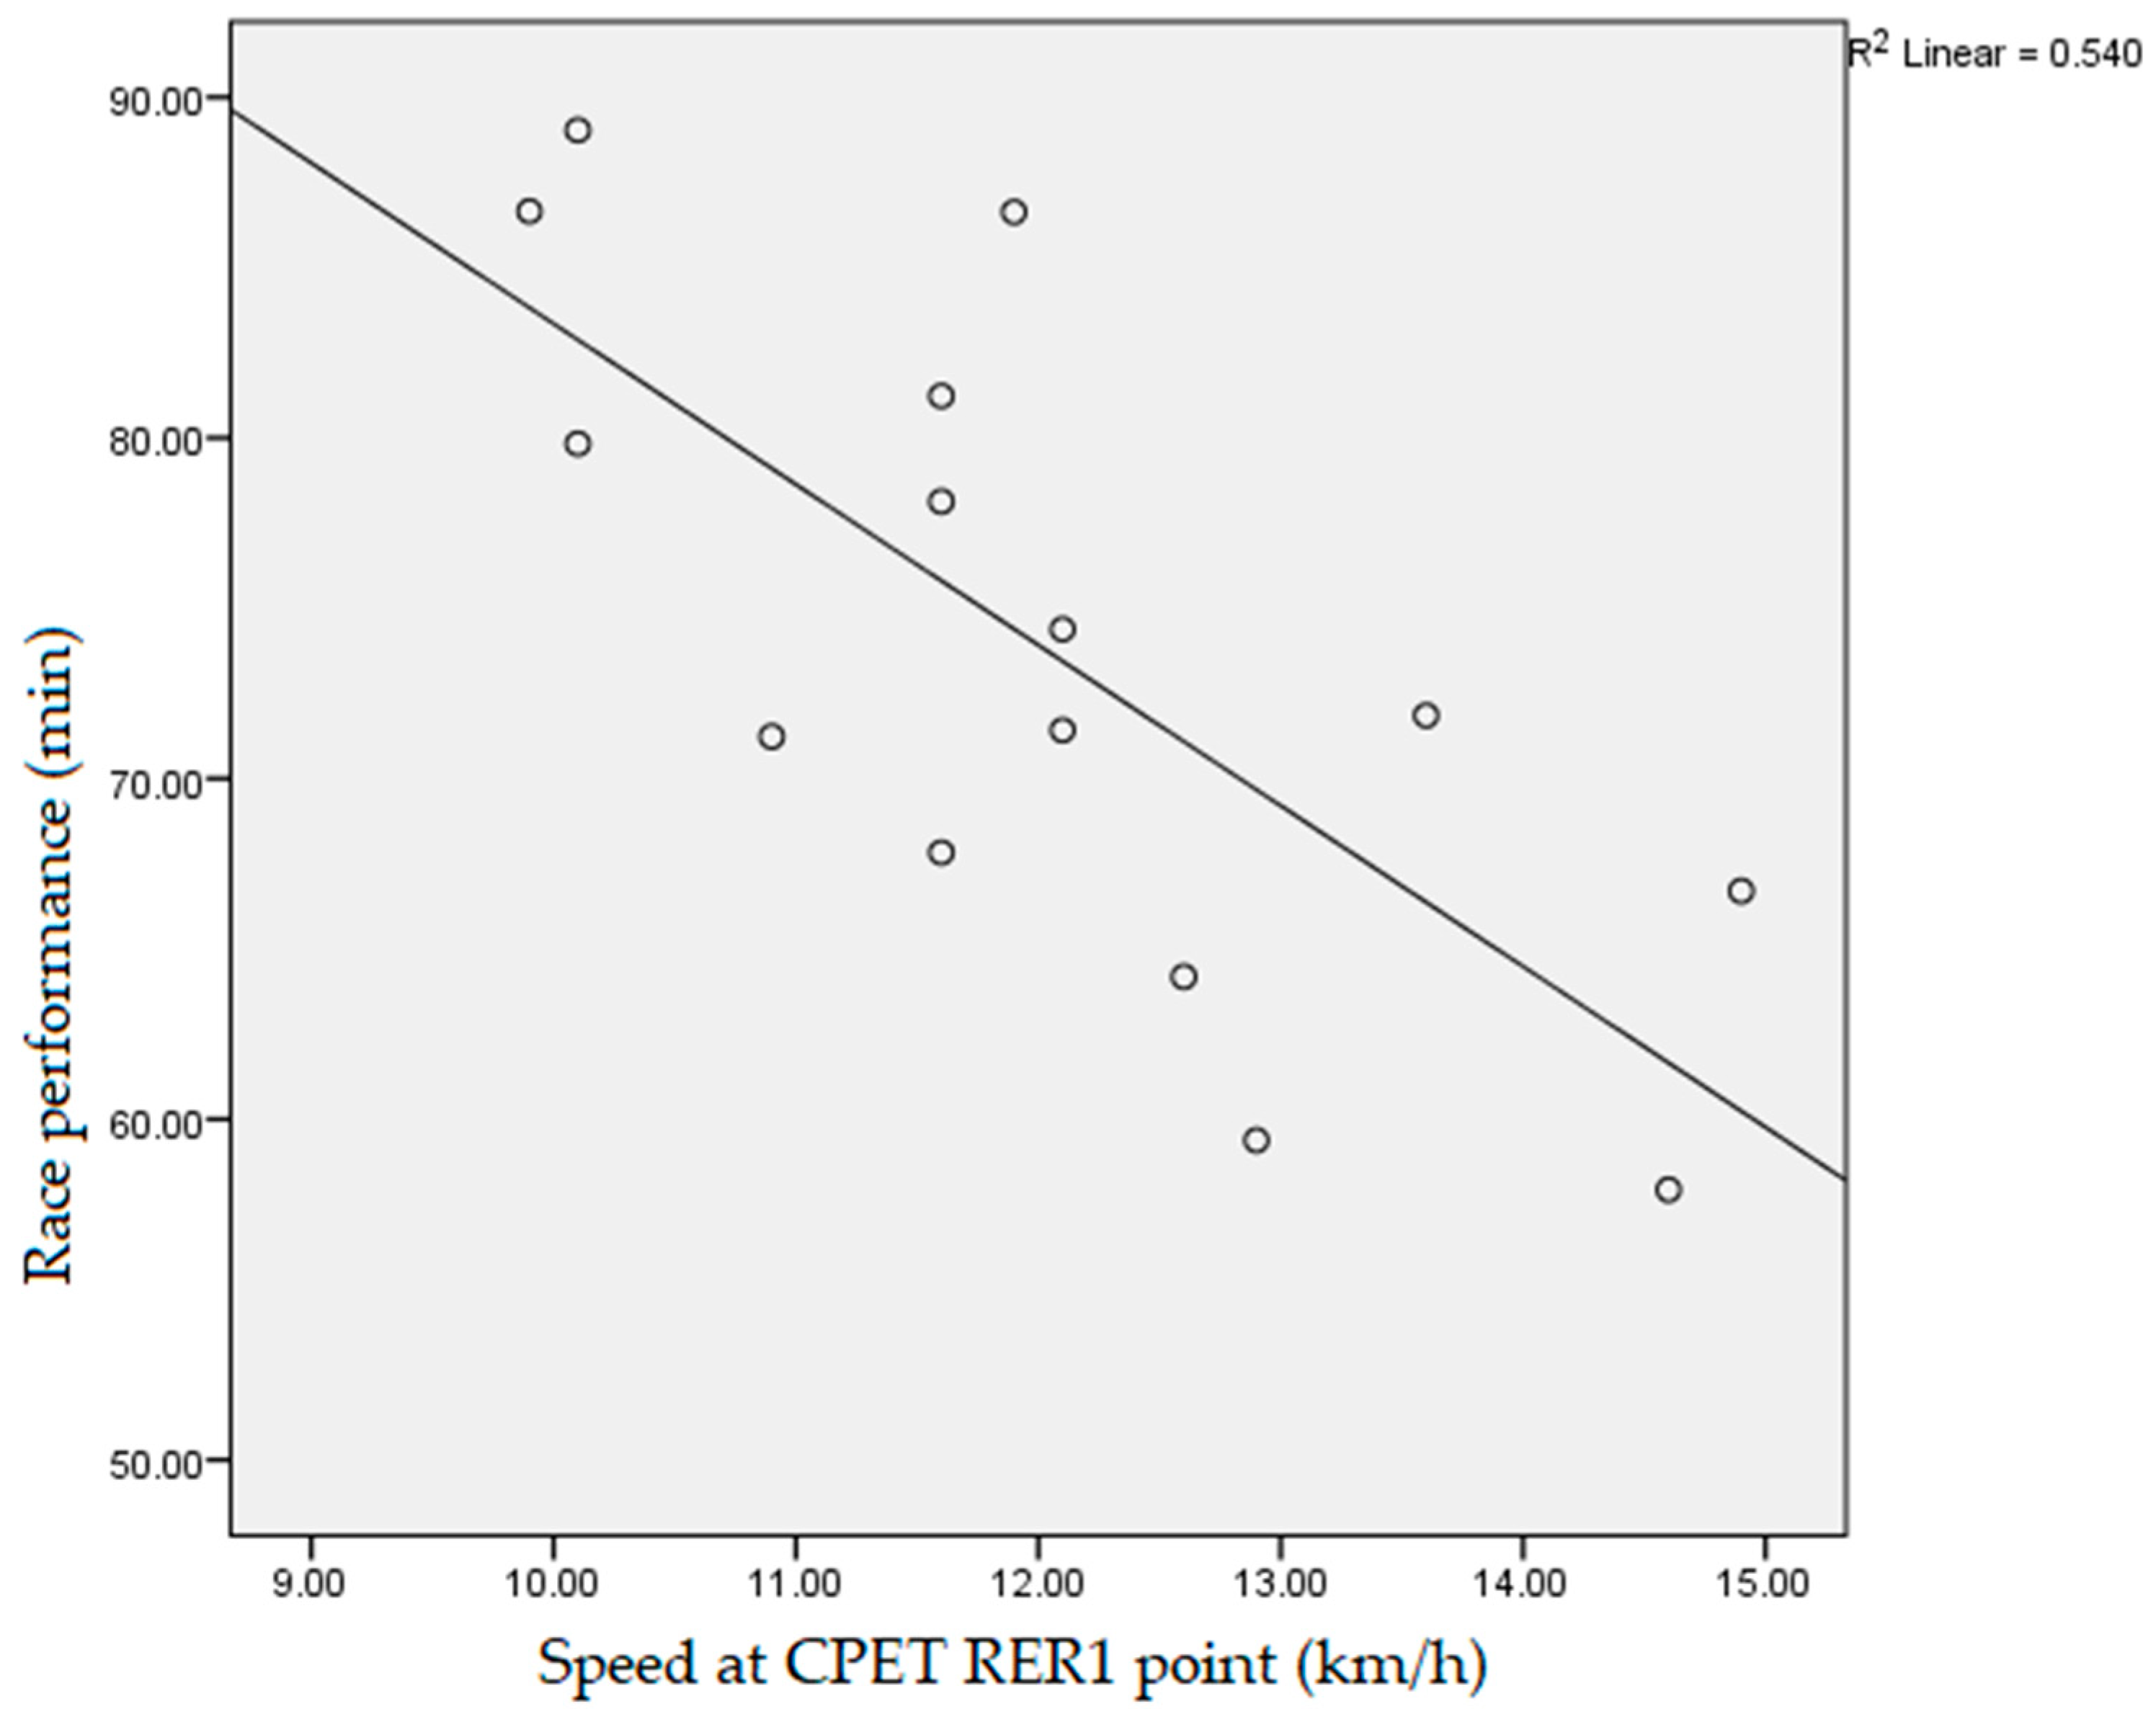
3. Results
4. Discussion
5. Conclusions
Author Contributions
Funding
Institutional Review Board Statement
Informed Consent Statement
Data Availability Statement
Conflicts of Interest
References
- Hulteen, R.M.; Smith, J.J.; Morgan, P.J.; Barnett, L.M.; Hallal, P.C.; Colyvas, K.; Lubans, D.R. Global participation in sport and leisure-time physical activities: A systematic review and meta-analysis. Prev. Med. 2017, 95, 14–25. [Google Scholar] [CrossRef] [PubMed]
- Borgers, J.; Breedveld, K.; Tiessen-Raaphorst, A.; Thibaut, E.; Vandermeerschen, H.; Vos, S.; Scheerder, J. A study on the frequency of participation and time spent on sport in different organisational settings. Eur. Sport Manag. Q. 2016, 16, 635–654. [Google Scholar] [CrossRef]
- Anthony, D.; Rüst, C.A.; Cribari, M.; Rosemann, T.; Lepers, R.; Knechtle, B. Differences in participation and performance trends in age group half and full marathoners. Chin. J. Physiol. 2014, 57, 209–219. [Google Scholar] [CrossRef] [PubMed]
- Knechtle, B.; Nikolaidis, P.T.; Zingg, M.A.; Rosemann, T.; Rüst, C.A. Half-marathoners are younger and slower than marathoners. SpringerPlus 2016, 5, 76. [Google Scholar] [CrossRef]
- Lima, M.G.; Malta, D.C.; Monteiro, C.N.; da Silva Sousa, N.F.; Stopa, S.R.; Medina, L.D.P.B.; de Azevedo Barros, M.B. Leisure-time physical activity and sports in the Brazilian population: A social disparity analysis. PLoS ONE 2019, 14, e0225940. [Google Scholar] [CrossRef] [PubMed]
- Stamatakis, E.; Chaudhury, M. Temporal trends in adults’ sports participation patterns in England between 1997 and 2006: The health survey for England. Br. J. Sports Med. 2008, 42, 601–608. [Google Scholar] [CrossRef]
- Eime, R.M.; Harvey, J.T.; Charity, M.J.; Casey, M.M.; Van Uffelen, J.G.Z.; Payne, W.R. The contribution of sport participation to overall health enhancing physical activity levels in Australia: A population-based study. BMC Public Health 2015, 15, 806. [Google Scholar] [CrossRef]
- Wisconsin Office of Outdoor Recreation. 2018 Participation Report: The Physical Activity Council’s Annual Study Tracking Sports, Fitness and Recreation Participation in the US. Available online: https://outdoorrecreation.wi.gov/Documents/Research%20Library%20Page%20files/US%20-%20Demographics%20%26%20Participation/Physical%20Activity%20Coucil%20Participation%20Report_2018.pdf (accessed on 15 June 2022).
- Pedisic, Z.; Shrestha, N.; Kovalchik, S.; Stamatakis, E.; Liangruenrom, N.; Grgic, J.; Titze, S.; Biddle, S.J.H.; Bauman, A.E.; Oja, P. Is running associated with a lower risk of all-cause, cardiovascular and cancer mortality, and is the more the better? A systematic review and meta-analysis. Br. J. Sports Med. 2019, 54, 898–905. [Google Scholar] [CrossRef]
- Lavie, C.J.; Lee, D.C.; Sui, X.; Arena, R.; O’Keefe, J.H.; Church, T.S.; Milani, R.V.; Blair, S.N. Effects of running on chronic diseases and cardiovascular and all-cause mortality. Mayo Clin. Proc. 2015, 90, 1541–1552. [Google Scholar] [CrossRef]
- Lee, D.C.; Brellenthin, A.G.; Thompson, P.D.; Sui, X.; Lee, I.M.; Lavie, C.J. Running as a key lifestyle medicine for longevity. Prog. Cardiovasc. Dis. 2017, 60, 45–55. [Google Scholar] [CrossRef]
- Wang, Y.; Lee, D.C.; Brellenthin, A.G.; Eijsvogels, T.M.; Sui, X.; Church, T.S.; Lavie, C.J.; Blair, S.N. Leisure-time running reduces the risk of incident type 2 diabetes. Am. J. Med. 2019, 132, 1225–1232. [Google Scholar] [CrossRef]
- Hespanhol, J.L.C.; Pillay, J.D.; van Mechelen, W.; Verhagen, E. Meta-analyses of the effects of habitual running on indices of health in physically inactive adults. Sport Med. 2015, 45, 1455–1468. [Google Scholar] [CrossRef] [PubMed]
- Lee, D.C.; Pate, R.R.; Lavie, C.J.; Sui, X.; Church, T.S.; Blair, S.N. Leisure-time running reduces all-cause and cardiovascular mortality risk. J. Am. Coll. Cardiol. 2014, 4, 472–481. [Google Scholar] [CrossRef]
- Videbæk, S.; Bueno, A.M.; Nielsen, R.O.; Rasmussen, S. Incidence of running-related injuries per 1000 h of running in different types of runners: A systematic review and meta-analysis. Sport Med. 2015, 45, 1017–1026. [Google Scholar] [CrossRef] [PubMed]
- Kluitenberg, B.; van Middelkoop, M.; Diercks, R.; van der Worp, H. What are the differences in injury proportions between different populations of runners? A systematic review and meta-analysis. Sport Med. 2015, 45, 1143–1161. [Google Scholar] [CrossRef] [PubMed]
- Gauffin, H.; Tillander, B.; Dahlström, Ö.; Lyth, J.; Raysmith, B.; Jacobsson, J.; Timpka, T. Maintaining motivation and health among recreational runners: Panel study of factors associated with self-rated performance outcomes at competitions. J. Sci. Med. Sport 2019, 22, 1319–1323. [Google Scholar] [CrossRef]
- León-Guereño, P.; Tapia-Serrano, M.A.; Sánchez-Miguel, P.A. The relationship of recreational runners’ motivation and resilience levels to the incidence of injury: A mediation model. PLoS ONE 2020, 15, e0231628. [Google Scholar] [CrossRef]
- Linton, L.; Valentin, S. Running with injury: A study of UK novice and recreational runners and factors associated with running related injury. J. Sci. Med. Sport 2018, 21, 1221–1225. [Google Scholar] [CrossRef]
- Keogh, A.; Smyth, B.; Caulfield, B.; Lawlor, A.; Berndsen, J.; Doherty, C. Prediction equations for marathon performance: A systematic review. Int. J. Sports Physiol. Perform. 2019, 14, 1159–1169. [Google Scholar] [CrossRef]
- Gómez-Molina, J.; Ogueta-Alday, A.; Camara, J.; Stickley, C.; Rodríguez-Marroyo, J.A.; García-López, J. Predictive variables of half-marathon performance for male runners. J. Sport Sci. Med. 2017, 16, 187–194. [Google Scholar]
- Boullosa, D.; Esteve-Lanao, J.; Casado, A.; Peyré-Tartaruga, L.A.; Gomes da Rosa, R.; Del Coso, J. Factors affecting training and physical performance in recreational endurance runners. Sports 2020, 8, 35. [Google Scholar] [CrossRef] [PubMed]
- Esteve-Lanao, J.; Del Rosso, S.; Larumbe-Zabala, E.; Cardona, C.; Alcocer-Gamboa, A.; Boullosa, D.A. Predicting recreational runners’ marathon performance time during their training preparation. J. Strength Cond. Res. 2021, 35, 3218–3224. [Google Scholar] [CrossRef] [PubMed]
- Salinero, J.J.; Soriano, M.L.; Lara, B.; Gallo-Salazar, C.; Areces, F.; Ruiz-Vicente, D.; Abián-Vicén, J.; González-Millán, C.; Del Coso, J. Predicting race time in male amateur marathon runners. J. Sports Med. Phys. Fit. 2017, 57, 1169–1177. [Google Scholar] [CrossRef] [PubMed]
- Winter, U.J.; Gitt, A.K.; Fritsch, J.; Berge, P.G.; Pothoff, G.; Hilger, H.H. Methodologic aspects of modern, computerized ergospirometry (CPX): Ramp program, constant workload test and CO2 rebreathing method. Z. Kardiol. 1994, 83, 13–26. [Google Scholar] [PubMed]
- Wasserman, K.; Hansen, J.E.; Sue, D.Y.; Stringer, W.W.; Whipp, B.J. Principles of Exercise Testing and Interpretation: Including Pathophysiology and Clinical Applications, 4th ed.; Lippincott Williams & Wilkins: Philadelphia, PA, USA, 2004. [Google Scholar]
- Scott, B.K.; Houmard, J.A. Peak running velocity is highly related to distance running performance. Int. J. Sports Med. 1994, 15, 504–507. [Google Scholar] [CrossRef] [PubMed]
- Bragada, J.A.; Santos, P.J.; Maia, J.A.; Colaço, P.J.; Lopes, V.P.; Barbosa, T.M. Longitudinal study in 3,000 m male runners: Relationship between performance and selected physiological parameters. J. Sport Sci. Med. 2010, 9, 439–444. [Google Scholar]
- Nicholson, R.M.; Sleivert, G.G. Indices of lactate threshold and their relationship with 10-km running velocity. Med. Sci. Sports Exerc. 2001, 33, 339–342. [Google Scholar] [CrossRef]
- Billat, L.V.; Koralsztein, J.P. Significance of the velocity at VO2max and time to exhaustion at this velocity. Sport Med. 1996, 22, 90–108. [Google Scholar] [CrossRef]
- Bassett, D.R.; Howley, E.T. Limiting factors for maximum oxygen uptake and determinants of endurance performance. Med. Sci. Sports Exerc. 2000, 32, 70–84. [Google Scholar] [CrossRef]
- Conley, D.L.; Krahenbuhl, G.S. Running economy and distance running performance of highly trained athletes. Med. Sci. Sports Exerc. 1980, 12, 357–360. [Google Scholar] [CrossRef]
- Daniels, J.; Daniels, N. Running economy of elite male and elite female runners. Med. Sci. Sports Exerc. 1992, 24, 483–489. [Google Scholar] [CrossRef] [PubMed]
- Bassett, D.R.; Howley, E.T. Maximal oxygen uptake: “Classical” versus “contemporary” viewpoints. Med. Sci. Sports Exerc. 1997, 29, 591–603. [Google Scholar] [CrossRef] [PubMed]
- Grant, S.; Craig, I.; Wilson, J.; Aitchison, T. The relationship between 3 km running performance and selected physiological variables. J. Sports Sci. 1997, 15, 403–410. [Google Scholar] [CrossRef] [PubMed]
- Borgen, N.T. Running performance, VO2max, and running economy: The widespread issue of endogenous selection bias. Sport Med. 2018, 48, 1049–1058. [Google Scholar] [CrossRef] [PubMed]
- O Sullivan, I.J.; Johnson, M.I.; Hind, K.; Breen, S.; Francis, P. Are changes in running economy associated with changes in performance in runners? A systematic review and meta-analysis. J. Sports Sci. 2019, 37, 1521–1533. [Google Scholar] [CrossRef] [PubMed]
- Alvero-Cruz, J.R.; Carnero, E.A.; García, M.A.G.; Alacid, F.; Correas-Gómez, L.; Rosemann, T.; Nikolaidis, P.T.; Knechtle, B. Predictive performance models in long-distance runners: A narrative review. Int. J. Environ. Res. Public Health 2020, 17, 8289. [Google Scholar] [CrossRef]
- Lee, L.L.; Arthur, A.; Avis, M. Using self-efficacy theory to develop interventions that help older people overcome psychological barriers to physical activity: A discussion paper. Int. J. Nurs. Stud. 2008, 45, 1690–1699. [Google Scholar] [CrossRef]
- André, N.; Agbangla, N.F. Are barriers the same whether I want to start or maintain exercise? A narrative review on healthy older adults. Int. J. Environ. Res. Public Health 2020, 17, 6247. [Google Scholar] [CrossRef]


| Participants | Race Performance (min) | Average Race Speed (km/h) | Age (Years) | Height (cm) | Weight (kg) | BMI b (kg/m2) | Body Fat (%) | Muscle Mass (%) |
|---|---|---|---|---|---|---|---|---|
| 1 | 57.93 | 15.02 | 37 | 189 | 83 | 23.24 | 19 | 38.3 |
| 2 | 59.38 | 14.65 | 37 | 180.5 | 76 | 23.33 | 21.6 | 37 |
| 3 | 64.18 | 13.56 | 48 | 181 | 77 | 23.50 | 18.7 | 37.7 |
| 4 | 66.7 | 13.04 | 51 | 169 | 68 | 23.81 | 18.1 | 38.4 |
| 5 | 67.83 | 12.83 | 52 | 178 | 74 | 23.36 | 18.6 | 37.4 |
| 6 | 71.23 | 12.21 | 38 | 171 | 73 | 24.96 | 23 | 37.1 |
| 7 | 71.42 | 12.18 | 34 | 176 | 72 | 23.24 | 17.2 | 40.7 |
| 8 | 71.85 | 12.11 | 39 | 184 | 92 | 27.17 | 28.1 | 33.4 |
| 9 | 74.38 | 11.70 | 32 | 156.5 | 57 | 23.27 | 32.9 | 28.4 |
| 10 | 78.13 | 11.14 | 39 | 173.5 | 78 | 25.91 | 26 | 35 |
| 11 | 79.83 | 10.90 | 39 | 169.5 | 78 | 27.15 | 25.7 | 35.8 |
| 12 | 81.23 | 10.71 | 66 | 173 | 79 | 26.40 | 20.7 | 35.4 |
| 13 | 86.63 | 10.04 | 33 | 177 | 66 | 21.70 | 20.3 | 35.5 |
| 14 | 86.65 | 10.04 | 40 | 168.5 | 68 | 23.95 | 30.8 | 30.5 |
| 15 | 89.03 | 9.77 | 34 | 171 | 60 | 20.52 | 22.6 | 33.6 |
| Mean Value | 73.8 | 12.0 | 41.3 | 174.5 | 73.4 | 24.1 | 22.9 | 35.6 |
| SD a | 9.7 | 1.6 | 9.2 | 7.8 | 8.8 | 2.0 | 4.8 | 3.2 |
| Median | 71.85 | 12.11 | 39 | 173.5 | 74.0 | 23.50 | 21.6 | 35.8 |
| Participants | Test Time (min) | VE b (L/min) | Running Speed at VT c Point (km/h) | Maximal Running Speed | VO2max d (L) | VO2max d (mL/min/kg) | Oxygen Pulse (mL/Beat) | Maximal Heart Rate (Beat/min) |
|---|---|---|---|---|---|---|---|---|
| 1 | 11.17 | 123 | 15.4 | 16.1 | 4.24 | 51.1 | 24 | 170 |
| 2 | 12.28 | 144 | 17.1 | 17.4 | 3.96 | 52.1 | 22 | 177 |
| 3 | 10.08 | 103 | 11.6 | 15.1 | 3.21 | 41.7 | 22 | 160 |
| 4 | 11.75 | 132 | 16.6 | 16.6 | 3.8 | 55.9 | 21 | 181 |
| 5 | 9.97 | 146 | 13.6 | 14.9 | 3.3 | 44.6 | 23 | 141 |
| 6 | 10.15 | 118 | 15.1 | 15.1 | 3.21 | 44.0 | 25 | 169 |
| 7 | 11.17 | 123 | 16.1 | 16.1 | 3.76 | 52.2 | 22 | 175 |
| 8 | 11.32 | 135 | 15.6 | 16.5 | 4.08 | 44.3 | 29 | 163 |
| 9 | 10.10 | 95 | 14.4 | 15.1 | 2.66 | 46.7 | 14 | 185 |
| 10 | 11.25 | 143 | 15.1 | 16.1 | 3.45 | 44.2 | 24 | 171 |
| 11 | 9.63 | 131 | 14.6 | 14.6 | 3.48 | 44.6 | 20 | 176 |
| 12 | 8.97 | 116 | 13.4 | 13.9 | 3.46 | 43.8 | 21 | 171 |
| 13 | 8.82 | 108 | 13.1 | 13.9 | 3.14 | 47.6 | 17 | 182 |
| 14 | 9.10 | 113 | 13.6 | 14.1 | 3.01 | 44.3 | 17 | 178 |
| 15 | 8.03 | 91 | 12.6 | 13.1 | 2.18 | 36.3 | 12 | 179 |
| Mean Value | 10.3 | 121.4 | 14.5 | 15.2 | 3.4 | 46.2 | 20.9 | 171.9 |
| SD a | 1.2 | 17.4 | 1.5 | 1.2 | 0.5 | 4.9 | 4.4 | 11.0 |
| Median | 10.10 | 123.00 | 14.60 | 15.10 | 3.45 | 44.59 | 22.00 | 175.00 |
Publisher’s Note: MDPI stays neutral with regard to jurisdictional claims in published maps and institutional affiliations. |
© 2022 by the authors. Licensee MDPI, Basel, Switzerland. This article is an open access article distributed under the terms and conditions of the Creative Commons Attribution (CC BY) license (https://creativecommons.org/licenses/by/4.0/).
Share and Cite
Tomovic, M.; Toliopoulos, A.; Koutlianos, N.; Dalkiranis, A.; Bubanj, S.; Deligiannis, A.; Kouidi, E. Correlation between Cardiopulmonary Indices and Running Performance in a 14.5 km Endurance Running Event. Int. J. Environ. Res. Public Health 2022, 19, 12289. https://doi.org/10.3390/ijerph191912289
Tomovic M, Toliopoulos A, Koutlianos N, Dalkiranis A, Bubanj S, Deligiannis A, Kouidi E. Correlation between Cardiopulmonary Indices and Running Performance in a 14.5 km Endurance Running Event. International Journal of Environmental Research and Public Health. 2022; 19(19):12289. https://doi.org/10.3390/ijerph191912289
Chicago/Turabian StyleTomovic, Milena, Alexandros Toliopoulos, Nikolaos Koutlianos, Anastasios Dalkiranis, Sasa Bubanj, Asterios Deligiannis, and Evangelia Kouidi. 2022. "Correlation between Cardiopulmonary Indices and Running Performance in a 14.5 km Endurance Running Event" International Journal of Environmental Research and Public Health 19, no. 19: 12289. https://doi.org/10.3390/ijerph191912289
APA StyleTomovic, M., Toliopoulos, A., Koutlianos, N., Dalkiranis, A., Bubanj, S., Deligiannis, A., & Kouidi, E. (2022). Correlation between Cardiopulmonary Indices and Running Performance in a 14.5 km Endurance Running Event. International Journal of Environmental Research and Public Health, 19(19), 12289. https://doi.org/10.3390/ijerph191912289