
Internet Use and Job Satisfaction: Evidence from China


Abstract
1. Introduction
2. Theoretical Analysis and Research Hypotheses
3. Dataset and Empirical Strategy
3.1. Data Source and Variable Description
3.2. Model Settings
4. Empirical Results
4.1. Baseline Regression Result
4.2. Heterogeneity Analysis
4.3. Robustness Checks
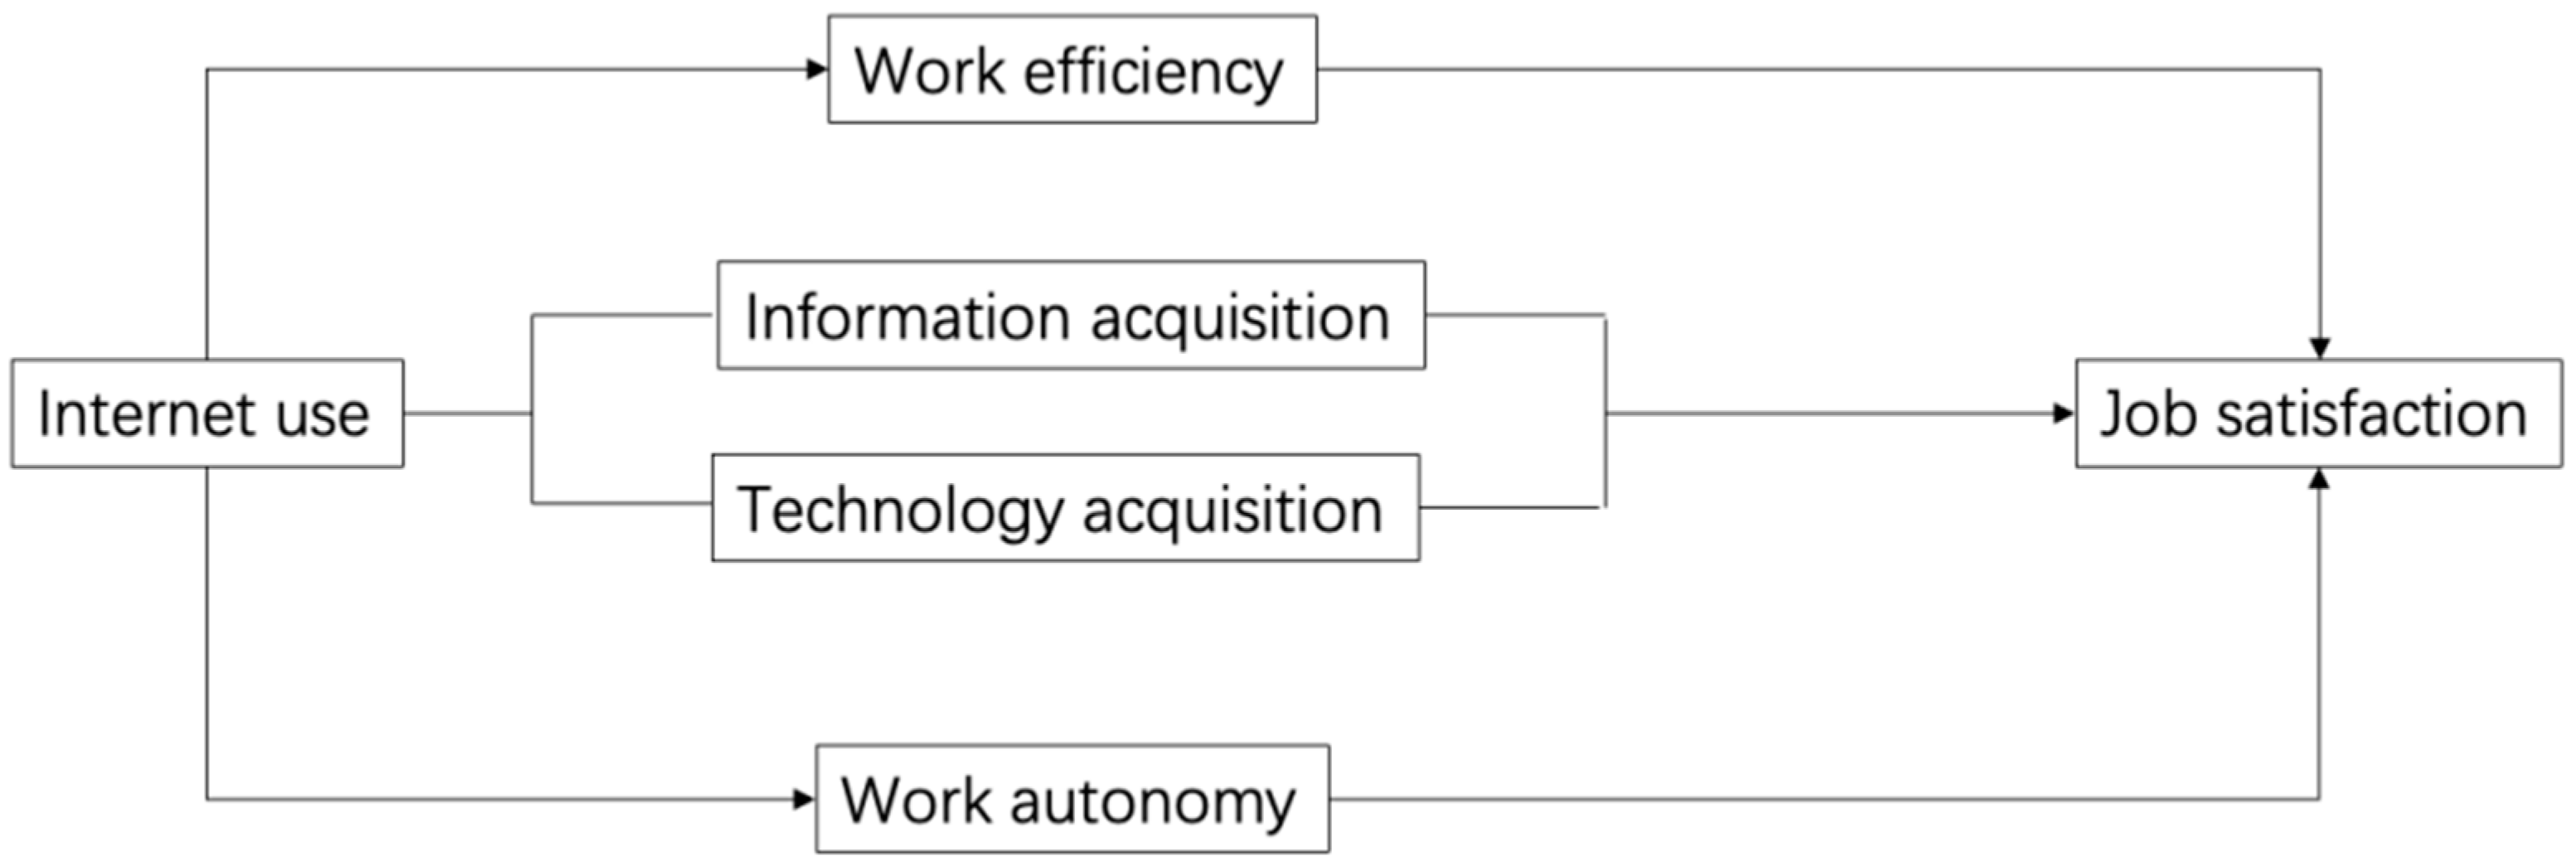
5. Mechanism Analysis
5.1. Internet Use, Work Efficiency and Job Satisfaction
5.2. Internet Use, Job Autonomy, and Job Satisfaction
6. Conclusions
Author Contributions
Funding
Institutional Review Board Statement
Informed Consent Statement
Data Availability Statement
Acknowledgments
Conflicts of Interest
References
- Thorndike, E.L. The curve of work and the curve of satisfyingness. J. Appl. Psychol. 1917, 1, 265. [Google Scholar] [CrossRef]
- Alzalabani, A.H. A study on perception of quality of work life and job satisfaction: Evidence from Saudi Arabia. Arab. J. Bus. Manag. Rev. 2017, 7, 2. [Google Scholar]
- Castellacci, F.; Viñas-Bardolet, C. Internet use and job satisfaction. Comput. Hum. Behav. 2019, 90, 141–152. [Google Scholar] [CrossRef]
- Ockenfels, A.; Sliwka, D.; Werner, P. Bonus payments and reference point violations. Manag. Sci. 2015, 61, 1496–1513. [Google Scholar] [CrossRef]
- Colbert, A.E.; Bono, J.E.; Purvanova, R.K. Flourishing via workplace relationships: Moving beyond instrumental support. Acad. Manag. J. 2016, 59, 1199–1223. [Google Scholar] [CrossRef]
- Freeman, R.B. Job Satisfaction as an Economic Variable; National Bureau of Economic Research: Cambridge, MA, USA, 1977. [Google Scholar]
- Huang, H.; Xia, X.; Zhao, W.; Pan, X.; Zhou, X. Overwork, job embeddedness and turnover intention among Chinese knowledge workers. Asia Pac. J. Hum. Resour. 2021, 59, 442–459. [Google Scholar] [CrossRef]
- Chen, Y.; Mao, Z.; Qiu, J.L. Super-Sticky WeChat and Chinese Society; Emerald Group Publishing: Somerville, MA, USA, 2018. [Google Scholar]
- China Internet Network Information Center (CNNIC). The 47th Statistical Report on Internet Development in China. Available online: http://www.cnnic.cn/hlwfzyj/hlwxzbg/hlwtjbg/202102/t20210203_71361.htm (accessed on 21 September 2022). (In Chinese)
- Agypt, B.; Rubin, B.A. Time in the new economy: The impact of the interaction of individual and structural temporalities on job satisfaction. J. Manag. Stud. 2012, 49, 403–428. [Google Scholar] [CrossRef]
- Sabatini, F.; Sarracino, F. Online networks and subjective well-being. Kyklos 2017, 70, 456–480. [Google Scholar] [CrossRef]
- Beaudry, A.; Pinsonneault, A. Understanding user responses to information technology: A coping model of user adaptation. MIS Q. 2005, 29, 493–524. [Google Scholar] [CrossRef]
- Seashore, S.E.; Taber, T.D. Job satisfaction indicators and their correlates. Am. Behav. Sci. 1975, 18, 333–368. [Google Scholar] [CrossRef]
- Ball, R.; Chernova, K. Absolute income, relative income, and happiness. Soc. Indic. Res. 2008, 88, 497–529. [Google Scholar] [CrossRef]
- Giannikis, S.K.; Mihail, D.M. Modelling job satisfaction in low-level jobs: Differences between full-time and part-time employees in the Greek retail sector. Eur. Manag. J. 2011, 29, 129–143. [Google Scholar] [CrossRef]
- Nie, P.; Sousa-Poza, A.; Nimrod, G. Internet use and subjective well-being in China. Soc. Indic. Res. 2017, 132, 489–516. [Google Scholar] [CrossRef]
- Fiorillo, D.; Nappo, N. Job satisfaction in Italy: Individual characteristics and social relations. Int. J. Soc. Econ. 2014, 41, 683–704. [Google Scholar] [CrossRef]
- Castellacci, F.; Tveito, V. Internet use and well-being: A survey and a theoretical framework. Res. Policy 2018, 47, 308–325. [Google Scholar] [CrossRef]
- Charoensukmongkol, P. Effects of support and job demands on social media use and work outcomes. Comput. Hum. Behav. 2014, 36, 340–349. [Google Scholar] [CrossRef]
- Natalia, V.E.D.; Pratama, A.O.; Astuti, M.D. Relationship between Quality of Work Life and Job Satisfaction in Asia: A Literature Review. J. Bus. Manag. Rev. 2020, 1, 390–412. [Google Scholar] [CrossRef]
- Zhang, H.; Wang, H.; Yan, H.; Wang, X. Impact of Internet Use on Mental Health among Elderly Individuals: A Difference-in-Differences Study Based on 2016–2018 CFPS Data. Int. J. Environ. Res. Public Health 2021, 19, 101. [Google Scholar] [CrossRef]
- Yufei, M.; Xiangquan, Z.; Wenxin, H. Does Internet Usage Reduce the Gender Wage Gap? Empirical Analysis based on CFPS Data. J. Financ. Econ. 2018, 44, 33–45. [Google Scholar]
- Cao, D.; Zhou, Z.; Liu, G.; Shen, C.; Ren, Y.; Zhao, D.; Zhao, Y.; Deng, Q.; Zhai, X. Does social capital buffer or exacerbate mental health inequality? Evidence from the China Family Panel Study (CFPS). Int. J. Equity Health 2022, 21, 75. [Google Scholar] [CrossRef]
- Xie, Y.; Zhang, X.; Xu, Q.; Zhang, C. Short-term trends in China’s income inequality and poverty: Evidence from a longitudinal household survey. China Econ. J. 2015, 8, 235–251. [Google Scholar] [CrossRef] [PubMed]
- Lohmann, S. Information technologies and subjective well-being: Does the Internet raise material aspirations? Oxf. Econ. Pap. 2015, 67, 740–759. [Google Scholar] [CrossRef]
- Krimsky, S. Risk communication in the internet age: The rise of disorganized skepticism. Environ. Hazards 2007, 7, 157–164. [Google Scholar] [CrossRef]
- Bloom, N.; Liang, J.; Roberts, J.; Ying, Z.J. Does working from home work? Evidence from a Chinese experiment. Q. J. Econ. 2015, 130, 165–218. [Google Scholar] [CrossRef]
- Collins, J.H. The benefits and limitations of telecommuting. Def. AR J. 2009, 16, 55. [Google Scholar]
- Grant, C.A.; Wallace, L.M.; Spurgeon, P.C.; Tramontano, C.; Charalampous, M. Construction and initial validation of the E-Work Life Scale to measure remote e-working. Empl. Relat. 2019, 41, 16–33. [Google Scholar] [CrossRef]
- Barrero, J.M.; Bloom, N.; Davis, S.J. Why Working from Home Will Stick; National Bureau of Economic Research: Cambridge, MA, USA, 2021. [Google Scholar]
- Vyas, L.; Butakhieo, N. The impact of working from home during COVID-19 on work and life domains: An exploratory study on Hong Kong. Policy Des. Pract. 2021, 4, 59–76. [Google Scholar] [CrossRef]
- Gibbs, M.; Mengel, F.; Siemroth, C. Work from Home & Productivity: Evidence from Personnel & Analytics Data on IT Professionals; Working Paper No. 2021-56; University of Chicago, Becker Friedman Institute for Economics: Chicago, IL, USA, 2021. [Google Scholar]
- Carlson, J.R.; Carlson, D.S.; Zivnuska, S.; Harris, R.B.; Harris, K.J. Applying the job demands resources model to understand technology as a predictor of turnover intentions. Comput. Hum. Behav. 2017, 77, 317–325. [Google Scholar] [CrossRef]
- Askenazy, P.; Caroli, E. Innovative work practices, information technologies, and working conditions: Evidence for France. Industrial Relations. A J. Econ. Soc. 2010, 49, 544–565. [Google Scholar]
- Chung-Yan, G.A. The nonlinear effects of job complexity and autonomy on job satisfaction, turnover, and psychological well-being. J. Occup. Health Psychol. 2010, 15, 237. [Google Scholar] [CrossRef]
- Salvatori, A. Labour contract regulations and workers’ wellbeing: International longitudinal evidence. Labour Econ. 2010, 17, 667–678. [Google Scholar] [CrossRef]
- Pichler, F.; Wallace, C. What are the reasons for differences in job satisfaction across Europe? Individual, compositional, and institutional explanations. Eur. Sociol. Rev. 2009, 25, 535–549. [Google Scholar] [CrossRef]
- Lopes, H.; Lagoa, S.; Calapez, T. Work autonomy, work pressure, and job satisfaction: An analysis of European Union countries. Econ. Labour Relat. Rev. 2014, 25, 306–326. [Google Scholar] [CrossRef]
- Dolan, P.; Peasgood, T.; White, M. Do we really know what makes us happy? A review of the economic literature on the factors associated with subjective well-being. J. Econ. Psychol. 2008, 29, 94–122. [Google Scholar] [CrossRef]
- Dettling, L.J. Opting Back in: Home Internet Use and Female Labor Supply; Department of Economics, University of Maryland: College Park, MD, USA, 2012. [Google Scholar]
- Venkatesh, V.; Speier, C. Computer technology training in the workplace: A longitudinal investigation of the effect of mood. Organ. Behav. Hum. Decis. Processes 1999, 79, 1–28. [Google Scholar] [CrossRef] [PubMed]
- George, R.; Thomas, K.; Thyagarajan, S.; Jeyaseelan, L.; Peedicayil, A.; Jeyaseelan, V.; George, S.; the STD Study Group. Genital syndromes and syndromic management of vaginal discharge in a community setting. Int. J. STD AIDS 2004, 15, 367–370. [Google Scholar] [CrossRef]
- Robertson, B.W.; Kee, K.F. Social media at work: The roles of job satisfaction, employment status, and Facebook use with co-workers. Comput. Hum. Behav. 2017, 70, 191–196. [Google Scholar] [CrossRef]
- Messinis, G. Returns to education and urban-migrant wage differentials in China: IV quantile treatment effects. China Econ. Rev. 2013, 26, 39–55. [Google Scholar] [CrossRef]
- Ma, X. Labor market segmentation by industry sectors and wage gaps between migrants and local urban residents in urban China. China Econ. Rev. 2018, 47, 96–115. [Google Scholar] [CrossRef]
- Salanova, M.; Cifre, E.; Martin, P. Information technology implementation styles and their relation with workers’ subjective well-being. Int. J. Oper. Prod. Manag. 2004, 24, 42–54. [Google Scholar] [CrossRef]
- Zhu, R. Wage differentials between urban residents and rural migrants in urban China during 2002–2007: A distributional analysis. China Econ. Rev. 2016, 37, 2–14. [Google Scholar] [CrossRef]
- Matanda, M.; Jenvey, V.B.; Phillips, J.G. Internet use in adulthood: Loneliness, computer anxiety and education. Behav. Chang. 2004, 21, 103–114. [Google Scholar] [CrossRef]
- Galanti, T.; Guidetti, G.; Mazzei, E.; Zappalà, S.; Toscano, F. Work from home during the COVID-19 outbreak: The impact on employees’ remote work productivity, engagement, and stress. J. Occup. Environ. Med. 2021, 63, e426. [Google Scholar] [CrossRef] [PubMed]
- Mohammed, Z.; Nandwani, D.; Saboo, A.; Padakannaya, P. Job satisfaction while working from home during the COVID-19 pandemic: Do subjective work autonomy, work-family conflict, and anxiety related to the pandemic matter? Cogent Psychol. 2022, 9, 2087278. [Google Scholar] [CrossRef]


| Variable | Mean | Standard Deviation | Minimum | Maximum Value |
|---|---|---|---|---|
| Individual Level | ||||
| Job Satisfaction | 3.489 | 0.900 | 1 | 5 |
| Internet Use (Yes = 1) | 0.364 | 0.481 | 0 | 1 |
| Age | 45.004 | 17.423 | 9 | 64 |
| Urban (yes = 1) | 0.271 | 0.444 | 0 | 1 |
| Male (Yes = 1) | 0.496 | 0.500 | 0 | 1 |
| Marriage (Yes = 1) | 0.775 | 0.418 | 0 | 1 |
| Years of Education | 7.265 | 4.880 | 0 | 23 |
| State of Health | 3.790 | 1.286 | 1 | 5 |
| Popularity at Work | 3.934 | 0.307 | 1 | 4 |
| Family Level | ||||
| Household Income | 10.554 | 1.051 | 0 | 15.936 |
| Family Size | 4.330 | 1.970 | 1 | 26 |
| Family Property (Yes = 1) | 0.178 | 0.383 | 0 | 1 |
| Number of Children in the Family | 1.252 | 1.083 | 0 | 10 |
| Intervening variable | ||||
| Work Efficiency | 37.423 | 25.314 | 0.1 | 168 |
| Autonomy | 0.345 | 0.475 | 0 | 1 |
| Dep = Job Satisfaction | Full Sample | Full Sample | Full Sample |
|---|---|---|---|
| (1) | (2) | (3) | |
| Internet Use | 0.193 *** (0.002) | 0.194 *** (0.002) | 0.032 *** (0.0118) |
| Age | −0.004 * (0.002) | ||
| Age Squared | 0.0002 *** (0.0002) | ||
| Gender | −0.044 *** (0.008) | ||
| Marital Status | 0.008 (0.013) | ||
| Years of Education | −0.001 (0.001) | ||
| State of Health | −0.103 *** (0.004) | ||
| Popularity | 0.047 ** (0.023) | ||
| Household Income | 0.040 *** (0.005) | ||
| Family Size | −0.013 *** (0.002) | ||
| Family Property | 0.030 *** (0.011) | ||
| Number of Children in the Family | −0.020 *** (0.006) | ||
| Individual Fixed Effects | No | Yes | Yes |
| County-Year Fixed Effect | No | No | Yes |
| Number of Samples | 83,012 | 83,012 | 83,012 |
| Pseudo R-Squared | 0.116 | 0.122 | 0.056 |
| Dep = Job Satisfaction | Urban Worker | Rural Worker |
|---|---|---|
| (1) | (2) | |
| Internet Use | 0.116 ** (0.056) | 0.042 (0.032) |
| Control Variables | Yes | Yes |
| Individual Fixed Effects | Yes | Yes |
| County-Year Fixed Effect | Yes | Yes |
| Number of Samples | 37,399 | 45,613 |
| Pseudo R-Squared | 0.103 | 0.102 |
| Dep = Job Satisfaction | Income Status Very Low | Income Status Lower | Income Status Medium | Income Status Higher | Income Status Very High |
|---|---|---|---|---|---|
| (1) | (2) | (3) | (4) | (5) | |
| Internet Use | −0.167 ** (0.031) | 0.041 ** (0.017) | 0.045 ** (0.022) | 0.093 ** (0.046) | −0.076 (0.090) |
| Control Variables | Yes | Yes | Yes | Yes | Yes |
| Individual Fixed Effects | Yes | Yes | Yes | Yes | Yes |
| County-Year Fixed Effect | Yes | Yes | Yes | Yes | Yes |
| Number of Samples | 7488 | 21,912 | 37,144 | 10,668 | 5800 |
| Pseudo R-Squared | 0.105 | 0.102 | 0.126 | 0.125 | 0.072 |
| Dep = Job Satisfaction | Elementary School and Below | Middle School | College and Above |
|---|---|---|---|
| (1) | (2) | (3) | |
| Internet Use | −0.043 (0.057) | 0.018 (0.033) | 0.191 * (0.108) |
| Control Variables | Yes | Yes | Yes |
| Individual Fixed Effects | Yes | Yes | Yes |
| County-Year Fixed Effect | Yes | Yes | Yes |
| Number of Samples | 32,176 | 33,889 | 16,947 |
| Pseudo R-Squared | 0.131 | 0.124 | 0.121 |
| Dep = Job Satisfaction | OLS | Reduced Form | 2SLS Second Stage |
|---|---|---|---|
| (1) | (2) | (3) | |
| Internet Use | 0.032 *** (0.012) | 2.611 ** (1.063) | |
| First Stage: Internet Use | |||
| Length of Optical Cable | 0.156 *** (0.043) | 0.061 *** (0.018) | |
| F Value in the First Stage | 875.16 | ||
| Control Variables | Yes | Yes | Yes |
| Individual Fixed Effects | Yes | Yes | Yes |
| County-Year Fixed Effect | Yes | Yes | Yes |
| Number of Samples | 83,012 | 83,012 | 83,012 |
| Adj R-Squared | 0.056 | 0.155 | 0.486 |
| Matching Method | Outcome Variable | Treatment Group | Group | ATT | Standard Error | T Value |
|---|---|---|---|---|---|---|
| Full Sample | ||||||
| One-to-One Nearest Neighbor Matching | Internet Use | 3.394 | 3.358 | 0.036 | 0.027 | 2.31 |
| Radius Match | Internet Use | 3.394 | 3.347 | 0.047 | 0.024 | 2.04 |
| Urban Labor | ||||||
| One-to-One Nearest Neighbor Matching | Internet Use | 3.492 | 3.440 | 0.052 | 0.059 | 2.19 |
| Radius Match | Internet Use | 3.492 | 3.467 | 0.025 | 0.051 | 2.01 |
| Rural Labor | ||||||
| One-to-One Nearest Neighbor Matching | Internet Use | 3.347 | 3.346 | 0.001 | 0.131 | 2.05 |
| Radius Match | Internet Use | 3.347 | 3.332 | 0.016 | 0.103 | 2.32 |
| Dep = Job Satisfaction | Full Sample | Urban Labor | Rural Labor | |||
|---|---|---|---|---|---|---|
| O-Logit | 2SLS | O-Logit | 2SLS | O-Logit | 2SLS | |
| (1) | (2) | (3) | (4) | (5) | (6) | |
| Internet Use | 0.088 *** (0.036) | 1.155 *** (0.310) | 0.104 *** (0.075) | 1.125 ** (0.580) | 0.068 (0.046) | 1.154 (0.462) |
| Control Variables | Yes | Yes | Yes | Yes | Yes | Yes |
| Individual Fixed Effects | Yes | Yes | Yes | Yes | Yes | Yes |
| County-Year Fixed Effect | Yes | Yes | Yes | Yes | Yes | Yes |
| Number of Samples | 58,056 | 58,056 | 20,924 | 20,924 | 37,132 | 37,132 |
| R-Squared | 0.030 | 0.453 | 0.149 | 0.432 | 0.103 | 0.403 |
| Cragg–Donald Wald F | 80.781 *** | 16.578 *** | 46.680 *** | |||
| Dep = Job Satisfaction | Full Sample | Urban Laborer | Rural Laborer | |||
|---|---|---|---|---|---|---|
| O-Logit | 2SLS | O-Logit | 2SLS | O-Logit | 2SLS | |
| (1) | (2) | (3) | (4) | (5) | (6) | |
| Importance of Internet Use | 0.841 *** (0.049) | 4.160 *** (0.142) | 0.632 *** (0.092) | 0.750 *** (0.277) | 0.907 (0.066) | 1.406 (0.274) |
| Control Variables | Yes | Yes | Yes | Yes | Yes | Yes |
| Individual Fixed Effects | Yes | Yes | Yes | Yes | Yes | Yes |
| County-Year Fixed Effect | Yes | Yes | Yes | Yes | Yes | Yes |
| Number of Samples | 58,056 | 58,056 | 20,924 | 20,924 | 37,132 | 37,132 |
| R-Squared | 0.127 | 0.452 | 0.134 | 0.495 | 0.131 | 0.464 |
| Cragg–Donald Wald F | 17.368 *** | 91.880 *** | 40.354 *** | |||
| Dep = | Job Satisfaction | Work Efficiency | Job Satisfaction |
|---|---|---|---|
| O-Logit | OLS | O-Logit | |
| (1) | (2) | (3) | |
| Internet Use | 0.032 *** (0.012) | −0.124 *** (0.032) | 0.079 *** (0.034) |
| Work Efficiency | −0.003 *** (0.001) | ||
| Control Variables | Yes | Yes | Yes |
| Individual Fixed Effects | Yes | Yes | Yes |
| County-Year Fixed Effect | Yes | Yes | Yes |
| Number of Samples | 83,012 | 83,012 | 83,012 |
| R-Squared | 0.056 | 0.124 | 0.126 |
| Dep = | Job Satisfaction | Autonomy | Job Satisfaction |
|---|---|---|---|
| O-Logit | OLS | O-Logit | |
| (1) | (2) | (3) | |
| Internet Use | 0.032 *** (0.012) | 0.006 *** (0.010) | 0.161 *** (0.032) |
| Work Autonomy | 0.054 *** (0.041) | ||
| Control Variables | Yes | Yes | Yes |
| Individual Fixed Effects | Yes | Yes | Yes |
| County-Year Fixed Effect | Yes | Yes | Yes |
| Number of Samples | 83,012 | 83,012 | 83,012 |
| R-Squared | 0.056 | 0.107 | 0.121 |
Publisher’s Note: MDPI stays neutral with regard to jurisdictional claims in published maps and institutional affiliations. |
© 2022 by the authors. Licensee MDPI, Basel, Switzerland. This article is an open access article distributed under the terms and conditions of the Creative Commons Attribution (CC BY) license (https://creativecommons.org/licenses/by/4.0/).
Share and Cite
Zhou, D.; Yang, S.; Li, X. Internet Use and Job Satisfaction: Evidence from China. Int. J. Environ. Res. Public Health 2022, 19, 12157. https://doi.org/10.3390/ijerph191912157
Zhou D, Yang S, Li X. Internet Use and Job Satisfaction: Evidence from China. International Journal of Environmental Research and Public Health. 2022; 19(19):12157. https://doi.org/10.3390/ijerph191912157
Chicago/Turabian StyleZhou, Dan, Sibo Yang, and Xue Li. 2022. "Internet Use and Job Satisfaction: Evidence from China" International Journal of Environmental Research and Public Health 19, no. 19: 12157. https://doi.org/10.3390/ijerph191912157
APA StyleZhou, D., Yang, S., & Li, X. (2022). Internet Use and Job Satisfaction: Evidence from China. International Journal of Environmental Research and Public Health, 19(19), 12157. https://doi.org/10.3390/ijerph191912157