
Time to Diagnosis and Treatment of Diabetes Mellitus among Korean Adults with Hyperglycemia: Using a Community-Based Cohort Study


Abstract
1. Introduction
2. Methods
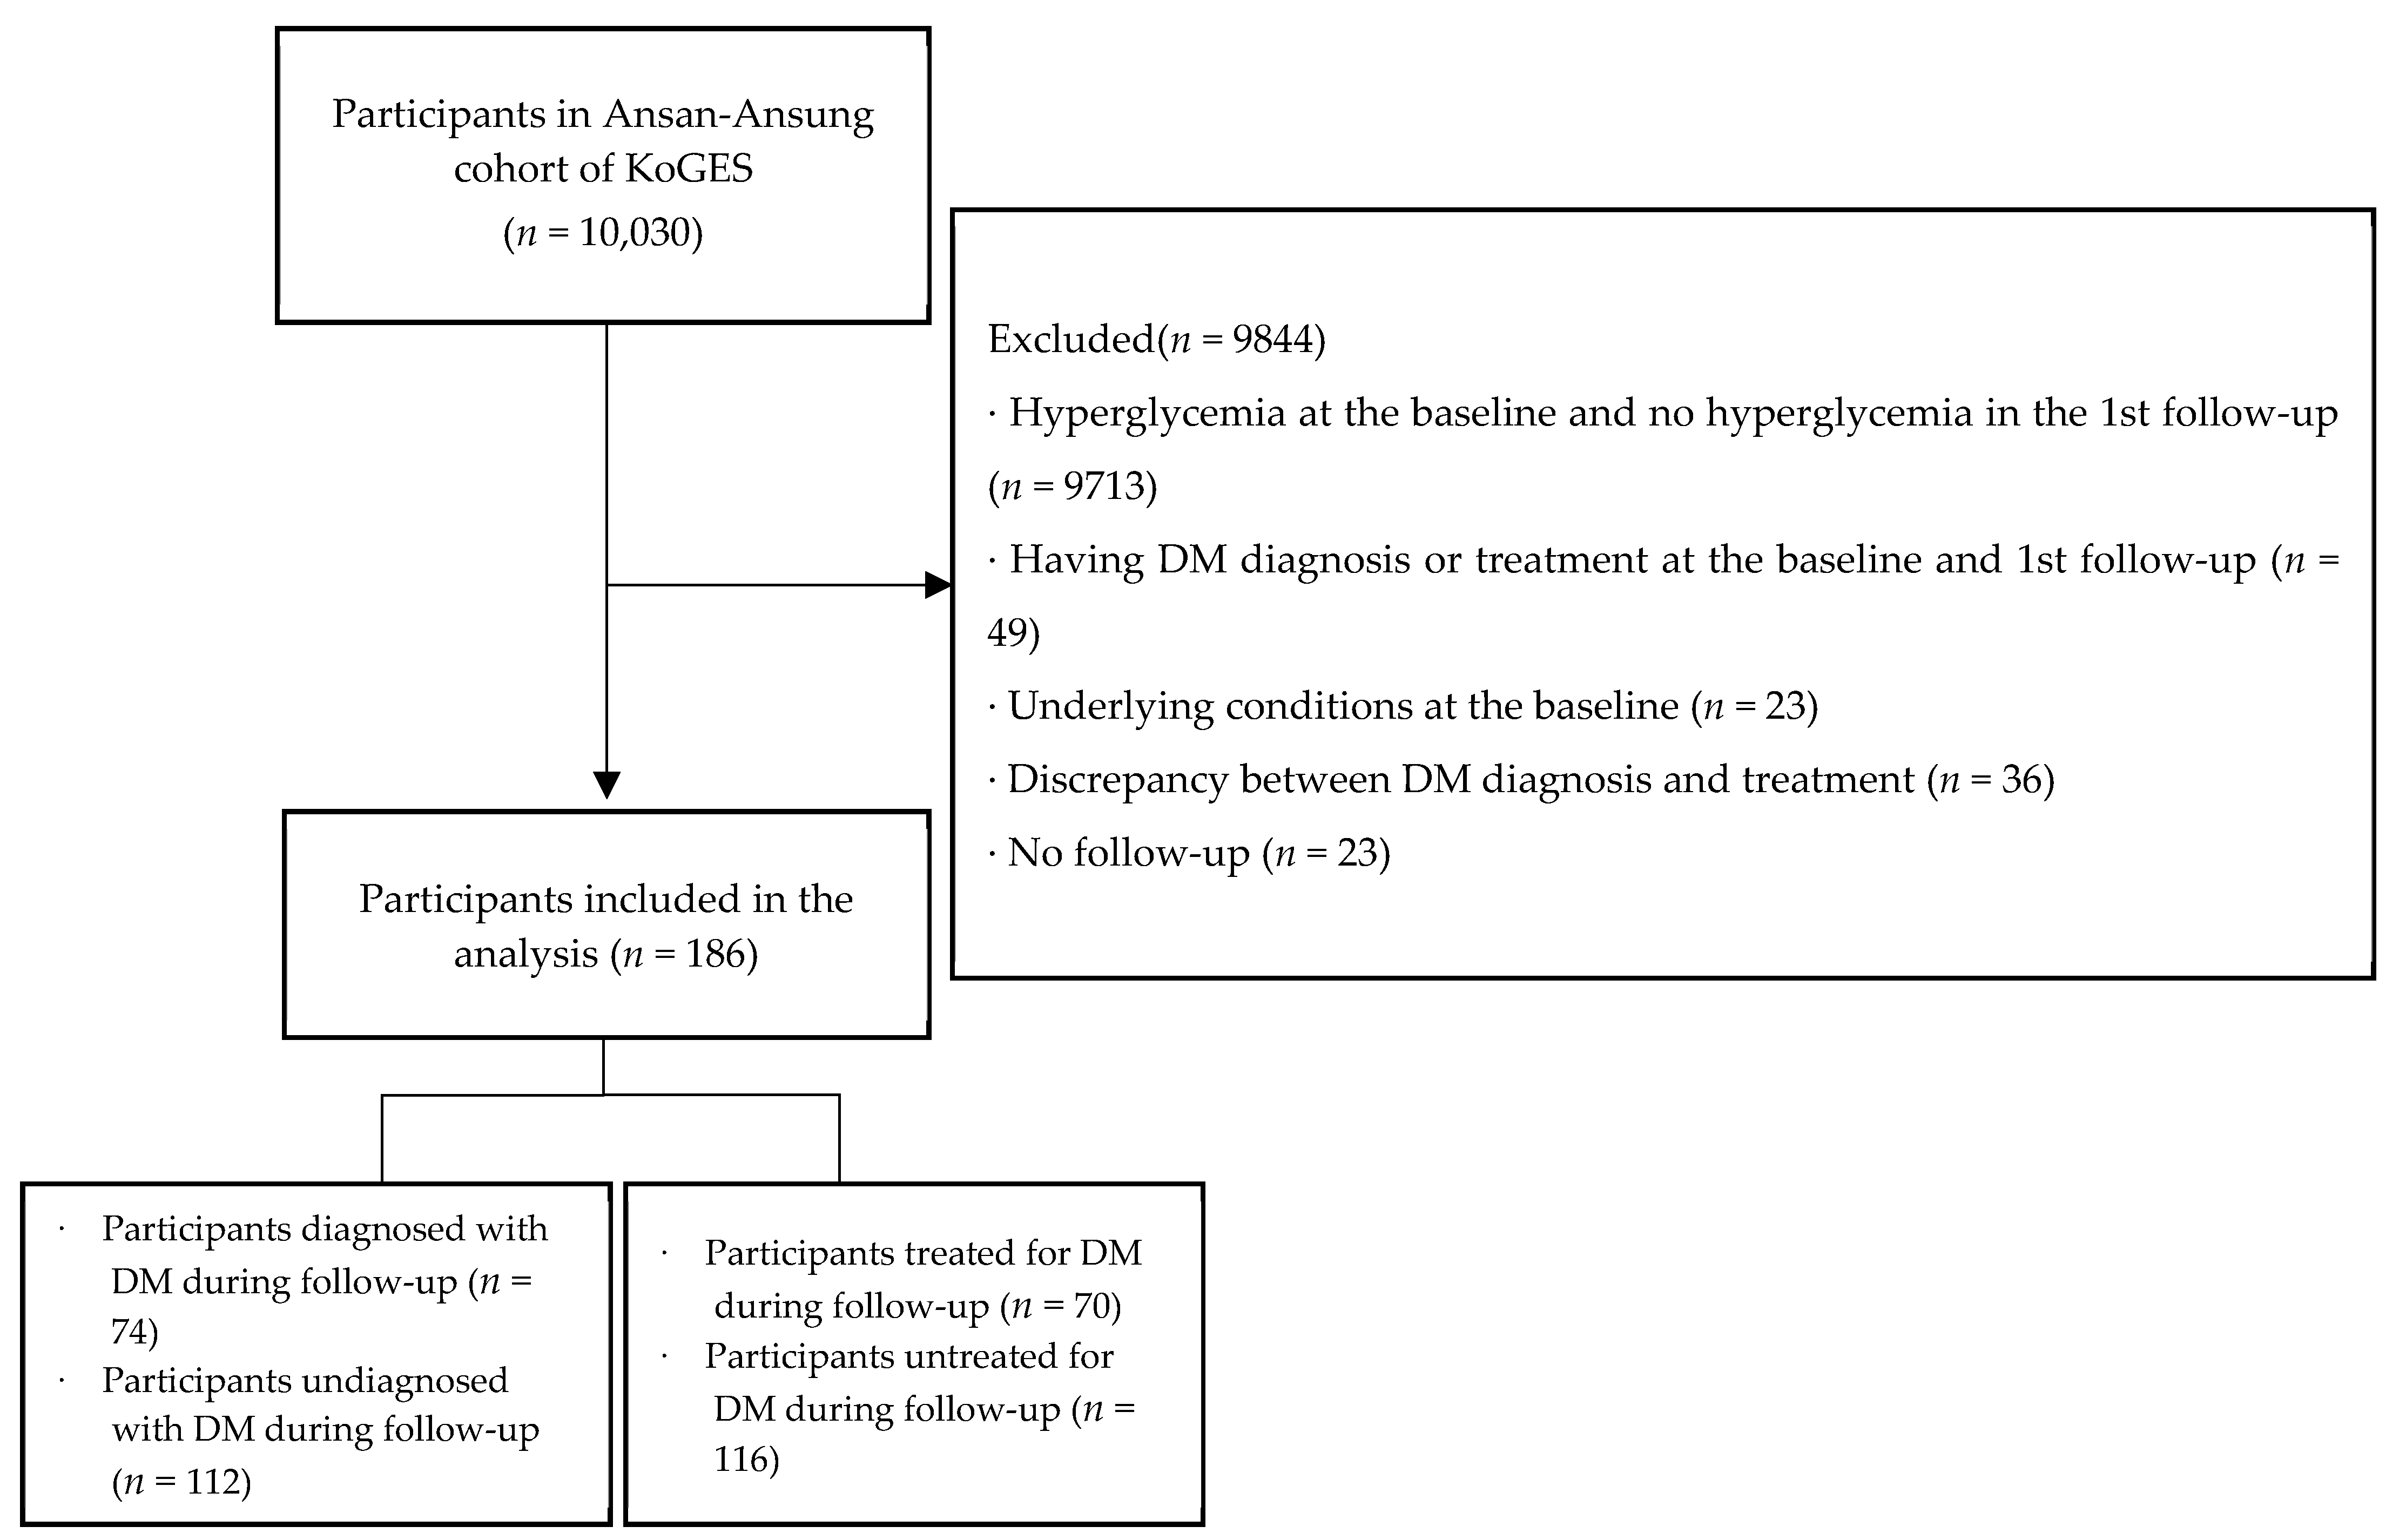
2.1. Participants
2.2. Variables and Definitions
2.2.1. Participant Characteristics
2.2.2. Time to Diagnosis and Treatment of DM
2.2.3. Prevalence of Comorbidities and Complications of DM at Diagnosis and Treatment of DM
2.3. Data Analysis
3. Results
3.1. Baseline Characteristics, and Diagnosis and Treatment Rates of DM
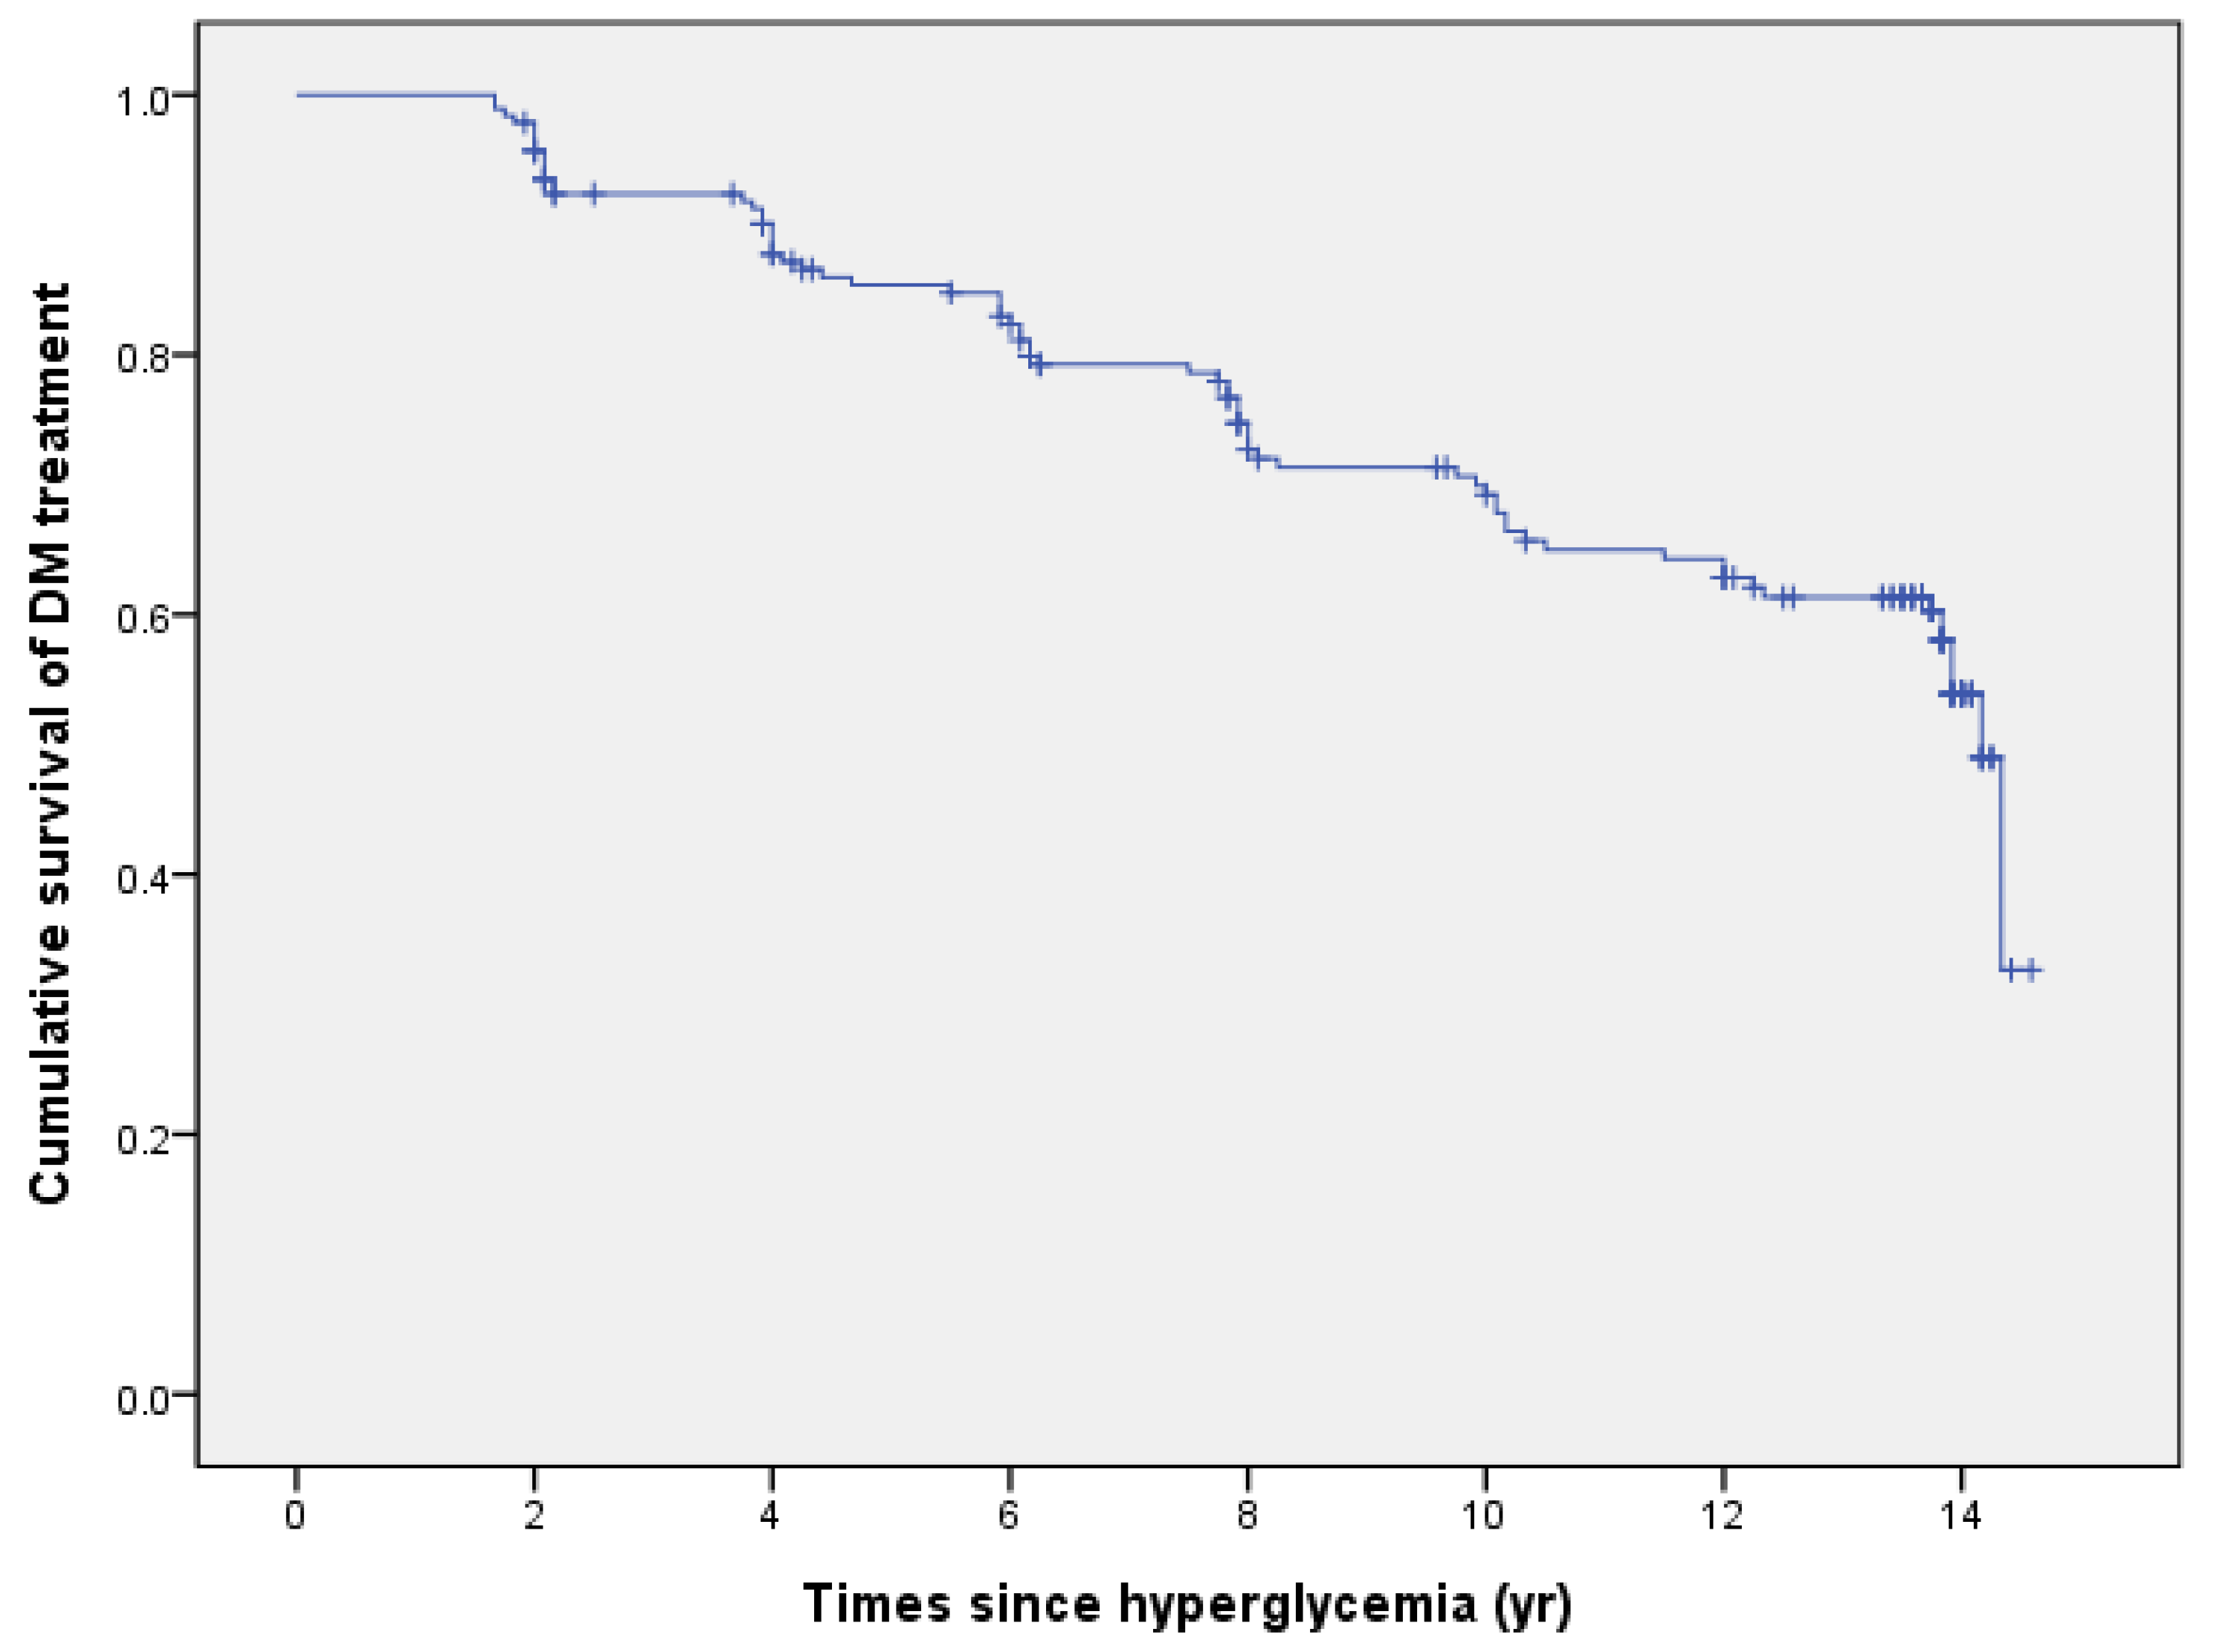
3.2. Time to Diagnosis and Treatment of DM
3.3. Risk Factors (Protective Factors) for DM Diagnosis and Treatment
3.4. Prevalence of Comorbidities and Complications of DM at Diagnosis and Treatment
4. Discussion
5. Conclusions
Author Contributions
Funding
Institutional Review Board Statement
Informed Consent Statement
Data Availability Statement
Conflicts of Interest
References
- The Korean Association of Internal Medicine (KAIM). Clinical Practice Guideline for Physicians (3rd). 2007. Available online: https://kaim.or.kr/major/file/04.pdf (accessed on 8 September 2021).
- International Diabetes Federation (IDF). IDF Diabetes Atlas 9th Edition 2019. 2019. Available online: https://diabetesatlas.org/atlas/ninth-edition/ (accessed on 23 September 2021).
- Ministry of Health & Welfare (MHW) & Korea Disease Control and Prevention Agency (KDCA). 2019 National Health Statistics: Korea National Health & Nutrition Examination Survey Ⅷ-1. 2019. Available online: https://knhanes.kdca.go.kr/knhanes/sub04/sub04_04_01.do (accessed on 15 December 2021).
- Kim, S.M.; Kim, Y.I. 2019 National Health Insurance Statistical Yearbook. 2020. Available online: http://www.hira.or.kr/bbsDummy.do?pgmid=HIRAA020045020000 (accessed on 15 December 2021).
- Yoon, J.; Oh, I.-H.; Seo, H.; Kim, E.-J.; Gong, Y.-H.; Ock, M.; Lim, D.; Lee, W.K.; Lee, Y.-R.; Kim, D.; et al. Disability-adjusted Life Years for 313 Diseases and Injuries: The 2012 Korean Burden of Disease Study. J. Korean Med. Sci. 2016, 31, S146–S157. [Google Scholar] [CrossRef] [PubMed]
- Papatheodorou, K.; Banach, M.; Edmonds, M.; Papanas, N.; Papazoglou, D. Complications of diabetes. J. Diabetes Res. 2015, 2015, 189525. [Google Scholar] [CrossRef] [PubMed]
- Papatheodorou, K.; Banach, M.; Bekiari, E.; Rizzo, M.; Edmonds, M. Complications of diabetes 2017. J. Diabetes Res. 2018, 2018, 1–4. [Google Scholar] [CrossRef] [PubMed]
- Babel, R.A.; Dandekar, M.P. A review on cellular and molecular mechanisms linked to the development of diabetes complications. Curr. Diabetes Rev. 2021, 17, 457–473. [Google Scholar] [CrossRef] [PubMed]
- Hashimoto, K.; Urata, K.; Yoshida, A.; Horiuchi, R.; Yamaaki, N.; Yagi, K.; Arai, K. The relationship between patients’ perception of type 2 diabetes and medication adherence: A cross-sectional study in Japan. J. Pharm. Health Care Sci. 2019, 5, 1–10. [Google Scholar] [CrossRef]
- Ministry of Health & Welfare (MHW) & Korea Disease Control and Prevention Agency (KDCA). 2021 Integrated Health Promotion Project: Prevention and Control of Cardiovascular Diseases. 2021. Available online: https://www.kdca.go.kr/board/board.es?mid=a20507020000&bid=0019 (accessed on 15 December 2021).
- Jameson, J.L.; Kasper, D.L.; Longo, D.L.; Fauci, A.S.; Hauser, S.L.; Loscalzo, J. Harrisonʼs principles of Internal Medicine, 20th ed.; McGraw-Hill: New York, NY, USA, 2018. [Google Scholar]
- Korea Disease Control and Prevention Agency (KDCA). Status by Cohort. 2020. Available online: http://www.kdca.go.kr/contents.es?mid=a40504030900 (accessed on 15 December 2021).
- Kim, Y.; Han, B.G.; the KoGES group. Cohort profile: The Korean genome and Epidemiology Study (KoGES) consortium. Int. J. Epidemiol. 2017, 46, e20. [Google Scholar] [CrossRef] [PubMed]
- American Diabetes Association (ADA). 2. Classification and diagnosis of diabetes: Standards of medical care in diabetes—2018. Diabetes Care 2018, 41 (Suppl. 1), S13–S27. [Google Scholar] [CrossRef] [PubMed]
- Kerner, W.; Brückel, J. Definition, classification and diagnosis of diabetes mellitus. Exp. Clin. Endocrinol. Diabetes 2014, 122, 384–386. [Google Scholar] [CrossRef]
- Korean Medical Guideline Information Center (KMGIC). Evidence-Based Guideline for Type 2 Diabetes in Primary Care. 2020. Available online: https://www.guideline.or.kr/chronic/view.php?number=89 (accessed on 15 December 2021).
- Diabetes Canada Clinical Practice Guidelines Expert Committee; Punthakee, Z.; Goldenberg, R.; Katz, P. Definition, Classification and Diagnosis of Diabetes, Prediabetes and Metabolic Syndrome. Can. J. Diabetes 2018, 42, S10–S15. [Google Scholar] [CrossRef]
- Hu, M.; Wan, Y.; Yu, L.; Yuan, J.; Ma, Y.; Hou, B.; Jiang, X.; Shang, L. Prevalence, awareness and associated risk factors of diabetes among adults in Xi’an, China. Sci. Rep. 2017, 7, 1–9. [Google Scholar] [CrossRef]
- Jeong, I.S.; Kang, C.M. Level of and related factors to diabetes awareness among diabetic adults by gender: Based on data from the Korean National Health and Nutrition Examination Survey. Asian Nurs. Res. 2021, 15, 129–135. [Google Scholar] [CrossRef] [PubMed]
- Yen, S.T.; Tan, A.K.G.; Mustapha, F.I. Awareness of diabetes, hypertension, and hypercholesterolemia in Malaysia. J. Diabetes 2016, 9, 874–883. [Google Scholar] [CrossRef]
- World Health Organization (WHO). The Asia-Pacific Perspective: Redefining Obesity and Its Treatment. 2000. Available online: https://apps.who.int/iris/handle/10665/206936 (accessed on 7 September 2021).
- Boo, S.; Yoon, Y.J.; Oh, H. Evaluating the prevalence, awareness, and control of hypertension, diabetes, and dyslipidemia in Korea using the NHIS-NSC Database. Medicine 2018, 97, e13713. [Google Scholar] [CrossRef] [PubMed]
- Irazola, V.; Rubinstein, A.; Bazzano, L.; Calandrelli, M.; Chung-Shiuan, C.; Elorriaga, N.; Gutierrez, L.; Lanas, F.; Manfredi, J.A.; Mores, N.; et al. Prevalence, awareness, treatment and control of diabetes and impaired fasting glucose in the Southern Cone of Latin America. PLoS ONE 2017, 12, e0183953. [Google Scholar] [CrossRef]
- In, J.; Lee, D.K. Survival analysis: Part II – applied clinical data analysis. Korean J. Anesthesiol. 2019, 72, 441–457. [Google Scholar] [CrossRef]
- Centers for Disease Control and Prevention (CDC). National Diabetes Statistics Report 2020: Estimates of Diabetes and Its Burden in the United States. 2020. Available online: https://www.cdc.gov/diabetes/pdfs/data/statistics/national-diabetes-statistics-report.pdf (accessed on 19 March 2022).
- National Health Insurance Service (NHIS). Health Checkup: Introduction of the System. 2020. Available online: https://www.nhis.or.kr/nhis/policy/wbhada19700m01.do (accessed on 19 March 2022).
- Sabanayagam, C.; Banu, R.; Chee, M.L.; Lee, R.; Wang, Y.X.; Tan, G.; Jonas, J.B.; Lamoureux, E.L.; Cheng, C.-Y.; Klein, B.E.K.; et al. Incidence and progression of diabetic retinopathy: A systematic review. Lancet Diabetes Endocrinol. 2018, 7, 140–149. [Google Scholar] [CrossRef]
- Raman, R.; Ganesan, S.; Pal, S.S.; Gella, L.; Kulothungan, V.; Sharma, T. Incidence and Progression of Diabetic Retinopathy in Urban India: Sankara Nethralaya-Diabetic Retinopathy Epidemiology and Molecular Genetics Study (SN-DREAMS II), Report 1. Ophthalmic Epidemiol. 2017, 24, 294–302. [Google Scholar] [CrossRef] [PubMed]
- Varma, R.; Choudhury, F.; Klein, R.; Chung, J.; Torres, M.; Azen, S.P.; Los Angeles Latino Eye Study Group. Four-Year Incidence and Progression of Diabetic Retinopathy and Macular Edema: The Los Angeles Latino Eye Study. Am. J. Ophthalmol. 2010, 149, 752–761. [Google Scholar] [CrossRef] [PubMed]
- Xu, J.; Xu, L.; Wang, Y.X.; You, Q.S.; Jonas, J.B.; Bin Wei, W. Ten-Year Cumulative Incidence of Diabetic Retinopathy. The Beijing Eye Study 2001/2011. PLoS ONE 2014, 9, e111320. [Google Scholar] [CrossRef]
- Jinjuan, P.; Peng, J.; Zou, H.; Wang, W.; Fu, J.; Shen, B.; Bai, X.; Xuelin, B.; Zhang, X. The 5-Year Onset and Regression of Diabetic Retinopathy in Chinese Type 2 Diabetes Patients. PLoS ONE 2014, 9, e113359. [Google Scholar] [CrossRef]
- Jo, A.; Oh, H. Incidence of Colon Cancer Related to Cigarette Smoking and Alcohol Consumption in Adults with Metabolic Syndrome: Prospective Cohort Study. J. Korean Acad. Nurs. 2019, 49, 713–723. [Google Scholar] [CrossRef]
- Sagesaka, H.; Sato, Y.; Someya, Y.; Tamura, Y.; Shimodaira, M.; Miyakoshi, T.; Hirabayashi, K.; Koike, H.; Yamashita, K.; Watada, H.; et al. Type 2 Diabetes: When Does It Start? J. Endocr. Soc. 2018, 2, 476–484. [Google Scholar] [CrossRef] [PubMed]
- Laiteerapong, N.; Ham, S.A.; Gao, Y.; Moffet, H.H.; Liu, J.Y.; Huang, E.S.; Karter, A.J. The legacy effect in type 2 diabetes: Impact of early glycemic control on future complications (the diabetes & aging study). Diabetes Care 2018, 42, 416–426. [Google Scholar] [CrossRef] [PubMed]
- Rahman, M.S.; Akter, S.; Abe, S.K.; Islam, M.R.; Mondal, M.N.I.; Rahman, J.A.M.S.; Rahman, M.M. Awareness, Treatment, and Control of Diabetes in Bangladesh: A Nationwide Population-Based Study. PLoS ONE 2015, 10, e0118365. [Google Scholar] [CrossRef] [PubMed]
- Ferrannini, E.; Cushman, W.C. Diabetes and hypertension: The bad companions. Lancet 2012, 380, 601–610. [Google Scholar] [CrossRef]
- Bonafede, M.; Chandran, A.; DiMario, S.; Saltiel-Berzin, R.; Saliu, D. Medication usage, treatment intensification, and medical cost in patients with type 2 diabetes: A retrospective database study. BMJ Open Diabetes Res. Care 2016, 4, e000189. [Google Scholar] [CrossRef] [PubMed]
- Yue, J.; Mao, X.; Xu, K.; Lü, L.; Liu, S.; Chen, F.; Wang, J. Prevalence, Awareness, Treatment and Control of Diabetes Mellitus in a Chinese Population. PLoS ONE 2016, 11, e0153791. [Google Scholar] [CrossRef] [PubMed]
- Dajani, R.; Khader, Y.S.; Fatahallah, R.; El-Khateeb, M.; Shiyab, A.H.; Hakooz, N. Diabetes mellitus in genetically isolated populations in Jordan: Prevalence, awareness, glycemic control, and associated factors. J. Diabetes its Complicat. 2012, 26, 175–180. [Google Scholar] [CrossRef]
- Polsky, S.; Ellis, S.L. Obesity, insulin resistance, and type 1 diabetes mellitus. Curr. Opin. Endocrinol. Diabetes Obes. 2015, 22, 277–282. [Google Scholar] [CrossRef]
- Collison, K.S.; Zaidi, M.Z.; Subhani, S.N.; Al-Rubeaan, K.; Shoukri, M.; A Al-Mohanna, F. Sugar-sweetened carbonated beverage consumption correlates with BMI, waist circumference, and poor dietary choices in school children. BMC Public Heal. 2010, 10, 234. [Google Scholar] [CrossRef]


| Characteristics | Total | DM Diagnosis among All | DM Treatment among All | ||||
|---|---|---|---|---|---|---|---|
| n (%) | M ± SD | n (%) | p | n (%) | p | ||
| Sex | Male | 106 (57.0) | 41 (55.4) | 0.723 | 39 (55.7) | 0.785 | |
| Female | 80 (43.0) | 33 (44.6) | 31 (44.3) | ||||
| Age (years) | 40–49 | 66 (35.5) | 55.08 ± 8.92 | 25 (33.8) | 0.049 | 24 (34.3) | 0.075 |
| 50–59 | 60 (32.3) | 31 (41.9) | 29 (41.4) | ||||
| 60–69 | 60 (32.3) | 18 (24.3) | 17 (24.3) | ||||
| Current alcohol use | No | 84 (45.2) | 31 (41.9) | 0.466 | 28 (40.0) | 0.272 | |
| Yes | 102 (54.8) | 43 (58.1) | 42 (60.0) | ||||
| Current smoking | No | 142 (76.3) | 55 (74.3) | 0.598 | 52 (74.3) | 0.608 | |
| Yes | 44 (23.7) | 19 (25.7) | 18 (25.7) | ||||
| Hypertension | No | 138 (74.2) | 50 (67.6) | 0.093 | 46 (65.7) | 0.040 | |
| Yes | 48 (25.8) | 24 (32.4) | 24 (34.3) | ||||
| Dyslipidemia | No | 182 (97.8) | 73 (98.6) | 0.541 | 69 (98.6) | 0.598 | |
| Yes | 4 (2.2) | 1 (1.4) | 1 (1.4) | ||||
| Family history of DM | No | 173 (93.0) | 64 (86.5) | 0.005 | 60 (85.7) | 0.002 | |
| Yes | 13 (7.0) | 10 (13.5) | 10 (14.3) | ||||
| Body mass index (kg/m2) | <25 | 85 (45.7) | 25.08 ± 3.37 | 21 (28.4) | <0.001 | 20 (28.6) | <0.001 |
| ≥25 | 101 (54.3) | 53 (71.6) | 50 (71.4) | ||||
| FBS (mg/dL) | <100 | 66 (35.5) | 112.4 ± 28.42 | 13 (17.6) | <0.001 | 11 (15.8) | <0.001 |
| 100–125 | 80 (43.0) | 41 (55.4) | 40 (57.1) | ||||
| ≥126 | 40 (21.5) | 20 (27.0) | 19 (27.1) | ||||
| PP2 (a) (mg/dL) | <140 | 16 (8.8) | 213.22 ± 50.26 | 4 (5.7) | 0.506 | 4 (6.1) | 0.468 |
| 140–199 | 8 (4.4) | 3 (4.3) | 2 (3.0) | ||||
| ≥200 | 158 (86.8) | 63 (90.0) | 60 (90.9) | ||||
| DM diagnosed | No | 112 (60.2) | - | - | |||
| Yes | 74 (39.8) | 74 (100.0) | - | ||||
| DM treated | No | 116 (62.4) | 4 (5.4) | - | |||
| Yes | 70 (37.6) | 70 (94.6) | - | ||||
| Duration (Years) | Time to DM dx from Hyperglycemia | Time to DM tx from Hyperglycemia | Time to DM tx from DM dx |
|---|---|---|---|
| For all participants | (n = 186) | (n = 186) | (n = 74) |
| < 2.0 | 7 (3.8) | 5 (2.7) | 63 (85.1) |
| 2.0–3.9 | 32 (17.2) | 26 (14.0) | 6 (8.1) |
| 4.0–5.9 | 17 (9.1) | 19 (10.2) | 1 (1.4) |
| 6.0–7.9 | 24 (12.9) | 25 (13.4) | 3 (4.1) |
| 8.0–9.9 | 11 (5.9) | 11 (5.9) | - |
| 10.0–11.9 | 9 (4.8) | 10 (5.4) | 1 (1.4) |
| ≥12.0 | 86 (46.2) | 90 (48.4) | - |
| M ± SE | 10.87 ± 0.36 | 11.34 ± 0.34 | 1.02 ± 0.28 |
| Median (95% CI) | 14.17 (13.92–14.42) | 14.17 (13.93–14.41) | - |
| For the DM diagnosed | (n = 74) | (n = 70) | (n = 70) |
| < 2.0 | 6 (8.1) | 4 (5.7) | 62 (88.6) |
| 2.0–3.9 | 21 (28.4) | 14 (20.0) | 5 (7.1) |
| 4.0–5.9 | 10 (13.5) | 12 (17.1) | 1 (1.4) |
| 6.0–7.9 | 14 (18.9) | 13 (18.6) | 2 (2.9) |
| 8.0–9.9 | 7 (9.5) | 7 (10.0) | - |
| 10.0–11.9 | 7 (9.5) | 8 (11.4) | - |
| ≥12 | 9 (12.2) | 12 (17.1) | - |
| M ± SE | 6.21 ± 0.45 | 7.06 ± 0.47 | 0.63 ± 0.18 |
| Median (95% CI) | 5.92 (4.16–7.67) | 6.17 (4.5–7.84) | - |
| Characteristics | Time to DM dx (a) (N = 186) | Time to DM tx (a) (N = 186) | Time from DM dx to DM tx (a) (N = 74) | |||||||
|---|---|---|---|---|---|---|---|---|---|---|
| M ± SE | MD (95% CI) | p | M ± SE | MD (95% CI) | p | M ± SE | MD (95% CI) | p | ||
| Sex | Male | 10.71 ± 0.50 | 0 (0–0) | 0.974 | 11.21 ± 0.46 | 0 (0–0) | 0.911 | 1.07 ± 0.32 | 0 (0–0) | 0.710 |
| Female | 11.06 ± 0.53 | 14.17 (13.74–14.59) | 11.48 ± 0.50 | 14.17 (13.74–14.59) | 0.98 ± 0.48 | 0 (0–0) | ||||
| Age (years) | 40–49 | 10.96 ± 0.60 | 14.33 (0–0) | 0.129 | 11.46 ± 0.54 | 14.33 (0–0) | 0.159 | 1.08 ± 0.38 | 0 (0–0) | 0.940 |
| 50–59 | 10.15 ± 0.62 | 12.5 (8.56–16.44) | 10.75 ± 0.59 | 13.83 (11.87–15.80) | 0.86 ± 0.38 | 0 (0–0) | ||||
| 60–69 | 11.40 ± 0.65 | 0 (0–0) | 11.73 ± 0.61 | 0 (0–0) | 1.00 ± 0.63 | 0 (0–0) | ||||
| Current alcohol use | No | 10.99 ± 0.55 | 14.33 (0–0) | 0.497 | 11.56 ± 0.50 | 14.33 (0–0) | 0.305 | 1.27 ± 0.54 | 0 (0–0) | 0.536 |
| Yes | 10.71 ± 0.48 | 14.17 (9.19–19.14) | 11.12 ± 0.45 | 13.92 (12.13–15.70) | 0.84 ± 0.28 | 0 (0–0) | ||||
| Current smoking | No | 11.17 ± 0.40 | 14.33 (13.85–14.81) | 0.116 | 11.52 ± 0.37 | 14.33 (13.85–14.81) | 0.127 | 0.81 ± 0.32 | 0 (0–0) | 0.178 |
| Yes | 9.62 ± 0.82 | 10.5 (0–0) | 10.40 ± 0.75 | 12.00 (8.65–15.35) | 1.70 ± 0.58 | 0 (0–0) | ||||
| Hypertension | No | 11.13 ± 0.40 | 14.33 (13.78–14.89) | 0.130 | 11.69 ± 0.36 | 14.33 (13.87–14.79) | 0.062 | 1.27 ± 0.40 | 0 (0–0) | 0.263 |
| Yes | 9.96±0.76 | 13.92 (9.29–18.54) | 10.23 ± 0.74 | 12.33 (9.24–15.43) | 0.55 ± 0.29 | 0 (0–0) | ||||
| Dyslipidemia | No | 10.80 ± 0.37 | 14.17 (13.92–14.42) | 0.417 | 11.28 ± 0.34 | 14.17 (13.93–14.41) | 0.459 | 1.04 ± 0.28 | 0 (0–0) | 0.557 |
| Yes | 13.44 ± 0.56 | 0 (0–0) | 13.44 ± 0.56 | 0 (0–0) | 0 ± 0 | 0 (0–0) | ||||
| Family history of DM | No | 11.02 ± 0.38 | 14.33 (13.65–15.01) | 0.034 | 11.42 ± 0.36 | 14.33 (13.65–15.01) | 0.046 | 0.94 ± 0.31 | 0 (0–0) | 0.362 |
| Yes | 9.42 ± 1.19 | 9.92 (4.93–14.91) | 10.75 ± 1.08 | 12.00 (9.46–14.54) | 1.75 ± 0.94 | 0 (0–0) | ||||
| BMI (kg/m2) | <25 | 12.15 ± 0.47 | 14.33 (10.39–18.28) | <0.001 | 12.42 ± 0.44 | 14.33 (11.08–17.58) | <0.001 | 0.83 ± 0.37 | 0 (0–0) | 0.999 |
| ≥25 | 9.77 ± 0.51 | 12.00 (8.69–15.31) | 10.40 ± 0.48 | 13.75 (11.58–15.92) | 1.04 ± 0.34 | 0 (0–0) | ||||
| FBS (mg/dL) | <100 | 12.45 ± 0.45 | - | <0.001 | 12.92 ± 0.37 | - | <0.001 | 2.27 ± 1.14 | 0 (0–0) | 0.179 |
| 100–125 | 9.97 ± 0.56 | 12.50 (9.31–15.69) | 10.38 ± 0.53 | 13.75 (10.64–16.86) | 0.67 ± 0.22 | 0 (0–0) | ||||
| ≥126 | 9.59 ± 0.85 | 11.50 (5.81–17.19) | 10.15 ± 0.82 | 13.83 (8.03–19.63) | 1.04 ± 0.53 | 0 (0–0) | ||||
| PP2 (mg/dL) | <140 | 11.99 ± 1.08 | - | 0.478 | 12.44 ± 1.00 | - | 0.550 | 1.92 ± 1.92 | 0 (0–0) | 0.498 |
| 140–199 | 9.41 ± 2.25 | 6.00 | 11.04 ± 2.01 | - | 1.39 ± 0.58 | 1.83 (0–4.77) | ||||
| ≥200 | 10.76 ± 0.39 | 14.17 (13.96–14.37) | 11.18 ± 0.36 | 14.17 (13.98–14.36) | 0.96 ± 0.30 | 0 (0–0) | ||||
| Characteristics | DM Diagnosis | DM Treatment | |||||||
|---|---|---|---|---|---|---|---|---|---|
| Unadjusted HR (95% CI) | p | Adjusted HR (95% CI) | p | Unadjusted HR (95% CI) | p | Adjusted HR (95% CI) | p | ||
| Sex (ref. Male) | Female | 0.99 (0.63–1.57) | 0.974 | 0.97 (0.61–1.56) | 0.912 | ||||
| Age (years) (ref.40–49) | 50–59 | 1.45 (0.85–2.45) | 0.172 | 1.43 (0.83–2.45) | 0.200 | ||||
| 60–69 | 0.82 (0.45–1.52) | 0.533 | 0.82 (0.44–1.53) | 0.534 | |||||
| Current alcohol use (ref. No) | Yes | 1.17 (0.74–1.86) | 0.501 | 1.28 (0.79–2.07) | 0.308 | ||||
| Current smoking (ref. No) | Yes | 1.52 (0.90–2.58) | 0.121 | 1.52 (0.88–2.61) | 0.132 | ||||
| Hypertension (ref. No) | Yes | 1.88 (1.05–3.37) | 0.035 | 1.66 (0.92–3.02) | 0.094 | 2.00 (1.11–3.61) | 0.021 | 1.92 (1.07–3.46) | 0.029 |
| Dyslipidemia (ref. No) | Yes | 0.45 (0.06–3.26) | 0.432 | 0.48 (0.07–3.48) | 0.470 | ||||
| Family history of DM (ref. No) | Yes | 2.02 (1.04–3.95) | 0.039 | 1.66 (0.83–3.3) | 0.149 | 1.95 (1.00–3.81) | 0.051 | ||
| BMI (kg/m2) (ref. <25) | ≥25 | 2.51 (1.51–4.16) | <0.001 | 2.41 (1.45–4.01) | 0.001 | 2.45 (1.46–4.12) | 0.001 | 2.42 (1.44–4.07) | 0.001 |
| FBS (mg/dL) (ref. <126) | ≥126 | 1.64 (0.98–2.74) | 0.060 | 1.66 (0.98–2.82) | 0.059 | ||||
| PP2 (mg/dL) (ref. < 200) | ≥200 | 1.37 (0.63–3.00) | 0.431 | 1.55 (0.67–3.61) | 0.304 | ||||
| At the Time of DM Diagnosis (n = 74) n (%) | When to Start DM Treatment (n = 70) n (%) | |
|---|---|---|
| Any conditions | 27 (36.5) | 29 (41.4) |
| Hypertension | 22 (29.7) | 23 (32.9) |
| Dyslipidemia | 9 (12.2) | 10 (14.3) |
| Cerebrovascular disease | 0 (0) | 2 (2.9) |
| Coronary artery disease | 2 (2.7) | 2 (2.9) |
| Myocardial infarction | 0 (0) | 0 (0) |
| Kidney disease | 0 (0) | 0 (0) |
Publisher’s Note: MDPI stays neutral with regard to jurisdictional claims in published maps and institutional affiliations. |
© 2022 by the authors. Licensee MDPI, Basel, Switzerland. This article is an open access article distributed under the terms and conditions of the Creative Commons Attribution (CC BY) license (https://creativecommons.org/licenses/by/4.0/).
Share and Cite
Jeong, I.-S.; Kang, C.-M. Time to Diagnosis and Treatment of Diabetes Mellitus among Korean Adults with Hyperglycemia: Using a Community-Based Cohort Study. Int. J. Environ. Res. Public Health 2022, 19, 12090. https://doi.org/10.3390/ijerph191912090
Jeong I-S, Kang C-M. Time to Diagnosis and Treatment of Diabetes Mellitus among Korean Adults with Hyperglycemia: Using a Community-Based Cohort Study. International Journal of Environmental Research and Public Health. 2022; 19(19):12090. https://doi.org/10.3390/ijerph191912090
Chicago/Turabian StyleJeong, Ihn-Sook, and Chan-Mi Kang. 2022. "Time to Diagnosis and Treatment of Diabetes Mellitus among Korean Adults with Hyperglycemia: Using a Community-Based Cohort Study" International Journal of Environmental Research and Public Health 19, no. 19: 12090. https://doi.org/10.3390/ijerph191912090
APA StyleJeong, I.-S., & Kang, C.-M. (2022). Time to Diagnosis and Treatment of Diabetes Mellitus among Korean Adults with Hyperglycemia: Using a Community-Based Cohort Study. International Journal of Environmental Research and Public Health, 19(19), 12090. https://doi.org/10.3390/ijerph191912090