
Changes in Reported Symptoms Attributed to Office Environments in Sweden between 1995 and 2020


Abstract
:1. Introduction
2. Materials and Methods
2.1. Study Design
2.2. Exclusion Criteria
2.3. The MM 040 NA Questionnaire
2.4. Statistics
2.5. Ethical Considerations
3. Results
3.1. Respondent Characteristics
3.2. Reported Frequencies of Symptoms and Perceived Causality
3.3. Sex and Atopy
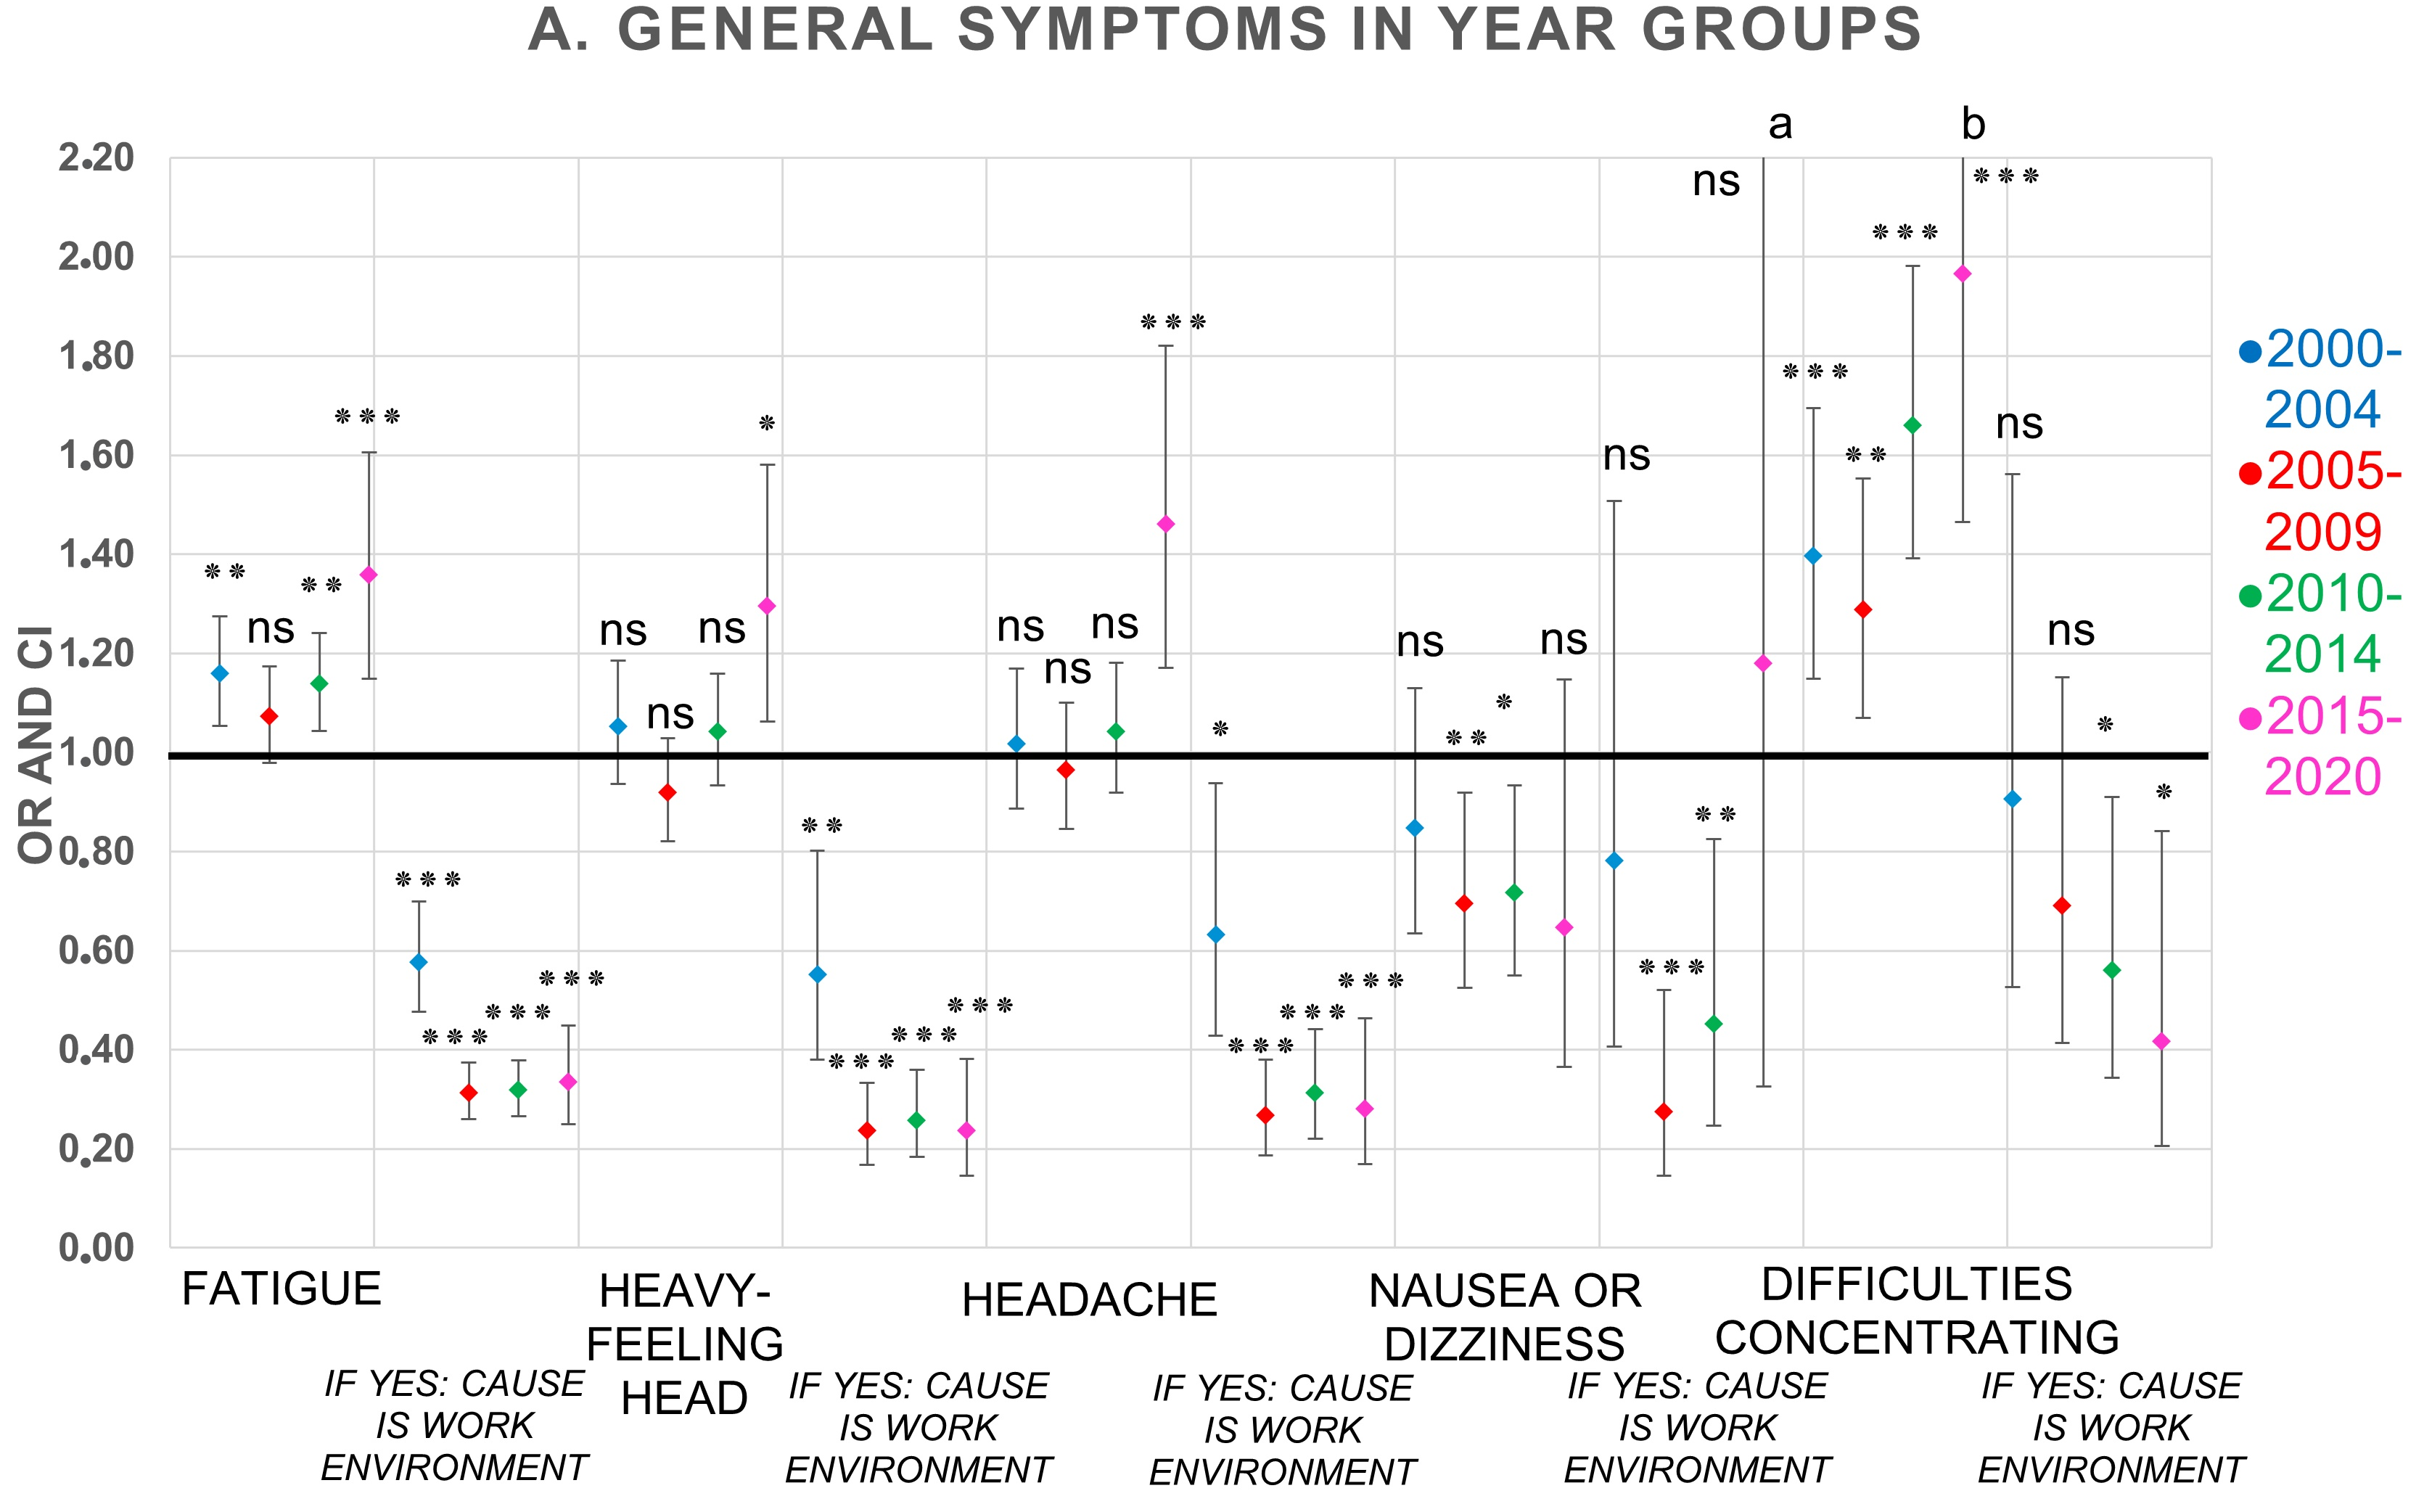
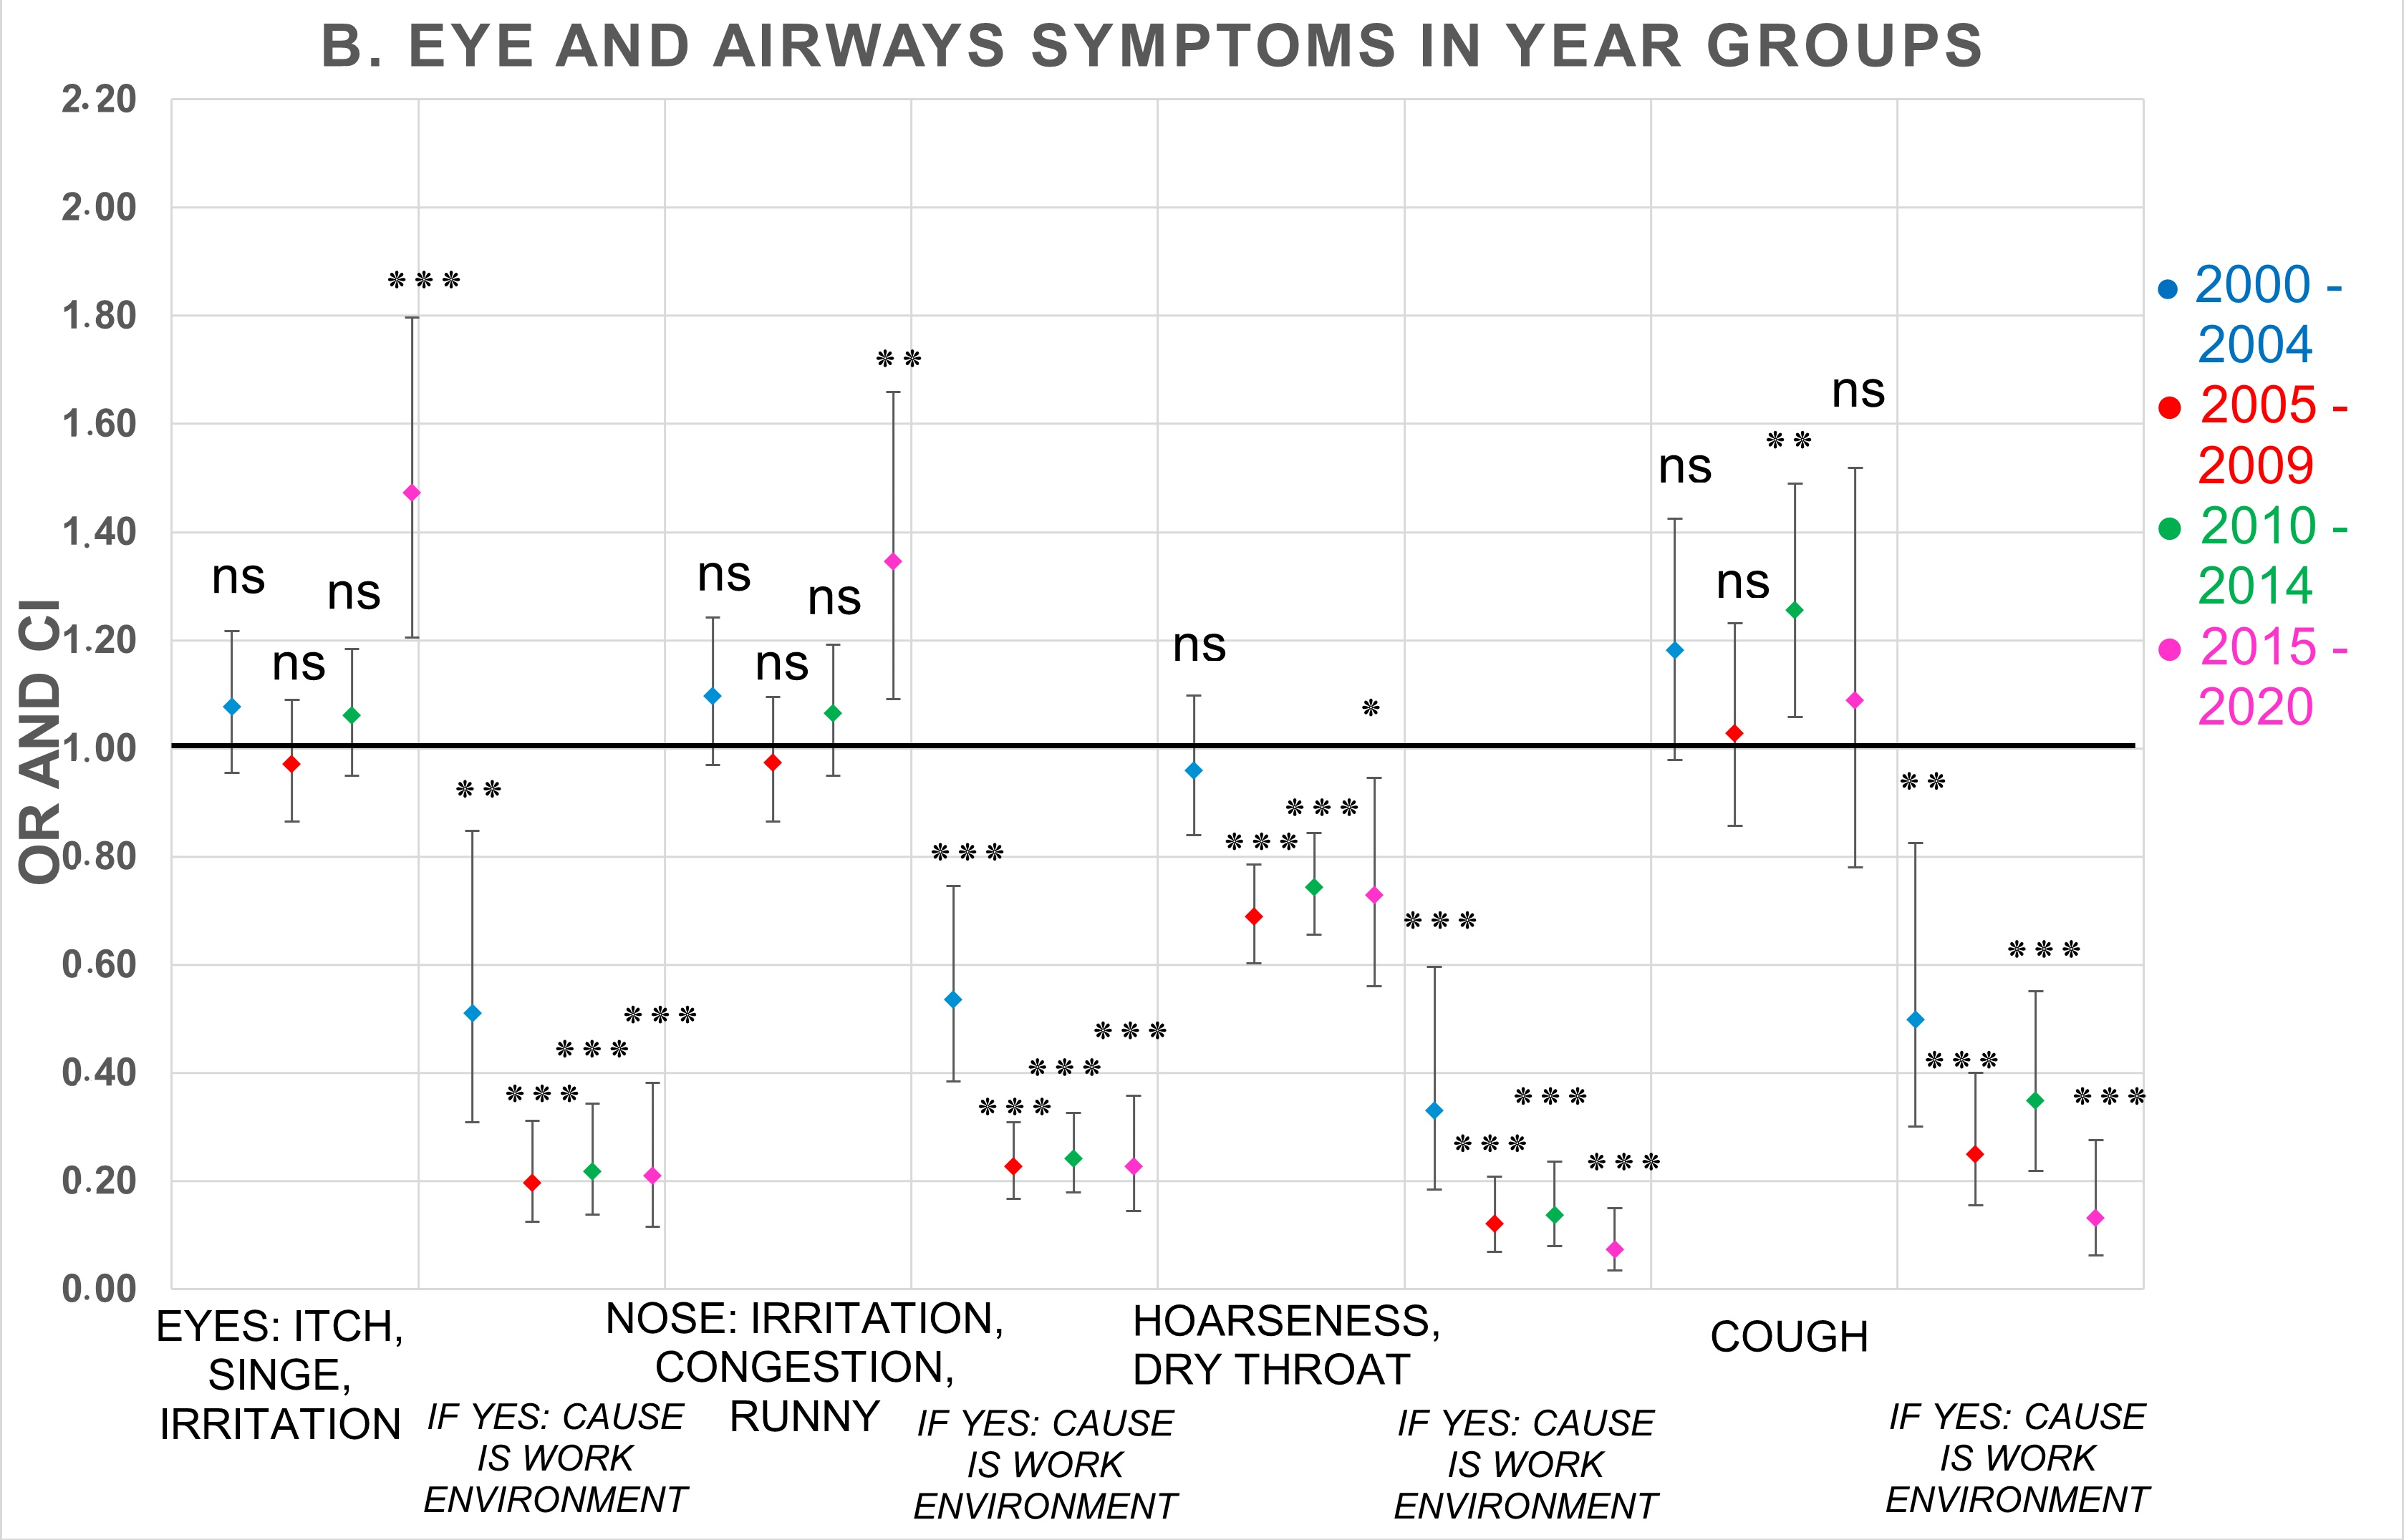
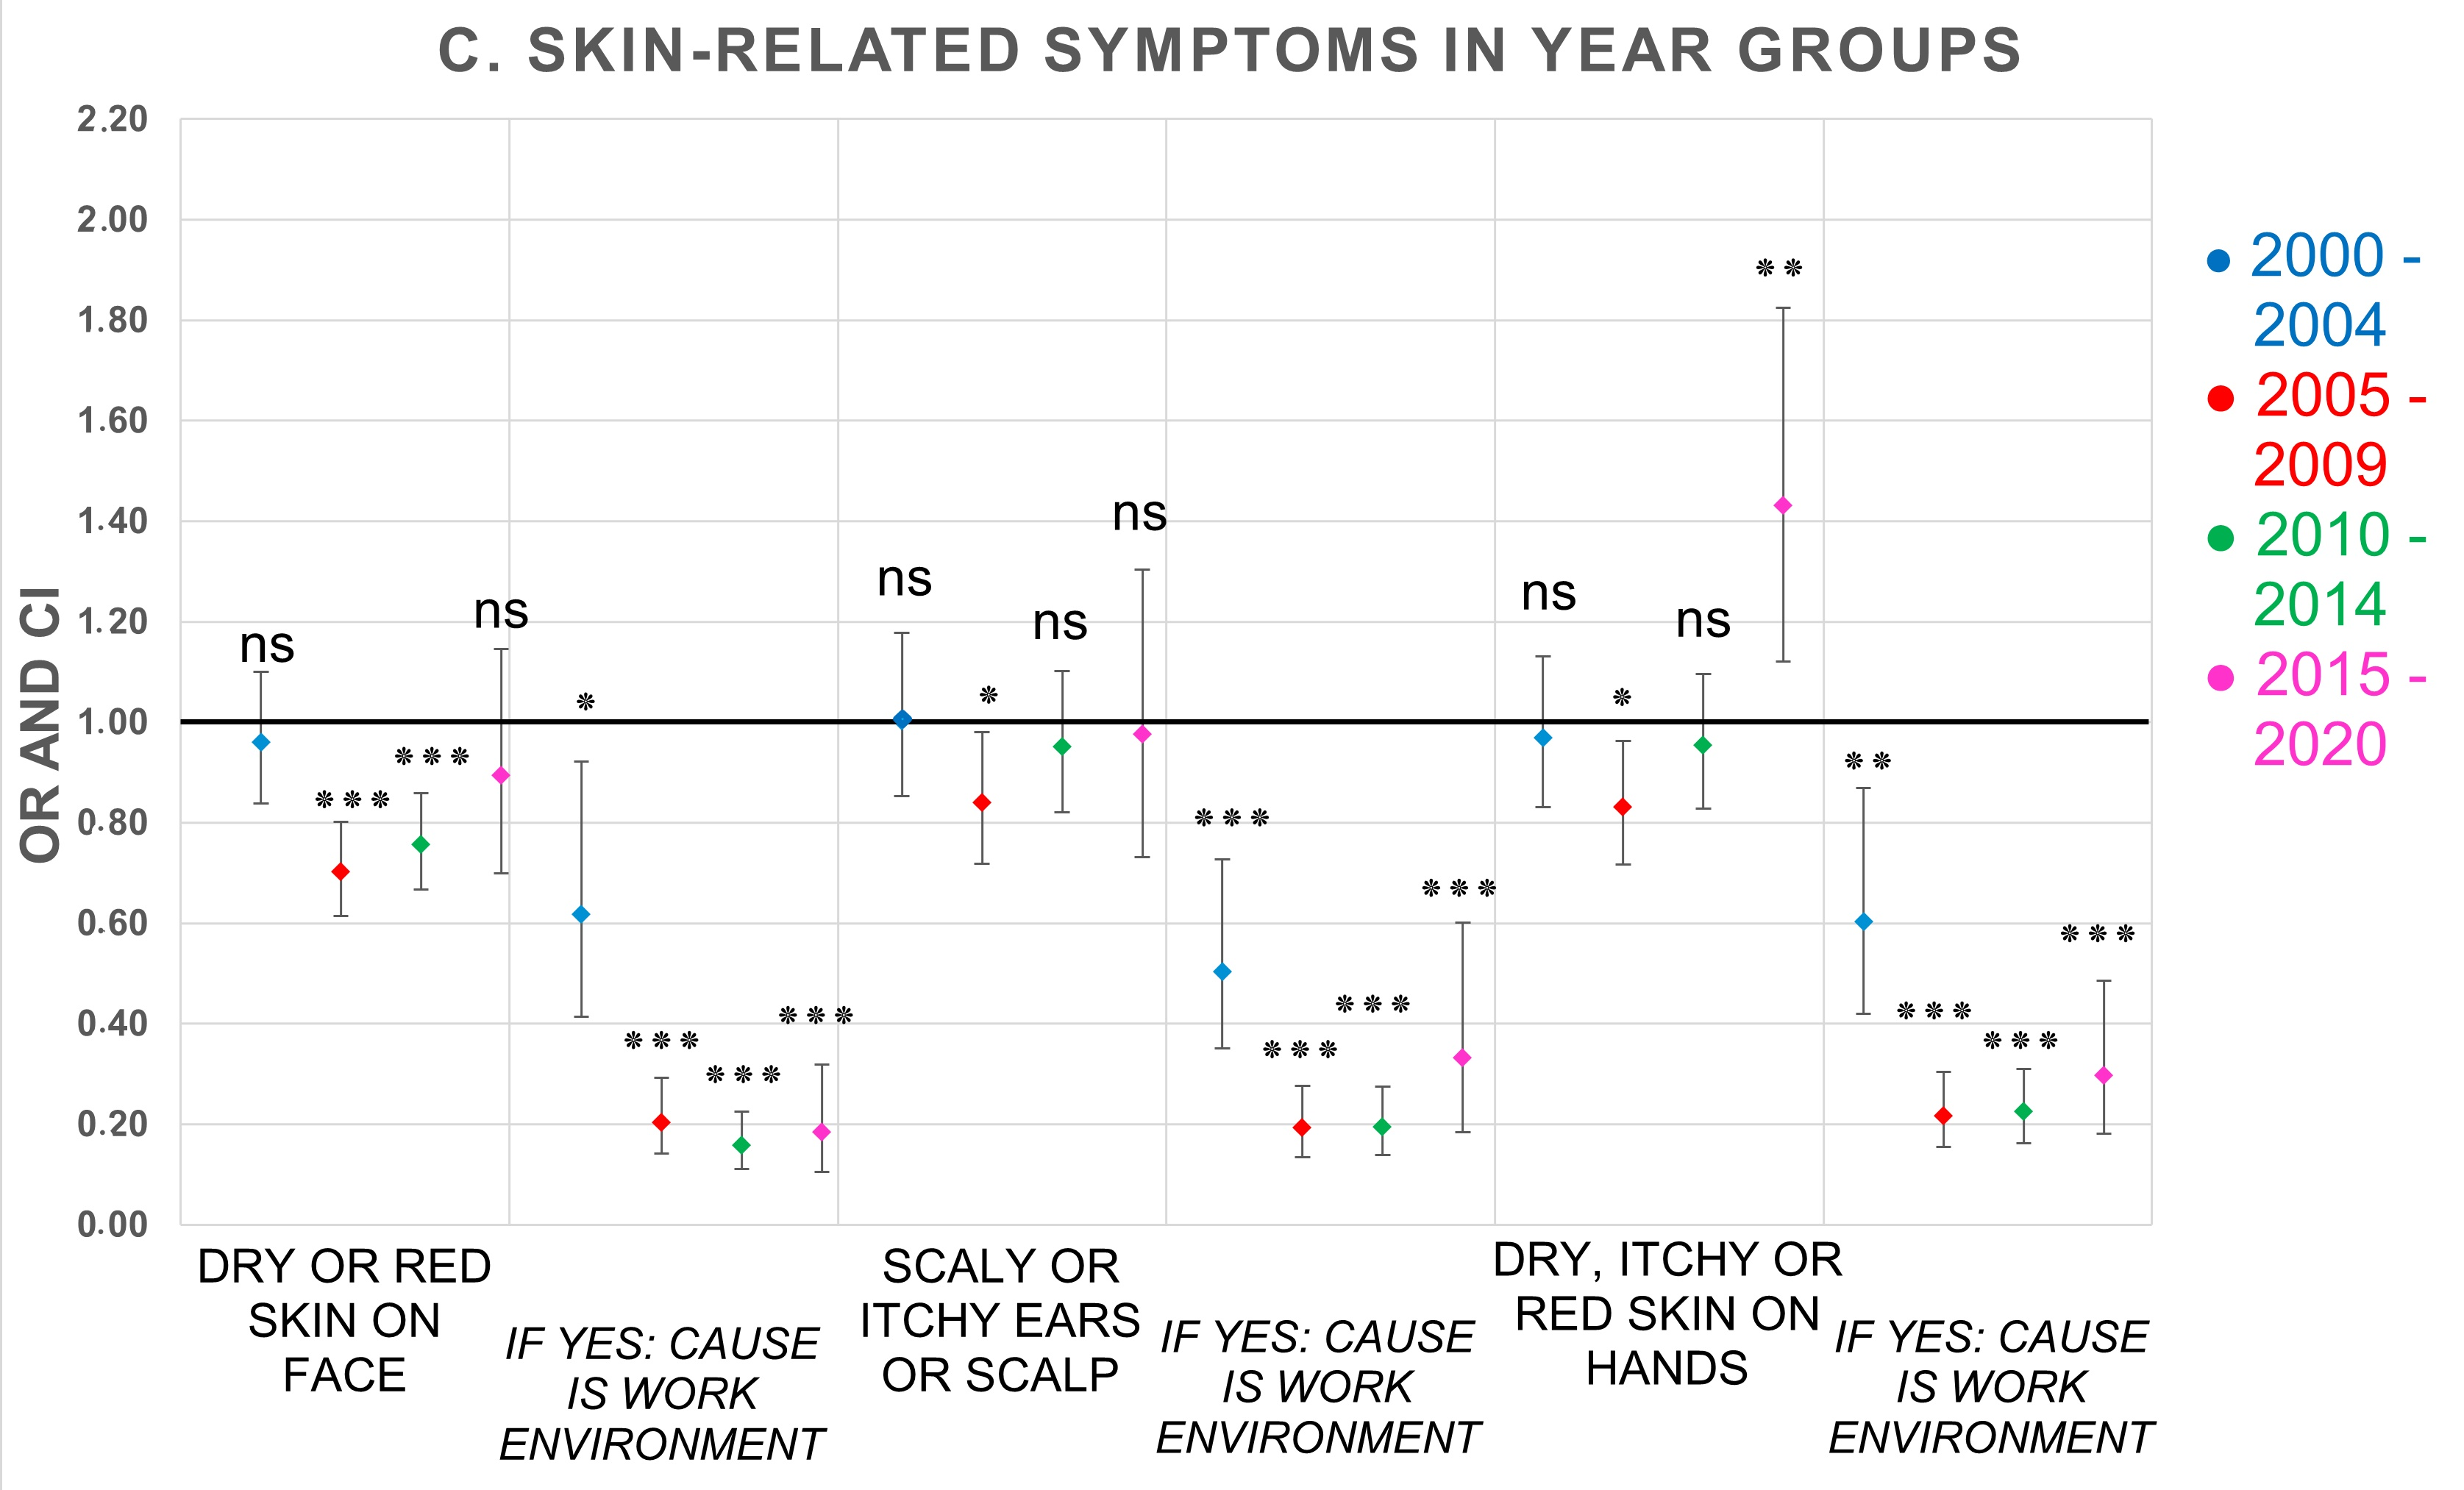
3.4. Logistic Regression Analyses Adjusted for Sex and Atopy
4. Discussion
5. Conclusions
Supplementary Materials
Author Contributions
Funding
Institutional Review Board Statement
Informed Consent Statement
Data Availability Statement
Acknowledgments
Conflicts of Interest
References
- World Health Organization. WHO Guidelines for Indoor Air Quality: Selected Pollutants.; WHO: Copenhagen, Denmark, 2010; pp. 1–443. [Google Scholar]
- Heseltine, E.; Rosen, J.; World Health Organization. WHO Guidelines for Indoor Air Quality: Dampness and Mould; WHO: Copenhagen, Denmark, 2009; pp. 1–228. [Google Scholar]
- Wargocki, P.; Lai, A. Editorial—special issue on Indoor pollutants, chemistry and health: Selected papers presented at Indoor Air 2014 conference in Hong Kong. Build. Environ. 2015, 93, 1–2. [Google Scholar] [CrossRef]
- Indoor Environment—An Overview. Available online: https://www.sciencedirect.com/topics/pharmacology-toxicology-and-pharmaceutical-science/indoor-environment (accessed on 24 November 2020).
- LaDou, J.; Harrison, R.J.; Fischman, M.L. Building-Associated Illness. In Current Diagnosis & Treatment: Occupational & Environmental Medicine, 5th ed.; McGraw-Hill Education: New York, NY, USA, 2013. [Google Scholar]
- Nordin, S. Mechanisms underlying nontoxic indoor air health problems: A review. Int. J. Hyg. Environ. Health 2020, 226, 113489. [Google Scholar] [CrossRef]
- Magnavita, N. Work-related symptoms in indoor environments: A puzzling problem for the occupational physician. Int. Arch. Occup. Environ. Health 2015, 88, 185–196. [Google Scholar] [CrossRef] [PubMed]
- Norbäck, D. An update on sick building syndrome. Curr. Opin. Allergy Clin. Immunol. 2009, 9, 55–59. [Google Scholar] [CrossRef] [PubMed]
- The SWESIAQ Model: Swesiaq’s Advice in Indoor Environmental Investigations (In Swedish). Version 6.0. Available online: https://swesiaq.se/onewebmedia/swesiaq-modellen-version-60-3.pdf (accessed on 14 May 2022).
- Swedish Work Environment Authority. Indoor Environment and Health Problems. Available online: https://www.av.se/inomhusmiljo/inomhusmiljo-och-halsobesvar (accessed on 7 May 2022).
- The Health and Safety Executive, UK. Sick Building Syndrome: A Review of the Evidence on Causes and Solutions. Available online: https://www.hse.gov.uk/research/crr_pdf/1992/crr92042.pdf (accessed on 7 May 2022).
- Runeson, R.; Wahlstedt, K.; Wieslander, G.; Norbäck, D. Personal and psychosocial factors and symptoms compatible with sick building syndrome in the Swedish workforce. Indoor Air 2006, 16, 445–453. [Google Scholar] [CrossRef]
- Justiz Vaillant, A.A.; Modi, P.; Jan, A. Atopy. In StatPearls; StatPearls Publishing: Tampa, FL, USA, 2021. [Google Scholar]
- Environmental Health Report 2017. The Swedish Public Health Authority. (In Swedish). Available online: https://www.folkhalsomyndigheten.se/contentassets/c44fcc5df7454b64bf2565454bbdf0e3/miljohalsorapport-2017-02096-2016-webb.pdf (accessed on 6 December 2020).
- Runeson-Broberg, R.; Norbäck, D. Sick building syndrome (SBS) and sick house syndrome (SHS) in relation to psychosocial stress at work in the Swedish workforce. Int. Arch. Occup. Environ. Health 2013, 86, 915–922. [Google Scholar] [CrossRef]
- Passarelli, G.R. Sick building syndrome: An overview to raise awareness. J. Build. Apprais. 2009, 5, 55–66. [Google Scholar] [CrossRef]
- Bluyssen, P.M.; Roda, C.; Mandin, C.; Fossati, S.; Carrer, P.; De Kluizenaar, Y.; Mihucz, V.G.; De Oliveira Fernandes, E.; Bartzis, J. Self-reported health and comfort in ‘modern’ office buildings: First results from the European OFFICAIR study. Indoor Air 2016, 26, 298–317. [Google Scholar] [CrossRef]
- Government of Canada CC for OH and S. Diseases, Disorders and Injuries: Occupational Safety and Health. Allergic and Contact Dermatitis. Available online: https://www.ccohs.ca/oshanswers/diseases (accessed on 11 April 2021).
- Karvala, K.; Toskala, E.; Luukkonen, R.; Lappalainen, S.; Uitti, J.; Nordman, H. New-onset adult asthma in relation to damp and moldy workplaces. Int. Arch. Occup. Environ. Health 2010, 83, 855–865. [Google Scholar] [CrossRef]
- Mentese, S.; Rad, A.Y.; Arısoy, M.; Güllü, G. Multiple comparisons of organic, microbial, and fine particulate pollutants in typical indoor environments: Diurnal and seasonal variations. J. Air Waste Manag. Assoc. 2012, 62, 1380–1393. [Google Scholar] [CrossRef] [Green Version]
- MM Questionnaires Manuals: Office. (In Swedish). Available online: https://vardgivare.regionorebrolan.se/siteassets/media/arbets--och-miljomedicin/mm-enkater/manual-kontor.pdf (accessed on 8 May 2022).
- MM Questionnaires: MM 040 NA Office Questionnaire. (In Swedish). Available online: https://vardgivare.regionorebrolan.se/siteassets/media/arbets--och-miljomedicin/mm-enkater/mm040na-kontor.pdf (accessed on 8 May 2022).
- Borna, E.; Nwaru, B.I.; Bjerg, A.; Mincheva, R.; Rådinger, M.; Lundbäck, B.; Ekerljung, L. Changes in the prevalence of asthma and respiratory symptoms in western Sweden between 2008 and 2016. Allergy 2019, 74, 1703–1715. [Google Scholar] [CrossRef]
- Sakellaris, I.; Saraga, D.; Mandin, C.; de Kluizenaar, Y.; Fossati, S.; Spinazzè, A.; Cattaneo, A.; Mihucz, V.; Szigeti, T.; Fernandes, E.D.O.; et al. Association of subjective health symptoms with indoor air quality in European office buildings: The OFFICAIR project. Indoor Air 2021, 31, 426–439. [Google Scholar] [CrossRef] [PubMed]
- Rönmark, E.P.; Ekerljung, L.; Lötvall, J.; Wennergren, G.; Rönmark, E.; Toren, K.; Lundbäck, B. Eczema among adults: Prevalence, risk factors and relation to airway diseases. Results from a large-scale population survey in Sweden. Br. J. Dermatol. 2012, 166, 1301–1308. [Google Scholar] [CrossRef]
- Knudsen, T.B.; Thomsen, S.F.; Nolte, H.; Backer, V. A Population-based Clinical Study of Allergic and Non-allergic Asthma. J. Asthma 2009, 46, 91–94. [Google Scholar] [CrossRef] [PubMed]
- Brasche, S.; Bullinger, M.; Morfeld, M.; Gebhardt, H.J.; Bischof, W. Why do Women Suffer from Sick Building Syndrome more often than Men? – Subjective Higher Sensitivity versus Objective Causes. Indoor Air 2001, 11, 217–222. [Google Scholar] [CrossRef] [PubMed]
- Lu, C.Y.; Lin, J.M.; Chen, Y.Y.; Chen, Y.C. Building-Related Symptoms among Office Employees Associated with Indoor Carbon Dioxide and Total Volatile Organic Compounds. Int. J. Environ. Res. Public Health 2015, 12, 5833–5845. [Google Scholar] [CrossRef] [PubMed]
- Fahad Alomirah, H.; Moda, H.M. Assessment of Indoor Air Quality and Users Perception of a Renovated Office Building in Manchester. Int. J. Environ. Res. Public Health 2020, 17, 1972. [Google Scholar] [CrossRef]
- Azuma, K.; Ikeda, K.; Kagi, N.; Yanagi, U.; Osawa, H. Physicochemical risk factors for building-related symptoms in air-conditioned office buildings: Ambient particles and combined exposure to indoor air pollutants. Sci. Total Environ. 2018, 616–617, 1649–1655. [Google Scholar] [CrossRef]
- De Magalhães Rios, J.L.; Boechat, J.L.; Gioda, A.; dos Santos, C.Y.; de Aquino Neto, F.R.; de Silva, J.R.L. Symptoms prevalence among office workers of a sealed versus a non-sealed building: Associations to indoor air quality. Environ. Int. 2009, 35, 1136–1141. [Google Scholar] [CrossRef]
- Pejtersen, J.; Allermann, L.; Kristensen, T.S.; Poulsen, O.M. Indoor climate, psychosocial work environment and symptoms in open-plan offices. Indoor Air 2006, 16, 392–401. [Google Scholar] [CrossRef]
- Thomée, S. Mobile Phone Use and Mental Health. A Review of the Research That Takes a Psychological Perspective on Exposure. Int. J. Environ. Res. Public Health 2018, 15, 2692. [Google Scholar] [CrossRef]
- Faasse, K.; Gamble, G.; Cundy, T.; Petrie, K.J. Impact of television coverage on the number and type of symptoms reported during a health scare: A retrospective pre–post observational study. BMJ Open 2012, 2, e001607. [Google Scholar] [CrossRef]
- Eriksson, N.; Höög, J.; Hansson Mild, K.; Sandström, M.; Stenberg, B. Förekomst av Symtom Liknande ”Sjuka Hus-Sjuka” Bildskärmsrelaterade Hudbesvär Och ”Elöverkänslighet” i den Vuxna Svenska Befolkningen; Swedish National Institute for Working Life, 2000; pp. 1–38, (In Swedish). Available online: http://nile.lub.lu.se/arbarch/arb/2000/arb2000_05.pdf (accessed on 5 August 2022).
- De Nijs, S.B.; Venekamp, L.N.; Bel, E.H. Adult-onset asthma: Is it really different? Eur. Respir. Rev. 2013, 22, 44–52. [Google Scholar] [CrossRef]
- Thomsen, S.F. Epidemiology and natural history of atopic diseases. Eur. Clin. Respir. J. 2015, 2, 24642. [Google Scholar] [CrossRef] [Green Version]


| Year Group | ||||||
|---|---|---|---|---|---|---|
| Respondents | 1995–1999 N = 4028 | 2000–2004 N = 5348 | 2005–2009 N = 7293 | 2010–2014 N = 8904 | 2015–2020 N = 790 | |
| Sex (%) | Men | 1917 (47.6) | 2194 (41.0) | 2751 (37.7) | 2725 (30.6) | 209 (26.5) |
| Women | 2111 (52.4) | 3154 (59.0) | 4542 (62.3) | 6179 (69.4) | 581 (73.5) | |
| Atopy: current or ever eczema, hay fever or asthma (%) | Yes No | 1580 (39.7) 2399 (60.3) | 2161 (41.1) 3091 (58.9) | 2990 (41.9) 4143 (58.1) | 3836 (44.0) 4890 (56.0) | 362 (46.6) 414 (53.4 |
| Current smoker (%) | Yes | 615 (15.7) | 726 (14.0) | 752 (10.7) | 718 (8.4) | 52 (6.9) |
| No | 3302 (84.3) | 4478 (86.0) | 6282 (89.3) | 7866 (91.6) | 702 (93.1) | |
| Age (%) | <30 | 478 (11.9) | 517 (9.6) | 760 (10.4) | 789 (8.8) | 58 (7.3) |
| 30–39 | 940 (23.3) | 1296 (24.2) | 1616 (22.1) | 1836 (20.5) | 167 (21.0) | |
| 40–49 | 1200 (29.8) | 1452 (27.1) | 1869 (25.5) | 2570 (28.7) | 206 (25.9) | |
| 50–59 | 1171 (29.0) | 1701 (31.7) | 2194 (30.0) | 2473 (27.6) | 228 (28.7) | |
| 60–70 | 244 (6.1) | 398 (7.4) | 885 (12.1) | 1294 (14.4) | 135 (17.0) | |
| Min, max, mean, SD | 19, 68, 44, 11 | 19, 67, 45, 11 | 19, 70, 46, 11 | 19, 70, 46, 11 | 21, 70, 47, 11 | |
| Years at current workplace (%) | <1 | 443 (11.3) | 439 (8.6) | 731 (12.4) | 987 (11.5) | 51 (6.7) |
| 1–5 | 1966 (50.0) | 3346 (65.4) | 3651 (62.2) | 4835 (56.2) | 455 (59.6) | |
| 6–10 | 799 (20.3) | 500 (9.8) | 861 (14.7) | 1330 (15.5) | 114 (14.9) | |
| 11–20 | 508 (12.9) | 456 (8.9) | 376 (6.4) | 958 (11.1) | 111 (14.5) | |
| >20 | 218 (5.5) | 374 (7.3) | 255 (4.3) | 492 (5.7) | 33 (4.3) | |
| Min, max, mean, SD | <1, 46, 6, 7 | <1, 42, 5, 7 | <1, 45, 5, 7 | <1, 56, 6, 7 | <1, 53, 6, 7 | |
| Symptoms | Response Categories | Year Group | ||||
|---|---|---|---|---|---|---|
| 1995–1999 | 2000–2004 | 2005–2009 | 2010–2014 | 2015–2020 | ||
| Fatigue | Yes often (%) | 1023 (25.9) | 1552 (29.7) | 2076 (28.7) | 2744 (30.9) | 281 (35.7) |
| If yes often: workplace is cause | Yes (%) | 697 (68.1) | 913 (58.8) | 1006 (48.5) | 1334 (48.6) | 141 (50.2) |
| Heavy-feeling head | Yes often (%) | 575 (14.7) | 832 (16.1) | 1070 (14.9) | 1533 (17.4) | 167 (21.3) |
| If yes often: workplace is cause | Yes (%) | 472 (82.1) | 638 (76.7) | 720 (67.3) | 1029 (67.1) | 114 (68.2) |
| Headache | Yes often (%) | 396 (10.1) | 564 (10.9) | 773 (10.7) | 1072 (12.2) | 131 (16.8) |
| If yes often: workplace is cause | Yes (%) | 295 (74.5) | 392 (69.5) | 457 (59.1) | 656 (61.2) | 79 (60.3) |
| Nausea/dizziness | Yes often (%) | 89 (2.3) | 108 (2.1) | 126 (1.8) | 171 (1.9) | 15 (1.9) |
| If yes often: workplace is cause | Yes (%) | 51 (57.3) | 58 (53.7) | 40 (31.7) | 71 (41.5) | 9 (60.0) |
| Difficulties concentrating | Yes often (%) | 167 (4.3) | 313 (6.1) | 419 (5.9) | 666 (7.6) | 71 (9.1) |
| If yes often: workplace is cause | Yes (%) | 123 (73.7) | 231 (73.8) | 293 (70.0) | 444 (66.7) | 45 (63.3) |
| Itchy, stinging, irritated eyes | Yes often (%) | 535 (13.6) | 787 (15.1) | 1035 (14.4) | 1444 (16.3) | 170 (21.9) |
| If yes often: workplace is cause | Yes (%) | 443 (82.8) | 635 (80.7) | 763 (73.7) | 1073 (74.3) | 124 (72.9) |
| Irritated, congested, runny nose | Yes often (%) | 506 (12.9) | 753 (14.5) | 982 (13.6) | 1347 (15.2) | 148 (19.0) |
| If yes often: workplace is cause | Yes (%) | 365 (72.1) | 491 (65.2) | 531 (54.1) | 757 (56.2) | 77 (52.1) |
| Hoarseness, dry throat | Yes often (%) | 438 (11.2) | 582 (11.2) | 632 (8.8) | 874 (9.9) | 77 (9.8) |
| If yes often: workplace is cause | Yes (%) | 363 (82.9) | 458 (78.7) | 422 (66.8) | 599 (68.5) | 43 (55.8) |
| Cough | Yes often (%) | 189 (4.9) | 308 (5.9) | 394 (5.5) | 601 (6.8) | 49 (6.3) |
| If yes often: workplace is cause | Yes (%) | 133 (70.4) | 189 (61.4) | 199 (50.5) | 356 (59.2) | 19 (38.8) |
| Dry/red skin on face | Yes often (%) | 430 (11.0) | 579 (11.2) | 627 (8.7) | 873 (9.9) | 94 (12.0) |
| If yes often: workplace is cause | Yes (%) | 332 (77.2) | 406 (70.1) | 359 (57.3) | 446 (51.1) | 51 (54.3) |
| Scaly/itchy scalp or ears | Yes often (%) | 288 (7.4) | 396 (7.7) | 489 (6.8) | 700 (7.9) | 64 (8.3) |
| If yes often: workplace is cause | Yes (%) | 148 (51.4) | 171 (43.2) | 139 (28.4) | 200 (28.6) | 27 (42.2) |
| Dry, itchy, or red skin on hands | Yes often (%) | 318 (8.2) | 436 (8.4) | 550 (7.7) | 810 (9.2) | 105 (13.5) |
| If yes often: workplace is cause | Yes (%) | 208 (65.4) | 239 (54.8) | 218 (39.6) | 319 (39.4) | 49 (46.7) |
| Symptoms | Sex/Atopy | Odds Ratio (OR) | 95% Confidence Interval | p Value |
|---|---|---|---|---|
| Fatigue | Women | 2.04 | 1.92–2.16 | <0.001 |
| Atopy | 1.61 | 1.53–1.70 | <0.001 | |
| Heavy-feeling head | Women | 2.45 | 2.25–2.65 | <0.001 |
| Atopy | 1.70 | 1.59–1.82 | <0.001 | |
| Headache | Women | 2.80 | 2.54–3.10 | <0.001 |
| Atopy | 1.55 | 1.43–1.68 | <0.001 | |
| Nausea or dizziness | Women | 3.06 | 2.41–3.89 | <0.001 |
| Atopy | 1.62 | 1.35–1.94 | <0.001 | |
| Difficulties concentrating | Women | 1.67 | 1.48–1.87 | <0.001 |
| Atopy | 1.49 | 1.35–1.66 | <0.001 | |
| Itch, stinging, or irritation in eyes | Women | 2.54 | 2.34–2.76 | <0.001 |
| Atopy | 1.82 | 1.70–1.95 | <0.001 | |
| Irritation, congestion, or runny nose | Women | 1.80 | 1.66–1.96 | <0.001 |
| Atopy | 2.50 | 2.33–2.69 | <0.001 | |
| Hoarseness/dry throat | Women | 2.11 | 1.91–2.33 | <0.001 |
| Atopy | 2.25 | 2.07–2.45 | <0.001 | |
| Cough | Women | 1.68 | 1.49–1.89 | <0.001 |
| Atopy | 2.47 | 2.22–2.75 | <0.001 | |
| Dry or red skin on face | Women | 2.17 | 1.97–2.40 | <0.001 |
| Atopy | 2.45 | 2.25–2.67 | <0.001 | |
| Scaly/itchy ears or scalp | Women | 1.55 | 1.39–1.73 | <0.001 |
| Atopy | 3.33 | 3.00–3.68 | <0.001 | |
| Dry, itchy, or red skin on hands | Women | 2.42 | 2.16–2.70 | <0.001 |
| Atopy | 3.00 | 2.73–3.30 | <0.001 |
| Year Group | ||||||||
|---|---|---|---|---|---|---|---|---|
| Symptom | 2000–2004 | 2005–2009 | 2010–2014 | 2015–2020 | ||||
| OR | 95% CI | OR | 95% CI | OR | 95% CI | OR | 95% CI | |
| Fatigue | 1.16 | 1.05–1.28 | 1.07 | 0.98–1.17 | 1.14 | 1.04–1.24 | 1.36 | 1.15–1.61 |
| Workplace is cause | 0.58 | 0.48–0.70 | 0.31 | 0.26–0.37 | 0.32 | 0.27–0.38 | 0.33 | 0.25–0.45 |
| Heavy–feeling head | 1.05 | 0.94–1.19 | 0.92 | 0.82–1.03 | 1.04 | 0.93–1.16 | 1.30 | 1.06–1.58 |
| Workplace is cause | 0.55 | 0.38–0.80 | 0.24 | 0.17–0.33 | 0.26 | 0.18–0.36 | 0.24 | 0.15–0.38 |
| Headache | 1.02 | 0.89–1.17 | 0.96 | 0.85–1.10 | 1.04 | 0.92–1.18 | 1.46 | 1.17–1.82 |
| Workplace is cause | 0.63 | 0.43–0.94 | 0.27 | 0.19–0.38 | 0.31 | 0.22–0.44 | 0.28 | 0.17–0.46 |
| Nausea/dizziness | 0.85 | 0.64–1.13 | 0.69 | 0.53–0.92 | 0.72 | 0.55–0.93 | 0.65 | 0.37–1.15 |
| Workplace is cause | 0.78 | 0.41–1.51 | 0.28 | 0.15–0.52 | 0.45 | 0.25–0.83 | 1.18 | 0.33–4.27 |
| Difficulties concentrating | 1.40 | 1.15–1.70 | 1.29 | 1.07–1.55 | 1.66 | 1.39–1.98 | 1.97 | 1.47–2.64 |
| Workplace is cause | 0.91 | 0.53–1.56 | 0.69 | 0.41–1.15 | 0.56 | 0.34–0.91 | 0.42 | 0.21–0.84 |
| Itchy, stinging, irritated eyes | 1.08 | 0.95–1.22 | 0.97 | 0.86–1.09 | 1.06 | 0.95–1.18 | 1.47 | 1.21–1.80 |
| Workplace is cause | 0.51 | 0.31–0.85 | 0.20 | 0.12–0.31 | 0.22 | 0.14–0.34 | 0.21 | 0.12–0.38 |
| Irritated, congested, runny nose | 1.10 | 0.97–1.24 | 0.97 | 0.86–1.10 | 1.06 | 0.95–1.19 | 1.35 | 1.09–1.66 |
| Workplace is cause | 0.54 | 0.38–0.75 | 0.23 | 0.17–0.31 | 0.24 | 0.18–0.33 | 0.23 | 0.14–0.36 |
| Hoarseness/dry throat | 0.96 | 0.84–1.10 | 0.69 | 0.60–0.79 | 0.74 | 0.66–0.84 | 0.73 | 0.56–0.95 |
| Workplace is cause | 0.33 | 0.18–0.60 | 0.12 | 0.07–0.21 | 0.14 | 0.08–0.24 | 0.07 | 0.04–0.15 |
| Cough | 1.18 | 0.98–1.43 | 1.03 | 0.86–1.23 | 1.26 | 1.06–1.49 | 1.09 | 0.78–1.52 |
| Workplace is cause | 0.50 | 0.30–0.83 | 0.25 | 0.16–0.40 | 0.35 | 0.22–0.55 | 0.13 | 0.06–0.28 |
| Dry/red skin on face | 0.96 | 0.84–1.10 | 0.70 | 0.61–0.80 | 0.76 | 0.67–0.86 | 0.89 | 0.70–1.15 |
| Workplace is cause | 0.62 | 0.41–0.92 | 0.20 | 0.14–0.29 | 0.16 | 0.11–0.23 | 0.18 | 0.11–0.32 |
| Scaly or itchy scalp or ears | 1.00 | 0.85–1.18 | 0.84 | 0.72–0.98 | 0.95 | 0.82–1.10 | 0.98 | 0.73–1.30 |
| Workplace is cause | 0.50 | 0.35–0.73 | 0.19 | 0.13–0.28 | 0.19 | 0.14–0.27 | 0.33 | 0.18–0.60 |
| Dry, itchy, or red skin on hands | 0.97 | 0.83–1.13 | 0.83 | 0.72–0.96 | 0.95 | 0.83–1.10 | 1.43 | 1.12–1.83 |
| Workplace is cause | 0.60 | 0.42–0.87 | 0.22 | 0.15–0.30 | 0.22 | 0.16–0.31 | 0.30 | 0.18–0.49 |
Publisher’s Note: MDPI stays neutral with regard to jurisdictional claims in published maps and institutional affiliations. |
© 2022 by the authors. Licensee MDPI, Basel, Switzerland. This article is an open access article distributed under the terms and conditions of the Creative Commons Attribution (CC BY) license (https://creativecommons.org/licenses/by/4.0/).
Share and Cite
Egfors, D.; Gunnarsson, A.G.; Ricklund, N. Changes in Reported Symptoms Attributed to Office Environments in Sweden between 1995 and 2020. Int. J. Environ. Res. Public Health 2022, 19, 11434. https://doi.org/10.3390/ijerph191811434
Egfors D, Gunnarsson AG, Ricklund N. Changes in Reported Symptoms Attributed to Office Environments in Sweden between 1995 and 2020. International Journal of Environmental Research and Public Health. 2022; 19(18):11434. https://doi.org/10.3390/ijerph191811434
Chicago/Turabian StyleEgfors, Della, Anita Gidlöf Gunnarsson, and Niklas Ricklund. 2022. "Changes in Reported Symptoms Attributed to Office Environments in Sweden between 1995 and 2020" International Journal of Environmental Research and Public Health 19, no. 18: 11434. https://doi.org/10.3390/ijerph191811434
APA StyleEgfors, D., Gunnarsson, A. G., & Ricklund, N. (2022). Changes in Reported Symptoms Attributed to Office Environments in Sweden between 1995 and 2020. International Journal of Environmental Research and Public Health, 19(18), 11434. https://doi.org/10.3390/ijerph191811434