
Divergent Effects of Factors on Crash Severity under Autonomous and Conventional Driving Modes Using a Hierarchical Bayesian Approach


Abstract
:1. Introduction
2. Materials and Methods
2.1. Data Preparation
2.2. Hierarchical Bayesian Approach
2.2.1. Hierarchical Model
2.2.2. Bayesian Inference
3. Results
4. Discussion
4.1. Impacting Factors on Crash Severity
4.1.1. Environmental Variables
4.1.2. Road Variables
4.1.3. Vehicle Variables
4.2. Model Comparison
4.3. Practical Research Implications
- (1)
- This study can help to improve driving safety in both conventional and autonomous driving modes. AVs are a complex combination of various hardware and software with high costs. Strict laws and regulations should be formulated to specify the road section and time of AVs for testing and driving [5]. For example, the testing of AVs needs to be conducted in areas with a complex environment or at night. In addition, manufacturers should face up to the current situation that AVs are still unable to effectively deal with all factors affecting driving safety and eliminate exaggerated publicity. More importantly, despite the importance of economic benefit and efficiency for manufacturers, the improvement of the safety of AVs should not be ignored. Different influencing factors for crashes mean different perceptions and decision logic. When AVs and conventional vehicles are mixed on the road, the driving environment may be more complex, and the risk of crashes may increase. Improving the technology of autonomous driving will help to reduce the collision between them. Additionally, as for the conventional driving mode, drivers’ behavior needs to be attached more importance. In a scene with more pedestrians or complex traffic flow, crashes in the conventional mode will be decreased by setting traffic signs and lines, violation penalties, and other means [84,85];
- (2)
- This study shows some existing problems of autonomous driving vehicles, which are helpful for the intelligent transformation of highways and vehicles. With the popularity of the Internet of Things (IoT), vehicle information and all kinds of environmental data can be collected in real-time through the wide application of artificial intelligence and big data [86,87]. At present, the intellectualization of highways should focus more on complex road environments and solving the occlusion problem, so as to provide clearer information for vehicles. Learning ability and adaptability need to be improved for AVs, enabling them to become a moving “intelligent agent”. Each “intelligent agent” can coordinate their respective routes, speeds, and distances between other vehicles to independently cope with all kinds of road conditions and unexpected situations [88,89]. In addition, the integration of multiple perception systems, such as visual perception systems (cameras and visual sensors), laser perception systems (laser radar), and microwave perception systems (millimeter-wave radar), will also help to reduce autonomous driving crashes;
- (3)
- The content of this study has a certain reference value for the research of human-computer interaction. Semi-AVs will occupy the majority of the market for a long time in the future, however, it is difficult to define when the driver or vehicle should be responsible for driving. At present, AVs require human drivers to maintain control of vehicles, during the whole driving process. However, when an emergency occurs, drivers may not be able to take charge of vehicles immediately because of carelessness or gradual trust in the autonomous driving system. The warning systems shall be further improved for AVs. The core of human-computer interaction is coordination and complementarity [90,91]. Since autonomous driving technology is not yet fully mature, semi-autonomous driving can be used as a supplement to traditional driving to reduce crashes. The human-computer conflict caused by redundant input also needs to be avoided [92,93].
5. Conclusions
Author Contributions
Funding
Institutional Review Board Statement
Informed Consent Statement
Data Availability Statement
Acknowledgments
Conflicts of Interest
References
- Czech, P.; Turoń, K.; Barcik, J. Autonomous vehicles: Basic issues. Zesz. Naukowe. Transp. Politech. Śląska 2018, 100, 15–22. [Google Scholar] [CrossRef]
- Bartuska, L.; Labudzki, R. Research of basic issues of autonomous mobility. Transp. Res. Procedia 2020, 44, 356–360. [Google Scholar] [CrossRef]
- Nieoczym, A.; Caban, J.; Stopka, O.; Krajka, T.; Stopková, M. The planning process of transport tasks for autonomous vans. Open Eng. 2021, 11, 871–879. [Google Scholar] [CrossRef]
- De Winter, J.C.; Happee, R.; Martens, M.H.; Stanton, N.A. Effects of adaptive cruise control and highly automated driving on workload and situation awareness: A review of the empirical evidence. Transp. Res. Part F: Traffic Psychol. Behav. 2014, 27, 196–217. [Google Scholar] [CrossRef]
- Fagnant, D.J.; Kockelman, K. Preparing a nation for autonomous vehicles: Opportunities, barriers and policy recommendations. Transp. Res. Part A Policy Pract. 2015, 77, 167–181. [Google Scholar] [CrossRef]
- Johnson, C.; Walker, J. Peak Car Ownership: The Market Opportunity of Electric Automated Mobility Services. 2016. Available online: https://rmi.org/insight/peak-car-ownership-reportJones (accessed on 1 August 2021).
- National Transportation Safety Board. Collision between a Car Operating with Automated Vehicle Control Systems and a Tractor-Semitrailer Truck Near Williston. 2016. Available online: https://www.ntsb.gov/investigations/AccidentReports/Reports/HAR1702.pdf (accessed on 1 August 2021).
- Bonnefon, J.F.; Rahwan, I.; Shariff, A. Psychological roadblocks to the adoption of self-driving vehicles. Nat. Hum. Behav. 2017, 1, 694–696. [Google Scholar]
- Dudziak, A.; Stoma, M.; Kuranc, A.; Caban, J. Assessment of Social Acceptance for Autonomous Vehicles in Southeastern Poland. Energies 2021, 14, 5778. [Google Scholar] [CrossRef]
- Kockelman, K.M.; Avery, P.; Bansal, P.; Boyles, S.D.; Bujanovic, P.; Choudhary, T.; Clements, L.; Domnenko, G.; Fagnant, D.; Helsel, J.; et al. Implications of Connected and Automated Vehicles on the Safety and Operations of Roadway Networks: A Final Report; Technical Report No. FHWA/TX-16/0-6849-1; TRB: Washington, DC, USA, 2016; p. 249. [Google Scholar]
- Gucwa, M. Mobility and energy impacts of automated cars. In Proceedings of the 2014 Automated Vehicles Symposium, San Francisco, SF, USA, 16 July 2014. [Google Scholar]
- Barnard, Y.; Lai, F. Spotting sheep in Yorkshire: Using eye-tracking for studying situation awareness in a driving simulator. In Human Factors: A System View of Human, Technology and Organization; De Waard, D., Axelsson, A., Berglund, M., Peters, B., Weikert, C., Eds.; Shaker Publishing: Maastricht, The Netherlands, 2010; pp. 249–261. [Google Scholar]
- Carsten, O.; Lai, F.; Barnard, Y.; Jamson, A.H.; Merat, N. Control task substitution in semi automated driving: Does it matter what aspects are automated? Hum. Factors J. Hum. Factors Ergon. Soc. 2012, 54, 747–761. [Google Scholar] [CrossRef]
- State of California Department of Motor Vehicles. Testing of Autonomous Vehicles with a Driver. 2019. Available online: https://www.dmv.ca.gov/portal/vehicle-industry-services/autonomous-vehicles/autonomous-vehicle-deployment-program/ (accessed on 1 August 2021).
- California Department of Motor Vehicles (California DMV). Deployment of Autonomous Vehicles. 2021. Available online: https://www.dmv.ca.gov/portal/vehicle-industry-services/autonomous-vehicles/testing-autonomous-vehicles-with-a-driver/ (accessed on 1 August 2021).
- Rosen, E.; Stigson, H.; Sander, U. Literature review of pedestrian fatality risk as a function of car impact speed. Accid. Anal. Prev. 2011, 43, 25–33. [Google Scholar] [CrossRef]
- Lee, C.; Abdel-Aty, M. Comprehensive analysis of vehicle-pedestrian crashes at intersections in Florida. Accid. Anal. Prev. 2005, 37, 775–786. [Google Scholar] [CrossRef]
- Retting, R.A.; Kyrychenko, S.Y. Reductions in injury crashes associated with red light camera enforcement in Oxnard, California. Am. J. Public Health 2002, 92, 1822–1825. [Google Scholar] [CrossRef] [PubMed]
- Merat, N.; Jamson, A.H.; Lai, F.; Daly, M.; Carsten, O. Transition to manual: Driver behaviour when resuming control from a highly automated vehicle. Transp. Res. Part F Traffic Psychol. Behav. 2014, 27, 274–282. [Google Scholar] [CrossRef]
- Zhang, J.; Xu, C. Investigating the typical scenarios and contributory factors to crash severity of autonomous vehicle involved collisions using association rule analysis. In Proceedings of the 100th Annual Meeting of the Transportation Research Board, Washington, DC, USA, 5–29 January 2021. [Google Scholar]
- Xu, C.; Ding, Z.; Wang, C.; Li, Z. Statistical analysis of the patterns and characteristics of connected and autonomous vehicle involved crashes. J. Saf. Res. 2019, 71, 41–47. [Google Scholar] [CrossRef] [PubMed]
- Wang, S.; Li, Z. Exploring causes and effects of automated vehicle disengagement using statistical modeling and classification tree based on field test data. Accid. Anal. Prev. 2019, 129, 44–54. [Google Scholar] [CrossRef]
- Khattak, Z.H.; Fontaine, M.D.; Smith, B.L. Exploratory investigation of disengagements and crashes in autonomous vehicles under mixed traffic: An endogenous switching regime framework. IEEE Trans. Intell. Transp. Syst. 2020, 22, 7485–7495. [Google Scholar] [CrossRef]
- Song, Y.; Chitturi, M.V.; Noyce, D.A. Automated vehicle crash sequences: Patterns and potential uses in safety testing. Accid. Anal. Prev. 2021, 153, 106017. [Google Scholar] [CrossRef]
- Haleem, K.; Abdel-Aty, M. Examining traffic crash injury severity at unsignalized intersections. J. Saf. Res. 2010, 41, 347–357. [Google Scholar] [CrossRef]
- Dadvar, S.; Ahmed, M.M. California autonomous vehicle crashes: Explanatory data analysis and classification tree. In Proceedings of the 100th Annual Meeting of the Transportation Research Board, Washington, DC, USA, 5–29 January 2021. [Google Scholar]
- Mannering, F.L.; Bhat, C.R. Analytic methods in accident research: Methodological frontier and future directions. Anal. Methods Accid. Res. 2014, 1, 1–22. [Google Scholar] [CrossRef]
- Yu, B.; Bao, S.; Zhang, Y.; Sullivan, J.; Flannagan, M. Measurement and prediction of driver trust in automated vehicle technologies: An application of hand position transition probability matrix. Transp. Res. Part C Emerg. Technol. 2021, 124, 102957. [Google Scholar] [CrossRef]
- Khattak, A.J.; Wali, B. Analysis of volatility in driving regimes extracted from basic safety messages transmitted between connected vehicles. Transp. Res. Part C Emerg. Technol. 2017, 84, 48–73. [Google Scholar] [CrossRef]
- Huang, H.; Chin, H.C.; Haque, M.M. Severity of driver injury and vehicle damage in traffic crashes at intersections: A bayesian hierarchical analysis. Accid. Anal. Prev. 2008, 40, 45–54. [Google Scholar] [CrossRef] [PubMed]
- Bakhshi, A.K.; Ahmed, M.M. Practical advantage of crossed random intercepts under Bayesian hierarchical modeling to tackle unobserved heterogeneity in clustering critical versus non-critical crashes. Accid. Anal. Prev. 2021, 149, 105855. [Google Scholar] [CrossRef] [PubMed]
- Faes, C.; Ormerod, J.T.; Wand, M.P. Variational Bayesian inference for parametric and nonparametric regression with missing data. J. Am. Stat. Assoc. 2011, 106, 959–971. [Google Scholar] [CrossRef]
- Ma, Z.; Chen, G. Bayesian methods for dealing with missing data problems. J. Korean Stat. Soc. 2018, 47, 297–313. [Google Scholar] [CrossRef]
- Ahmed, M.M.; Franke, R.; Ksaibati, K.; Shinstine, D.S. Effects of truck traffic on crash injury severity on rural highways in Wyoming using Bayesian binary logit models. Accid. Anal. Prev. 2018, 117, 106–113. [Google Scholar] [CrossRef]
- Boggs, A.M.; Wali, B.; Khattak, A.J. Exploratory analysis of automated vehicle crashes in California: A text analytics & hierarchical Bayesian heterogeneity-based approach. Accid. Anal. Prev. 2020, 135, 105354. [Google Scholar]
- Taxonomy, S.A.E. Definitions for Terms Related to On-Road Motor Vehicle Automated Driving Systems (2014); SAE Pub. Inc.: Warrendale, PA, USA, 2018. [Google Scholar]
- Banks, V.A.; Stanton, N.A. Keep the driver in control: Automating automobiles of the future. Appl. Ergon. 2016, 53, 389–395. [Google Scholar] [CrossRef]
- Khayyam, H.; Javadi, B.; Jalili, M.; Jazar, R.N. Artificial intelligence and internet of things for autonomous vehicles. In Nonlinear Approaches in Engineering Applications; Springer: Cham, Switzerland, 2020; pp. 39–68. [Google Scholar]
- Assemi, B.; Hickman, M. Relationship between heavy vehicle periodic inspections, crash contributing factors and crash severity. Transp. Res. Part A Policy Pract. 2018, 113, 441–459. [Google Scholar] [CrossRef]
- Pan, Y.; Chen, S.; Li, T.; Niu, S.; Tang, K. Exploring spatial variation of the bus stop influence zone with multi-source data: A case study in Zhenjiang, China. J. Transp. Geogr. 2019, 76, 166–177. [Google Scholar] [CrossRef]
- Mannering, F.L.; Shankar, V.; Bhat, C.R. Unobserved heterogeneity and the statistical analysis of highway accident data. Anal. Methods Accid. Res. 2016, 11, 1–16. [Google Scholar] [CrossRef]
- Yu, B.; Bao, S.; Feng, F.; Sayer, J. Examination and prediction of drivers’ reaction when provided with V2I communication-based intersection maneuver strategies. Transp. Res. Part C Emerg. Technol. 2019, 106, 17–28. [Google Scholar] [CrossRef]
- Bao, S.; Wu, L.; Yu, B.; Sayer, J.R. An examination of teen drivers’ car-following behavior under naturalistic driving conditions: With and without an advanced driving assistance system. Accid. Anal. Prev. 2020, 147, 105762. [Google Scholar] [CrossRef] [PubMed]
- Chand, S.; Dixit, V.V. Application of fractal theory for crash rate prediction: Insights from random parameters and latent class tobit models. Accid. Anal. Prev. 2018, 112, 30–38. [Google Scholar] [CrossRef]
- Wali, B.; Khattak, A.J.; Bozdogan, H.; Kamrani, M. How is driving volatility related to intersection safety? a bayesian heterogeneity-based analysis of instrumented vehicles data. Transp. Res. Part C Emerg. Technol. 2018, 92, 504–524. [Google Scholar] [CrossRef]
- Jones, A.P.; Jorgensen, S.H. The use of multilevel models for the prediction of road accident outcomes. Accid. Anal. Prev. 2003, 35, 59–69. [Google Scholar] [CrossRef]
- Kim, D.G.; Lee, Y.; Washington, S.; Choi, K. Modeling crash outcome probabilities at rural intersections: Application of hierarchical binomial logistic models. Accid. Anal. Prev. 2007, 39, 125–134. [Google Scholar] [CrossRef] [PubMed]
- Mitra, S.; Washington, S. On the nature of over-dispersion in motor vehicle crash prediction models. Accid. Anal. Prev. 2007, 39, 459–468. [Google Scholar] [CrossRef] [PubMed]
- Silva, J.; Filho, A. Performing hierarchical Bayesian regression to assess the best districts for building new residential real estate developments. In Proceedings of the 2020 IEEE International Conference on Systems, Man, and Cybernetics (SMC), Rome, Italy, 19–21 October 2022; pp. 2411–2416. [Google Scholar]
- Kia, S.M.; Huijsdens, H.; Rutherford, S.; Dinga, R.; Wolfers, T.; Mennes, M.; Andreassen, O.A.; Westlye, L.T.; Beckmann, C.F.; Marquand, A.F. Federated Multi-Site Normative Modeling using Hierarchical Bayesian Regression. bioRxiv. 2021. [Google Scholar] [CrossRef]
- Olia, A.; Razavi, S.; Abdulhai, B.; Abdelgawad, H. Traffic capacity implications of automated vehicles mixed with regular vehicles. J. Intell. Transp. Syst. 2018, 22, 244–262. [Google Scholar] [CrossRef]
- Dong, C.; Clarke, D.B.; Yan, X.; Khattak, A.; Huang, B. Multivariate random-parameters zero-inflated negative binomial regression model: An application to estimate crash frequencies at intersections. Accid. Anal. Prev. 2014, 70, 320–329. [Google Scholar] [CrossRef]
- El-Basyouny, K.; Sayed, T. Accident prediction models with random corridor parameters. Accid. Anal. Prev. 2009, 41, 1118–1123. [Google Scholar] [CrossRef] [PubMed]
- Fink, D. A Compendium of Conjugate Priors. 1997. Available online: http://www.people.cornell.edu/pages/df36/CONJINTRnew%20TEX.pdf46 (accessed on 1 August 2021).
- Gelman, A. Prior distributions for variance parameters in hierarchical models (comment on article by Browne and Draper). Bayesian Anal. 2006, 1, 515–534. [Google Scholar] [CrossRef]
- Gelman, A.; Stern, H.S.; Carlin, J.B.; Dunson, D.B.; Vehtari, A.; Rubin, D.B. Bayesian Data Analysis, 3rd ed.; Chapman and Hall/CRC: London, UK, 2013. [Google Scholar]
- Watanabe, S. Asymptotic equivalence of Bayes cross validation and widely applicable information criterion in singular learning theory. J. Mach. Learn. Res. 2010, 11, 3571–3594. [Google Scholar]
- Vehtari, A.; Gelman, A.; Gabry, J. Practical Bayesian model evaluation using leave-one-out cross-validation and WAIC. Stat. Comput. 2017, 27, 1413–1432. [Google Scholar] [CrossRef]
- Plummer, M. Penalized loss functions for bayesian model comparison. Biostatistics 2008, 9, 523–539. [Google Scholar] [CrossRef] [PubMed]
- Vehtari, A.; Simpson, D.; Gelman, A.; Yao, Y.; Gabry, J. Pareto smoothed importance sampling. arXiv 2015, arXiv:1507.02646. [Google Scholar]
- Chen, H.; Chen, H.; Liu, Z.; Sun, X.; Zhou, R. Analysis of factors affecting the severity of automated vehicle crashes using XGBoost model combining POI data. J. Adv. Transp. 2020, 2020, 8881545. [Google Scholar] [CrossRef]
- Chen, P. Built environment factors in explaining the automobile-involved bicycle crash frequencies: A spatial statistic approach. Saf. Sci. 2015, 79, 336–343. [Google Scholar] [CrossRef]
- Shen, Y.; Zhang, H.; Zhao, J. Integrating shared autonomous vehicle in public transportation system: A supply-side simulation of the first-mile service in Singapore. Transp. Res. Part A: Policy Pract. 2018, 113, 125–136. [Google Scholar] [CrossRef]
- Lam, A.Y.; Leung, Y.W.; Chu, X. Autonomous-vehicle public transportation system: Scheduling and admission control. IEEE Trans. Intell. Transp. Syst. 2016, 17, 1210–1226. [Google Scholar] [CrossRef]
- Aria, E.; Olstam, J.; Schwietering, C. Investigation of automated vehicle effects on driver’s behavior and traffic performance. Transp. Res. Procedia 2016, 15, 761–770. [Google Scholar] [CrossRef]
- Vargas, J.; Alsweiss, S.; Toker, O.; Razdan, R.; Santos, J. An overview of autonomous vehicles sensors and their vulnerability to weather conditions. Sensors 2021, 21, 5397. [Google Scholar] [CrossRef]
- Jaarsma, C.F.; De Vries, J.R. Agricultural vehicles and rural road safety: Tackling a persistent problem. Traffic Inj. Prev. 2014, 15, 94–101. [Google Scholar] [CrossRef]
- Owens, J.M.; Sandt, L.; Morgan, J.F.; Sundararajan, S.; Clamann, M.; Manocha, D.; Steinfeld, A.; Maheshwari, T.; Cooper, J.F. Challenges and opportunities for the intersection of vulnerable road users (VRU) and automated vehicles (AVs). In Road Vehicle Automation 5; Springer: Cham, Switzweland, 2019; pp. 207–217. [Google Scholar]
- Owens, J.M.; Greene-Roesel, R.; Habibovic, A.; Head, L.; Apricio, A. Reducing conflict between vulnerable road users and automated vehicles. In Road Vehicle Automation 4; Springer: Cham, Switzweland, 2018; pp. 69–75. [Google Scholar]
- Chiou, Y.C.; Hwang, C.C.; Chang, C.C.; Fu, C. Modeling two-vehicle crash severity by a bivariate generalized ordered probit approach. Accid. Anal. Prev. 2013, 51, 175–184. [Google Scholar] [CrossRef]
- Pettigrew, S.; Nelson, J.D.; Norman, R. Autonomous vehicles and cycling: Policy implications and management issues. Transp. Res. Interdiscip. Perspect. 2020, 7, 100188. [Google Scholar] [CrossRef]
- Jayaraman, S.K.; Creech, C.; Robert, L.P., Jr.; Tilbury, D.M.; Yang, X.J.; Pradhan, A.K.; Tsui, K.M. Trust in AV: An uncertainty reduction model of AV-pedestrian interactions. In Proceedings of the Companion of the 2018 ACM/IEEE International Conference on Human-Robot Interaction, Chicago, IL, USA, 5–8 March 2018; pp. 133–134. [Google Scholar]
- Utriainen, R. The potential impacts of automated vehicles on pedestrian safety in a four-season country. J. Intell. Transp. Syst. 2020, 25, 188–196. [Google Scholar] [CrossRef]
- Straub, E.R.; Schaefer, K.E. It takes two to Tango: Automated vehicles and human beings do the dance of driving–Four social considerations for policy. Transp. Res. Part A Policy Pract. 2019, 122, 173–183. [Google Scholar] [CrossRef]
- Aziz, H.A.; Ukkusuri, S.V.; Hasan, S. Exploring the determinants of pedestrian–vehicle crash severity in New York City. Accid. Anal. Prev. 2013, 50, 1298–1309. [Google Scholar] [CrossRef] [PubMed]
- Li, Y.; Liu, C.; Ding, L. Impact of pavement conditions on crash severity. Accid. Anal. Prev. 2013, 59, 399–406. [Google Scholar] [CrossRef]
- Zheng, F.; Liu, C.; Liu, X.; Jabari, S.E.; Lu, L. Analyzing the impact of automated vehicles on uncertainty and stability of the mixed traffic flow. Transp. Res. Part C Emerg. Technol. 2020, 112, 203–219. [Google Scholar] [CrossRef]
- Mahdinia, I.; Mohammadnazar, A.; Arvin, R.; Khattak, A.J. Integration of automated vehicles in mixed traffic: Evaluating changes in performance of following human-driven vehicles. Accid. Anal. Prev. 2021, 152, 106006. [Google Scholar] [CrossRef]
- Arvin, R.; Kamrani, M.; Khattak, A.J. The role of pre-crash driving instability in contributing to crash intensity using naturalistic driving data. Accid. Anal. Prev. 2019, 132, 105226. [Google Scholar] [CrossRef]
- Arvin, R.; Khattak, A.J.; Kamrani, M.; Rio-Torres, J. Safety evaluation of connected and automated vehicles in mixed traffic with conventional vehicles at intersections. J. Intell. Transp. Syst. 2020, 25, 170–187. [Google Scholar] [CrossRef]
- Liu, Q.; Wang, X.; Wu, X.; Glaser, Y.; He, L. Crash comparison of autonomous and conventional vehicles using pre-crash scenario typology. Accid. Anal. Prev. 2021, 159, 106281. [Google Scholar] [CrossRef] [PubMed]
- Yu, H.; Li, Z.; Zhang, G.; Liu, P. A latent class approach for driver injury severity analysis in highway single vehicle crash considering unobserved heterogeneity and temporal influence. Anal. Methods Accid. Res. 2019, 24, 100110. [Google Scholar] [CrossRef]
- Snijders, T.A.; Bosker, R.J. Multilevel Analysis: An Introduction to Basic and Advanced Multilevel Modeling; SAGE: Thousand Oaks, CA, USA, 2011. [Google Scholar]
- Fu, T.; Miranda-Moreno, L.; Saunier, N. A novel framework to evaluate pedestrian safety at non-signalized locations. Accid. Anal. Prev. 2018, 111, 23–33. [Google Scholar] [CrossRef] [PubMed]
- Fu, T.; Hu, W.; Miranda-Moreno, L.; Saunier, N. Investigating secondary pedestrian-vehicle interactions at non-signalized intersections using vision-based trajectory data. Transp. Res. Part C Emerg. Technol. 2019, 105, 222–240. [Google Scholar] [CrossRef]
- Pi, W.; Yang, P.; Duan, D.; Chen, C.; Li, H. Malicious user detection for cooperative mobility tracking in autonomous driving. IEEE Internet Things J. 2020, 7, 4922–4936. [Google Scholar] [CrossRef]
- Gerla, M.; Lee, E.K.; Pau, G.; Lee, U. Internet of vehicles: From intelligent grid to autonomous cars and vehicular clouds. In Proceedings of the 2014 IEEE world forum on internet of things (WF-IoT), Seoul, Korea, 6–8 March 2014; pp. 241–246. [Google Scholar]
- Gruyer, D.; Magnier, V.; Hamdi, K.; Claussmann, L.; Orfila, O.; Rakotonirainy, A. Perception, information processing and modeling: Critical stages for autonomous driving applications. Annu. Rev. Control. 2017, 44, 323–341. [Google Scholar] [CrossRef]
- Watanabe, T.; Wolf, D. Verisimilar percept sequences tests for autonomous driving intelligent agent assessment. In Proceedings of the 2018 Latin American Robotic Symposium, 2018 Brazilian Symposium on Robotics (SBR) and 2018 Workshop on Robotics in Education (WRE), Joao Pessoa, Brazil, 6–10 November 2018; pp. 219–224. [Google Scholar]
- Yu, B.; Chen, Y.; Bao, S.; Xu, D. Quantifying drivers’ visual perception to analyze accident-prone locations on two-lane mountain highways. Accid. Anal. Prev. 2018, 119, 122–130. [Google Scholar] [CrossRef]
- Yu, B.; Chen, Y.; Bao, S. Quantifying visual road environment to establish a speeding prediction model: An examination using naturalistic driving data. Accid. Anal. Prev. 2019, 129, 289–298. [Google Scholar] [CrossRef] [PubMed]
- Flemisch, F.O.; Bengler, K.; Bubb, H.; Winner, H.; Bruder, R. Towards cooperative guidance and control of highly automated vehicles: H-mode and con duct-by-wire. Ergonomics 2014, 57, 343–360. [Google Scholar] [CrossRef] [PubMed]
- Wu, C.; Wu, H.; Lv, N. Review of control switch and safety of human-computer driving intelligent vehicle. J. Traffic Transp. Eng. 2018, 18, 131–141. [Google Scholar]
- Di, B.; Song, L.; Li, Y.; Li, G.Y. Non-orthogonal multiple access for high-reliable and low-latency v2x communications in 5g systems. IEEE J. Sel. Areas Commun. 2017, 35, 2383–2397. [Google Scholar] [CrossRef]


| Variable Category | Description | Mean | S.D. | Min | Max |
|---|---|---|---|---|---|
| Environmental Variables | |||||
| Schools | Count of public and private schools within a quarter-mile | 1.94805 | 1.8499 | 0 | 9 |
| Parks | Count of parks within a quarter-mile | 1.89286 | 1.46636 | 0 | 6 |
| Road Variables | |||||
| Driveway | Count of driveways along segment | 3.12987 | 1.36579 | 1 | 8 |
| Crash lanes | Number of lanes at crash site | 2.12338 | 1.07453 | 1 | 6 |
| Street width | Width of street in feet | 51.85065 | 19.63816 | 22 | 140 |
| Speed limit | Speed limit of roadway in mph | 25.42208 | 1.71034 | 15 | 30 |
| Slope | Slope in percentage of roadway | 3.41558 | 2.95931 | 1 | 10 |
| Variable Category | Description | Variable | Autonomous | Conventional | Source | ||
|---|---|---|---|---|---|---|---|
| Num | Percent | Num | Percent | ||||
| Injury | Someone injured | No * | 74 | 77.08% | 70 | 83.33% | OL 316 |
| Yes | 22 | 22.92% | 14 | 16.67% | |||
| Environmental Variables | |||||||
| Time of day | Time of the crash | Daytime | 60 | 62.50% | 69 | 82.14% | OL 316 |
| Night * | 36 | 37.50% | 15 | 17.86% | |||
| Involved in the crash | Non-motor vehicles or pedestrians involved in the crash | No | 78 | 81.25% | 58 | 69.05% | OL 316 |
| Yes * | 18 | 18.75% | 26 | 30.95% | |||
| Intersection | Crash happened at an intersection | No * | 33 | 34.38% | 28 | 33.33% | OL 316 |
| Yes | 63 | 65.63% | 56 | 66.67% | |||
| Light | Presence of light | Dark * | 54 | 56.25% | 5 | 5.95% | OL 316 |
| Daylight | 42 | 43.75% | 79 | 94.05% | |||
| Roadway surface | Condition of roadway surface | Dry | 91 | 94.79% | 75 | 89.29% | OL 316 |
| Wet * | 3 | 3.13% | 6 | 7.14% | |||
| Unknown | 2 | 2.08% | 3 | 3.57% | |||
| Metro stop | Presence of metro stop | Absence * | 51 | 53.13% | 39 | 46.43% | TransBASE |
| Presence | 45 | 46.88% | 45 | 53.57% | |||
| Trees | Presence of trees | Absence * | 19 | 19.79% | 23 | 27.38% | TransBASE |
| Presence | 77 | 80.21% | 61 | 72.62% | |||
| Land use | Land use of the location | Commercial | 26 | 27.08% | 8 | 9.52% | TransBASE |
| Industrial | 3 | 3.13% | 5 | 5.95% | |||
| Mixed or public | 39 | 40.63% | 48 | 57.14% | |||
| Residential * | 28 | 29.17% | 23 | 27.38% | |||
| Weather | Weather at the time of the crash | Clear weather * | 85 | 88.54% | 74 | 88.10% | OL 316 |
| Cloudy | 5 | 5.21% | 7 | 8.33% | |||
| Fog/Visibility | 2 | 2.08% | 0 | 0.00% | |||
| Raining | 3 | 3.13% | 3 | 3.57% | |||
| Unknown | 1 | 1.04% | 0 | 0.00% | |||
| Muni line | Presence of muni line (i.e., public transport line) | Absence * | 20 | 20.83% | 12 | 14.29% | TransBASE |
| Presence | 76 | 79.17% | 72 | 85.71% | |||
| Daily visitors’ flowrate (DVF) | Level of DVF | DVF < 3418 person-times | 30 | 31.25% | 32 | 38.10% | TransBASE |
| 3418 person-times ≤ DVF < 11,982 person-times | 33 | 34.38% | 23 | 27.38% | |||
| 11,982 person-times ≤ DVF < 40,040 person-times | 28 | 29.17% | 24 | 28.57% | |||
| DVF ≥ 40,040 person-times * | 5 | 5.21% | 5 | 5.95% | |||
| Pavement markings conditions | conditions of pavement markings | Poor * | 6 | 6.25% | 6 | 7.14% | Google Earth |
| Adequate | 90 | 93.75% | 78 | 92.86% | |||
| Schools | Count of public and private schools within a quarter-mile | Count of schools > 4 | 20 | 20.83% | 16 | 19.05% | TransBASE |
| Count of schools ≤ 4 * | 76 | 79.17% | 68 | 80.95% | |||
| Parks | Count of parks within a quarter-mile | Count of parks > 4 | 6 | 6.25% | 5 | 5.95% | TransBASE |
| Count of parks ≤ 4 * | 90 | 93.75% | 79 | 94.05% | |||
| Road Variables | |||||||
| Street classification | Classification of street | High | 1 | 1.04% | 0 | 0.00% | TransBASE |
| Arterial | 20 | 20.83% | 16 | 19.05% | |||
| Collector | 33 | 34.38% | 29 | 34.52% | |||
| Residential * | 42 | 43.75% | 39 | 46.43% | |||
| One-way | One-way street | No * | 62 | 64.58% | 56 | 66.67% | TransBASE |
| Yes | 34 | 35.42% | 28 | 33.33% | |||
| Divided median | Presence of divided median | Absence * | 80 | 83.33% | 76 | 90.48% | TransBASE |
| Presence | 16 | 16.67% | 8 | 9.52% | |||
| Marked centerline | Presence of marked centerline | Absence * | 56 | 58.33% | 43 | 51.19% | TransBASE |
| Presence | 40 | 41.67% | 41 | 48.81% | |||
| Bike lane | Presence of bike lane | Absence * | 70 | 72.92% | 54 | 64.29% | TransBASE |
| Presence | 26 | 27.08% | 30 | 35.71% | |||
| On-street parking | Presence of on-street parking | Absence * | 15 | 15.63% | 11 | 13.10% | TransBASE |
| Presence | 81 | 84.38% | 73 | 86.90% | |||
| Off-street parking | Presence of off-street parking | Absence * | 1 | 1.04% | 3 | 3.57% | TransBASE |
| Presence | 95 | 98.96% | 81 | 96.43% | |||
| Traffic calming | Presence of traffic calming device | Absence * | 69 | 71.88% | 58 | 69.05% | TransBASE |
| Presence | 27 | 28.13% | 26 | 30.95% | |||
| Sidewalk | Presence of sidewalk | Absence or one-side of segment * | 5 | 5.21% | 7 | 8.33% | TransBASE |
| Both sides of segment | 91 | 94.79% | 77 | 91.67% | |||
| Driveway | Count of driveways along segment | Driveways ≥ 4 * | 31 | 32.29% | 33 | 39.29% | TransBASE |
| Driveways < 4 | 65 | 67.71% | 51 | 60.71% | |||
| Crash lanes | Number of lanes at crash site | Crash lanes > 2 | 36 | 37.50% | 27 | 32.14% | TransBASE |
| Crash lanes ≤ 2 * | 60 | 62.50% | 57 | 67.86% | |||
| Street width | Width of street in feet | Street width > 60 feet | 21 | 21.88% | 15 | 17.86% | Google Earth |
| Street width ≤ 60 feet * | 75 | 78.13% | 69 | 82.14% | |||
| Speed limit | Speed limit of roadway in mph | Speed limit > 25 mph | 11 | 11.46% | 8 | 9.52% | TransBASE |
| Speed limit ≤ 25 mph * | 85 | 88.54% | 76 | 90.48% | |||
| Slope | Slope in percentage of roadway | Slope > 3% | 42 | 43.75% | 31 | 36.90% | TransBASE |
| Slope ≤ 3% * | 54 | 56.25% | 53 | 63.10% | |||
| Vehicle Variables | |||||||
| Turning movement | Turning movement of the AV | No * | 84 | 87.50% | 53 | 63.10% | OL 316 |
| Yes | 12 | 12.50% | 31 | 36.90% | |||
| Manufacturer | Manufacturer of the AV | Aurora Innovation, Inc. (Pittsburgh, PA, USA) | 0 | 0.00% | 1 | 1.19% | OL 316 |
| GM Cruise LLC (San Francisco, CA, USA) | 79 | 82.29% | 53 | 63.10% | |||
| Lyft, Inc. (San Francisco, CA, USA) | 0 | 0.00% | 2 | 2.38% | |||
| Waymo LLC (Phoenix, AZ, USA) | 8 | 8.33% | 9 | 10.71% | |||
| Zoox, Lnc. (San Francisco, CA, USA) | 9 | 9.38% | 19 | 22.62% | |||
| Vehicle year | Production year of the AV | 2016 | 9 | 9.38% | 17 | 20.24% | OL 316 |
| 2017 | 20 | 20.83% | 16 | 19.05% | |||
| 2018 | 0 | 0.00% | 1 | 1.19% | |||
| 2019 | 21 | 21.88% | 15 | 17.86% | |||
| 2020 | 45 | 46.88% | 34 | 40.48% | |||
| 2021 | 1 | 1.04% | 1 | 1.19% | |||
| Vehicle state | State of AV | Stopped * | 32 | 33.33% | 37 | 44.05% | OL 316 |
| Moving | 64 | 66.67% | 47 | 55.95% | |||
| Crash type | Type of the crash Rear-end | Rear-end | 57 | 59.38% | 34 | 40.48% | OL 316 |
| Other * | 39 | 40.63% | 50 | 59.52% | |||
| Number of vehicles involved | Number of vehicles involved in the crash | 1 * | 11 | 11.46% | 13 | 15.48% | OL 316 |
| 2 | 84 | 87.50% | 69 | 82.14% | |||
| 3 | 1 | 1.04% | 2 | 2.38% | |||
| Disengagement | Presence of disengagement | Absence * | 60 | 62.50% | 84 | 100.00% | OL 316 &OL311R |
| Presence | 36 | 37.50% | 0 | 0.00% | |||
| Initiator of disengagement | Initiator of disengagement (system or the test driver) | AV system | 1 | 1.04% | 0 | 0.00% | OL 316 &OL311R |
| Test driver | 35 | 36.46% | 0 | 0.00% | |||
| No | 60 | 62.50% | 84 | 100.00% | |||
| Unwanted behavior of other roadway participants | Presence of unwanted behavior of other roadway participants | Absence * | 77 | 80.21% | 84 | 100.00% | OL 316 &OL311R |
| Presence | 19 | 19.79% | 0 | 0.00% | |||
| Unwanted movement of AVs | Presence of unwanted behavior of AVs | Absence * | 95 | 98.96% | 84 | 100.00% | OL 316 &OL311R |
| Presence | 1 | 1.04% | 0 | 0.00% | |||
| Changing lanes | Presence of AV’s changing lanes | Absence * | 64 | 66.67% | 84 | 100.00% | OL 316 &OL311R |
| Presence | 32 | 33.33% | 0 | 0.00% | |||
| Deceleration | Presence of AV’s deceleration | Absence * | 76 | 79.17% | 84 | 100.00% | OL 316 &OL311R |
| Presence | 20 | 20.83% | 0 | 0.00% | |||
| Parameters | Estimate (std Error) | Odds Ratio (95% Confidence Interval) |
|---|---|---|
| Fixed Effects | ||
| Environmental variables | ||
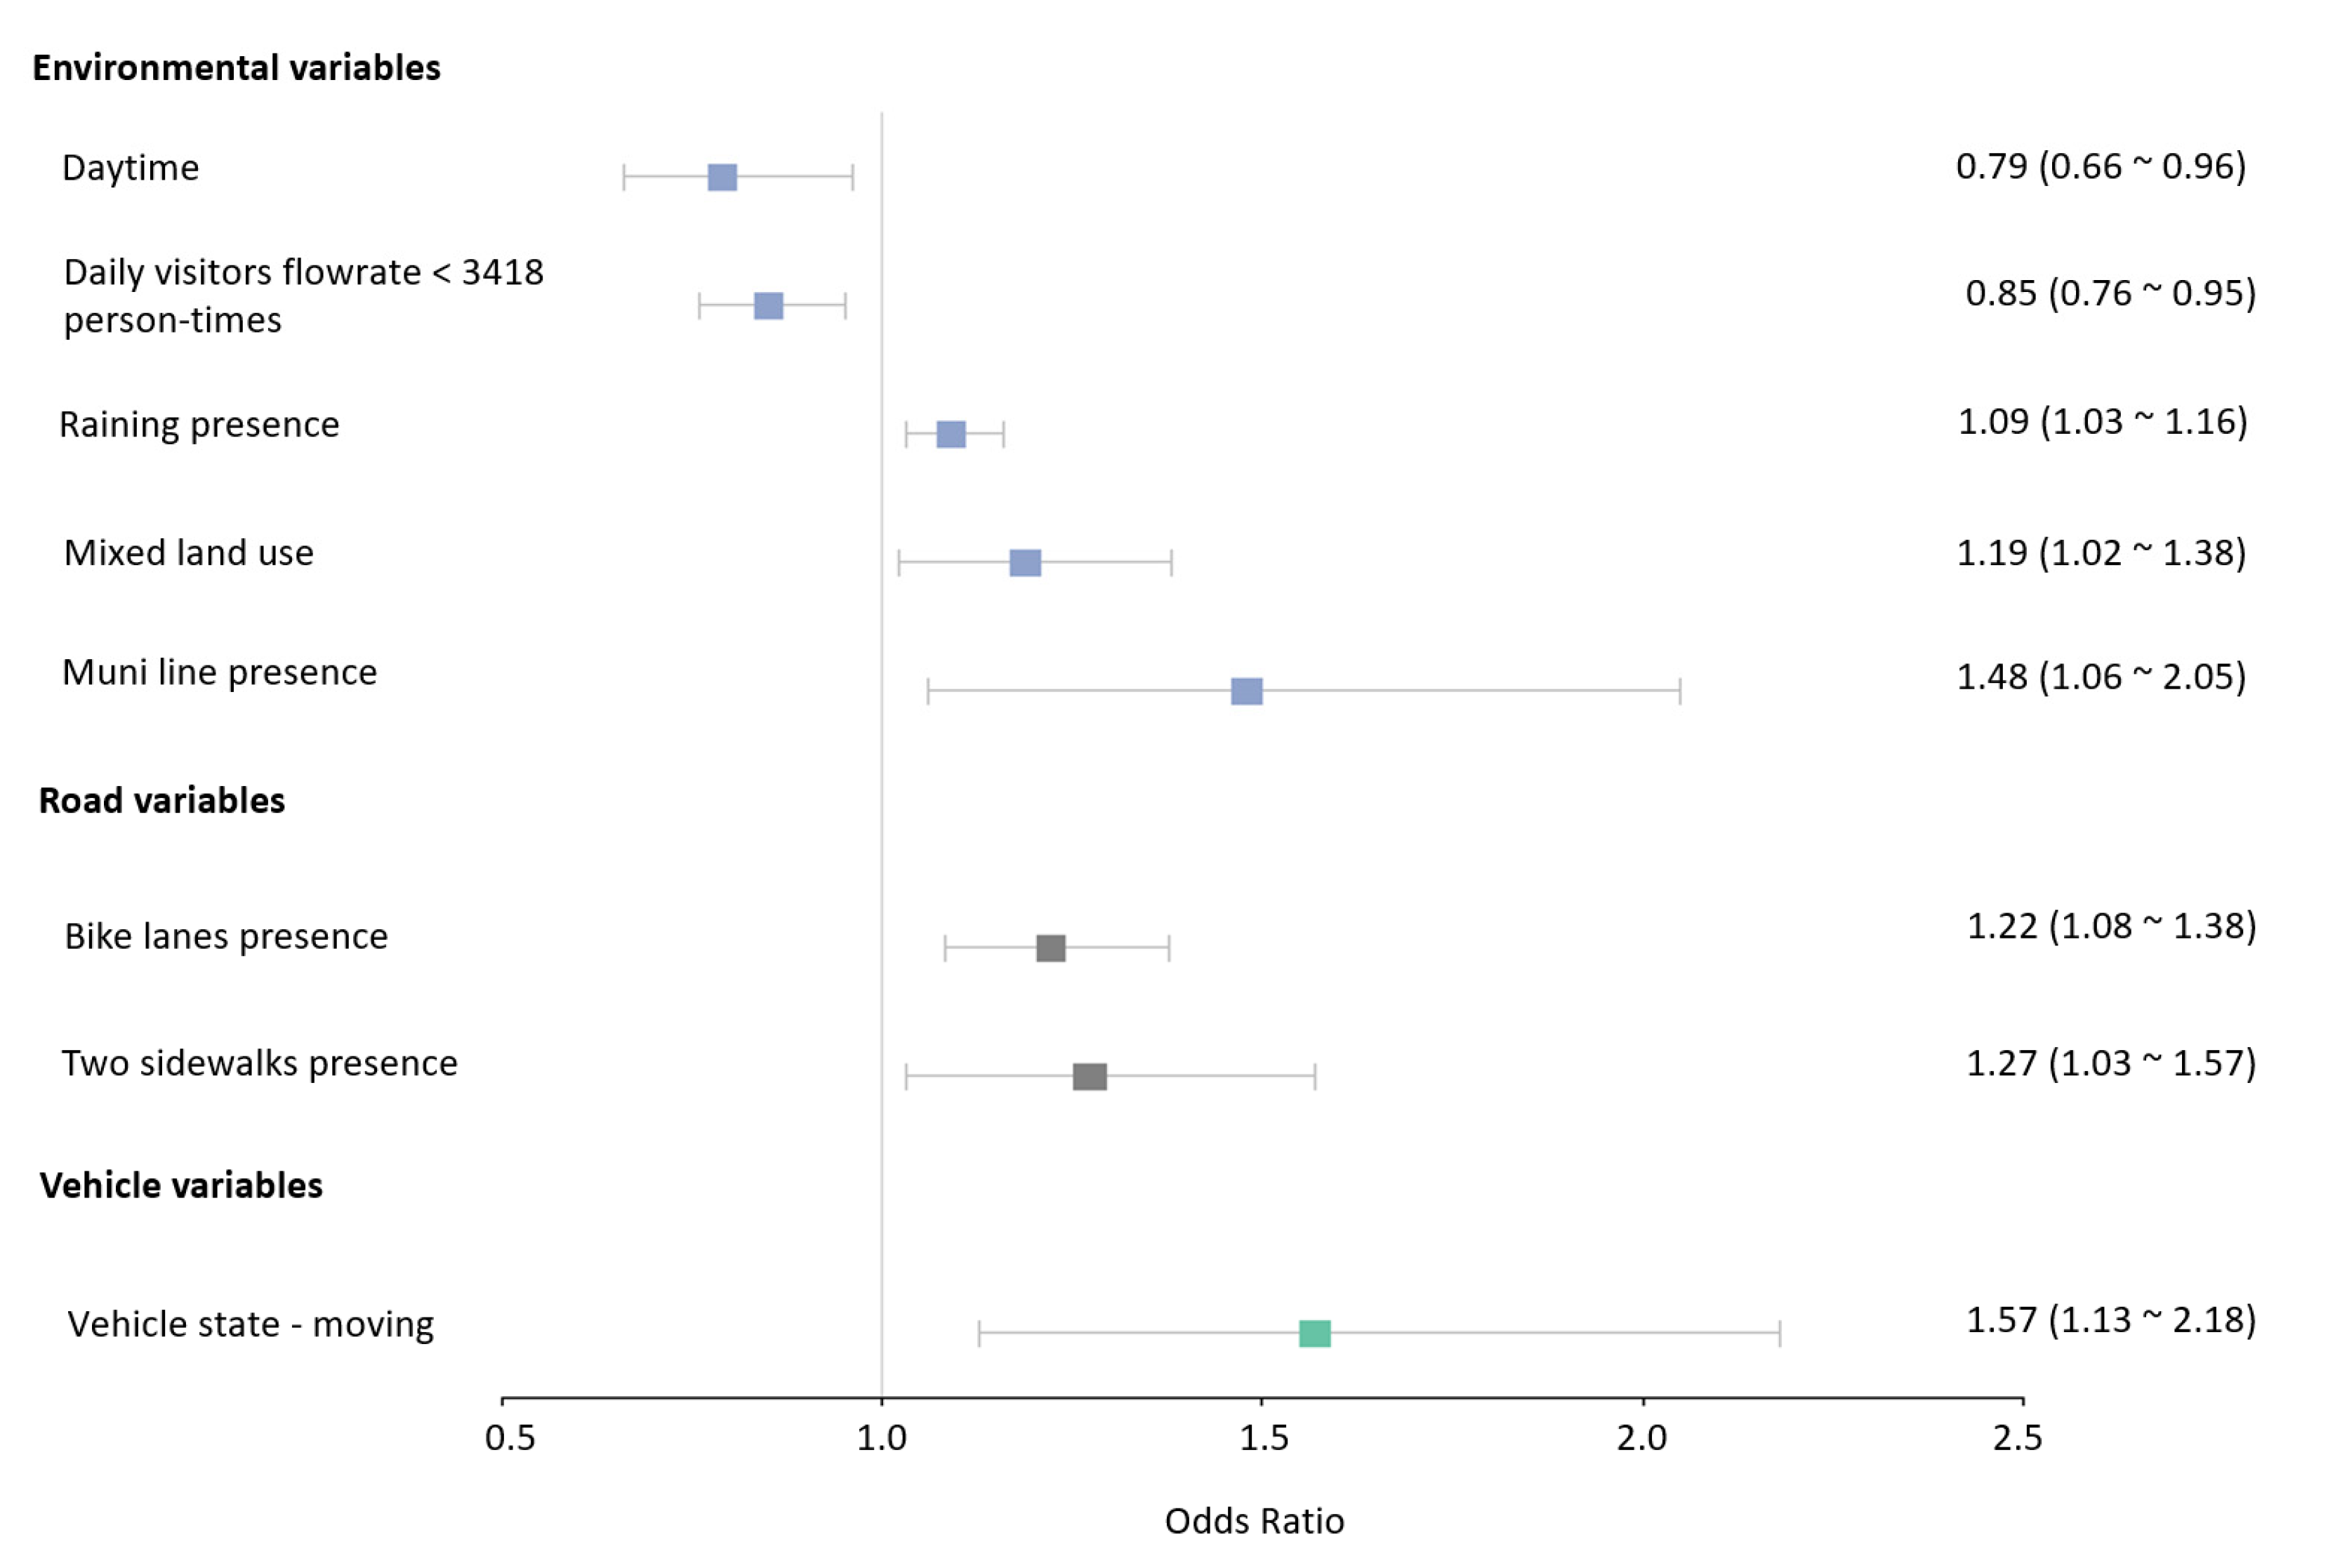
| Daytime | −0.23 (0.08) | 0.79 (0.66~0.96) |
| Night * | 0 | 1 |
| Daily visitors’ flowrate (DVF) < 3418 person-times | −0.16 (0.10) | 0.85 (0.76~0.95) |
| DVF > 40,040 person-times * | 0 | 1 |
| Raining presence | 0.09 (0.27) | 1.09 (1.03~1.16) |
| Raining absence * | 0 | 1 |
| Mixed land use # | 0.17 (0.12) | 1.19 (1.02~1.38) |
| Residential land use * | 0 | 1 |
| Muni line presence | 0.39 (0.09) | 1.48 (1.06~2.05) |
| Muni line absence * | 0 | 1 |
| Road variables | ||
| Bike lanes presence | 0.20 (0.09) | 1.22 (1.08~1.38) |
| Bike lanes absence * | 0 | 1 |
| Two sidewalks presence | 0.24 (0.17) | 1.27 (1.03~1.57) |
| Absence or only one sidewalk * | 0 | 1 |
| Vehicle variables | ||
| Vehicle state-moving | 0.45 (0.28) | 1.57 (1.13~2.18) |
| Vehicle state-stopped * | 0 | 1 |
| Intercept (level 1) | 0.45 (0.32) | 1.57 (1.01~2.44) |
| Random effects | ||
| Vehicle state-moving | 0.16 (0.13) | 1.17 (1.00~1.38) |
| Intercept (Vehicle company & year) | 0.09 (0.10) | 1.09 (1.06~1.13) |
| WAIC | 62.8 | |
| LOO | 63.4 | |
| Parameters | Estimate (std Error) | Odds Ratio (95% Confidence Interval) |
|---|---|---|
| Fixed effects | ||
| Environmental variables | ||
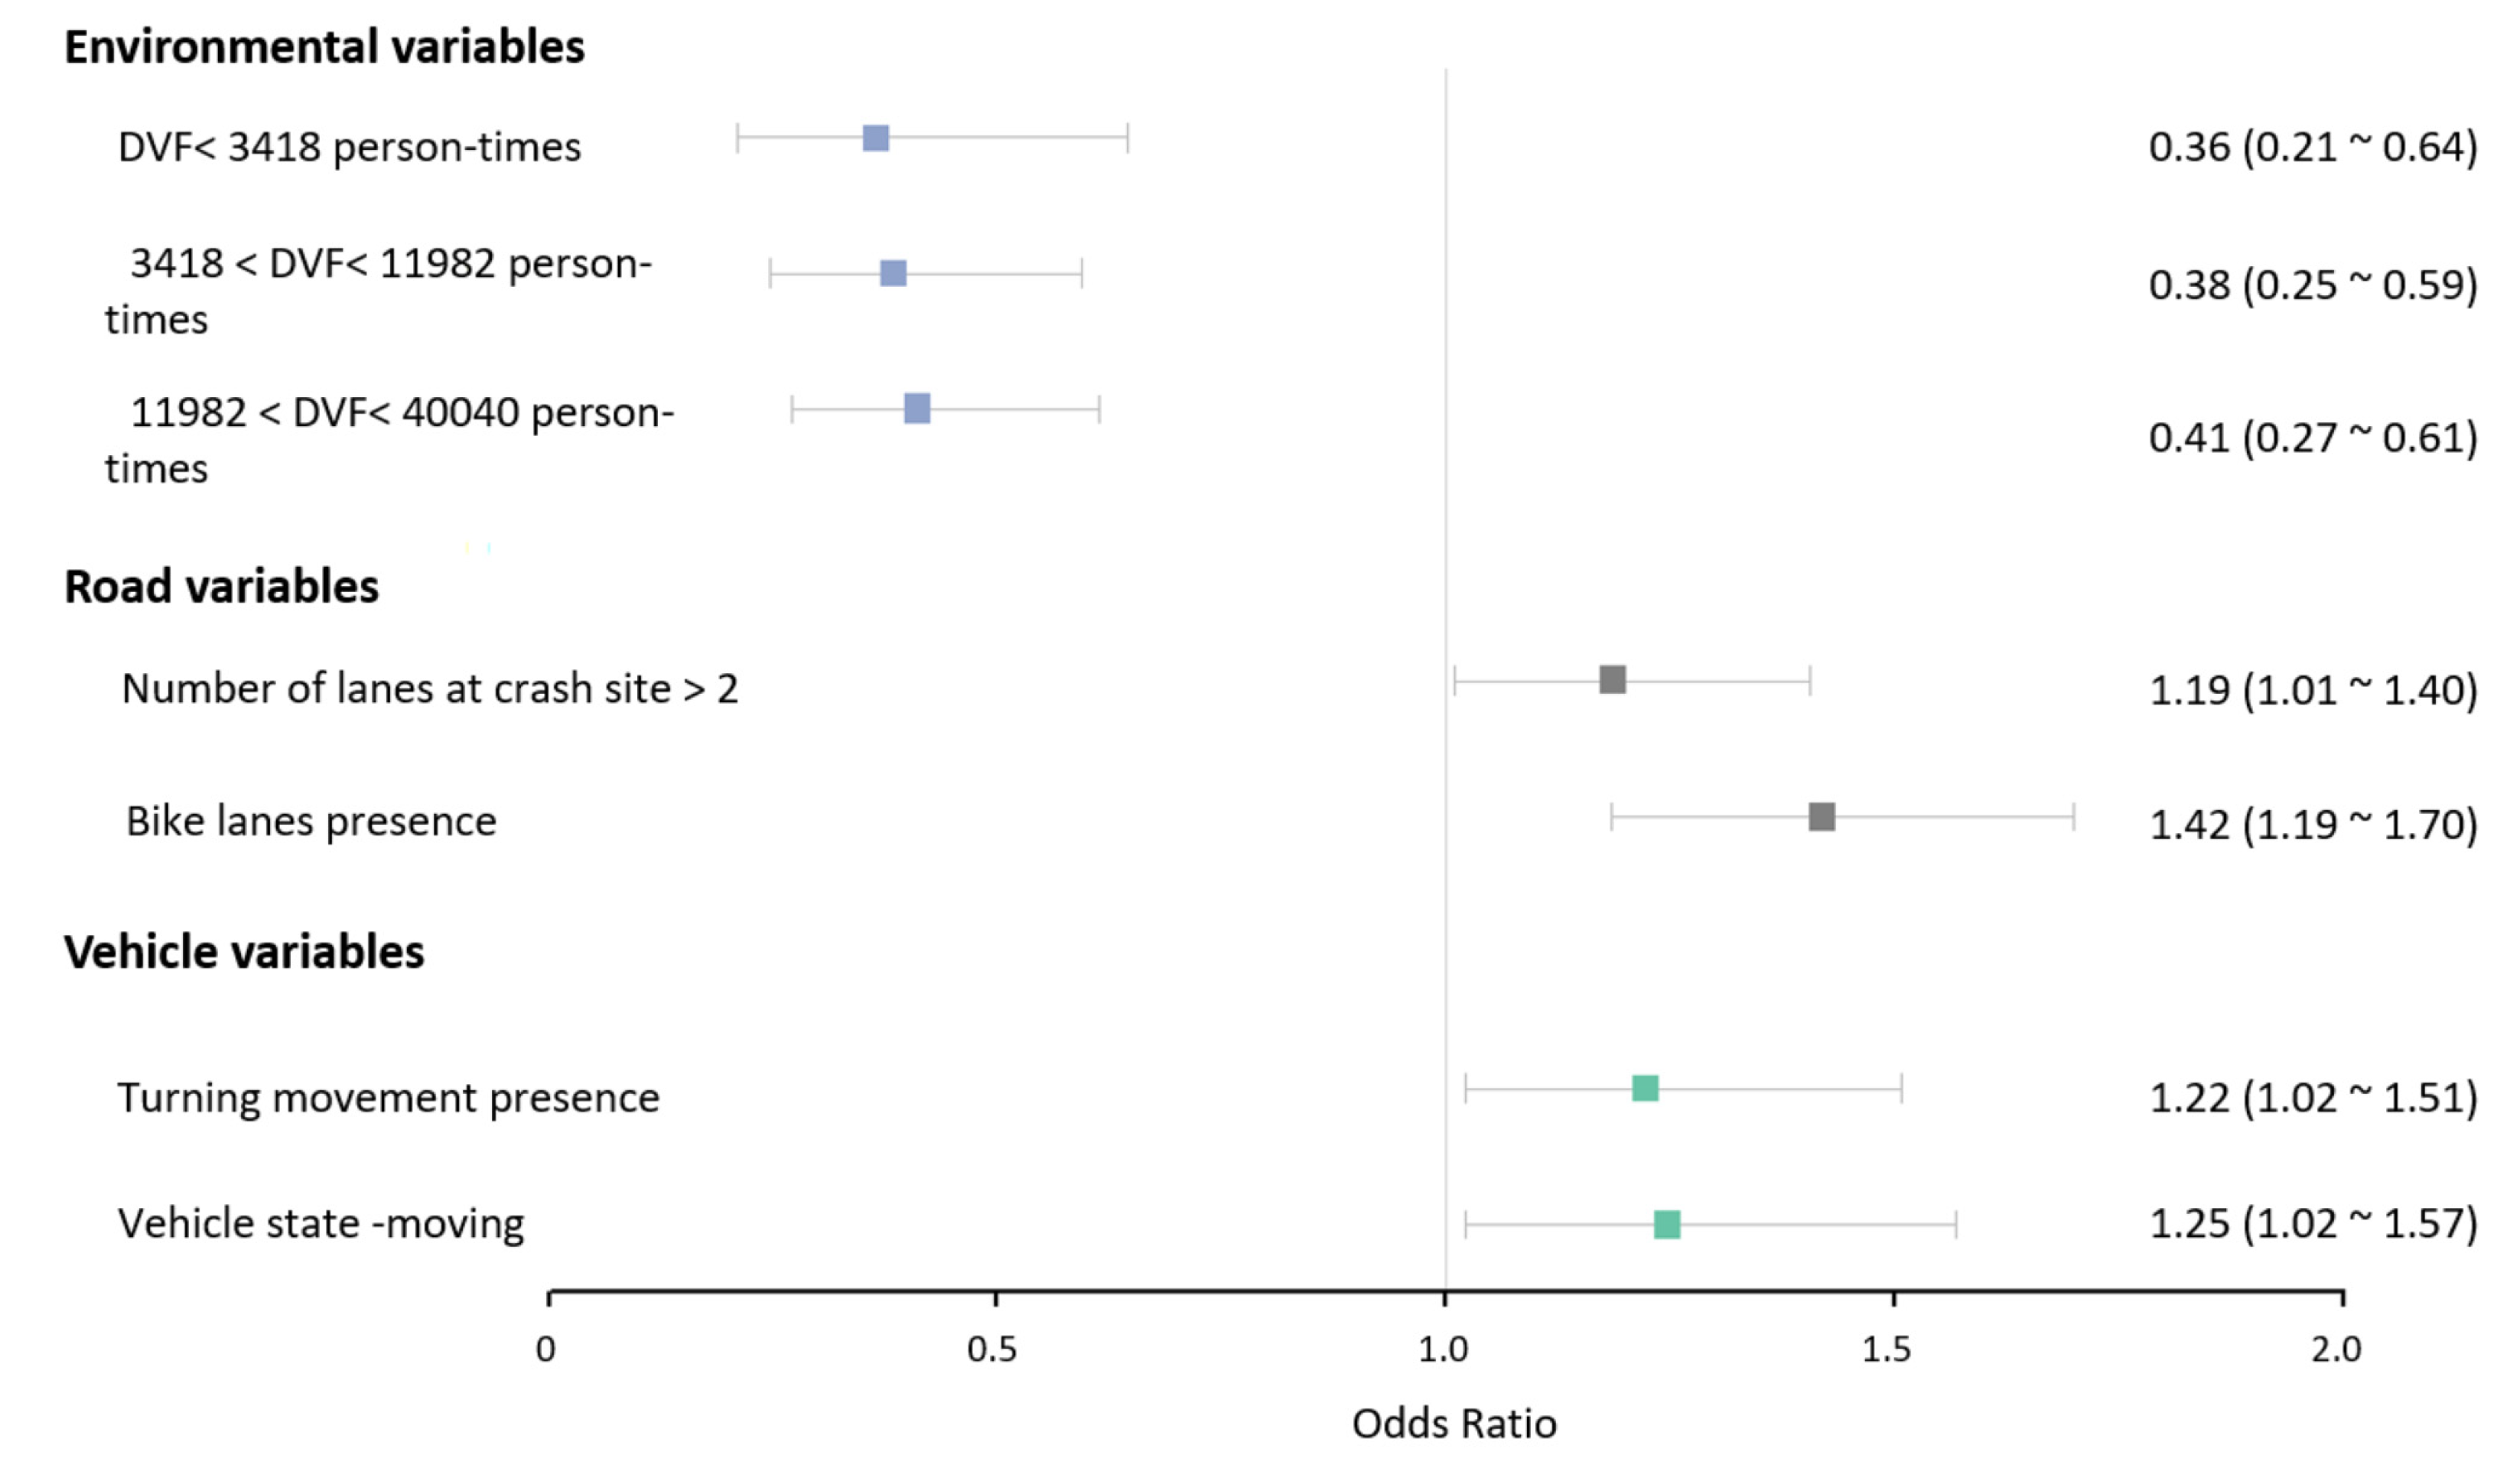
| Daily visitors’ flowrate (DVF) < 3418 person-times # | −1.01 (0.28) | 0.36 (0.21~0.64) |
| 3418 < DVF < 11,982 person-times | −0.96 (0.22) | 0.38 (0.25~0.59) |
| 11,982 < DVF < 40,040 person-times | −0.89 (0.21) | 0.41 (0.27~0.61) |
| DVF > 40040 person-times * | 0 | 1 |
| Road variables | ||
| Number of lanes at crash site > 2 | 0.17 (0.10) | 1.19 (1.01~1.40) |
| Number of lanes at crash site ≤ 2 * | 0 | 1 |
| Bike lanes presence | 0.35 (0.09) | 1.42 (1.19~1.70) |
| Bike lanes absence * | 0 | 1 |
| Vehicle variables | ||
| Turning movement presence | 0.20 (0.10) | 1.22 (1.02~1.51) |
| Turning movement absence * | 0 | 1 |
| Vehicle state-moving | 0.22 (0.11) | 1.25 (1.02~1.57) |
| Vehicle state-stopped * | 0 | 1 |
| Intercept (level 1) | 0.74 (0.23) | 2.09 (1.32~3.19) |
| Random effects | ||
| DVF < 3418 person-times | 0.30 (0.23) | 1.35 (1.03~2.53) |
| Intercept (Vehicle company & year) | 0.21 (0.28) | 1.23 (1.01~3.63) |
| WAIC | 52.6 | |
| LOO | 53.3 |
| Bayesian Logistic Regression Models (with Only Fixed Effects) | Hierarchical Bayesian Models with Random Intercept | Hierarchical Bayesian Models with Both Random Intercept and Random Slopes | ||||
|---|---|---|---|---|---|---|
| WAIC | LOO | WAIC | LOO | WAIC | LOO | |
| Models for crash severity in the autonomous mode | 74.4 | 76.5 | 64.5 | 64.9 | 62.8 | 63.4 |
| Models for crash severity in the conventional mode | 60.9 | 61.9 | 53.3 | 53.7 | 52.6 | 53.3 |
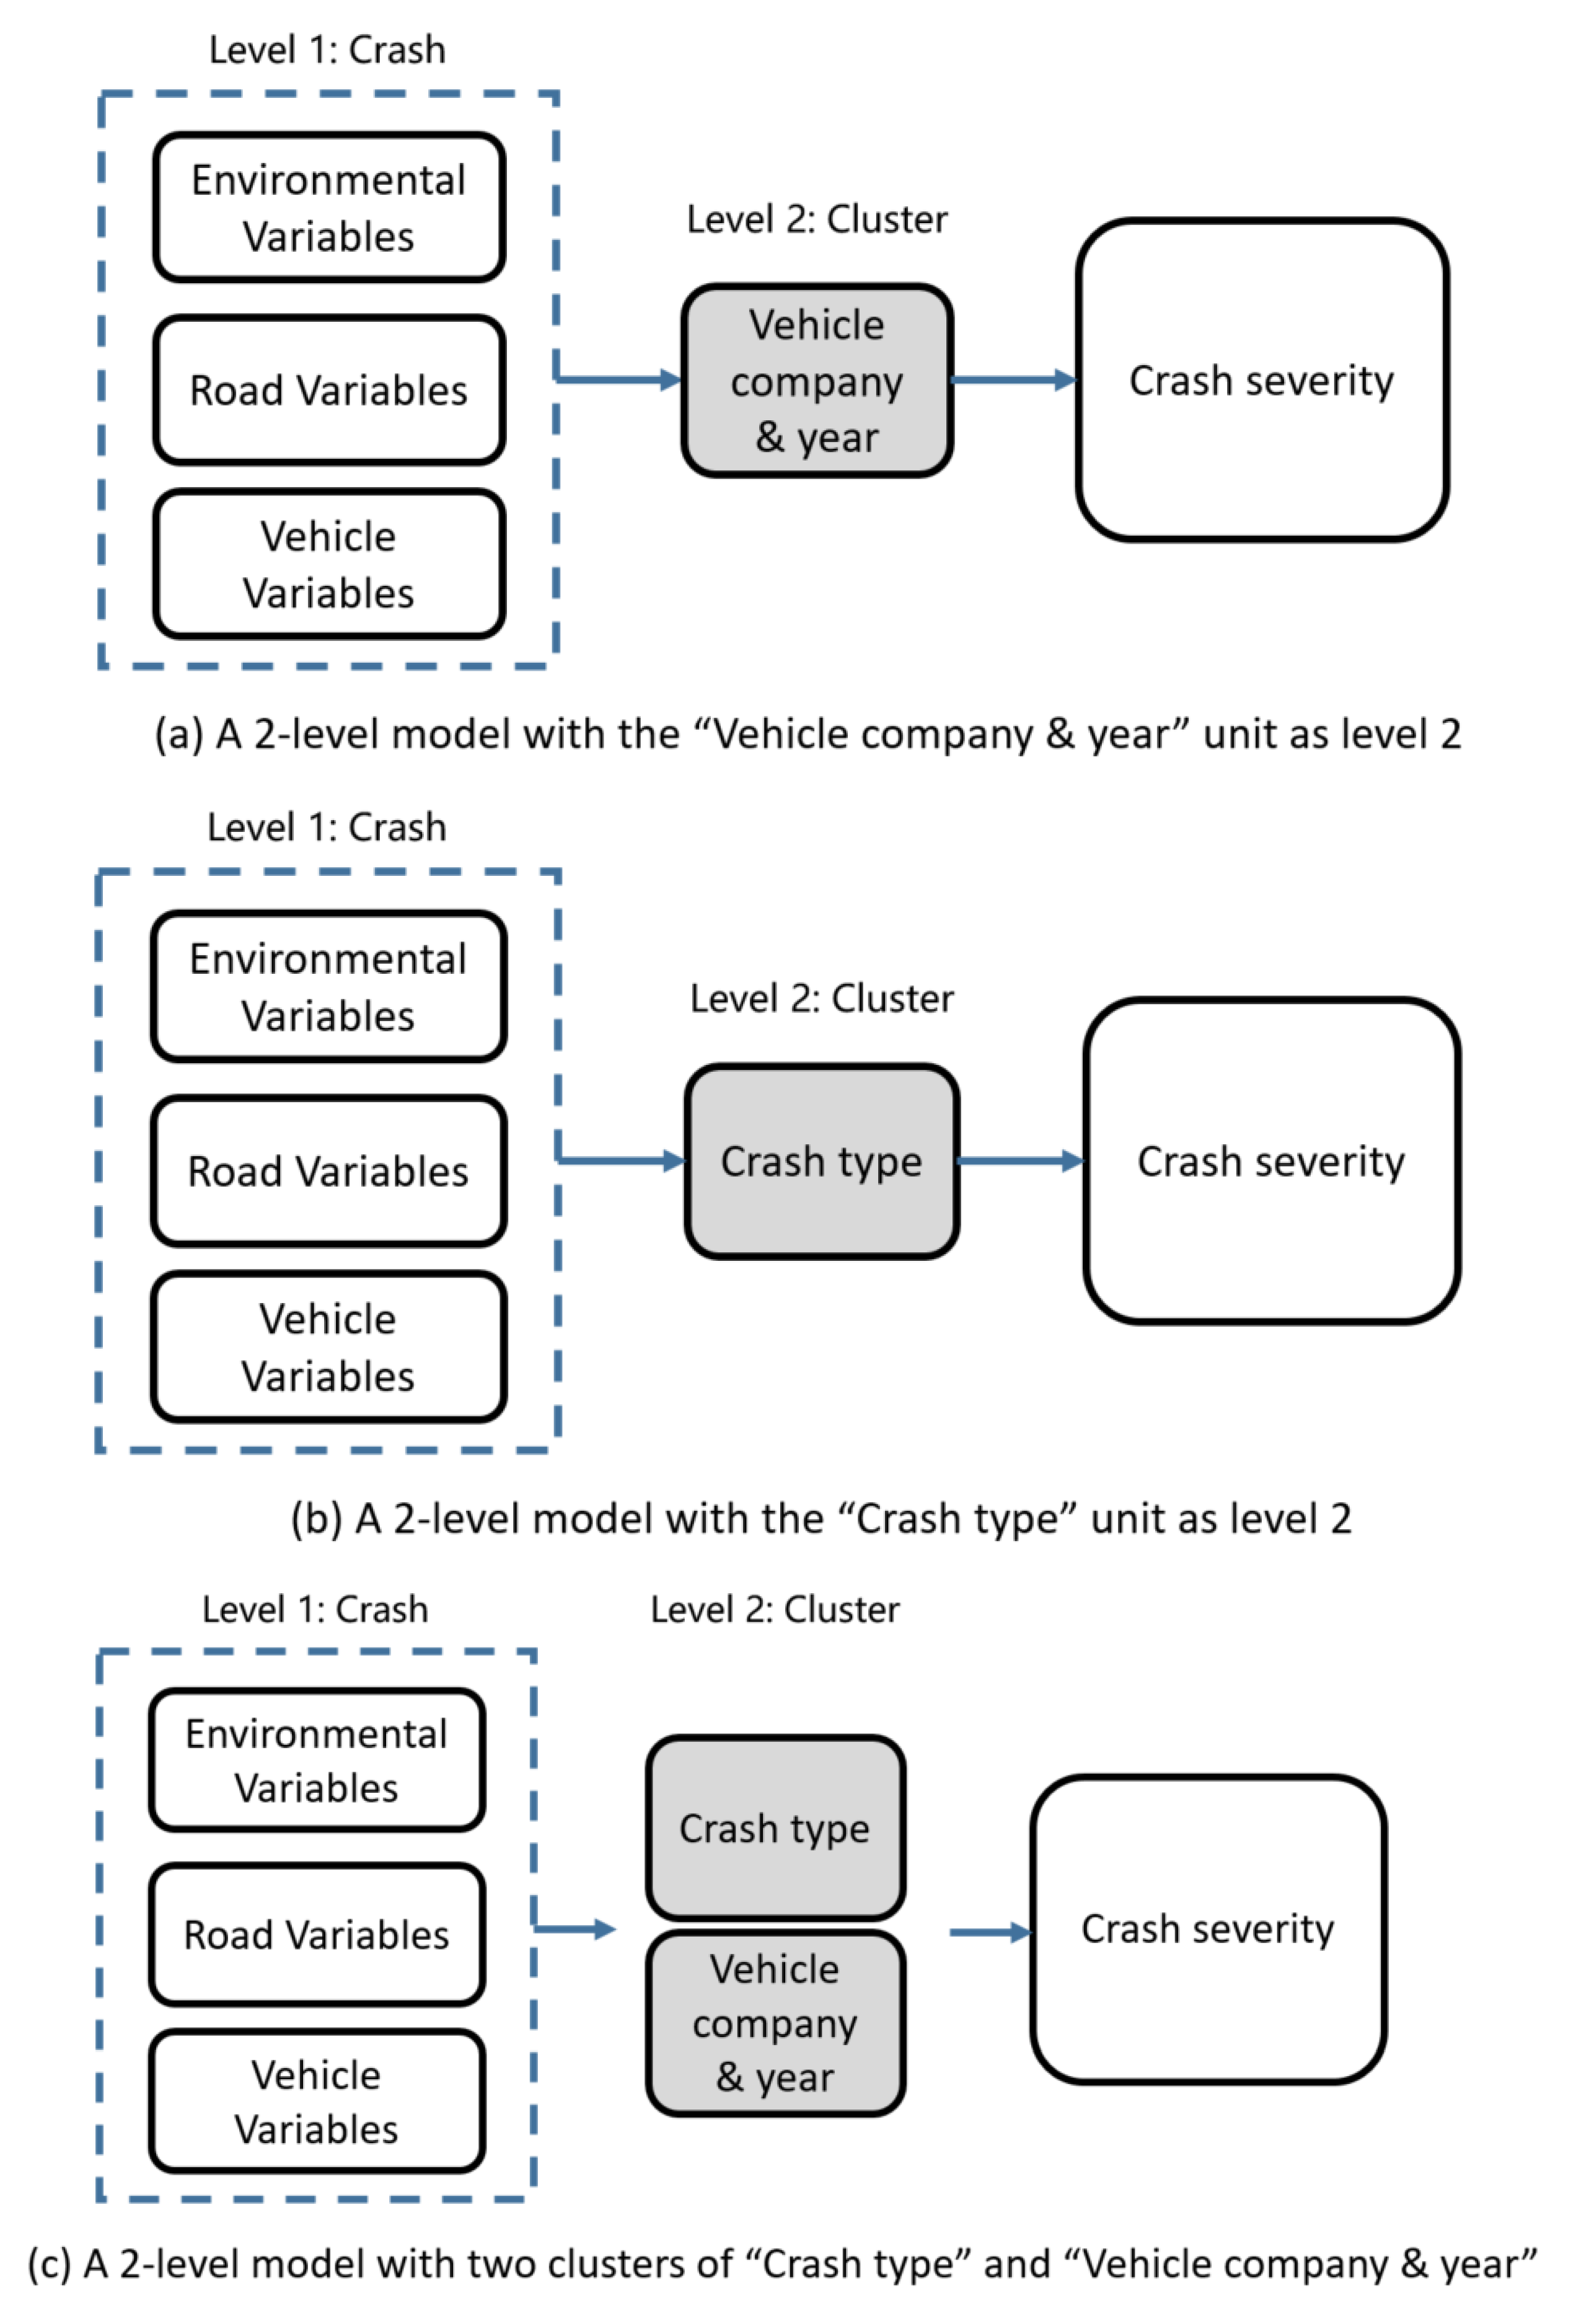
| The 2-Level Hierarchical Bayesian Models with “Vehicle Company & Year” Unit as Level 2 | The 2-Level Hierarchical Bayesian Models with “Crash Type” Unit as Level 2 | A 2-Level Model with Two Clusters of “Crash Type” and “Vehicle Company & Year” | ||||
|---|---|---|---|---|---|---|
| WAIC | LOO | WAIC | LOO | WAIC | LOO | |
| Models for crash severity in the autonomous mode | 62.8 | 63.4 | 65.1 | 66.0 | 63.1 | 63.8 |
| Models for crash severity in the conventional mode | 52.6 | 53.3 | 54.7 | 55.2 | 53.5 | 54.0 |
Publisher’s Note: MDPI stays neutral with regard to jurisdictional claims in published maps and institutional affiliations. |
© 2022 by the authors. Licensee MDPI, Basel, Switzerland. This article is an open access article distributed under the terms and conditions of the Creative Commons Attribution (CC BY) license (https://creativecommons.org/licenses/by/4.0/).
Share and Cite
Ren, W.; Yu, B.; Chen, Y.; Gao, K. Divergent Effects of Factors on Crash Severity under Autonomous and Conventional Driving Modes Using a Hierarchical Bayesian Approach. Int. J. Environ. Res. Public Health 2022, 19, 11358. https://doi.org/10.3390/ijerph191811358
Ren W, Yu B, Chen Y, Gao K. Divergent Effects of Factors on Crash Severity under Autonomous and Conventional Driving Modes Using a Hierarchical Bayesian Approach. International Journal of Environmental Research and Public Health. 2022; 19(18):11358. https://doi.org/10.3390/ijerph191811358
Chicago/Turabian StyleRen, Weixi, Bo Yu, Yuren Chen, and Kun Gao. 2022. "Divergent Effects of Factors on Crash Severity under Autonomous and Conventional Driving Modes Using a Hierarchical Bayesian Approach" International Journal of Environmental Research and Public Health 19, no. 18: 11358. https://doi.org/10.3390/ijerph191811358
APA StyleRen, W., Yu, B., Chen, Y., & Gao, K. (2022). Divergent Effects of Factors on Crash Severity under Autonomous and Conventional Driving Modes Using a Hierarchical Bayesian Approach. International Journal of Environmental Research and Public Health, 19(18), 11358. https://doi.org/10.3390/ijerph191811358