

A Nutritionally Complete Oral Nutritional Supplement Powder Improved Nutritional Outcomes in Free-Living Adults at Risk of Malnutrition: A Randomized Controlled Trial


Abstract
:1. Introduction
2. Materials and Methods
2.1. Participants
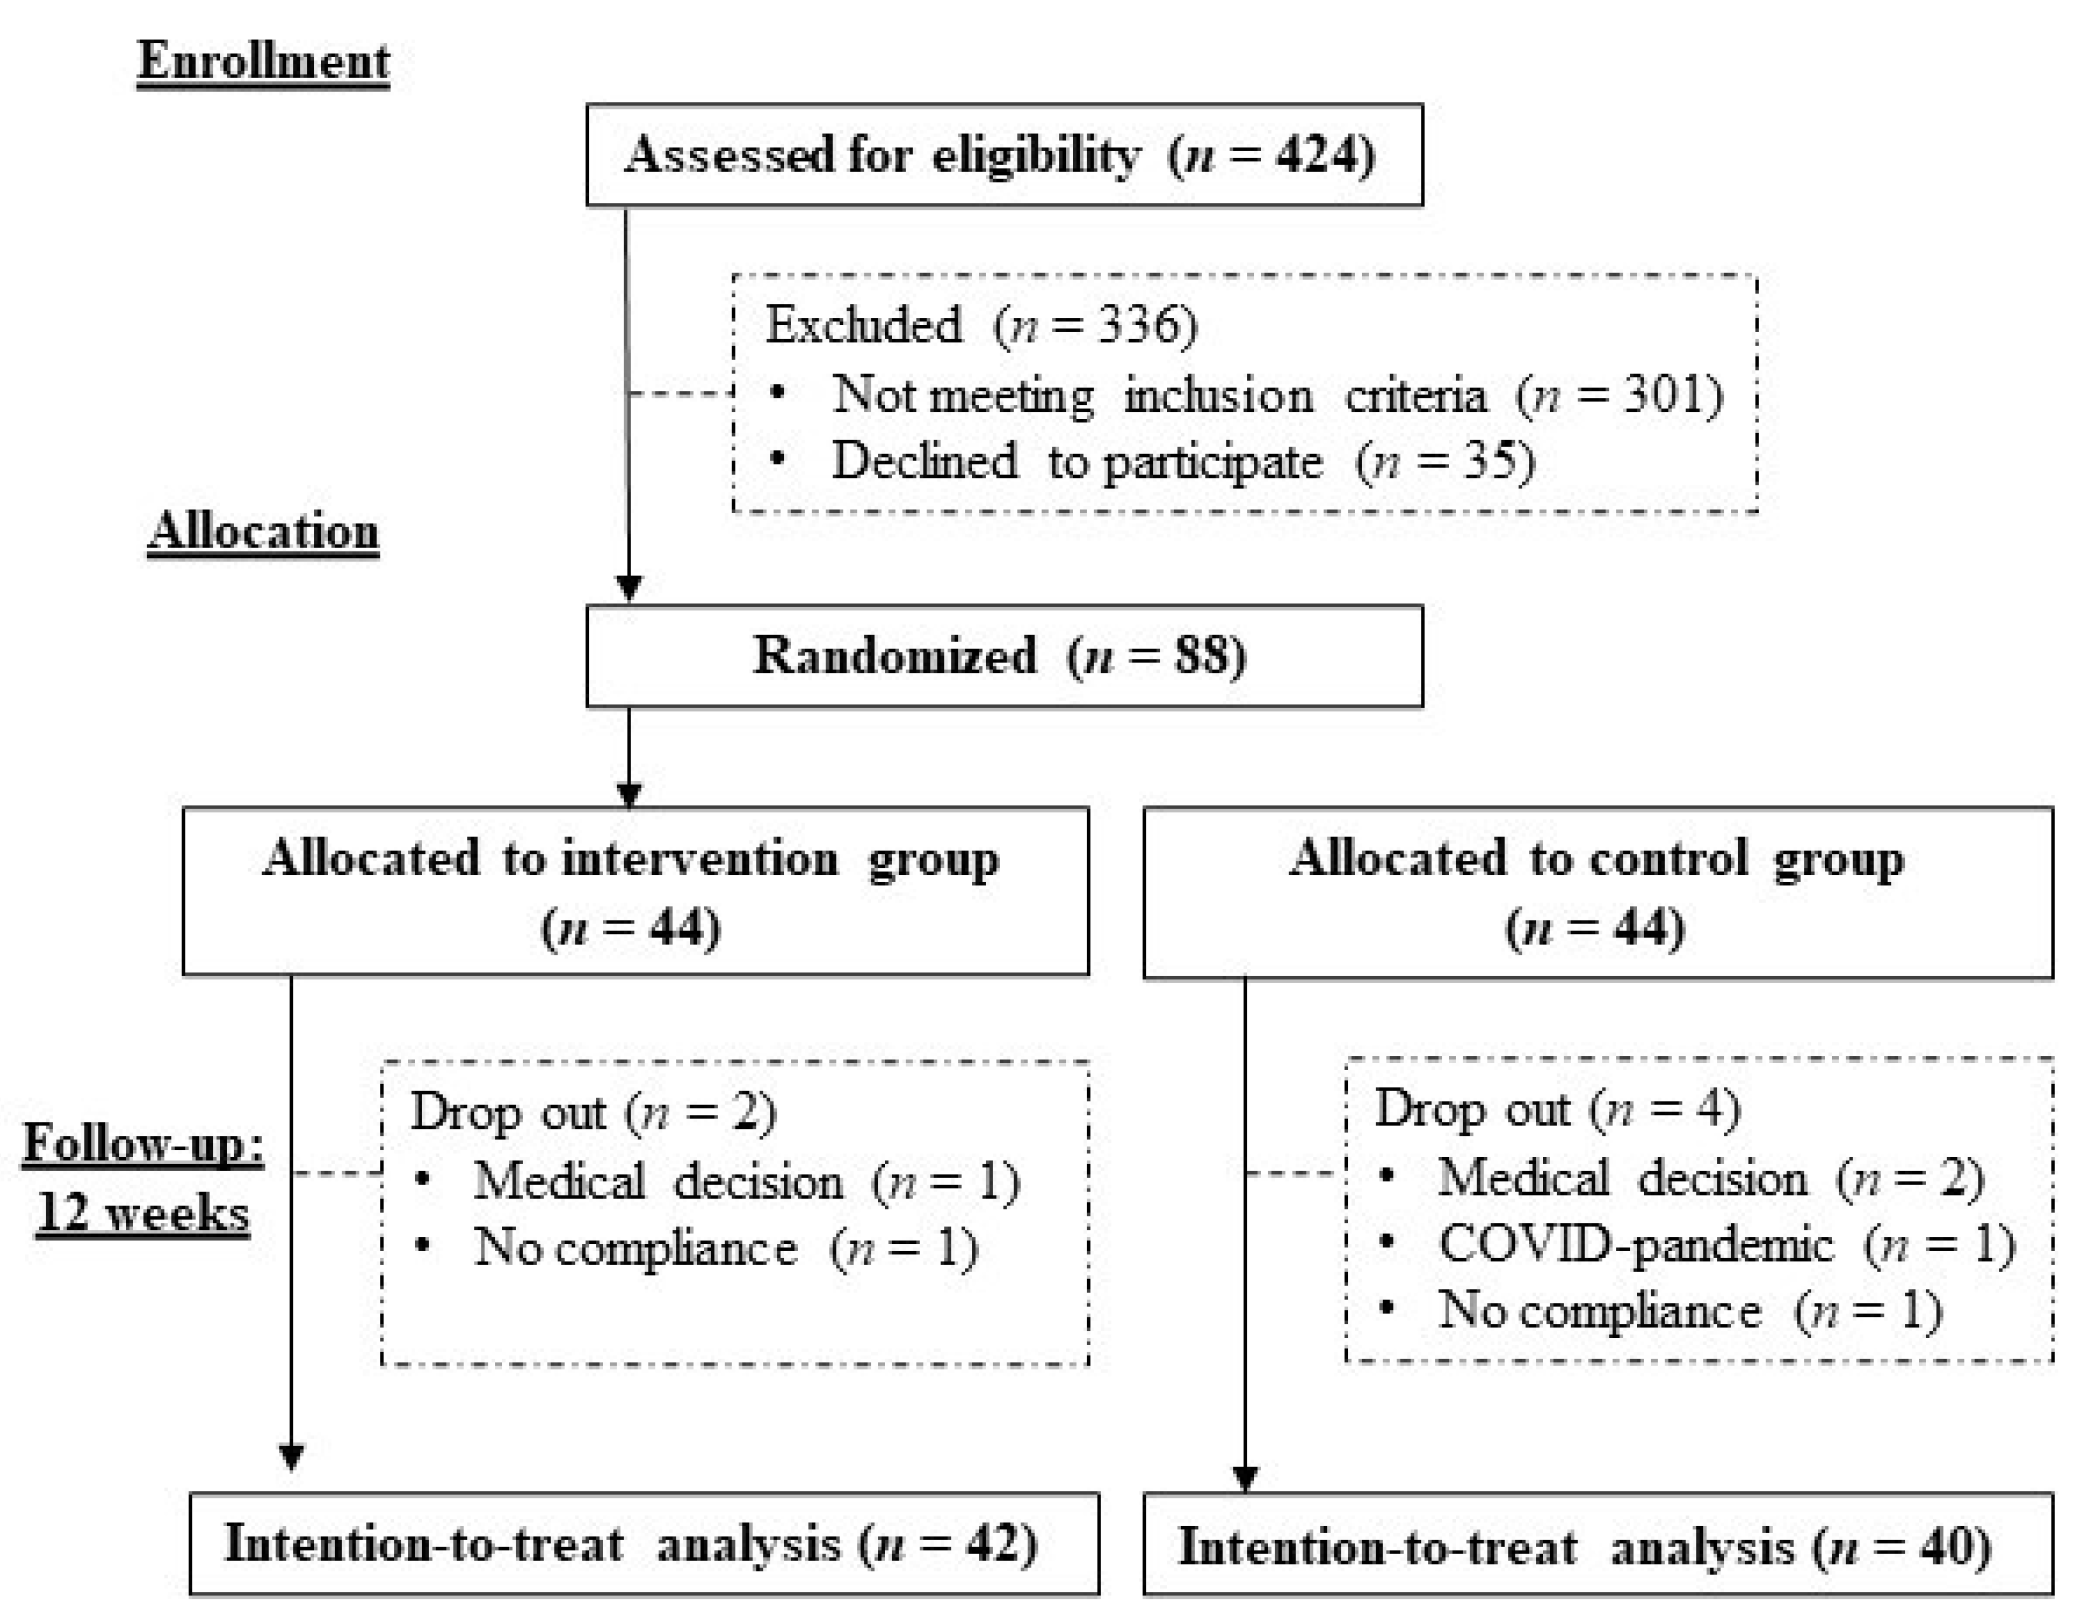
2.2. Study Design
2.3. Data Collection
2.4. Sample Size Calculations
2.5. Intervention and Control Group
2.6. Adverse Events Associated with Nutritional Intervention
2.7. Statistical Analysis
3. Results
3.1. Characteristics of Participants
3.2. Study Outcomes
3.3. Adverse Events
4. Discussion
4.1. Strengths and Limitations
4.2. Implications for Clinical Practice
5. Conclusions
Supplementary Materials
Author Contributions
Funding
Institutional Review Board Statement
Informed Consent Statement
Data Availability Statement
Conflicts of Interest
References
- Beard, J.R.; Officer, A.; de Carvalho, I.A.; Sadana, R.; Pot, A.M.; Michel, J.-P.; Lloyd-Sherlock, P.; Epping-Jordan, J.E.; Peeters, G.M.E.E.G.; Mahanani, W.R.; et al. The World report on ageing and health: A policy framework for healthy ageing. Lancet 2016, 387, 2145–2154. [Google Scholar] [CrossRef]
- Steptoe, A.; Deaton, A.; Stone, A.A. Subjective wellbeing, health, and ageing. Lancet 2015, 385, 640–648. [Google Scholar] [CrossRef]
- Woo, J. Designing Fit for Purpose Health and Social Services for Ageing Populations. Int. J. Environ. Res. Public Health 2017, 14, 457. [Google Scholar] [CrossRef] [PubMed]
- Norman, K.; Haß, U.; Pirlich, M. Malnutrition in Older Adults—Recent Advances and Remaining Challenges. Nutrients 2021, 13, 2764. [Google Scholar] [CrossRef]
- Agarwal, E.; Miller, M.; Yaxley, A.; Isenring, E. Malnutrition in the elderly: A narrative review. Maturitas 2013, 76, 296–302. [Google Scholar] [CrossRef]
- Cereda, E.; Pedrolli, C.; Klersy, C.; Bonardi, C.; Quarleri, L.; Cappello, S.; Turri, A.; Rondanelli, M.; Caccialanza, R. Nutritional status in older persons according to healthcare setting: A systematic review and meta-analysis of prevalence data using MNA®. Clin. Nutr. 2016, 35, 1282–1290. [Google Scholar] [CrossRef]
- Snider, J.T.; Linthicum, M.T.; Wu, Y.; LaVallee, C.; Lakdawalla, D.N.; Hegazi, R.; Matarese, L. Economic Burden of Community-Based Disease-Associated Malnutrition in the United States. J. Parenter. Enter. Nutr. 2014, 38, 77S–85S. [Google Scholar] [CrossRef]
- Linthicum, M.T.; Snider, J.T.; Vaithianathan, R.; Wu, Y.; Lavallee, C.; Lakdawalla, D.N.; Benner, J.E.; Philipson, T.J. Economic Burden of Disease-Associated Malnutrition in China. Asia Pac. J. Public Health 2015, 27, 407–417. [Google Scholar] [CrossRef]
- Elia, M.; Normand, C.; Laviano, A.; Norman, K. A systematic review of the cost and cost effectiveness of using standard oral nutritional supplements in community and care home settings. Clin. Nutr. 2016, 35, 125–137. [Google Scholar] [CrossRef]
- Correa-Perez, A.; Abraha, I.; Cherubini, A.; Collinson, A.; Dardevet, D.; de Groot, L.; de van der Schueren, M.A.E.; Hebestreit, A.; Hickson, M.; Jaramillo-Hidalgo, J.; et al. Efficacy of non-pharmacological interventions to treat malnutrition in older persons: A systematic review and meta-analysis. The SENATOR project ONTOP series and MaNuEL knowledge hub project. Ageing Res. Rev. 2019, 49, 27–48. [Google Scholar] [CrossRef] [Green Version]
- Cawood, A.; Elia, M.; Stratton, R. Systematic review and meta-analysis of the effects of high protein oral nutritional supplements. Ageing Res. Rev. 2012, 11, 278–296. [Google Scholar] [CrossRef]
- Gomes, F.; Baumgartner, A.; Bounoure, L.; Bally, M.; Deutz, N.E.; Greenwald, J.L.; Stanga, Z.; Mueller, B.; Schuetz, P. Association of Nutritional Support With Clinical Outcomes Among Medical Inpatients Who Are Malnourished or at Nutritional Risk: An Updated Systematic Review and Meta-analysis. JAMA Netw. Open 2019, 2, e1915138. [Google Scholar] [CrossRef]
- Smith, T.R.; Cawood, A.L.; Walters, E.R.; Guildford, N.; Stratton, R.J. Ready-Made Oral Nutritional Supplements Improve Nutritional Outcomes and Reduce Health Care Use—A Randomised Trial in Older Malnourished People in Primary Care. Nutrients 2020, 12, 517. [Google Scholar] [CrossRef]
- Chew, S.T.H.; Tan, N.C.; Cheong, M.; Oliver, J.; Baggs, G.; Choe, Y.; How, C.H.; Chow, W.L.; Tan, C.Y.L.; Kwan, S.C.; et al. Impact of specialized oral nutritional supplement on clinical, nutritional, and functional outcomes: A randomized, placebo-controlled trial in community-dwelling older adults at risk of malnutrition. Clin. Nutr. 2021, 40, 1879–1892. [Google Scholar] [CrossRef]
- Cederholm, T.; Barazzoni, R.; Austin, P.; Ballmer, P.; Biolo, G.; Bischoff, S.C.; Compher, C.; Correia, I.; Higashiguchi, T.; Holst, M.; et al. ESPEN guidelines on definitions and terminology of clinical nutrition. Clin. Nutr. 2017, 36, 49–64. [Google Scholar] [CrossRef]
- Guigoz, P.Y.; Vellas, M.B.; Garry, P.P.J. Assessing the Nutritional Status of the Elderly: The Mini Nutritional Assessment as Part of the Geriatric Evaluation. Nutr. Rev. 1996, 54, S59–S65. [Google Scholar] [CrossRef]
- Ng, T.P.; Jin, A.; Chow, K.Y.; Feng, L.; Nyunt, M.S.Z.; Yap, K.B. Age-dependent relationships between body mass index and mortality: Singapore longitudinal ageing study. PLoS ONE 2017, 12, e0180818. [Google Scholar] [CrossRef]
- Song, Y.-M.; Ha, M.; Sung, J. Body Mass Index and Mortality in Middle-Aged Korean Women. Ann. Epidemiol. 2007, 17, 556–563. [Google Scholar] [CrossRef]
- Zheng, W.; McLerran, D.F.; Rolland, B.; Zhang, X.; Inoue, M.; Matsuo, K.; He, J.; Gupta, P.C.; Ramadas, K.; Tsugane, S.; et al. Association between Body-Mass Index and Risk of Death in More Than 1 Million Asians. N. Engl. J. Med. 2011, 364, 719–729. [Google Scholar] [CrossRef]
- WHO Expert Consultation. Appropriate body-mass index for Asian populations and its implications for policy and intervention strategies. Lancet 2004, 363, 157–163. [Google Scholar] [CrossRef]
- Chen, L.-K.; Woo, J.; Assantachai, P.; Auyeung, T.-W.; Chou, M.-Y.; Iijima, K.; Jang, H.C.; Kang, L.; Kim, M.; Kim, S.; et al. Asian Working Group for Sarcopenia: 2019 Consensus Update on Sarcopenia Diagnosis and Treatment. J. Am. Med. Dir. Assoc. 2020, 21, 300–307.e2. [Google Scholar] [CrossRef]
- Ling, C.H.; Meskers, C.G.; Maier, A.B. Can anthropometric measures be used as proxies for body composition and physical function in geriatric outpatients? Arch. Gerontol. Geriatr. 2021, 94, 104379. [Google Scholar] [CrossRef]
- Kawakami, R.; Murakami, H.; Sanada, K.; Tanaka, N.; Sawada, S.; Tabata, I.; Higuchi, M.; Miyachi, M. Calf circumference as a surrogate marker of muscle mass for diagnosing sarcopenia in Japanese men and women. Geriatr. Gerontol. Int. 2015, 15, 969–976. [Google Scholar] [CrossRef]
- Hu, F.-J.; Liu, H.; Liu, X.-L.; Jia, S.-L.; Hou, L.-S.; Xia, X.; Dong, B.-R. Mid-Upper Arm Circumference as an Alternative Screening Instrument to Appendicular Skeletal Muscle Mass Index for Diagnosing Sarcopenia. Clin. Interv. Aging 2021, 16, 1095–1104. [Google Scholar] [CrossRef]
- Tsai, H.-J.; Chang, F.-K. Associations between body mass index, mid-arm circumference, calf circumference, and functional ability over time in an elderly Taiwanese population. PLoS ONE 2017, 12, e0175062. [Google Scholar] [CrossRef]
- Tsai, A.C.-H.; Lai, M.-C.; Chang, T.-L. Mid-arm and calf circumferences (MAC and CC) are better than body mass index (BMI) in predicting health status and mortality risk in institutionalized elderly Taiwanese. Arch. Gerontol. Geriatr. 2012, 54, 443–447. [Google Scholar] [CrossRef]
- Wijnhoven, H.A.H.; Schueren, M.A.E.V.B.-D.V.D.; Heymans, M.W.; de Vet, H.C.W.; Kruizenga, H.M.; Twisk, J.W.; Visser, M. Low Mid-Upper Arm Circumference, Calf Circumference, and Body Mass Index and Mortality in Older Persons. J. Gerontol. A Biol. Sci. Med. Sci. 2010, 65, 1107–1114. [Google Scholar] [CrossRef]
- Zhang, X.-M.; Wu, X.; Ma, Y.; Zhu, C.; Cao, J.; Liu, G.; Li, F.-F.; Cheng, A.S. Comparing the Performance of Calf Circumference, Albumin, and BMI for Predicting Mortality in Immobile Patients. Risk Manag. Healthc. Policy 2021, 14, 2289–2300. [Google Scholar] [CrossRef]
- Schaap, L.A.; Quirke, T.; Wijnhoven, H.; Visser, M. Changes in body mass index and mid-upper arm circumference in relation to all-cause mortality in older adults. Clin. Nutr. 2018, 37, 2252–2259. [Google Scholar] [CrossRef]
- Shou, J.; Ren, L.; Wang, H.; Yan, F.; Cao, X.; Wang, H.; Wang, Z.; Zhu, S.; Liu, Y. Reliability and validity of 12-item Short-Form health survey (SF-12) for the health status of Chinese community elderly population in Xujiahui district of Shanghai. Aging Clin. Exp. Res. 2016, 28, 339–346. [Google Scholar] [CrossRef]
- Morley, J.E.; Malmstrom, T.K.; Miller, D.K. A simple frailty questionnaire (FRAIL) predicts outcomes in middle aged African Americans. J. Nutr. Health Aging 2012, 16, 601–608. [Google Scholar] [CrossRef] [PubMed]
- Yang, Y.; Wang, G.; Pan, X. China Food Composition 2002; Peking University Medical Press: Beijing, China, 2002. [Google Scholar]
- Stange, I.; Bartram, M.; Liao, Y.; Poeschl, K.; Kolpatzik, S.; Uter, W.; Sieber, C.C.; Stehle, P.; Volkert, D. Effects of a Low-Volume, Nutrient- and Energy-Dense Oral Nutritional Supplement on Nutritional and Functional Status: A Randomized, Controlled Trial in Nursing Home Residents. J. Am. Med. Dir. Assoc. 2013, 14, 628.e1–628.e8. [Google Scholar] [CrossRef] [PubMed]
- Kwok, T.; Woo, J.; Kwan, M. Does low lactose milk powder improve the nutritional intake and nutritional status of frail older Chinese people living in nursing homes? J. Nutr. Health Aging 2001, 5, 17–21. [Google Scholar] [PubMed]
- Zhu, L.-Y.; Chan, R.; Kwok, T.; Cheng, K.C.-C.; Ha, A.; Woo, J. Effects of exercise and nutrition supplementation in community-dwelling older Chinese people with sarcopenia: A randomized controlled trial. Age Ageing 2019, 48, 220–228. [Google Scholar] [CrossRef]
- Milne, A.C.; Potter, J.; Vivanti, A.; Avenell, A. Protein and energy supplementation in elderly people at risk from malnutrition. Cochrane Database Syst. Rev. 2009, 2009, Cd003288. [Google Scholar] [CrossRef]
- Volpi, E.; Nazemi, R.; Fujita, S. Muscle tissue changes with aging. Curr. Opin. Clin. Nutr. Metab. Care 2004, 7, 405–410. [Google Scholar] [CrossRef]
- Yeung, S.S.Y.; Reijnierse, E.M.; Pham, V.K.; Trappenburg, M.C.; Lim, W.K.; Meskers, C.G.M.; Maier, A.B. Sarcopenia and its association with falls and fractures in older adults: A systematic review and meta-analysis. J. Cachexia Sarcopenia Muscle 2019, 10, 485–500. [Google Scholar] [CrossRef]
- Shafiee, G.; Keshtkar, A.; Soltani, A.; Ahadi, Z.; Larijani, B.; Heshmat, R. Prevalence of sarcopenia in the world: A systematic review and meta- analysis of general population studies. J. Diabetes Metab. Disord. 2017, 16, 21. [Google Scholar] [CrossRef]
- Chen, L.; Arai, H.; Assantachai, P.; Akishita, M.; Chew, S.T.; Dumlao, L.C.; Duque, G.; Woo, J. Roles of nutrition in muscle health of community-dwelling older adults: Evidence-based expert consensus from Asian Working Group for Sarcopenia. J. Cachexia Sarcopenia Muscle 2022, 13, 1653–1672. [Google Scholar] [CrossRef]
- Choe, H.J.; Cho, B.L.; Park, Y.S.; Roh, E.; Kim, H.J.; Lee, S.; Kim, B.J.; Kim, M.; Won, C.W.; Jang, H.C. Gender differences in risk factors for the 2 year development of sarcopenia in community-dwelling older adults. J. Cachexia Sarcopenia Muscle 2022, 13, 1908–1918. [Google Scholar] [CrossRef]
- Tay, L.; Ding, Y.Y.; Leung, B.; Ismail, N.H.; Yeo, A.; Yew, S.; Tay, K.S.; Tan, C.H.; Chong, M.S. Sex-specific differences in risk factors for sarcopenia amongst community-dwelling older adults. AGE 2015, 37, 121. [Google Scholar] [CrossRef]
- Bauer, J.; Biolo, G.; Cederholm, T.; Cesari, M.; Cruz-Jentoft, A.J.; Morley, J.E.; Phillips, S.; Sieber, C.; Stehle, P.; Teta, D.; et al. Evidence-Based Recommendations for Optimal Dietary Protein Intake in Older People: A Position Paper From the PROT-AGE Study Group. J. Am. Med. Dir. Assoc. 2013, 14, 542–559. [Google Scholar] [CrossRef]
- Houston, D.K.; Nicklas, B.J.; Ding, J.; Harris, T.B.; Tylavsky, F.A.; Newman, A.B.; Lee, J.S.; Sahyoun, N.R.; Visser, M.; Kritchevsky, S.B.; et al. Dietary protein intake is associated with lean mass change in older, community-dwelling adults: The Health, Aging, and Body Composition (Health ABC) Study. Am. J. Clin. Nutr. 2008, 87, 150–155. [Google Scholar] [CrossRef]
- Hosoyama, T.; Iida, H.; Kawai-Takaishi, M.; Watanabe, K. Vitamin D Inhibits Myogenic Cell Fusion and Expression of Fusogenic Genes. Nutrients 2020, 12, 2192. [Google Scholar] [CrossRef]
- Robinson, S.M.; Reginster, J.Y.; Rizzoli, R.; Shaw, S.C.; Kanis, J.A.; Bautmans, I.; Bischoff-Ferrari, H.; Bruyère, O.; Cesari, M.; Dawson-Hughes, B.; et al. Does nutrition play a role in the prevention and management of sarcopenia? Clin. Nutr. 2018, 37, 1121–1132. [Google Scholar] [CrossRef]
- Wirth, J.; Hillesheim, E.; Brennan, L. The Role of Protein Intake and its Timing on Body Composition and Muscle Function in Healthy Adults: A Systematic Review and Meta-Analysis of Randomized Controlled Trials. J. Nutr. 2020, 150, 1443–1460. [Google Scholar] [CrossRef]
- Nunes, E.A.; Colenso-Semple, L.; McKellar, S.R.; Yau, T.; Ali, M.U.; Fitzpatrick-Lewis, D.; Sherifali, D.; Gaudichon, C.; Tomé, D.; Atherton, P.J.; et al. Systematic review and meta-analysis of protein intake to support muscle mass and function in healthy adults. J. Cachexia Sarcopenia Muscle 2022, 13, 795–810. [Google Scholar] [CrossRef]
- Cheng, S.-H.; Chen, K.-H.; Chen, C.; Chu, W.-C.; Kang, Y.-N. The Optimal Strategy of Vitamin D for Sarcopenia: A Network Meta-Analysis of Randomized Controlled Trials. Nutrients 2021, 13, 3589. [Google Scholar] [CrossRef]
- Ohta, H.; Uenishi, K.; Shiraki, M. Recent nutritional trends of calcium and vitamin D in East Asia. Osteoporos. Sarcopenia 2016, 2, 208–213. [Google Scholar] [CrossRef]
- Kehoe, L.; Walton, J.; Flynn, A. Nutritional challenges for older adults in Europe: Current status and future directions. Proc. Nutr. Soc. 2019, 78, 221–233. [Google Scholar] [CrossRef]
- Huang, F.; Wang, Z.; Zhang, J.; Du, W.; Su, C.; Jiang, H.; Jia, X.; Ouyang, Y.; Wang, Y.; Li, L.; et al. Dietary calcium intake and food sources among Chinese adults in CNTCS. PLoS ONE 2018, 13, e0205045. [Google Scholar] [CrossRef]
- Khazai, N.; Judd, S.E.; Tangpricha, V. Calcium and vitamin D: Skeletal and extraskeletal health. Curr. Rheumatol. Rep. 2008, 10, 110–117. [Google Scholar] [CrossRef]
- Boucher, B.J. The problems of vitamin d insufficiency in older people. Aging Dis. 2012, 3, 313–329. [Google Scholar]
- Volkert, D.; Beck, A.M.; Cederholm, T.; Cruz-Jentoft, A.; Goisser, S.; Hooper, L.; Kiesswetter, E.; Maggio, M.; Raynaud-Simon, A.; Sieber, C.C.; et al. ESPEN guideline on clinical nutrition and hydration in geriatrics. Clin. Nutr. 2019, 38, 10–47. [Google Scholar] [CrossRef]
- Woo, J.; Chan, R.; Ong, S.; Bragt, M.; Bos, R.; Parikh, P. Randomized Controlled Trial of Exercise and Nutrition Supplementation on Physical and Cognitive Function in Older Chinese Adults Aged 50 Years and Older. J. Am. Med. Dir. Assoc. 2020, 21, 395–403. [Google Scholar] [CrossRef]
- Dedeyne, L.; Deschodt, M.; Verschueren, S.; Tournoy, J.; Gielen, E. Effects of multi-domain interventions in (pre)frail elderly on frailty, functional, and cognitive status: A systematic review. Clin. Interv. Aging 2017, 12, 873–896. [Google Scholar] [CrossRef]
- Lozano-Montoya, I.; Correa-Pérez, A.; Abraha, I.; Soiza, R.L.; Cherubini, A.; O’Mahony, D.; Cruz-Jentoft, A.J. Nonpharmacological interventions to treat physical frailty and sarcopenia in older patients: A systematic overview—The SENATOR Project ONTOP Series. Clin. Interv. Aging 2017, 12, 721–740. [Google Scholar] [CrossRef]
- Divo, M.J.; Martinez, C.H.; Mannino, D. Ageing and the epidemiology of multimorbidity. Eur. Respir. J. 2014, 44, 1055–1068. [Google Scholar] [CrossRef]
- Zhu, L.-Y.; Chan, R.; Li, L.; Kwok, T.; Woo, J. Dietary protein intake pattern and sources and their associations with muscle and physical function measures in older Chinese adults with sarcopenia in Hong Kong. J. Aging Res. Clin. Pract. 2018, 7, 75–81. [Google Scholar] [CrossRef]


| Intervention (n = 44) | Control (n = 44) | p-Value 1 | |
|---|---|---|---|
| Age, years | 66.3 ± 9.5 | 66.7 ± 10.0 | 0.827 |
| Sex, n (%) | 0.747 | ||
| Male | 5 (11.4) | 6 (13.6) | |
| Female | 39 (88.6) | 38 (86.4) | |
| Education level, n (%) | 0.808 | ||
| Secondary or below | 33 (75.0) | 32 (72.7) | |
| Tertiary or above | 11 (25.0) | 12 (27.3) | |
| Marital status, n (%) | 0.085 | ||
| Married | 21 (47.7) | 29 (65.9) | |
| Others 2 | 23 (52.3) | 15 (34.1) | |
| Employment status, n (%) | 0.269 | ||
| Working | 6 (13.6) | 10 (22.7) | |
| Nonworking 3 | 38 (86.4) | 34 (77.3) | |
| Length of residence in Hong Kong, years | 58.2 ± 15.6 | 58.6 ± 13.4 | 0.895 |
| Self-reported major medical history, n (%) | |||
| Endocrinologic diseases | 6 (13.6) | 4 (9.1) | 0.739 |
| Cardiovascular diseases | 13 (29.5) | 6 (13.6) | 0.070 |
| Bone, joint, or muscular problems | 22 (50.0) | 18 (40.9) | 0.392 |
| Gastrointestinal problems/diseases | 14 (31.8) | 14 (31.8) | |
| Cancer | 2 (4.5) | 5 (11.4) | 0.434 |
| Polypharmacy, n (%) 4 | 3 (6.8) | 4 (9.1) | 1.000 |
| Current smoker, n (%) | 0 | 0 | - |
| Current drinker, n (%) | 1 (2.3) | 2 (4.5) | 1.000 |
| Body mass index, kg/m 2 | 17.6 ± 1.6 | 18.0 ± 1.7 | 0.225 |
| MNA-SF score, points | 10.7 ± 0.6 | 10.3 ± 1.0 | 0.029 |
| At risk of malnutrition, n (%) | 44 (100) | 44 (100) | - |
| Energy intake, kcal/d | 1695 ± 497 | 1686 ± 355 | 0.929 |
| Protein intake, g/d | 77 ± 27 | 79 ± 26 | 0.684 |
| Group | Mean ± SD | Change from Baseline, Mean ± SD | Between-Group Difference in Change from Baseline | ||
|---|---|---|---|---|---|
| Baseline | 12 Weeks | Estimated Mean (95% CI) a | p-Value | ||
| Body weight, kg | Intervention | 43.2 ± 6.3 | 1.8 ± 1.3 | 1.381 (0.980, 1.783) | <0.001 |
| Control | 44.0 ± 5.2 | 0.3 ± 0.9 | |||
| Body mass index, kg/m2 | Intervention | 17.6 ± 1.6 | 0.7 ± 0.5 | 0.578 (0.411, 0.745) | <0.001 |
| Control | 18.0 ± 1.7 | 0.1 ± 0.4 | |||
| MAC, cm | Intervention | 21.8 ± 2.1 | 0.8 ± 0.7 | 0.795 (0.529, 1.061) | <0.001 |
| Control | 22.4 ± 1.9 | 0.0 ± 0.4 | |||
| Calf circumference, cm | Intervention | 32.0 ± 2.0 | 0.4 ± 0.5 | 0.313 (0.111, 0.516) | 0.003 |
| Control | 31.5 ± 2.1 | 0.0 ± 0.4 | |||
| MNA-SF score, points | Intervention | 10.7 ± 0.6 | 0.5 ± 0.7 | −0.225 (−0.649, 0.199) | 0.294 |
| Control | 10.3 ± 1.0 | 0.7 ± 1.2 | |||
| SF-12—physical, score | Intervention | 46.3 ± 10.0 | 1.6 ± 6.4 | 2.618 (−0.150, 5.385) | 0.063 |
| Control | 46.3 ± 7.6 | −1.0 ± 6.2 | |||
| SF-12—mental, score | Intervention | 53.7 ± 7.3 | −0.7 ± 8.6 | 0.868 (−2.728, 4.464) | 0.632 |
| Control | 52.9 ± 7.3 | −1.6 ± 7.7 | |||
| Self-rated health, score | Intervention | 3.5 ± 0.8 | 0.0 ± 0.9 | −0.073 (−0.402, 0.257) | 0.662 |
| Control | 3.6 ± 0.9 | 0.0 ± 0.6 | |||
| FRAIL scale, score | Intervention | 0.5 ± 0.9 | −0.3 ± 0.6 | −0.062 (−0.359, 0.235) | 0.679 |
| Control | 0.6 ± 0.9 | −0.2 ± 0.7 | |||
| Group | Mean ± SD | Change from Baseline, Mean ± SD | Between Group Difference in Change from Baseline | ||
|---|---|---|---|---|---|
| Baseline | 12 weeks | Estimated Mean (95% CI) a | p-Value | ||
| Energy, kcal/d | Intervention | 1695 ± 497 | 309 ± 482 | 342 (154, 529) | 0.001 |
| Control | 1686 ± 355 | −33 ± 367 | |||
| Protein, g/d | Intervention | 77 ± 27 | 12 ± 27 | 12.7 (1.5, 23.8) | 0.027 |
| Control | 79 ± 26 | −1 ± 24 | |||
| Fat, g/d | Intervention | 63 ± 25 | 14 ± 25 | 16.4 (6.3, 26.4) | 0.002 |
| Control | 67 ± 19 | −2 ± 21 | |||
| Carbohydrate, g/d | Intervention | 207 ± 65 | 30 ± 63 | 34.2 (9.8, 58.6) | 0.007 |
| Control | 194 ± 45 | −5 ± 47 | |||
| % kcal from protein | Intervention | 18.2 ± 3.3 | −0.5 ± 3.5 | −0.8 (−2.5, 0.9) | 0.337 |
| Control | 18.7 ± 3.8 | 0.3 ± 4.0 | |||
| % kcal from fat | Intervention | 33.5 ± 6.4 | 1.1 ± 6.4 | 1.3 (−1.5, 4.1) | 0.352 |
| Control | 35.7 ± 6.5 | −0.2 ± 6.1 | |||
| % kcal from carbohydrate | Intervention | 49.2 ± 7.9 | −1.4 ± 8.7 | −0.9 (−4.4, 2.6) | 0.608 |
| Control | 46.3 ± 6.6 | −0.5 ± 7.2 | |||
| Fiber, g/d | Intervention | 17 ± 9 | 3 ± 10 | 3.4 (−0.0, 6.8) | 0.051 |
| Control | 16 ± 7 | −1 ± 5 | |||
| Vitamin D, µg/d | Intervention | 2.7 ± 2.2 | 6.5 ± 3.3 | 5.9 (4.4, 7.4) | <0.001 |
| Control | 2.6 ± 2.0 | 0.6 ± 3.6 | |||
| Calcium, mg/d | Intervention | 604 ± 280 | 207 ± 233 | 254 (142, 366) | <0.001 |
| Control | 595 ± 259 | −48 ± 275 | |||
Publisher’s Note: MDPI stays neutral with regard to jurisdictional claims in published maps and institutional affiliations. |
© 2022 by the authors. Licensee MDPI, Basel, Switzerland. This article is an open access article distributed under the terms and conditions of the Creative Commons Attribution (CC BY) license (https://creativecommons.org/licenses/by/4.0/).
Share and Cite
Yeung, S.S.Y.; Lee, J.S.W.; Kwok, T. A Nutritionally Complete Oral Nutritional Supplement Powder Improved Nutritional Outcomes in Free-Living Adults at Risk of Malnutrition: A Randomized Controlled Trial. Int. J. Environ. Res. Public Health 2022, 19, 11354. https://doi.org/10.3390/ijerph191811354
Yeung SSY, Lee JSW, Kwok T. A Nutritionally Complete Oral Nutritional Supplement Powder Improved Nutritional Outcomes in Free-Living Adults at Risk of Malnutrition: A Randomized Controlled Trial. International Journal of Environmental Research and Public Health. 2022; 19(18):11354. https://doi.org/10.3390/ijerph191811354
Chicago/Turabian StyleYeung, Suey S. Y., Jenny S. W. Lee, and Timothy Kwok. 2022. "A Nutritionally Complete Oral Nutritional Supplement Powder Improved Nutritional Outcomes in Free-Living Adults at Risk of Malnutrition: A Randomized Controlled Trial" International Journal of Environmental Research and Public Health 19, no. 18: 11354. https://doi.org/10.3390/ijerph191811354
APA StyleYeung, S. S. Y., Lee, J. S. W., & Kwok, T. (2022). A Nutritionally Complete Oral Nutritional Supplement Powder Improved Nutritional Outcomes in Free-Living Adults at Risk of Malnutrition: A Randomized Controlled Trial. International Journal of Environmental Research and Public Health, 19(18), 11354. https://doi.org/10.3390/ijerph191811354