
Air Quality and Cancer Prevalence Trends across the Sub-Saharan African Regions during 2005–2020


Abstract
:1. Introduction
1.1. Indoor Air Pollution
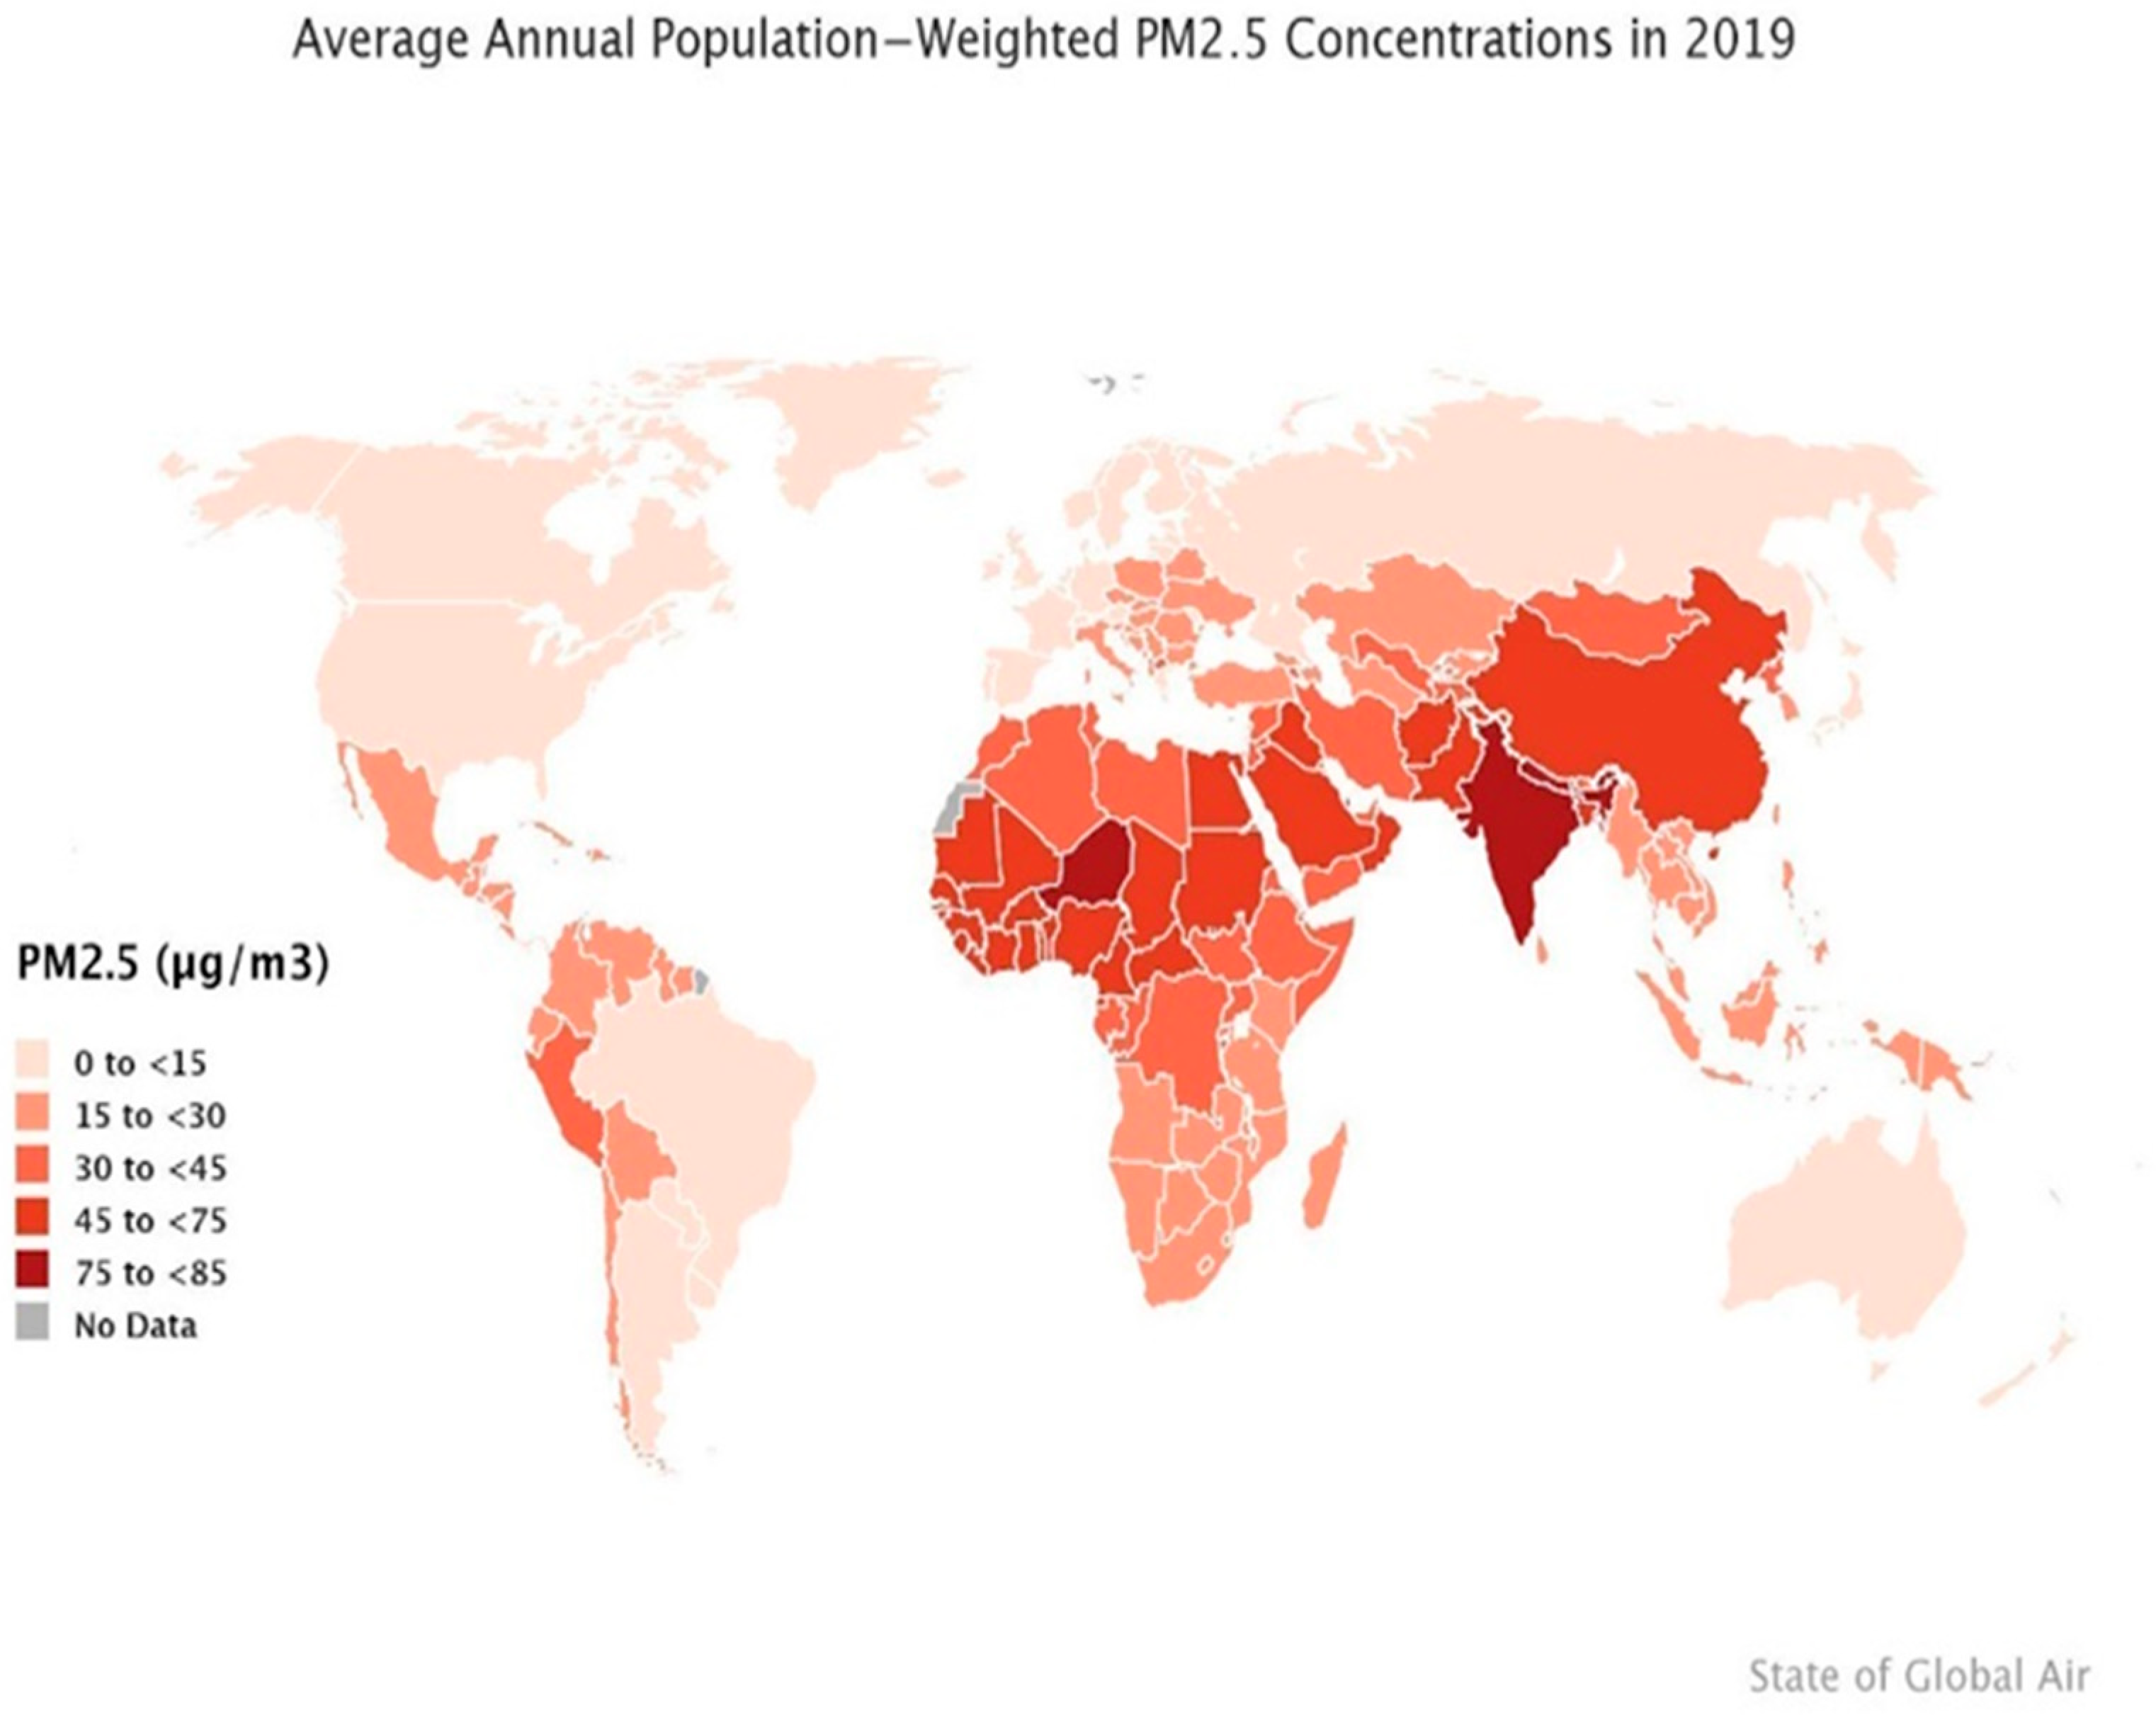
1.2. Outdoor Air Pollution
1.3. Mechanisms of Air Pollution-Induced Cancers
1.4. Exogenous and Endogenous Environmental Risks and Their Influences on Cancer Development
1.5. Current Shortcomings of Cancer-Relevant Air Pollution Data from SSA Regions
2. Methods
2.1. Data Sources
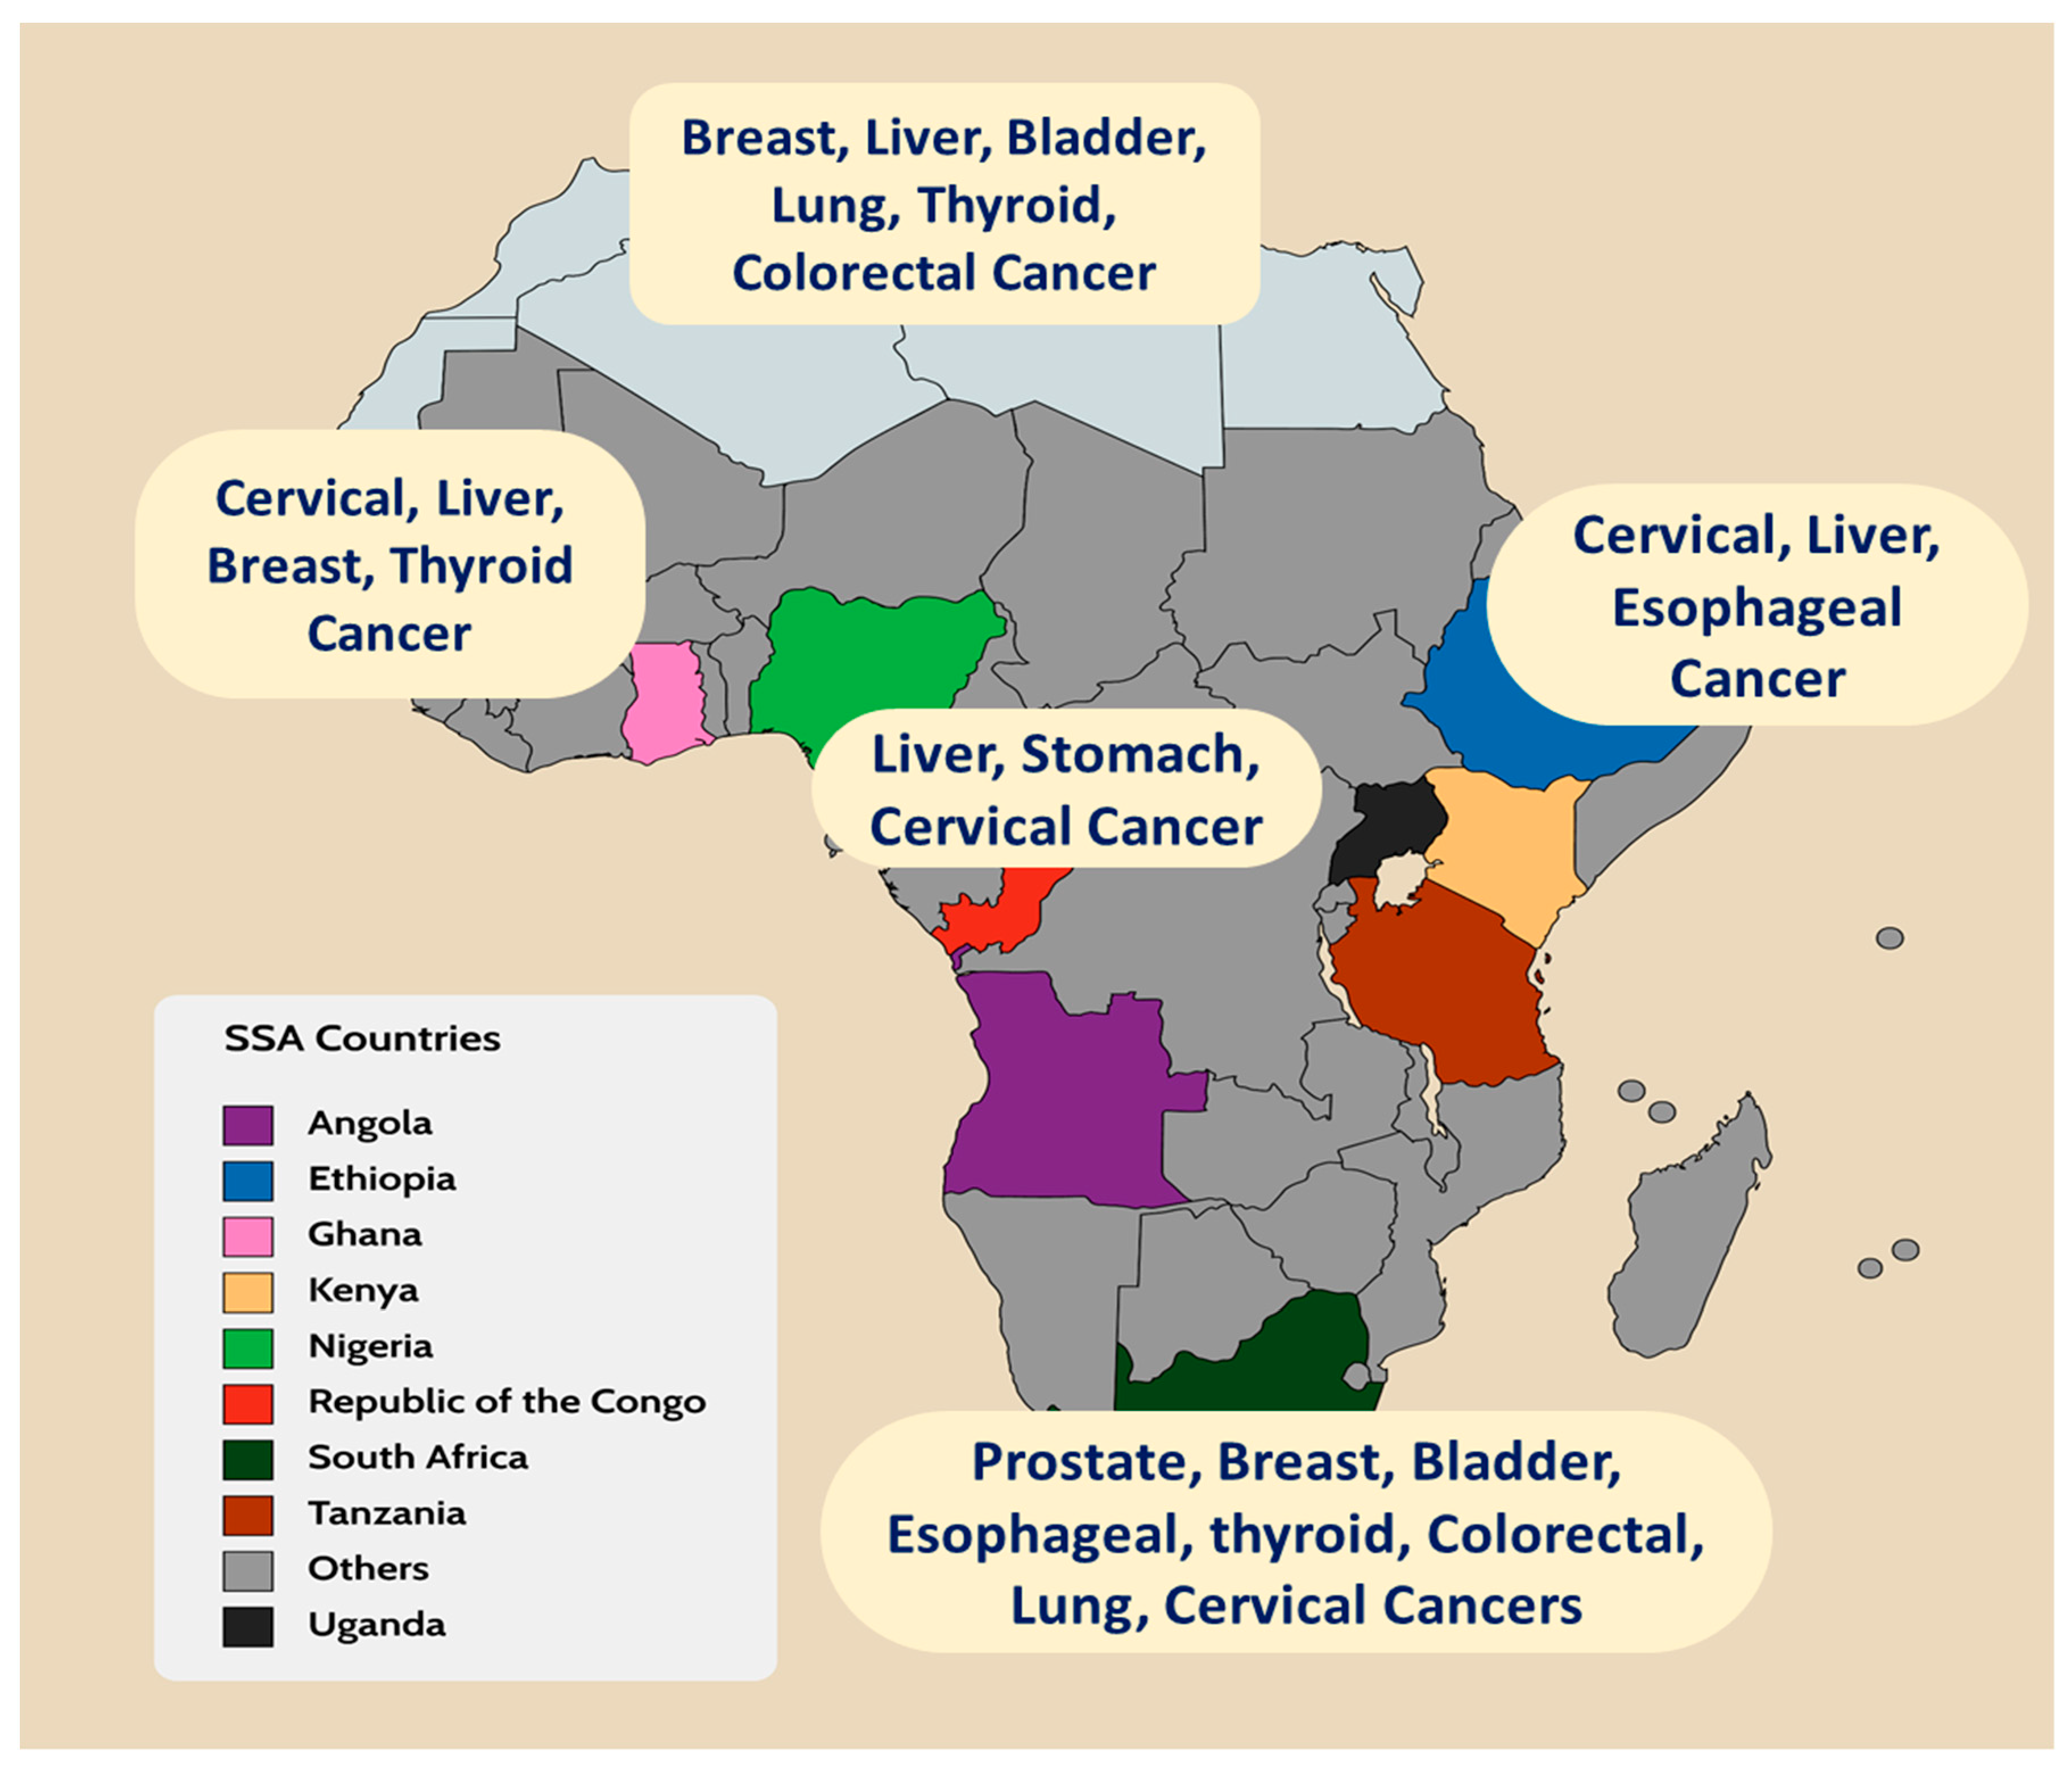
2.2. Country Selection
2.3. Variables and Data Descriptions
2.4. Data Analyses Methods
3. Results
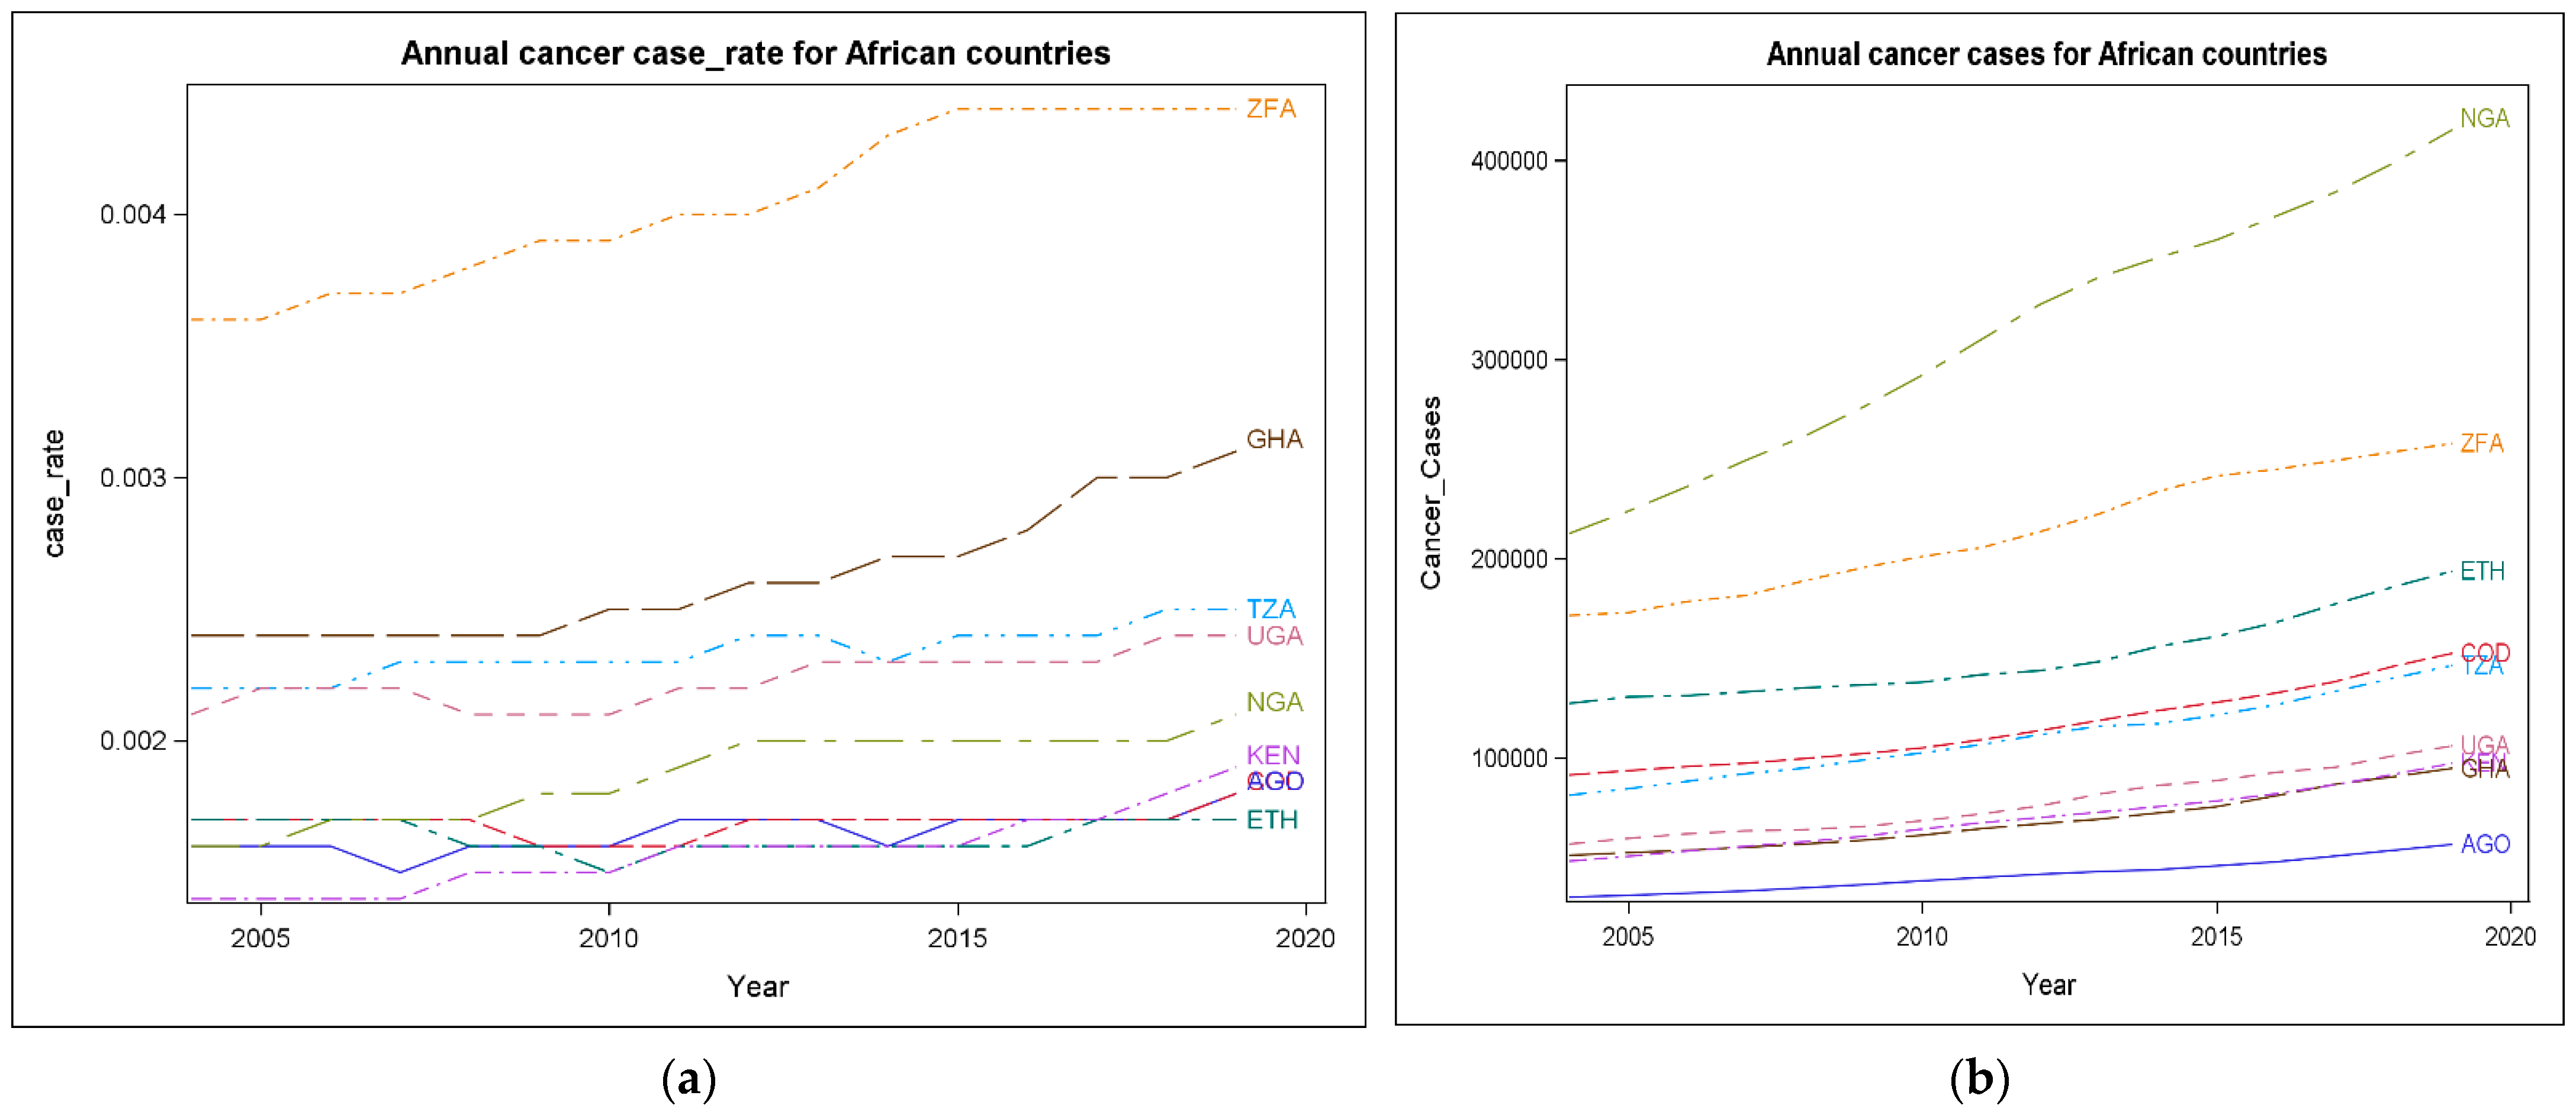
3.1. Cancer Trends Comparisons by Country, 2005–2020
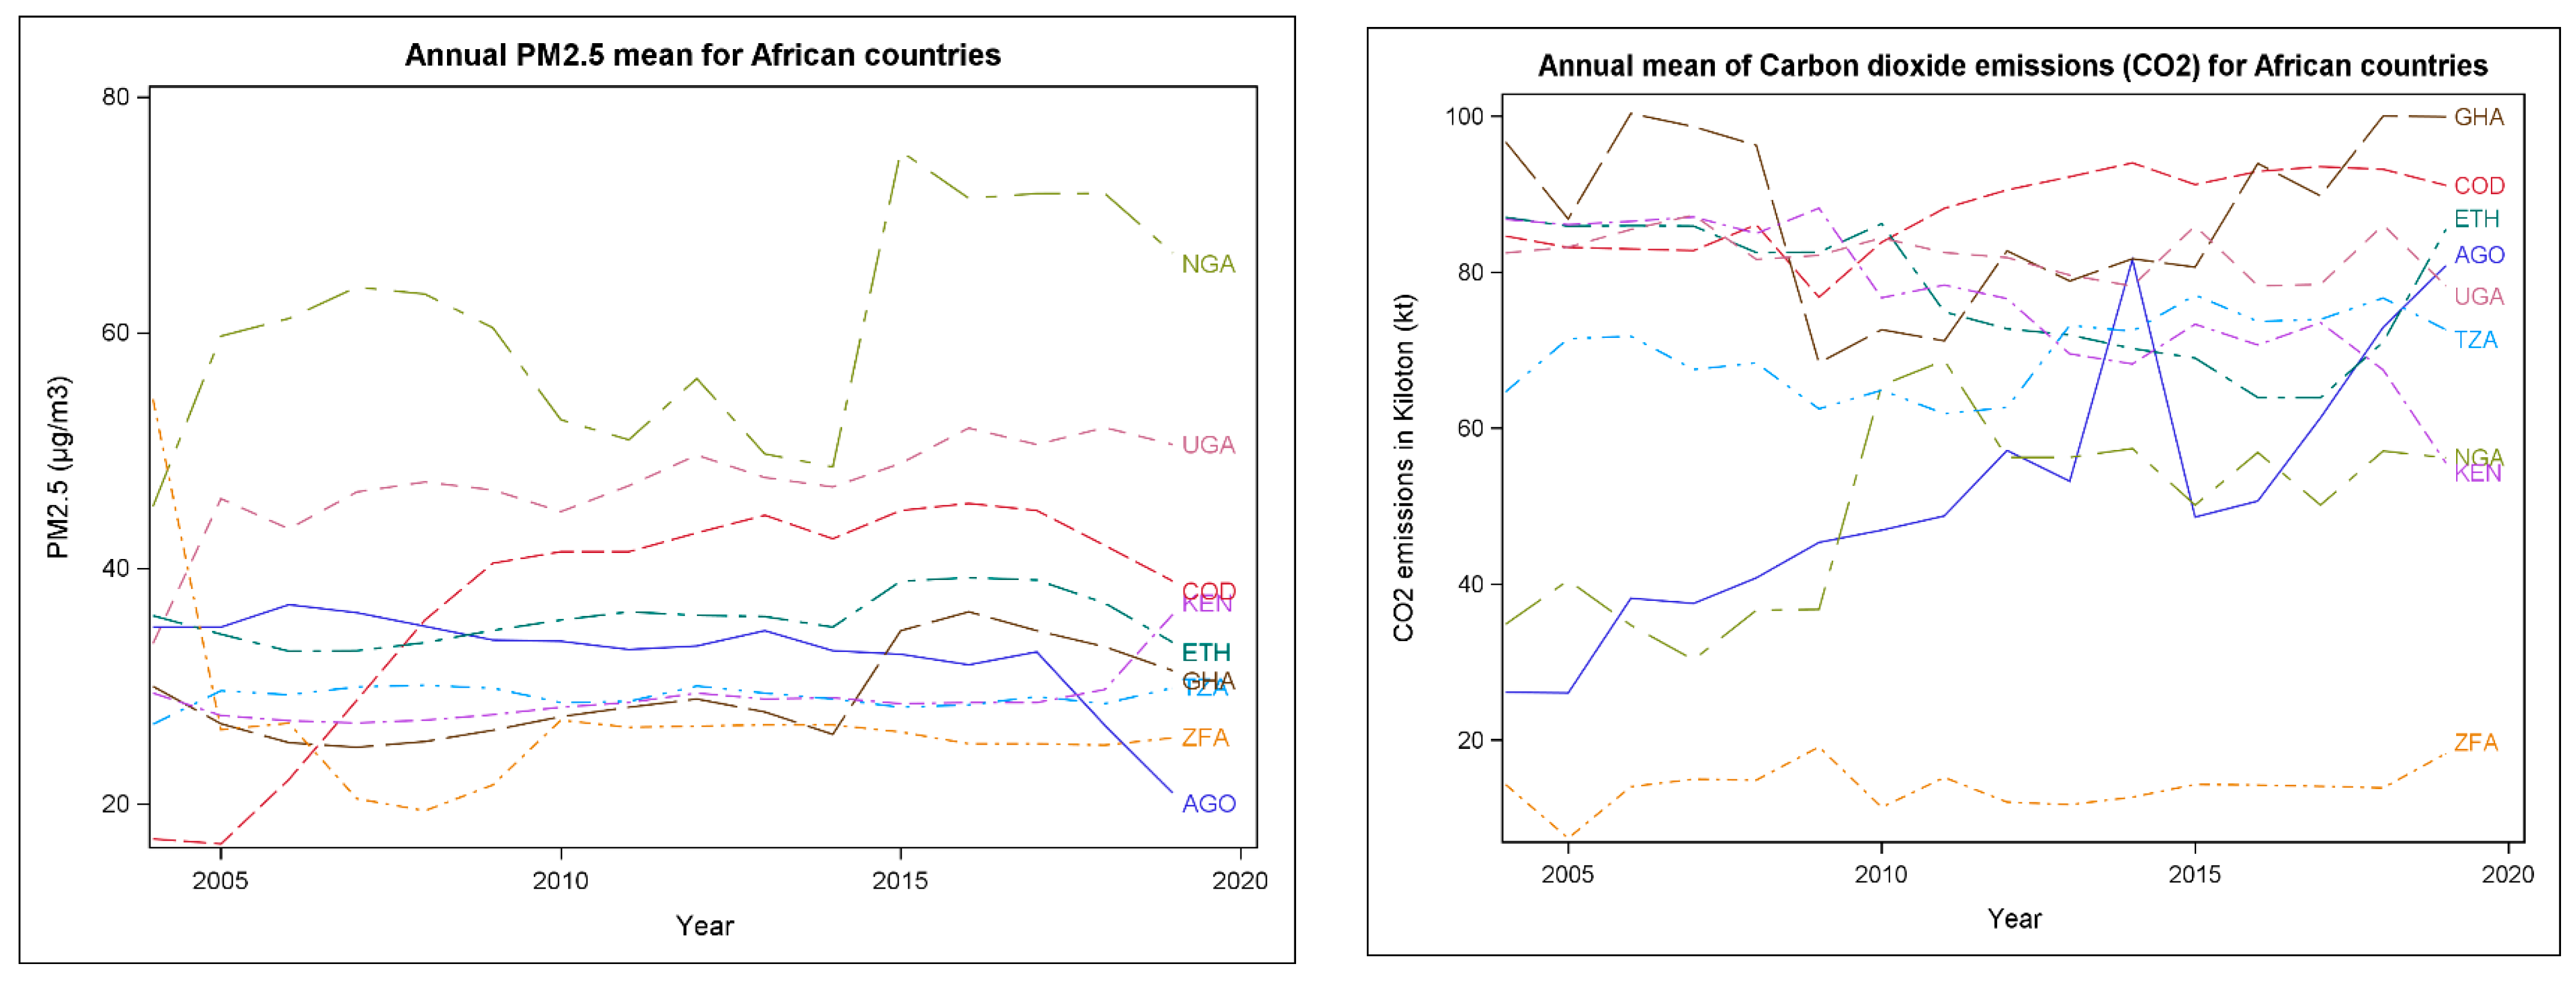
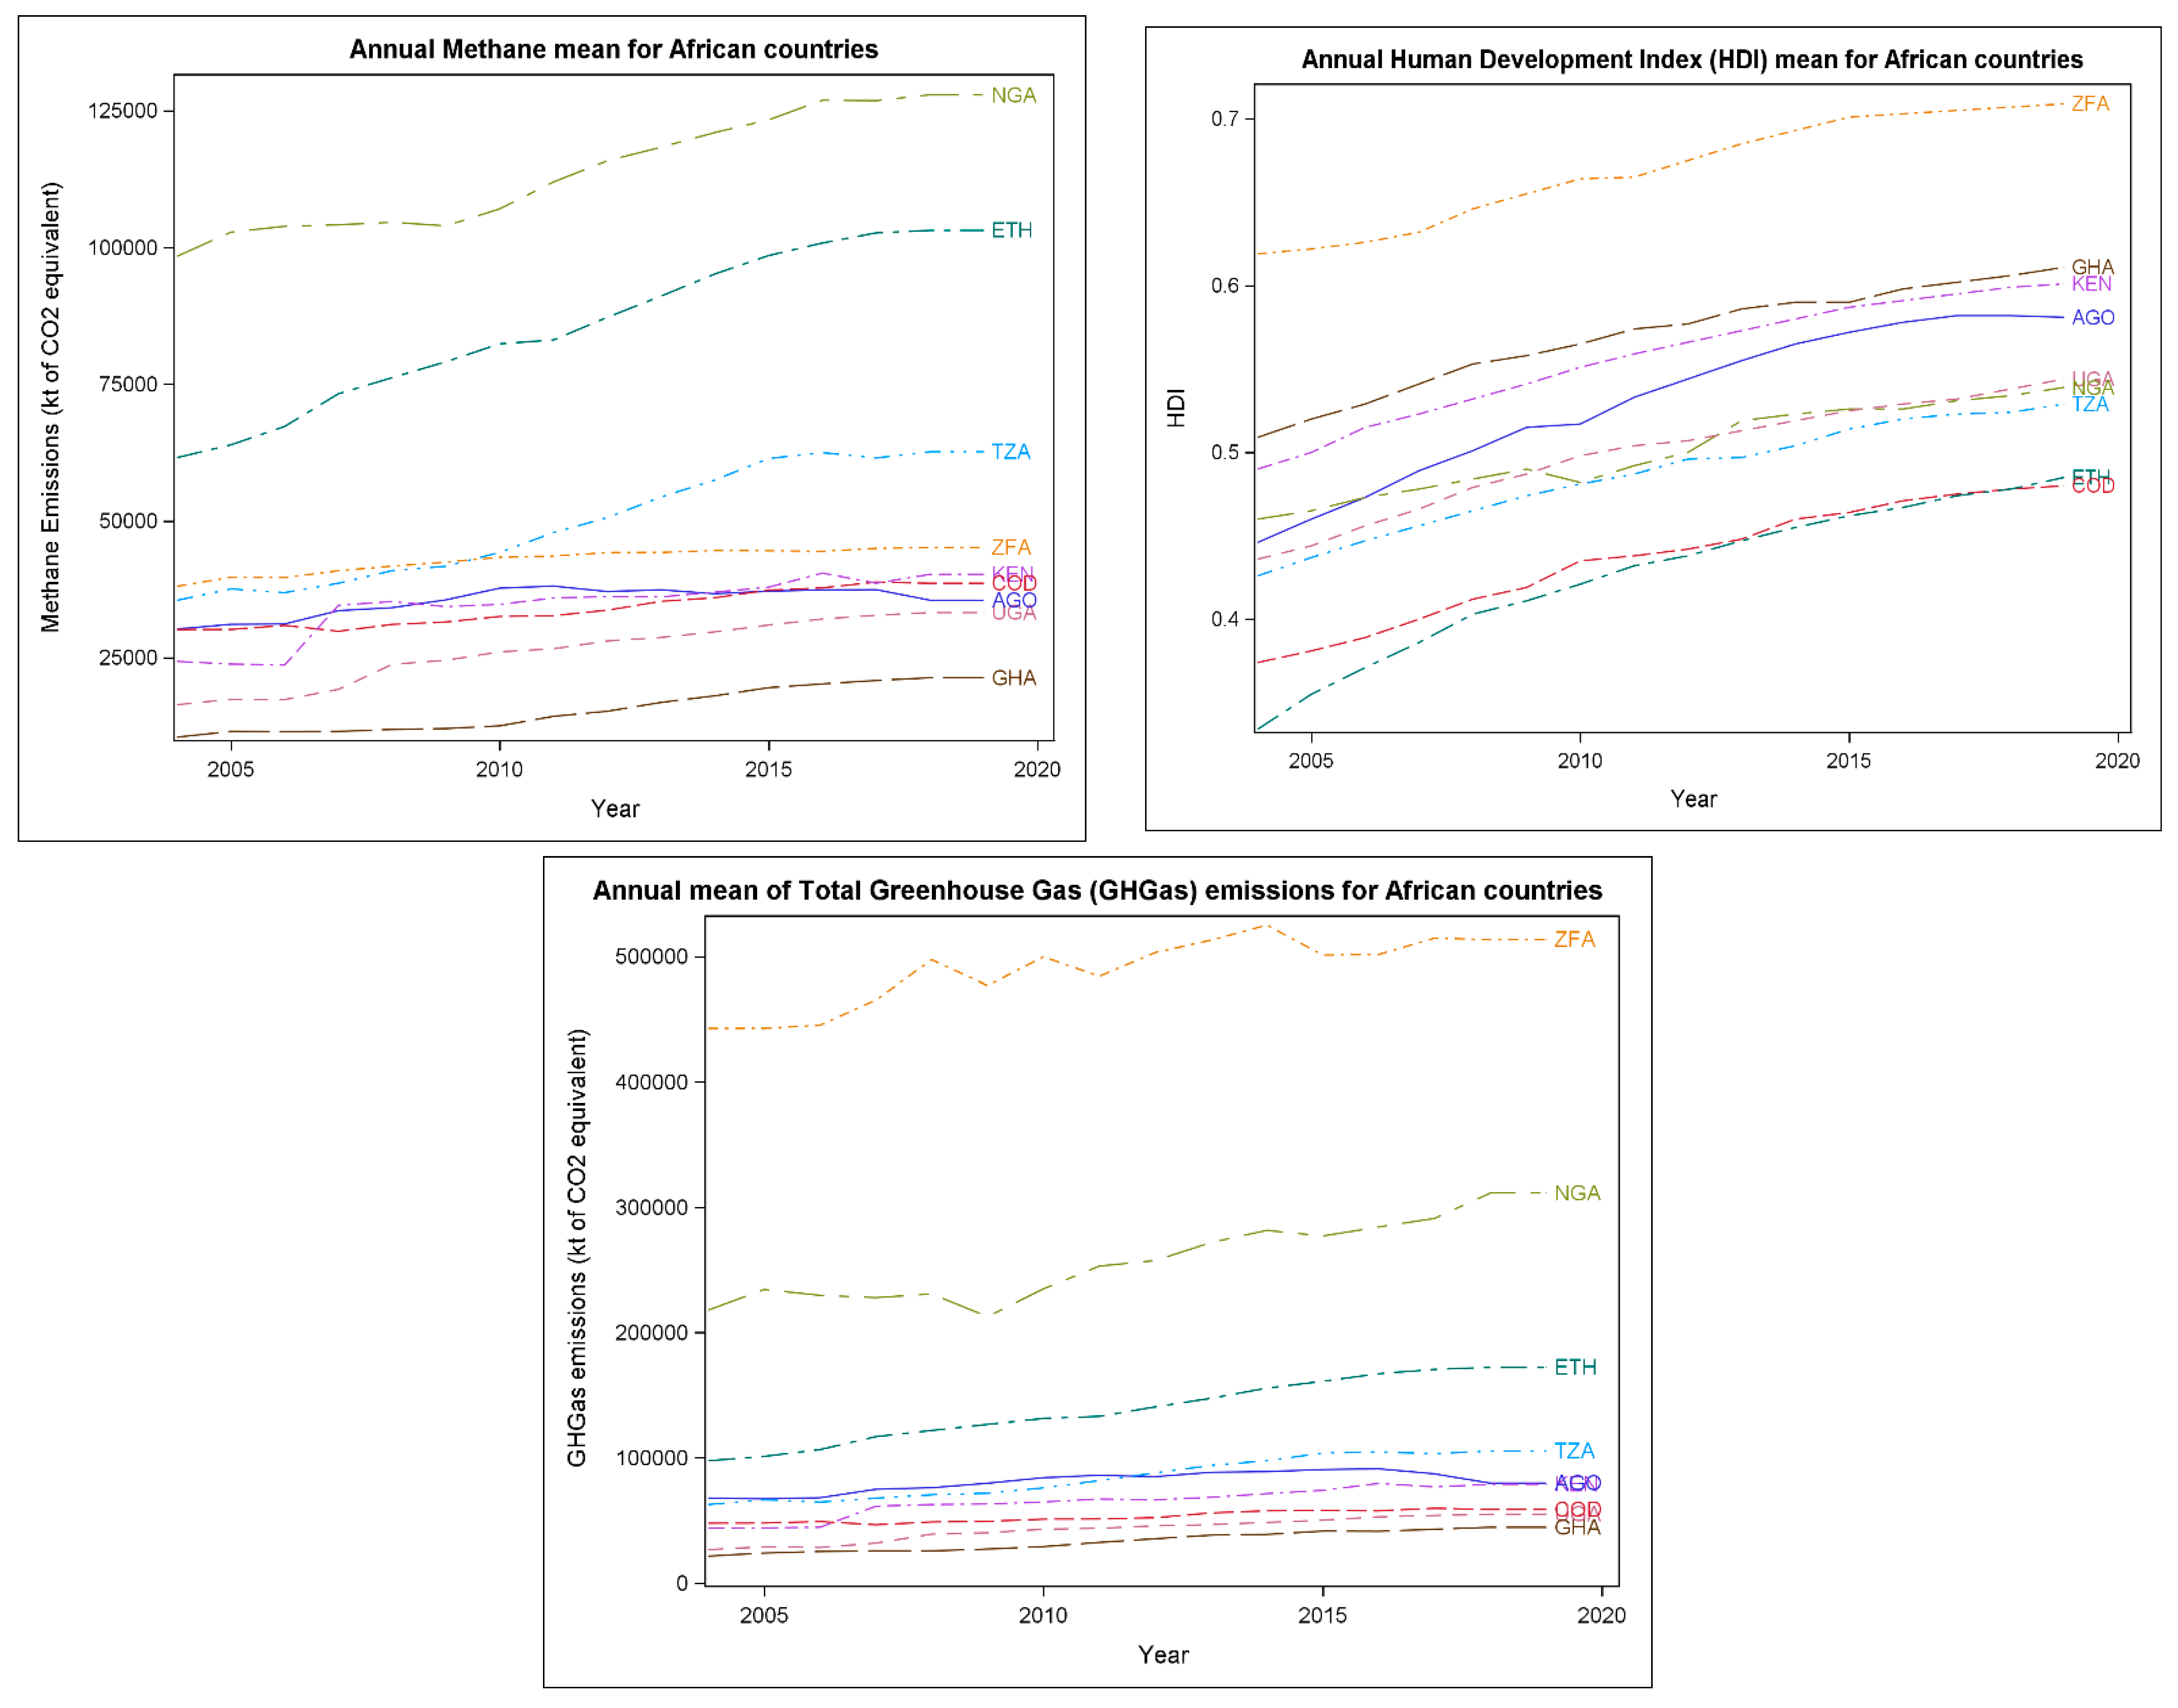
3.2. Air Pollutants Levels Comparisons by SSA Countries, 2005–2020
3.3. The Associations between Cancer Case Rates and Air Pollutants Levels
4. Discussion
4.1. Public Health Implications
4.2. Limitations
4.3. Future Recommendations
5. Conclusions
Author Contributions
Funding
Data Availability Statement
Acknowledgments
Conflicts of Interest
References
- Jemal, A.; Bray, F.; Center, M.M.; Ferlay, J.; Ward, E.; Forman, D. Global cancer statistics. CA Cancer J. Clin. 2011, 61, 69–90. [Google Scholar] [CrossRef] [PubMed]
- Bahnassy, A.A.; Abdellateif, M.S.; Zekri, A.N. Cancer in Africa: Is It a Genetic or Environmental Health Problem? Front. Oncol. 2020, 10, 604214. [Google Scholar] [CrossRef]
- Sylla, B.S.; Wild, C.P. A million Africans a year dying from cancer by 2030: What can cancer research and control offer to the continent? Int. J. Cancer 2012, 130, 245–250. [Google Scholar] [CrossRef] [PubMed]
- Parkin, D.M.; Bray, F.; Ferlay, J.; Jemal, A. Cancer in Africa 2012. Cancer epidemiology, biomarkers & prevention: A publication of the American Association for Cancer Research, cosponsored by the American Society of Preventive Oncology. Cancer Epidemiol. Biomark. Prev. 2014, 23, 953–966. [Google Scholar] [CrossRef]
- The Cancer Atlas. Sub-Saharan Africa. Available online: https://canceratlas.cancer.org/the-burden/sub-saharan-africa/ (accessed on 13 September 2021).
- World Health Organization. 2021. Available online: https://aho.afro.who.int/ind/af?ind=321&dim=71&dom=Cancer+prevalence&cc=af&ci=1&cn=Afro+Region (accessed on 12 November 2021).
- Ferlay, J.; Colombet, M.; Soerjomataram, I.; Mathers, C.; Parkin, D.M.; Piñeros, M.; Znaor, A.; Bray, F. Estimating the global cancer incidence and mortality in 2018:GLOBOCAN sources and methods. Int. J. Cancer 2019, 144, 1941–1953. [Google Scholar] [CrossRef] [PubMed]
- Katoto, P.; Byamungu, L.; Brand, A.; Mokaya, J.; Strijdom, H.; Goswami, N.; Boever, P.; Nawrot, T.S.; Nemery, B. Ambient air pollution and health in Sub-Saharan Africa: Current evidence, perspectives, and a call to action. Environ. Res. 2019, 173, 174–188. [Google Scholar] [CrossRef]
- Kayamba, V.; Heimburger, D.C.; Morgan, D.R.; Atadzhanov, M.; Kelly, P. Exposure to biomass smoke as a risk factor for esophageal and gastric cancer in low-income populations: A systematic review. Malawi Med. J. 2017, 29, 212–217. [Google Scholar] [CrossRef]
- Kim, H.B.; Shim, J.Y.; Park, B.; Lee, Y.J. Long-Term Exposure to Air Pollutants and Cancer Mortality: A Meta-Analysis of Cohort Studies. Int. J. Environ. Res. Public Health 2018, 15, 2608. [Google Scholar] [CrossRef]
- Sussan, T.E.; Ingole, V.; Kim, J.H.; McCormick, S.; Negherbon, J.; Fallica, J.; Akulian, J.; Yarmus, L.; Feller-Kopman, D.; Wills-Karp, M.; et al. The Source of biomass cooking fuel determines pulmonary response to household air pollution. Am. J. Respir. Cell Mol. Biol. 2014, 50, 538–548. [Google Scholar] [CrossRef]
- Environmental Protection Agency. Available online: https://www.epa.gov/no2-pollution/basic-information-about-no2#What%20is%20NO2 (accessed on 25 September 2021).
- Hamdi, Y.; Abdeljaoued-Tej, I.; Zatchi, A.A.; Abdelhak, S.; Boubaker, S.; Brown, J.S.; Benkahla, A. Cancer in Africa: The Untold Story. Front. Oncol. 2021, 11, 650117. [Google Scholar] [CrossRef]
- Lim, S.S.; Vos, T.; Flaxman, A.D.; Danaei, G.; Shibuya, K.; Adair-Rohani, H.; Amann, M.; Anderson, H.R.; Andrews, K.G.; Aryee, M.; et al. A comparative risk assessment of burden of disease and injury attributable to 67 risk factors and risk factor clusters in 21 regions, 1990–2010: A systematic analysis for the Global Burden of Disease Study 2010. Lancet 2012, 380, 2224–2260. [Google Scholar] [CrossRef]
- Bickton, F.M.; Ndeketa, L.; Sibande, G.T.; Nkeramahame, J.; Payesa, C.; Milanzi, E.B. Household air pollution and under-five mortality in sub-Saharan Africa: An analysis of 14 demographic and health surveys. Environ. Health Prev. Med. 2020, 25, 67. [Google Scholar] [CrossRef] [PubMed]
- Bonjour, S.; Adair-Rohani, H.; Wolf, J.; Bruce, N.G.; Mehta, S.; Prüss-Ustün, A.; Lahiff, M.; Rhfuess, E.A.; Mishra, V.; Smith, K.R. Solid fuel use for household cooking: Country and regional estimates for 1980–2010. Environ. Health Perspect. 2013, 121, 784–790. [Google Scholar] [CrossRef] [PubMed]
- Ochieng, C.A.; Tonne, C.; Vardoulakis, S.; Semenza, J. Household Air Pollution in Low and Middle-Income Countries. Oxf. Res. Encycl. Environ. Sci. 2017. [Google Scholar] [CrossRef]
- Gordon, S.B.; Bruce, N.G.; Grigg, J.; Hibberd, P.L.; Kurmi, O.P.; Lam, K.B.; Mortimer, K.; Asante, K.P.; Balakrishnan, K.; Balmes, J.; et al. Respiratory risks from household air pollution in low- and middle-income countries. Lancet Respir. Med. 2014, 2, 823–860. [Google Scholar] [CrossRef]
- Capistrano, S.J.; van Reyk, D.; Chen, H.; Oliver, B.G. Evidence of Biomass Smoke Exposure as a Causative Factor for the Development of COPD. Toxics 2017, 5, 36. [Google Scholar] [CrossRef]
- Muyanja, D.; Allen, J.G.; Vallarino, J.; Valeri, L.; Kakuhikire, B.; Bangsberg, D.R.; Christiani, D.C.; Tsai, A.C.; Lai, P.S. Kerosene lighting contributes to household air pollution in rural Uganda. Indoor Air 2017, 27, 1022–1029. [Google Scholar] [CrossRef]
- Vaccher, V.; Ingenbleek, L.; Adegboye, A.; Hossou, S.E.; Koné, A.Z.; Oyedele, A.D.; Kisito, C.; Dembélé, Y.K.; Hu, R.; Adbel Malak, I.; et al. Levels of persistent organic pollutants (POPs) in foods from the first regional Sub-Saharan Africa Total Diet Study. Environ. Int. 2020, 135, 105413. [Google Scholar] [CrossRef]
- Guo, W.; Pan, B.; Sakkiah, S.; Yavas, G.; Ge, W.; Zou, W.; Tong, W.; Hong, H. Persistent Organic Pollutants in Food: Contamination Sources, Health Effects, and Detection Methods. Int. J. Environ. Res. Public Health 2019, 16, 4361. [Google Scholar] [CrossRef]
- Jain, A.; Ray, S.; Ganesan, K.; Aklin, M.; Cheng, C.Y.; Urpelainen, J. Access to Clean Cooking Energy And Electricity: Survey of States; Council on Energy, Environment and Water (CEEW): New Delhi, India, 2015. [Google Scholar]
- DeWitt, H.L.; Gasore, J.; Rupakheti, M.; Potter, K.E.; Prinn, R.G.; Ndikubwimana, J.D.; Nkusi j Safari, B. Seasonal and diurnal variability in O3, black carbon and CO measured at the Rwanda Climate Observatory Atmos. Chem. Phys. 2019, 19, 2063–2078. [Google Scholar]
- Bornman, M.S.; Aneck-Hahn, N.; de Jager, C.; Wagenaar, G.M.; Bouwman, H.; Barnhoorn IE, J.; Heindel, J.J. Endocrine disruptors and health effects in Africa: A call for action. Environ. Health Perspect. 2017, 125, 085005. [Google Scholar] [CrossRef] [Green Version]
- Kruk, J.; Aboul-Enein, H.Y. Reactive Oxygen and Nitrogen Species in Carcinogenesis: Implications of Oxidative Stress on the Progression and Development of Several Cancer Types. Mini-Rev. Med. Chem. 2017, 17, 904–919. [Google Scholar] [CrossRef] [PubMed]
- Zhang, X.; Staimer, N.; Gillen, D.L.; Tjoa, T.; Schauer, J.J.; Shafer, M.M.; Hasheminassab, S.; Pakbin, P.; Vaziri, N.D.; Sioutas, C.; et al. Associations of oxidative stress and inflammatory biomarkers with chemically characterized air pollutant exposures in an elderly cohort. Environ. Res. 2016, 150, 306–319. [Google Scholar] [CrossRef] [PubMed]
- Veranth, J.M.; Moss, T.A.; Chow, J.C.; Labban, R.; Nichols, W.K.; Walton, J.C.; Watson, J.G.; Yost, G.S. Correlation of in vitro cytokine responses with the chemical composition of soil-derived particulate matter. Environ. Health Perspect. 2006, 114, 341–349. [Google Scholar] [CrossRef]
- Lara, L.A.; Duarte, A.A.; Reis, R.M.; Vieira, C.S.; Rosa-e-Silva, A.C. Endocrine disrupters are potential risk factors affecting sexual function in both men and women. J. Sex. Med. 2012, 9, 941–942. [Google Scholar] [CrossRef] [PubMed]
- Meeker, J.D. Exposure to environmental endocrine disruptors and child development. Arch. Pediatr. Adolesc. Med. 2012, 166, E1–E7. [Google Scholar] [CrossRef]
- Rylander, L.; Rignell-Hydbom, A.; Tinnerberg, H.; Jonsson, B.A. Trends in human concentrations of endocrine disruptors: Possible reasons and consequences. J. Epidemiol. Community Health 2014, 68, 4–5. [Google Scholar] [CrossRef]
- Reaves, D.K.; Ginsburg, E.; Bang, J.J.; Fleming, J.M. Persistent organic pollutants and obesity: Are they potential mechanisms for breast cancer promotion? Endocr.-Relat. Cancer 2015, 22, R69–R86. [Google Scholar] [CrossRef]
- Szyfter, K.; Jarmuż, M. Determination of the genetic risk of cancer using the bleomycin test. Contemp. Oncol. 1999, 3, 188–190. [Google Scholar]
- Lewandowska, A.M.; Rudzki, M.; Rudzki, S.; Lewandowski, T.; Laskowska, B. Environmental risk factors for cancer–a review paper. Ann. Agric. Environ. Med. AAEM 2019, 26, 1–7. [Google Scholar] [CrossRef]
- World Health Organization. Household air pollution and health Factsheet 292. 2016. Available online: http://www.who.int/mediacentre/factsheets/fs292/en/ (accessed on 28 July 2022).
- Najjar, Y.S. Gaseous pollutants formation and their harmful effects on health and the environment. Innov. Energy Policies. 2011, 1, E101203. [Google Scholar] [CrossRef]
- Anderson, J.O.; Thundiyil, J.G.; Stolbach, A. Clearing the air: A review of the effects of particulate matter air pollution on human health. J. Med. Toxicol. Off. J. Am. Coll. Med. Toxicol. 2012, 8, 166–175. [Google Scholar] [CrossRef] [PubMed] [Green Version]
- Fortoul, T.I.; Rodriguez-Lara, V.; Gonzalez-Villalva, A.; Rojas-Lemus, M.; Cano-Gutierrez, G.; Ustarroz-Cano, M.; Colin-Barenque, L.; Montaño, L.F.; García-Pelez, I.; Bizarro-Nevares, P.; et al. Vanadium inhalation in a mouse model for the understanding of air-suspended particle systemic repercussion. J. Biomed. Biotechnol. 2011, 2011, 951043. [Google Scholar] [CrossRef] [PubMed]
- Andersen, Z.J.; Stafoggia, M.; Weinmayr, G.; Pedersen, M.; Galassi, C.; Jørgensen, J.T.; Oudin, A.; Forsberg, B.; Olsson, D.; Oftedal, B.; et al. Long-Term Exposure to Ambient Air Pollution and Incidence of Postmenopausal Breast Cancer in 15 European Cohorts within the ESCAPE Project. Environ. Health Perspect. 2017, 125, 107005. [Google Scholar] [CrossRef] [PubMed]
- Mordukhovich, I.; Rossner, P.; Terry, M.B., Jr.; Santella, R.; Zhang, Y.J.; Hibshoosh, H.; Memeo, L.; Mansukhani, M.; Long, C.M.; Garbowski, G.; et al. Associations between polycyclic aromatic hydrocarbon-related exposures and p53 mutations in breast tumors. Environ. Health Perspect. 2010, 11, 511–518. [Google Scholar] [CrossRef]
- Mordukhovich, I.; Beyea, J.; Herring, A.H.; Hatch, M.; Stellman, S.D.; Teitelbaum, S.L.; Richardson, D.B.; Millikan, R.C.; Engel, L.S.; Shantakumar, S.; et al. Vehicular Traffic-Related Polycyclic Aromatic Hydrocarbon Exposure and Breast Cancer Incidence: The Long Island Breast Cancer Study Project (LIBCSP). Environ. Health Perspect. 2016, 124, 30–38. [Google Scholar] [CrossRef]
- Kim, J.W.; Park, S.; Lim, C.W.; Lee, K.; Kim, B. The role of air pollutants in initiating liver disease. Toxicol. Res. 2014, 30, 65–70. [Google Scholar] [CrossRef]
- Liu-Mares, W.; Mackinnon, J.A.; Sherman, R.; Fleming, L.E.; Rocha-Lima, C.; Hu, J.J.; Lee, D.J. Pancreatic cancer clusters and arsenic-contaminated drinking water wells in Florida. BMC Cancer 2013, 13, 111. [Google Scholar] [CrossRef]
- Andersson, T.M.; Engholm, G.; Brink, A.L.; Pukkala, E.; Stenbeck, M.; Tryggvadottir, L.; Wederpass, E.; Storm, H. Tackling the tobacco epidemic in the Nordic countries and lower cancer incidence by 1/5 in a 30-year period-The effect of envisaged scenarios changing smoking prevalence. Eur. J. Cancer 2018, 103, 288–298. [Google Scholar] [CrossRef]
- Katzke, V.A.; Kaaks, R.; Kühn, T. Lifestyle and cancer risk. Cancer J. 2015, 21, 104–110. [Google Scholar] [CrossRef]
- Naeher, L.P.; Brauer, M.; Lipsett, M.; Zelikoff, J.T.; Simpson, C.D.; Koenig, J.Q.; Smith, K.R. Woodsmoke health effects: A review. Inhal. Toxicol. 2007, 19, 67–106. [Google Scholar] [CrossRef]
- GBD 2017 Risk Factor Collaborators. Global, regional, and national comparative risk assessment of 84 behavioral, environmental, and occupational, and metabolic risks or clusters of risks for 195 countries and territories, 1990–2017: A systematic analysis for the Global Burden of Disease Study 2017. Lancet 2018, 392, 1923–1994. [Google Scholar] [CrossRef]
- Turner, M.C.; Andersen, Z.J.; Baccarelli, A.; Diver, W.R.; Gapstur, S.M.; Pope, C.A., 3rd; Prada, D.; Samet, J.; Thurston, G.; Cohen, A. Outdoor air pollution and cancer: An overview of the current evidence and public health recommendations. CA Cancer J. Clin. 2020; advance online publication. [Google Scholar] [CrossRef]
- United Nations Environment Air Pollution: Africa’s Invisible, Silent Killer. 2019. Available online: https://www.unenvironment.org/news-and-stories/story/air-pollution-africas-invisible-silent-killer (accessed on 18 September 2020).
- Health Effects Institute. State of Global Air 2020. PM2.5 Exposure, State of Global Air. 2020. Available online: https://www.stateofglobalair.org/air/pm (accessed on 28 November 2021).
- Institute for Health Metrics and Evaluation. IHME Mission and Vision. 2022. Available online: https://www.healthdata.org/about/our-principles (accessed on 21 August 2022).
- United Nations Development Program. Human Development Reports. Available online: https://hdr.undp.org/en/indicators/137506 (accessed on 18 May 2022).
- World Development Indicators. DataBank. Available online: https://databank.worldbank.org/source/world-development-indicators (accessed on 21 August 2022).
- SAS Institute Inc. SAS/STAT® 9.3 User’s Guide: The MIXED Procedure (Chapter); SAS Institute Inc.: Cary, NC, USA, 2011. [Google Scholar]
- Gardner, W.; Mulvey, E.P.; Shaw, E.C. Regression analyses of counts and rates: Poisson, overdispersed Poisson, and negative binomial models. Psychol. Bull. 1995, 118, 392–404. [Google Scholar] [CrossRef] [PubMed]
- World Health Organization. Ambient (Outdoor) Air Pollution. World Health Organization. 2021. Available online: https://www.who.int/news-room/fact-sheets/detail/ambient-(outdoor)-air-quality-and-health (accessed on 27 November 2021).
- Segal, I.; Walker, A.R.; Lord, S.; Cummings, J.H. Breath methane and large bowel cancer risk in contrasting African populations. Gut 1995, 29, 608–613. [Google Scholar] [CrossRef] [PubMed]
- Xia, X.F.; Wang, Y.Q.; Shao, S.Y.; Zhao, X.Y.; Zhang, S.G.; Li, Z.Y.; Yuan, Y.C.; Zhang, N. The relationship between urologic cancer outcomes and national Human Development Index: Trend in recent years. BMC Urol. 2022, 22, 2. [Google Scholar] [CrossRef] [PubMed]
- Kyayesimira, J.; Florence, M. Health concerns and use of biomass energy in households: Voices of women from rural communities in Western Uganda. Energy Sustain. Soc. 2021, 11, 42. [Google Scholar] [CrossRef]
- Tsoka-Gwegwenia, J.M.; Nambile Cumber, K.; Nchanji, N. Breast cancer among women in sub-Saharan Africa: Prevalence and situational analysis. South. Afr. J. Gynaecol. Oncol. 2017, 2, 28–30. Available online: https://hdl.handle.net/10520/EJC-f08b5f77a (accessed on 21 August 2022).
- Keel, J.; Walker, K.; Pant, P. Air Pollution, and its impacts on health in Africa -insights from the State of Global Air 2020. Clean Air J. 2020, 30, 1–2. [Google Scholar] [CrossRef]
- Loomis, D.; Grosse, Y.; Lauby-Secretan, B.; El Ghissassi, F.; Bouvard, V.; Benbrahim-Tallia, L.; Guha, N.; Baan, R.; Mattock, H.; Straif, K.; et al. The carcinogenicity of outdoor air pollution. Lancet. Oncol. 2013, 14, 1262–1263. [Google Scholar] [CrossRef]
- Loomis, D.; Huang, W.; Chen, G. The International Agency for Research on Cancer (IARC) evaluation of the carcinogenicity of outdoor air pollution: Focus on China. Chin. J. Cancer 2014, 33, 189–196. [Google Scholar] [CrossRef]
- Smith, K.R.; Bruce, N.; Balakrishnan, K.; Adair-Rohani, H.; Balmes, J.; Chafe, Z.; Dharani, M.; Hosgood, H.D.; Mehta, S.; Pope, D.; et al. Millions of dead: How do we know and what does it mean? Methods used in the comparative risk assessment of household air pollution. Annu. Rev. Public Health 2014, 35, 185–206. [Google Scholar] [CrossRef] [PubMed]
- International Agency for Research on Cancer. Nigeria Fact Sheets. 2021. Available online: https://gco.iarc.fr/today/data/factsheets/populations/566-nigeria-fact-sheets.pdf (accessed on 27 November 2021).
- Gauer, B.; Sauer, E.; Nascimento, S.; Göethel, G.; Peruzzi, C.; Flesch, I.; Fão, N.; Cestonaro, L.; Sant’Pierre, T.; Gioda, A.; et al. Cellular response to chemicals presents in air pollution in occupationally exposed workers and its potential cancer susceptibility. Chemosphere 2021, 263, 127857. [Google Scholar] [CrossRef] [PubMed]
- Li, R.; Zhou, R.; Zhang, J. Function of PM2.5 in the pathogenesis of lung cancer and chronic airway inflammatory diseases. Oncol. Lett. 2018, 15, 7506–7514. [Google Scholar] [CrossRef] [PubMed] [Green Version]

| Variable | Source |
|---|---|
| Particulate matter PM2.5 (Mean annual Exposure in micrograms per cubic meter) | WBDI * |
| Total greenhouse gas emissions Kiloton of CO2 equivalent (GHGas) | WBDI * |
| Methane Emissions kt of CO2 equivalent (CH4) | WBDI * |
| Carbon dioxide emissions kiloton (CO2) | WBDI * |
| Cancer Prevalence (cancer cases and case rate) | IHME |
| Human Development Index (HDI) | UNDP |
| Year | No Obs | Variables | Mean | Median | Variance | Variables | Mean | Median | Variance | |
|---|---|---|---|---|---|---|---|---|---|---|
| 2004 | 9 | Cancer Cases | 96,885.33 | 81,490.00 | 3,836,512,968 | 2005 | Cancer Cases | 100,077.67 | 84,698.00 | 4,117,779,881 |
| Population | 49,976,022.89 | 37,379,766.00 | 1.32 | Population | 51,320,652.78 | 38,450,323.00 | 1.39 | |||
| Case rate | 0.002 | 0.001 | 4.52 | Case rate | 0.00 | 0.0017000 | 4.55 | |||
| PM2.5 | 34.14 | 33.60 | 115.39 | PM2.5 | 33.53 | 29.60 | 159.60 | |||
| CO2 | 64.16 | 82.460 | 955.24 | CO2 | 63.39 | 83.18 | 935.13 | |||
| Methane | 38,355.56 | 30,260.00 | 717,212,178 | Methane | 39,785.56 | 31,110.00 | 784,609,928 | |||
| HDI | 0.45 | 0.44 | 0.01 | HDI | 0.46 | 0.46 | 0.006 | |||
| GHGas | 114,265.56 | 62,620.00 | 18,689,196,428 | GHGas | 117,437.78 | 66,440.00 | 18,978,634,344 | |||
| 2006 | 9 | Cancer Cases | 103,584.56 | 88,435.00 | 4,513,505,625 | 2007 | Cancer Cases | 106,937.44 | 92,282.00 | 4,934,781,160 |
| Population | 52,710,351.33 | 39,548,666.00 | 1.47 | Population | 54,232,659.33 | 40,681,416.00 | 1.54 | |||
| Case rate | 0.002 | 0.001 | 4.85 | Case rate | 0.002 | 0.002 | 5.025 | |||
| PM2.5 | 33.87 | 29.26 | 147.25 | PM2.5 | 34.49 | 29.93 | 176.78 | |||
| CO2 | 66.65 | 82.97 | 894.18 | CO2 | 65.77 | 82.77 | 917.32 | |||
| Methane | 40,260.00 | 31,180.00 | 822,985,975 | Methane | 42,856.67 | 34,590.00 | 820,484,675 | |||
| HDI | 0.47 | 0.47 | 0.01 | HDI | 0.49 | 0.48 | 0.006 | |||
| GHGas | 117,968.89 | 64,640.00 | 19,003,282,311 | GHGas | 124,262.22 | 67,750.00 | 20,148,814,194 | |||
| 2008 | 9 | Cancer Cases | 110,586.44 | 95,123.00 | 5,432,909,761 | 2009 | Cancer Cases | 114,718.00 | 99,147.00 | 6,009,519,804 |
| Population | 55,725,810.44 | 41,853,944.00 | 1.62 | Population | 57,172,932.11 | 43,073,830.00 | 1.71 | |||
| Case rate | 0.002 | 0.002 | 5.24 | Case rate | 0.002 | 0.0018000 | 5.71 | |||
| PM2.5 | 35.20 | 33.69 | 172.05 | PM2.5 | 35.71 | 33.91 | 143.15 | |||
| CO2 | 65.78 | 81.64 | 789.63 | CO2 | 62.41 | 68.36 | 566.21 | |||
| Methane | 44,414.44 | 35,280.00 | 812,477,578 | Methane | 45,040.00 | 35,590.00 | 817,753,375 | |||
| HDI | 0.50 | 0.48 | 0.006 | HDI | 0.51 | 0.49 | 0.006 | |||
| GHGas | 130,320.00 | 70,490.00 | 22,750,733,400 | GHGas | 127,467.78 | 71,630.00 | 20,347,260,019 | |||
| 2010 | 9 | Cancer Cases | 119,184.00 | 102,703.00 | 6,615,432,444 | 2011 | Cancer Cases | 124,259.67 | 106,875.00 | 7,318,883,180 |
| Population | 58,762,802.89 | 44,346,532.00 | 1.81 | Population | 60,404,539.22 | 45,673,520.00 | 1.91 | |||
| Case rate | 0.002 | 0.002 | 5.94 | Case rate | 0.002 | 0.002 | 5.93 | |||
| PM2.5 | 35.50 | 33.80 | 81.71 | PM2.5 | 35.63 | 33.10 | 79.83 | |||
| CO2 | 65.82 | 72.62 | 572.02 | CO2 | 65.51 | 71.18 | 490.66 | |||
| Methane | 46,748.89 | 37,730.00 | 868,274,361 | Methane | 48,243.33 | 38,100.00 | 926,473,350 | |||
| HDI | 0.51 | 0.50 | 0.01 | HDI | 0.52 | 0.50 | 0.01 | |||
| GHGas | 134,881.11 | 75,950.00 | 22,597,295,686 | GHGas | 136,954.4 | 81,790.00 | 21,454,099,328 | |||
| 2012 | 9 | Cancer Cases | 129,608.78 | 111,872.00 | 8,137,820,528 | 2013 | Cancer Cases | 134,992.44 | 116,079.00 | 8,804,454,974 |
| Population | 62,096,530.44 | 47,053,033.00 | 2.01 | Population | 63,835,400.56 | 48,483,132.00 | 2.12 | |||
| Case rate | 0.002 | 0.002 | 5.88 | Case rate | 0.002 | 0.002 | 6.344 | |||
| PM2.5 | 37.00 | 33.40 | 106.76 | PM2.5 | 36.14 | 34.70 | 80.76 | |||
| CO2 | 65.83 | 72.73 | 548.80 | CO2 | 65.16 | 71.95 | 542.45 | |||
| Methane | 49,800.00 | 37,110.00 | 1,008,354,375 | Methane | 51,391.11 | 37,420.00 | 1,063,888,136 | |||
| HDI | 0.53 | 0.51 | 0.005 | HDI | 0.54 | 0.52 | 0.01 | |||
| GHGas | 141,530.00 | 84,930.00 | 23,045,993,400 | GHGas | 147,126.67 | 88,410.00 | 24,022,736,550 | |||
| 2014 | 9 | Cancer Cases | 140,103.00 | 117,310.00 | 9,396,953,826 | 2015 | Cancer Cases | 144,637.67 | 121,669.00 | 9,861,388,940 |
| Population | 65,616,581.44 | 49,960,563.00 | 2.24 | Population | 67,435,979.44 | 51,482,638.00 | 2.36 | |||
| Case rate | 0.002 | 0.002 | 7.55 | Case rate | 0.0022667 | 0.002 | 7.95 | |||
| PM2.5 | 35.167 | 33.00 | 76.44 | PM2.5 | 39.81 | 34.70 | 237.91 | |||
| CO2 | 68.49 | 72.42 | 544.14 | CO2 | 65.57 | 73.32 | 582.68 | |||
| Methane | 52,857.78 | 37,000.00 | 1,133,143,869 | Methane | 54,531.11 | 37,900.00 | 1,183,168,511 | |||
| HDI | 0.54 | 0.52 | 0.005 | HDI | 0.55 | 0.53 | 0.01 | |||
| GHGas | 151,693.33 | 88,980.00 | 25,232,211,650 | GHGas | 150,818.89 | 90,620.00 | 22,649,329,561 | |||
| 2016 | 9 | Cancer Cases | 149,847.78 | 126,784.00 | 10,303,690,961 | 2017 | Cancer Cases | 155,801.56 | 133,507.00 | 10,774,916,296 |
| Population | 69,292,760.89 | 53,049,231.00 | 2.49 | Population | 71,185,333.44 | 54,660,345.00 | 2.62 | |||
| Case rate | 0.002 | 0.002 | 7.91 | Case rate | 0.002 | 0.002 | 8.04 | |||
| PM2.5 | 39.80 | 36.30 | 215.70 | PM2.5 | 39.62 | 34.70 | 211.81 | |||
| CO2 | 66.12 | 70.66 | 592.80 | CO2 | 155,801.56 | 73.53 | 571.50 | |||
| Methane | 55,851.11 | 40,480.00 | 1,247,608,986 | Methane | 71,185,333.44 | 38,830.00 | 1,257,685,936 | |||
| HDI | 0.55 | 0.53 | 0.01 | HDI | 0.002 | 0.53 | 0.01 | |||
| GHGas | 153,366.67 | 91,240.00 | 22,761,038,800 | GHGas | 39.62 | 87,180.00 | 24,168,822,528 | |||
| 2018 | 9 | Cancer Cases | 162,460.56 | 140,179.00 | 11,384,224,521 | 2019 | Cancer Cases | 169,066.89 | 146,541.00 | 12,137,845,441 |
| Population | 73,107,960.89 | 56,313,444.00 | 2.76 | Population | 75,053,704.11 | 58,005,461.00 | 2.90 | |||
| Case rate | 0.002 | 0.002 | 7.93 | Case rate | 0.002 | 0.002 | 7.56 | |||
| PM2.5 | 38.44 | 33.34 | 228.78 | PM2.5 | 37.07 | 33.71 | 194.24 | |||
| CO2 | 70.92 | 72.93 | 633.89 | CO2 | 70.91 | 78.26 | 605.45 | |||
| Methane | 56,421.11 | 40,250.00 | 1,279,658,811 | Methane | 56,421.11 | 40,250.00 | 1,279,658,811 | |||
| HDI | 0.56 | 0.54 | 0.01 | HDI | 0.56 | 0.54 | 0.005 | |||
| GHGas | 157,681.11 | 79,730.00 | 24,828,444,611 | GHGas | 157,681.11 | 79,730.00 | 24,828,444,611 |
| Country | N Obs | Variables | Mean | Median | Variance | Country | Mean | Median | Variance |
|---|---|---|---|---|---|---|---|---|---|
| AGO | 16 | Cancer Cases | 41,366.13 | 40,983.00 | 66,758,248.12 | COG | 115,626.88 | 111,594.00 | 379,718,492 |
| Population | 24,992,933.81 | 24,664,292.50 | 1.68 | 68,656,459.50 | 67,887,950.00 | 1.16 | |||
| Case rate | 0.002 | 0.0016500 | 5.33 | 0.002 | 0.002 | 2.50 | |||
| PM2.5 | 32.82 | 33.60 | 15.27 | 36.84 | 41.40 | 100.32 | |||
| CO2 | 50.99 | 48.66 | 280.77 | 87.95 | 89.36 | 26.44 | |||
| Methane | 35,377.50 | 36,145.00 | 6,680,993.33 | 34,074.38 | 33,200.00 | 11,458,212.92 | |||
| HDI | 0.53 | 0.54 | 0.002 | 0.44 | 0.44 | 0.001 | |||
| GHGas | 80,915.63 | 81,925.00 | 66,932,506.25 | 53,124.38 | 51,640.00 | 22,428,746.25 | |||
| ETH | 16 | Cancer Cases | 150,637.56 | 142,945.50 | 438,435,539 | GHA | 68,339.13 | 65,899.50 | 199,393,520 |
| Population | 92,125,083.19 | 91,433,455.00 | 1.46 | 25,737,389.75 | 25,692,083.50 | 8.48 | |||
| Case rate | 0.002 | 0.002 | 3.83 | 0.003 | 0.003 | 5.90 | |||
| PM2.5 | 35.71 | 35.75 | 4.12 | 29.18 | 28.00 | 14.36 | |||
| CO2 | 77.45 | 78.71 | 72.75 | 87.41 | 88.30 | 122.80 | |||
| Methane | 85,531.88 | 85,160.00 | 207,259,283 | 15,581.88 | 14,765.00 | 16,768,442.92 | |||
| HDI | 0.43 | 0.44 | 0.002 | 0.57 | 0.58 | 0.001 | |||
| GHGas | 138,905.00 | 136,870.00 | 671,075,560 | 33,592.50 | 33,870.00 | 66,632,273.33 | |||
| KEN | 16 | Cancer Cases | 69,693.88 | 68,938.00 | 223,010,639 | NGA | 313,308.06 | 318,930.50 | 4,217,375,062 |
| Population | 43,887,246.50 | 43,760,869.50 | 2.94 | 166,198,459 | 165,016,942 | 4.38 | |||
| Case rate | 0.002 | 0.002 | 2.20 | 0.002 | 0.002 | 2.76 | |||
| PM2.5 | 28.82 | 28.60 | 4.53 | 60.55 | 60.80 | 88.04 | |||
| CO2 | 76.85 | 76.66 | 87.45 | 49.25 | 53.16 | 143.04 | |||
| Methane | 34,600.63 | 36,030.00 | 31,905,686.25 | 114,047.50 | 113,905.00 | 112,469,660 | |||
| HDI | 0.56 | 0.56 | 0.001 | 0.5013750 | 0.50 | 0.00 | |||
| GHGas | 65,332.50 | 66,755.00 | 146,965,153 | 258,021.25 | 255,325.00 | 1,055,559,958 | |||
| TZA | 16 | Cancer Cases | 110,293.38 | 109,373.50 | 396,206,282 | UGA | 77,633.31 | 74,081.50 | 250,870,919 |
| Population | 46,875,990.25 | 46,363,276.50 | 4.30 | 34,594,752.63 | 34,017,736.00 | 3.02 | |||
| Case rate | 0.002 | 0.002 | 9.1679 | 0.002 | 0.002 | 1.03 | |||
| PM2.5 | 29.07 | 29.18 | 0.76 | 47.06 | 47.16 | 18.88 | |||
| CO2 | 69.69 | 71.62 | 26.14 | 82.23 | 82.31 | 9.33 | |||
| Methane | 49,790.00 | 49,240.00 | 111,200,027 | 26,272.50 | 27,360.00 | 35,392,206.67 | |||
| HDI | 0.49 | 0.49 | 0.001 | 0.50 | 0.51 | 0.001 | |||
| GHGas | 85,213.75 | 84,870.00 | 279,615,798 | 43,065.00 | 44,685.00 | 95,303,026.67 | |||
| ZFA | 16 | Cancer Cases | 213,399.56 | 209,662.50 | 925,988,671 | ||||
| Population | 52,642,323.13 | 52,418,209.00 | 1.35 | ||||||
| Case rate | 0.004 | 0.004 | 9.58 | ||||||
| PM2.5 | 26.84 | 26.20 | 59.48 | ||||||
| CO2 | 13.88 | 14.13 | 7.27 | ||||||
| Methane | 42,931.88 | 43,900.00 | 5,078,056.25 | ||||||
| HDI | 0.67 | 0.67 | 0.001 | ||||||
| GHGas | 490,035.00 | 500,405.00 | 750,589,787 | ||||||
| Parameter | RR Estimate | 95% Confidence Limits of RR | Z | Pr > |Z| | |
|---|---|---|---|---|---|
| PM2.5 | 0.9997 | 0.9986 | 1.0009 | −0.50 | 0.6190 |
| CO2 | 1.0006 | 0.999 | 1.0023 | 0.73 | 0.4644 |
| Methane | 0.9979 | 0.9953 | 1.0005 | −1.55 | 0.1207 |
| HDI | 0.5158 | 0.0349 | 7.6162 | −0.48 | 0.6298 |
| GH | 0.9997 | 0.9979 | 1.0016 | −0.27 | 0.7879 |
| Variable | RR Estimate | 95% Confidence Limits of RR | Z | Pr > |Z| | |
|---|---|---|---|---|---|
| Year | 1.0290 | 1.0044 | 1.0541 | 2.31 | 0.0206 |
| PM2.5 | 0.9999 | 0.9981 | 1.0018 | −0.07 | 0.9408 |
| CO2 | 1.0000 | 0.9984 | 1.0016 | −0.01 | 0.9906 |
| Methane | 0.9969 | 0.9939 | 0.9999 | −2.03 | 0.0427 |
| HDI | 0.3160 | 0.0435 | 2.2980 | −1.14 | 0.2551 |
| GH | 1.0005 | 0.9990 | 1.0020 | 0.61 | 0.5437 |
Publisher’s Note: MDPI stays neutral with regard to jurisdictional claims in published maps and institutional affiliations. |
© 2022 by the authors. Licensee MDPI, Basel, Switzerland. This article is an open access article distributed under the terms and conditions of the Creative Commons Attribution (CC BY) license (https://creativecommons.org/licenses/by/4.0/).
Share and Cite
Okunromade, O.; Yin, J.; Ray, C.; Adhikari, A. Air Quality and Cancer Prevalence Trends across the Sub-Saharan African Regions during 2005–2020. Int. J. Environ. Res. Public Health 2022, 19, 11342. https://doi.org/10.3390/ijerph191811342
Okunromade O, Yin J, Ray C, Adhikari A. Air Quality and Cancer Prevalence Trends across the Sub-Saharan African Regions during 2005–2020. International Journal of Environmental Research and Public Health. 2022; 19(18):11342. https://doi.org/10.3390/ijerph191811342
Chicago/Turabian StyleOkunromade, Omolola, Jingjing Yin, Clara Ray, and Atin Adhikari. 2022. "Air Quality and Cancer Prevalence Trends across the Sub-Saharan African Regions during 2005–2020" International Journal of Environmental Research and Public Health 19, no. 18: 11342. https://doi.org/10.3390/ijerph191811342
APA StyleOkunromade, O., Yin, J., Ray, C., & Adhikari, A. (2022). Air Quality and Cancer Prevalence Trends across the Sub-Saharan African Regions during 2005–2020. International Journal of Environmental Research and Public Health, 19(18), 11342. https://doi.org/10.3390/ijerph191811342