Article

Estimating the Burden of Stroke: Two-Year Societal Costs and Generic Health-Related Quality of Life of the Restore4Stroke Cohort

by
Ghislaine van Mastrigt
1,*,
Caroline van Heugten
2,3,
Anne Visser-Meily
4,
Leonarda Bremmers
5 and
Silvia Evers
1,6
1
Department of Health Services Research, CAPHRI School for Public Health and Primary Care, Faculty of Health, Medicine and Life Sciences, Maastricht University, 6200 MD Maastricht, The Netherlands
2
MHeNS, School for Mental Health & Neuroscience, Department of Psychiatry & Psychology, Faculty of Health Medicine and Life Sciences, Maastricht University, 6229 ER Maastricht, The Netherlands
3
Department of Neuropsychology & Psychopharmacology, Faculty of Psychology & Neuroscience, Maastricht University, 6229 ER Maastricht, The Netherlands
4
Department of Rehabilitation, Physical Therapy Science and Sports, Brain Center, University Medical Center Utrecht, 3584 CX Utrecht, The Netherlands
5
Erasmus Centre for Health Economics Rotterdam (EsCHER), Erasmus University, 3062 PA Rotterdam, The Netherlands
6
Trimbos Institute, Netherlands Institute of Mental Health and Addiction Utrecht, 3521 VS Utrechtcity, The Netherlands
*
Author to whom correspondence should be addressed.
Int. J. Environ. Res. Public Health 2022, 19(17), 11110; https://doi.org/10.3390/ijerph191711110
Submission received: 28 July 2022 / Revised: 30 August 2022 / Accepted: 31 August 2022 / Published: 5 September 2022

Abstract

:
(1) Background: This study aimed to investigate two-year societal costs and generic health-related quality of life (QoL) using a bottom-up approach for the Restore4Stroke Cohort. (2) Methods: Adult post-stroke patients were recruited from stroke units throughout the Netherlands. The societal costs were calculated for healthcare and non-healthcare costs in the first two years after stroke. The QoL was measured using EQ-5D-3L. The differences between (sub)groups over time were investigated using a non-parametric bootstrapping method. (3) Results: A total of 344 post-stroke patients were included. The total two-year societal costs of a post-stroke were EUR 47,502 (standard deviation (SD = EUR 2628)). The healthcare costs decreased by two thirds in the second year −EUR 14,277 (95% confidence interval −EUR 17,319, −EUR 11,236). In the second year, over 50% of the total societal costs were connected to non-healthcare costs (such as informal care, paid help, and the inability to perform unpaid labor). Sensitivity analyses confirmed the importance of including non-healthcare costs for long-term follow-up. The subgroup analyses showed that patients who did not return home after discharge, and those with moderate to severe stroke symptoms, incurred significantly more costs compared to patients who went directly home and those who reported fewer symptoms. QoL was stable over time except for the stroke patients over 75 years of age, where a significant and clinically meaningful decrease in QoL over time was observed. (4) Conclusions: The non-healthcare costs have a substantial impact on the first- and second-year total societal costs post-stroke. Therefore, to obtain a complete picture of all the relevant costs related to a stroke, a societal perspective with a follow-up of at least two years is highly recommended. Additionally, more research is needed to investigate the decline in QoL found in stroke patients above the age of 75 years.

1. Introduction

Based on the Global Burden of Diseases Study data, the lifetime risk of stroke from the age of 25 years onward is approximately 25% among both men and women [1], while strokes remain the second leading cause of death worldwide [2]. These global figures are expected to change over the coming decades due to population growth and aging [3]. Moreover, the care for patients with stroke has drastically transformed over the past seven years due to the introduction of reperfusion therapies for ischemic stroke and improved secondary prevention [3]. This has resulted in improved stroke survival rates, and a higher prevalence of chronic stroke [2]. However, The American Heart Association forecasted that, by 2030, almost 4% of US adults will have had a stroke [4].
They also estimated an annual total healthcare cost of USD 30.8 billion in 2016 and 2017 as a result of strokes [5]. Currently, in Western countries, approximately 1.7% to 4% of total healthcare expenditures are stroke-related [6]. In addition to high healthcare costs, the disease also generates non-healthcare costs, such as costs related to (in)formal care provision or productivity losses [5,7,8]. In the first year post stroke, these costs could account for anything from 34% to over 75% of the total societal costs [7,9]. Hence, strokes have a considerable effect on the psychological and emotional well-being of patients, which is also strongly reflected in a reduced health-related quality of life (QoL) [10,11]. The effects of a stroke can interfere with many aspects of daily life [11] and in some cases may render the patient fully dependent on others [12]. Considering both the high (non-) healthcare costs of strokes and their adverse impact on QoL, there is a need to investigate the burden of illness of a stroke in the long term to obtain insights into when costs occur and how a stroke affects QoL.
Building on previous work from the Restore4Stroke study [13], the one-year societal costs and QoL of stroke patients was investigated [7]. However, little is known about the long-term (more than one year) costs and QoL post stroke using a societal perspective and using a bottom-up costing approach [5,8,14,15]. It is hypothesized that the costs of a stroke will peak within the first year and decline over time, while the QoL will increase. However, there is a need for further exploration of long-term resource use [16].
The current study involves a bottom-up Burden of Disease (BoD) study from a societal perspective with a two-year follow-up. More specifically, the aims of the current study were: (1) to estimate the total societal costs two years post stroke; (2) to compare both the healthcare and the non-healthcare costs measured in the first and second-years post-stroke; (3) to measure the impact of strokes on generic health-related QoL at one and two years post-stroke; and (4) to identify relevant stroke subgroups.

2. Materials and Methods

2.1. Study Design

The current study was embedded in a prospective, multi-center, observational cohort study entitled ”Restore4Stroke”, which aims to gain insight into care received post-stroke, and the economic consequences of psychosocial care in the first two years post-stroke. The design of this BoD study [13], the short-term follow-up of BoD data [7], and the short- to long-term follow-up of disease-specific quality of life has been published elsewhere [17,18]. The current BoD study reports on two-year follow-up results of societal costs and health-related related QoL. This study was performed according to the Dutch guidelines for economic evaluations in healthcare [19], reported according to the Consolidated Health Economic Evaluation Reporting Standards (CHEERS 2022) guidelines [20] and Strengthening the Reporting of OBservational Studies in Epidemiology (STROBE) [21]. The datasets used and/or analyzed during the current study are available from the corresponding author upon reasonable request.

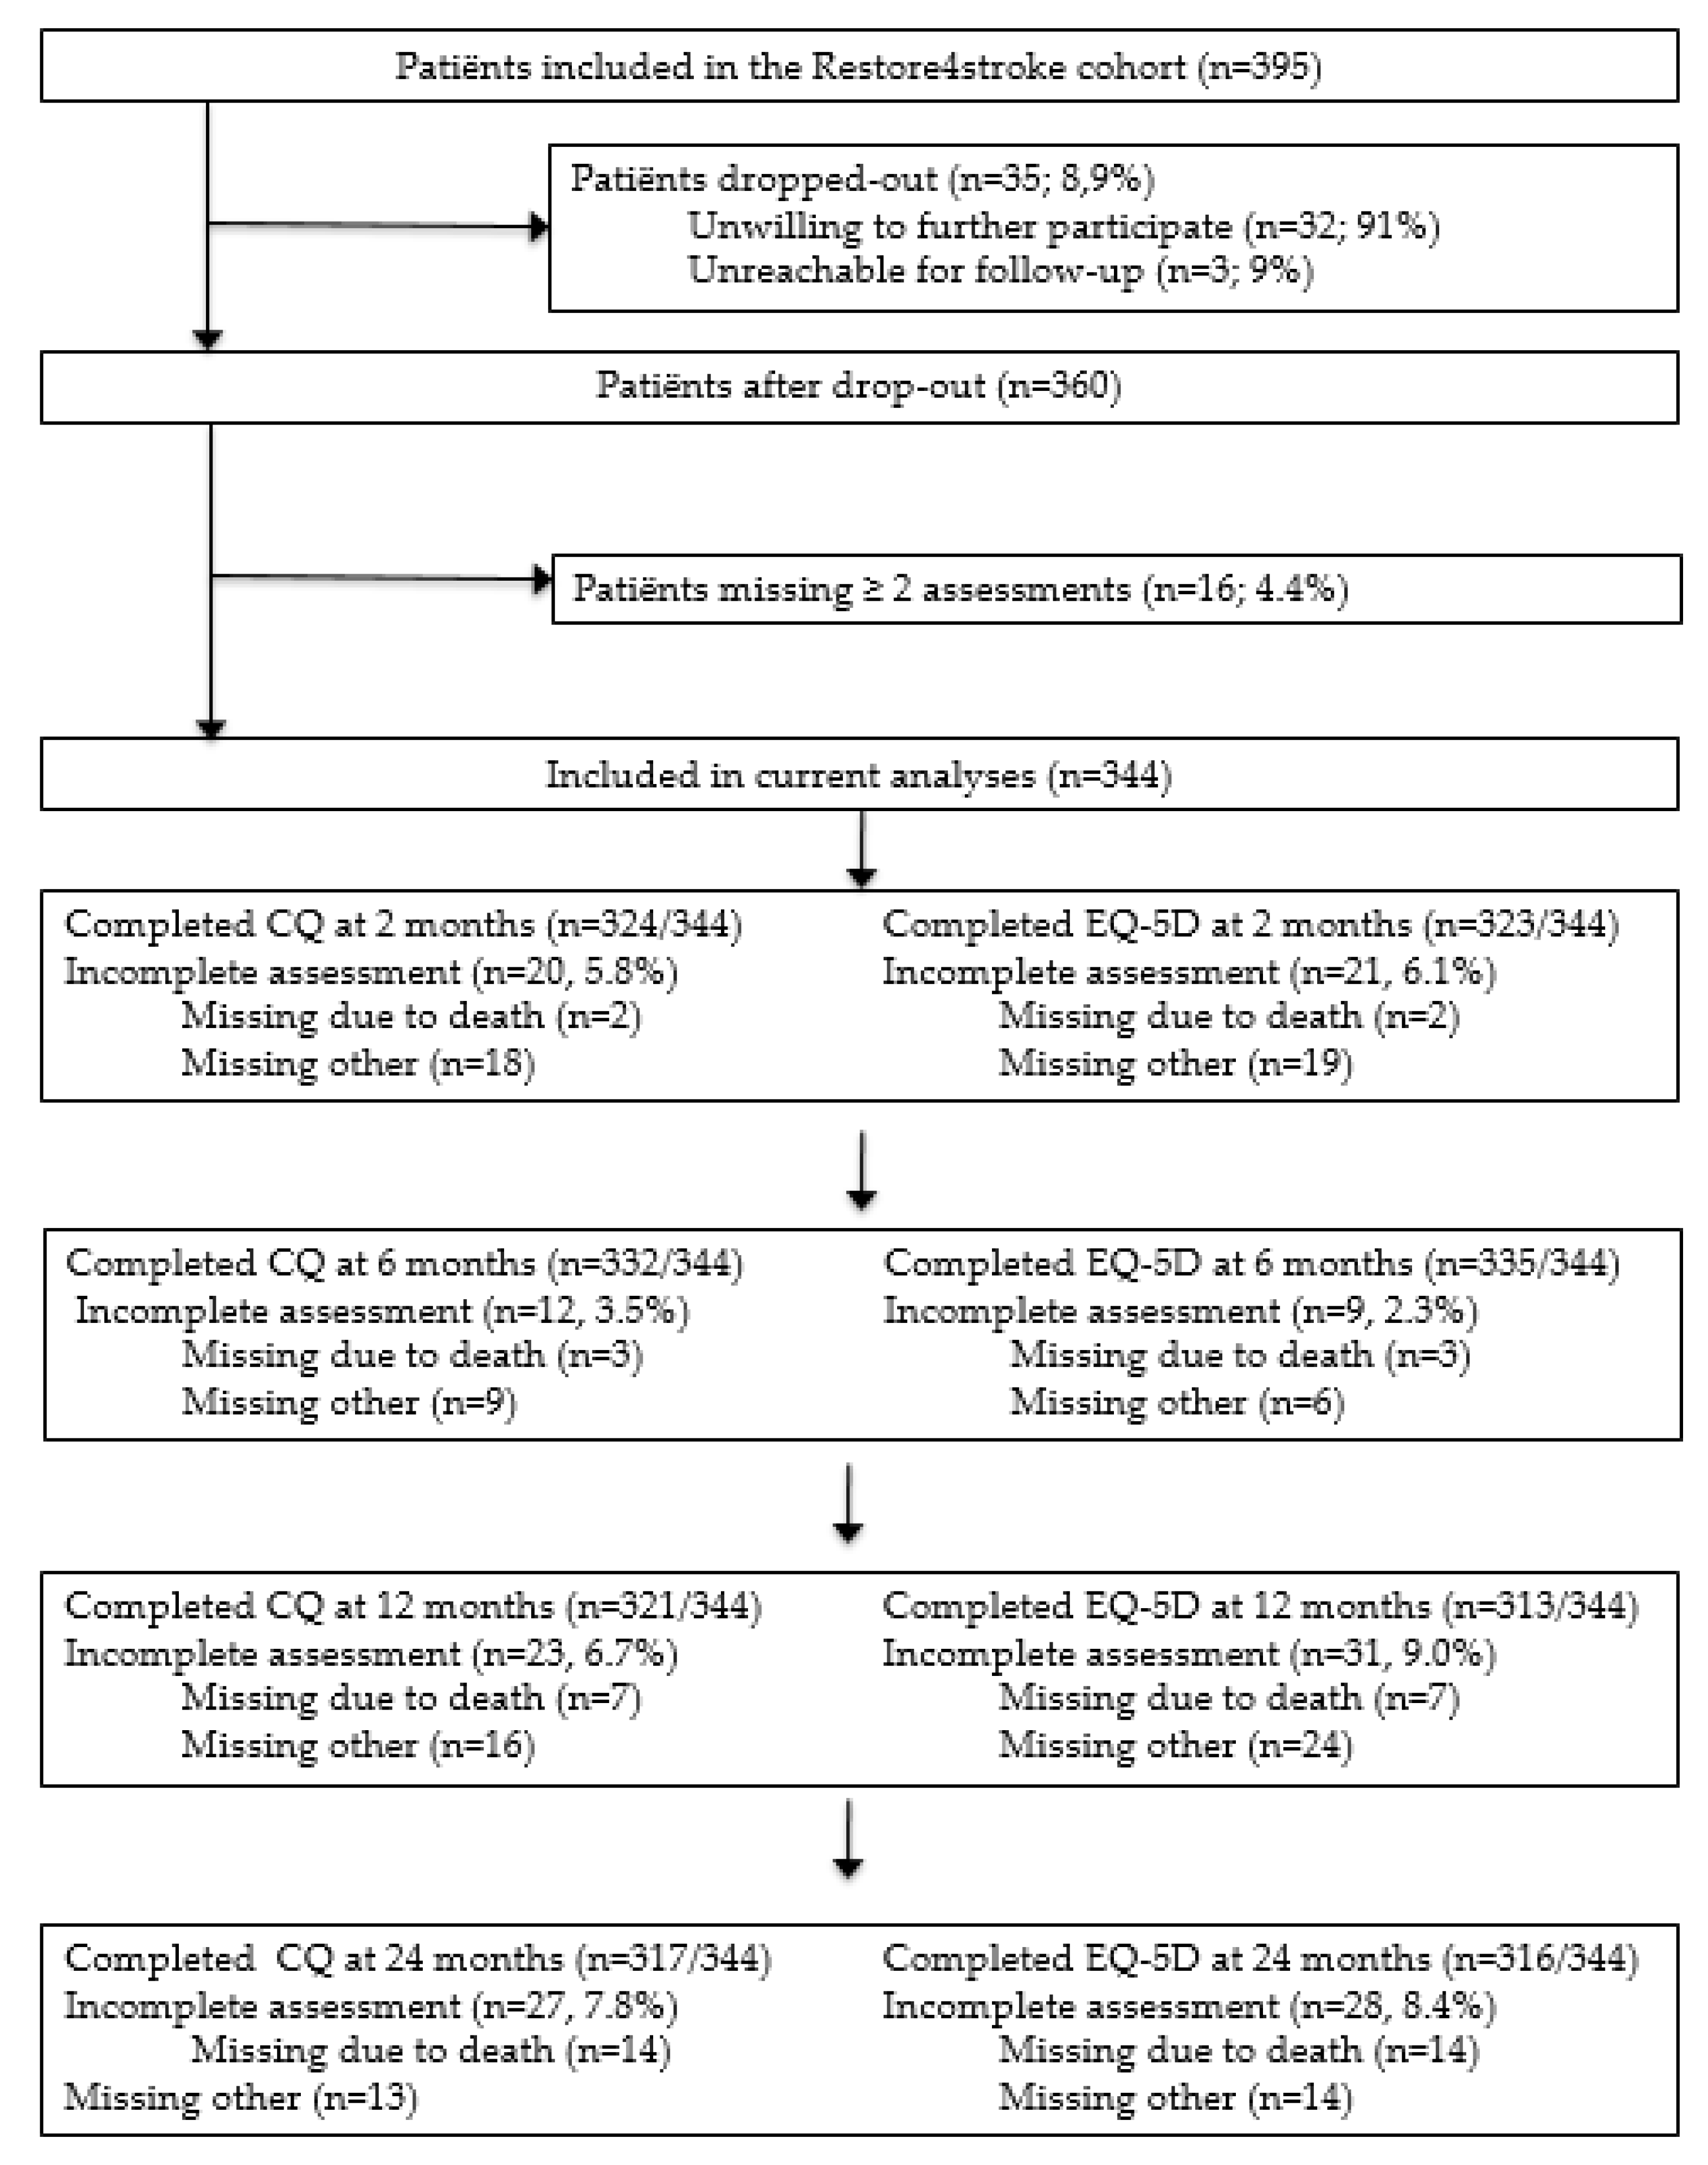
2.2. Setting and Participants

Stroke survivors were recruited from stroke units in six general hospitals throughout the Netherlands: St. Antonius Hospital (Nieuwegein); Diakonessenhuis (Utrecht); Canisius Wilhelmina Hospital (Nijmegen); TweeSteden Hospital (Tilburg); St. Elisabeth Hospital (Tilburg); Catharina Hospital (Eindhoven). Patients were eligible for inclusion if they had a clinically confirmed stroke (either first or recurrent stroke) within the last seven days and were at least 18 years of age. The exclusion criteria were if the patient (1) had any other condition that may be expected to interfere with the study outcomes (e.g., neuromuscular disease), (2) were clinically judged unable to sufficiently understand and complete Dutch questionnaires, (3) were rated physically dependent as defined by a Barthel Index (BI) [22] score of 17 or below, or (4) had existing cognitive decline before the stroke as defined by a score of 1 or higher on the Heteroanamnesis List Cognition [23]. The medical ethics committees of all participating hospitals approved the Restore4Stroke Cohort study and informed consent was obtained from all included patients. Patients were treated according to Dutch guidelines for stroke treatment and rehabilitation [24], including general aftercare at the outpatient clinic of neurology at six to eight weeks post-discharge in addition to regular follow-up for secondary prevention purposes.

2.3. Procedures

Patients received information on the study and were asked to give informed consent by the nurse practitioner or the trial nurse during the hospital stay in the first-week post-stroke. After informed consent was obtained, the patients’ characteristics were collected. The generic health-related QoL questionnaires (EuroQoL-5D-3L) [25] and the 11-item cost questionnaires were filled in at two months, six months, one year, and two years post-stroke. At two months and six months, a research assistant visited the stroke patient at home or at the institution where the patient resided at that moment. Questionnaires were sent to the patients in advance and trial nurses assisted with completion. At six months, one year, and two years post-stroke, patients could choose to fill in an online or paper version of cost and QoL questionnaires. All administered questions were checked by trial nurses to avoid missing data. All patients were contacted several times by phone in case of delay or non-response.

2.4. Costing

A bottom-up costing approach from a societal perspective using a specifically designed 11-item cost questionnaire was performed (supplementary file, Supplementary S1). The questionnaire consisted of open questions measuring both healthcare and non-healthcare resource use. Healthcare items were related to the number of general practitioner, specialist, allied health professional, mental healthcare professional and rehabilitation treatment visits, as well as overnight stays in hospitals, rehabilitation clinics, nursing homes, and psychiatric clinics. In addition, information on medication use (duration, amount, and dosages) was collected. Non-healthcare resource use questions were related to expenses incurred via paid home care, informal unpaid care, and the patient’s inability to perform unpaid and paid labor (productivity losses).
The valuation of the costs was conducted using the updated Dutch Manual for Cost Analysis in Health Care Research [26]. An overview of the healthcare and non-healthcare unit costs was reported and is included in the supplementary file (Supplementary S2). Costs of medication (prescribed and over-the-counter drugs) were valued according to the market prices in the summer of 2019 (including 6% tax) [27]. To account for uncertainty, the lowest cost price was used to estimate drug costs. The friction cost method was used to calculate productivity costs by calculating production losses confined to the period required to replace a sick employee (85 working days or 12 weeks) [28]. Productivity costs were not calculated for patients over 66 years of age. All costs were valued in 2018 Euros. Discounting was applied for costs after 12 months using a rate of 4% [19].

2.5. Quality of Life (QoL) Measurement

The descriptive system of the three-level EuroQoL (EQ-5D-3L) is a widely used and recommended preference-based measure of health [25]. The five items refer to the following dimensions: mobility; self-care; usual activities; pain/discomfort; anxiety/depression. The three-level scale utilized for scoring included: no problems; some problems; extreme problems. The EQ-5D-3L for use in post-stroke patients has shown reasonable validity and reliability. However, in this same study, limitations in responsiveness were observed [29]. The EQ-5D-index or EuroQoL utility score was derived from the EQ-5D-3L using the Dutch value set [30]. The lower the scores on the EuroQoL dimensions or Euroqol utility score, the worse the quality of life. A discount rate of 1.5% was applied in the second year post-stroke, as recommended by Dutch PharmacoEconomics guidelines [19]. Clinically meaningful differences in utility measurements were estimated using 0.5 times the standard deviation on a baseline measurement [31].

2.6. Handling of Missing Data

When two or more complete assessments were missing from the cost and/or quality of life questionnaires, patients were excluded from the analyses. Diseased patients were always included in the analysis. The EQ-5D-3L scores for diseased patients were set to the maximum ranking for all dimensions (i.e., a score of 3/3/3/3/3) and the costs were defined as zero for all measurements after their reported date of death.
Cost questionnaires were filled in at two months (retrospective for two months), six months (retrospective for four months), and at twelve and twenty-four months (retrospective for six months). In the base case analysis, to calculate the total resource use of the second year (12 to 24 months period of 12 months in total), the 24-month measurement was doubled (twice the reported 6 months of resource use).

2.7. Statistics

Multiple imputations were applied to replace missing cost and QoL data using the following predictors: gender; marital status; age; treatment location; severity of stroke (National Institutes of Health Stroke Scale (NIHSS) rating) [32,33]. The resource use and costs were reported for the total follow-up period (24 months) and two study periods (0–12 and 12–24 months post-stroke). These data were reported in mean, medians, and standard deviations as well as in mean differences and 95% confidence intervals (95%CIs). Since cost data are generally known to be skewed, we used non-parametric bootstrapping to estimate the uncertainty. Different sets of replication runs were tested, and 1000 replications will result in stable outcomes [19]. Statistical differences between the groups were analyzed using the same bootstrapping technique (Excel 2016) as in the cost analyses. The scores on the five dimensions of the EuroQoL and Dutch utilities were reported as mean, standard deviation for the total group, by gender, age groups (<65, 65–74 and >74 years of age), and stroke severity (NIHSS) at every measurement point. All other analyses were performed using IBM SPSS Statistics version 25.

2.8. Sensitivity and Subgroup Analyses

Four sensitivity analyses were performed to test for differences between follow-up measurements or follow-up periods. In the first sensitivity analysis, the subject of investigation was the extrapolation of the costs from a 12 to 18-month period. In the base case analyses, to estimate the total costs for the second year after stroke, the total costs at 24 months (retrospective measurement for 6 months) were multiplied by two. In the sensitivity analysis, the costs at 12 months (retrospective measurement for 6 months) and the costs at 24 months were added to estimate the costs of the same period. In the second sensitivity analysis, the societal perspective (taking into account both health and non-healthcare costs) was compared to the healthcare perspective (only using healthcare costs). In the two other sensitivity analyses, the base case Dutch tariffs [30] for the valuation of utilities were replaced by the UK tariffs [34] at 12 and 24 months, respectively.
Both generic health-related quality of life and the total societal costs were investigated in seven subgroups. These groups were gender (male/female), age (65−/65+), education level (low/high), stroke type (infarction/hemorrhage), recurrent stroke (yes/no), home discharge (yes/no), and severity of stroke (NHISS 0–4/>5).

3. Results

3.1. Patient Characteristics

A total of 78% (n = 344) of the initial Restore4Stroke Cohort (n = 395) was included in the current study. A total of 35 patients (8.9%) dropped out and another 16 patients (4.4%) were excluded as they had two or more assessments of costs and/or QoL measurements missing. More details on the missing data are reported in Figure 1.
Table 1 shows the background characteristics of the post-stroke patients. The mean age at stroke onset was 66.7 years, and 35.5% of the patients were female. One-third of the patients were not in a relationship and had completed higher education at the start of the study. Over 75% of the patients reported no or minor stroke symptoms. A total of 97 patients (28.2%) did not go home after their discharge from the stroke unit. These patients were either admitted to a rehabilitation center (n = 48, 14.0%) or to a nursing home (n = 49, 14.2%).

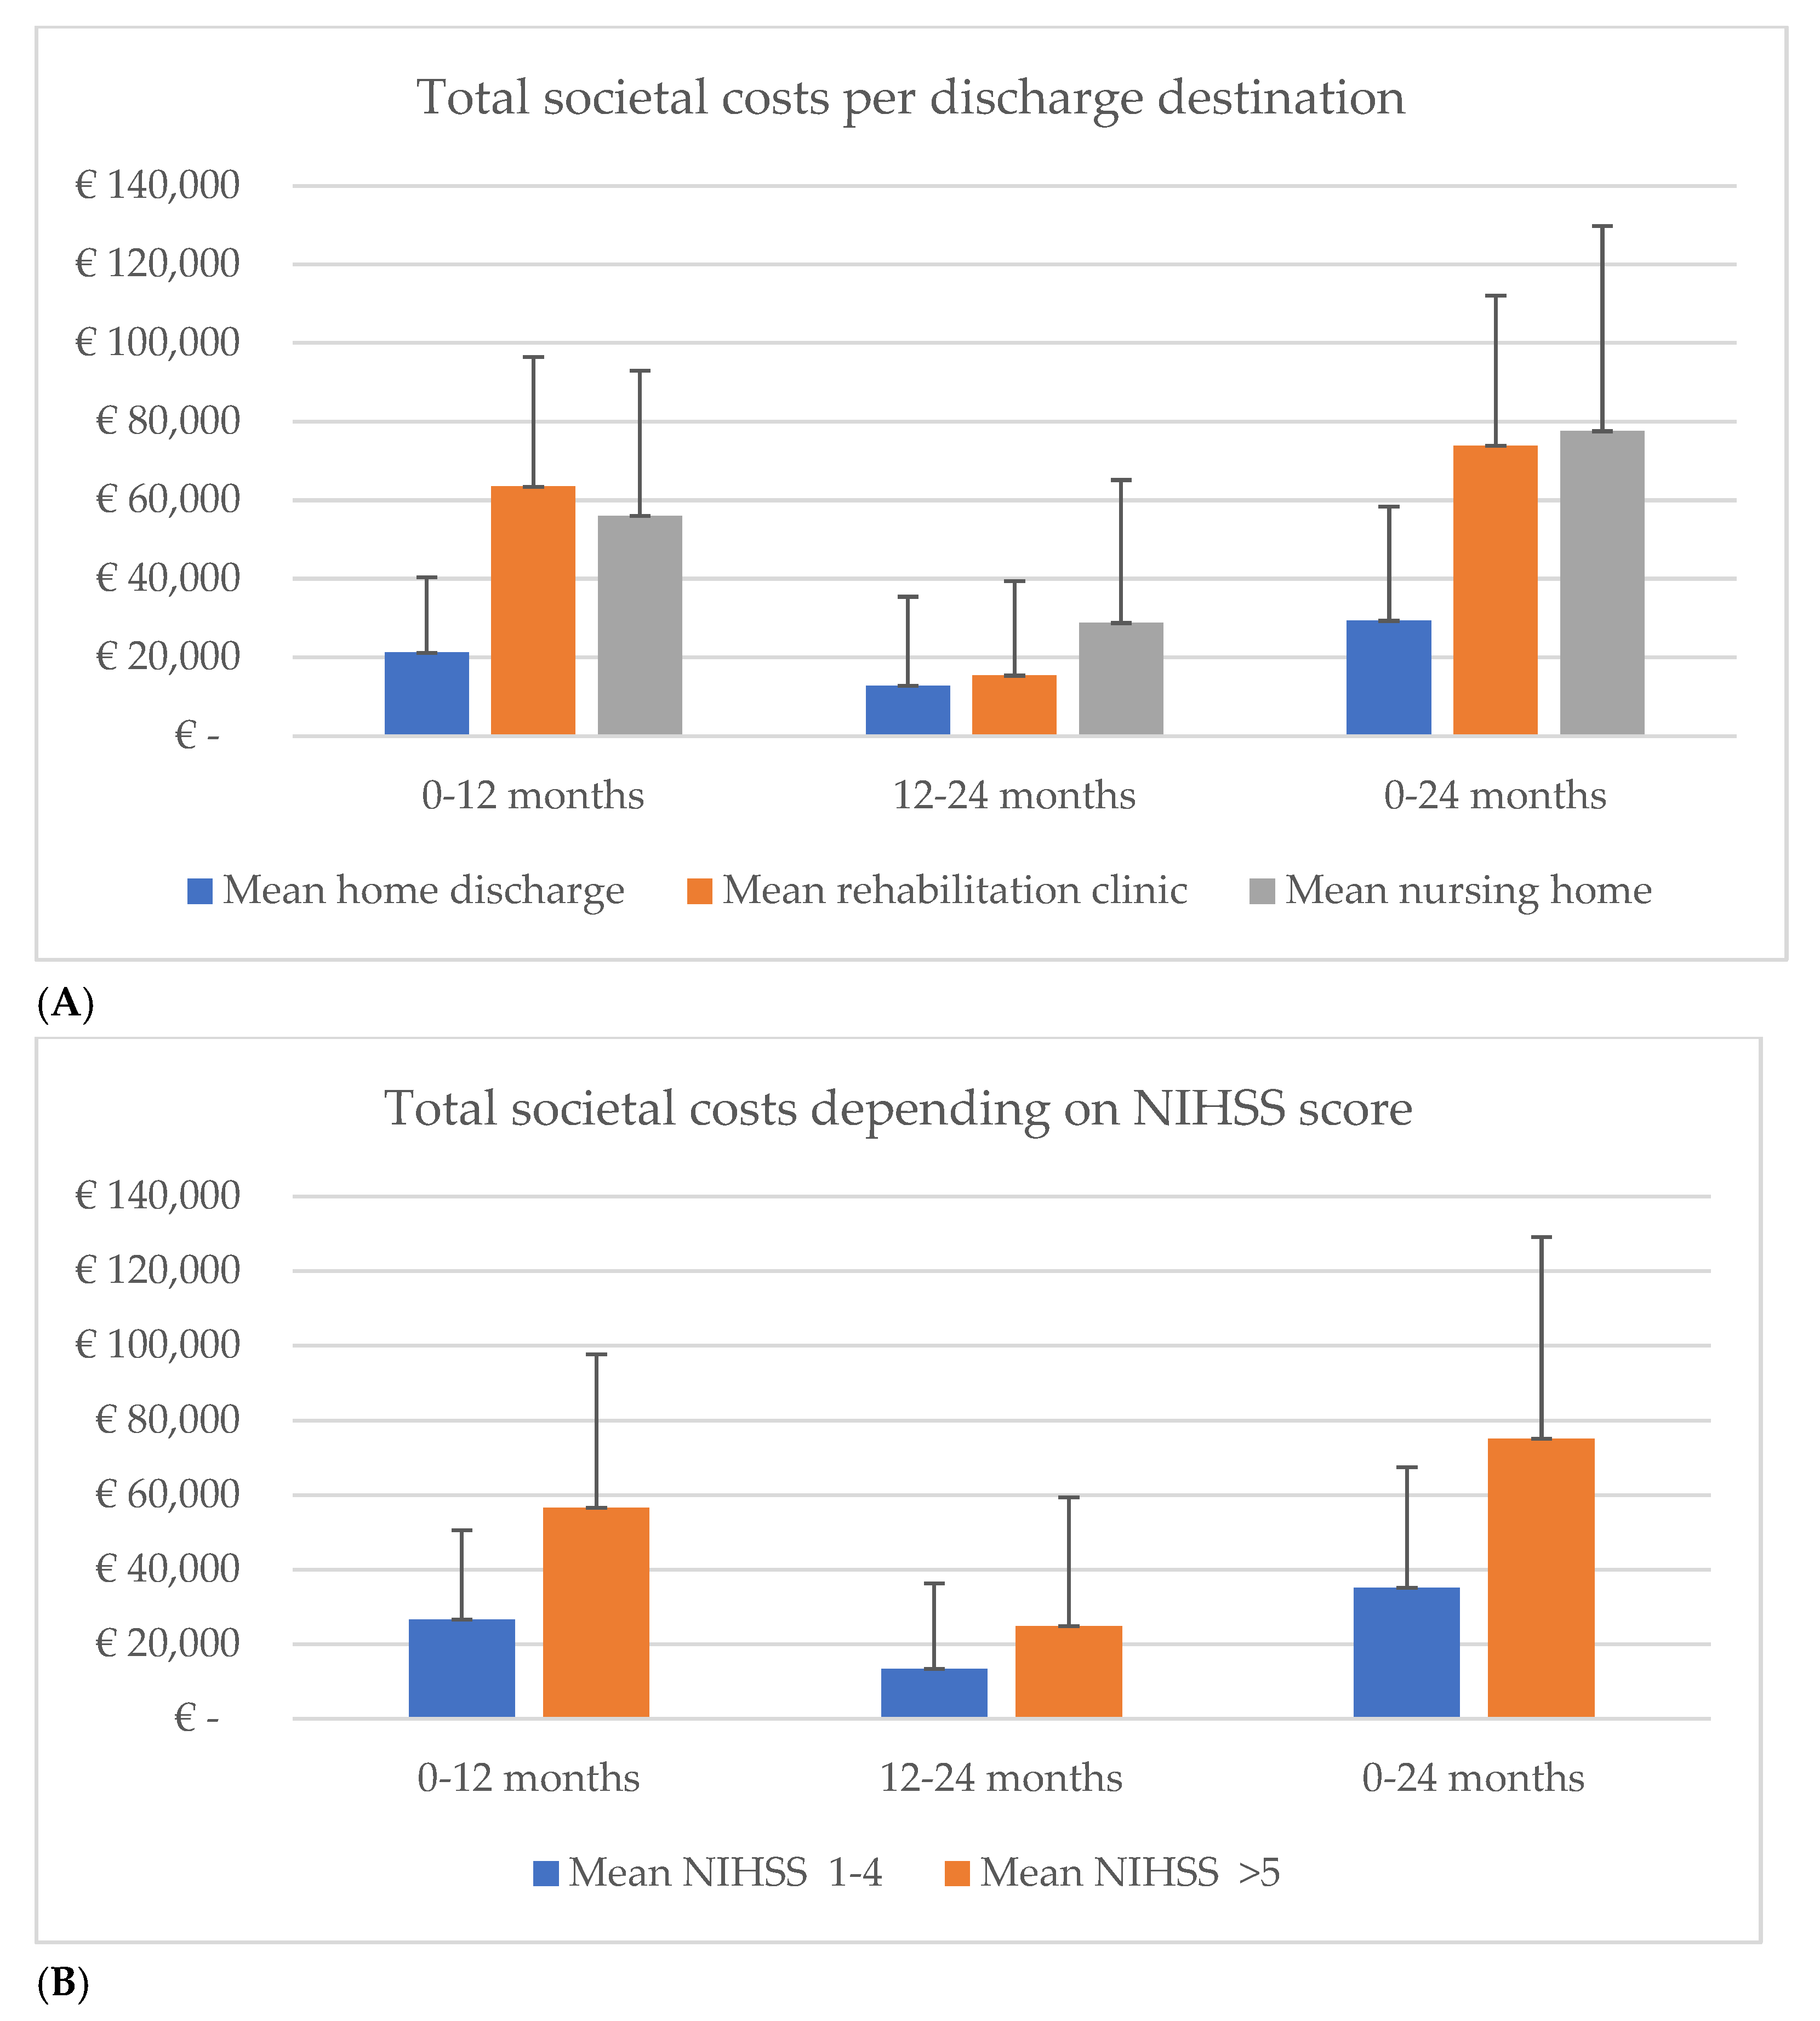
3.2. The Total Societal Costs over Two Years Post-Stroke

The average total societal cost for patients two years post-stroke was EUR 47,502 (SD = EUR 2628). The mean healthcare cost was estimated to be EUR 27,159 (SD = EUR 1611) and the mean non-healthcare costs were on average EUR 20,330 (SD = EUR 1603) per patient. Over 80% (EUR 21,829) of the healthcare costs were related to outpatient rehabilitation and inpatient hospital and rehabilitation stay. The other 20% of the healthcare costs were related to the remaining healthcare cost categories, such as costs of medication, general practitioner, and specialist visits. 60% of the non-healthcare costs in the two years after a stroke are related to paid home care, informal care, and the cost of productivity losses. The other 40% of costs (EUR 8284) are due to the patients’ inability to perform unpaid labor. For further details on resource use and costs in the 24 months post-stroke, see Table 2.

3.3. Healthcare and Non-Healthcare Costs in the First and Second-Year Costs after Stroke

A significant difference was reported in societal costs between the first year and the second year after a stroke (mean = −EUR 16,703, 95%CI = −EUR 21,243, −EUR 12,039) (see Table 3). The total costs in the second year post-stroke (mean = EUR 15,383, SD = EUR 1526) were on average one third lower compared to the total costs reported in the first year (mean = EUR 32,085, SD = EUR 1743). The total healthcare costs were also significantly lower in the second compared to the first year after a stroke (mean = −EUR 14,277, 95%CI = −EUR 17,319, −EUR 11,236). This was mainly caused by significantly lower costs in three major cost categories: outpatient rehabilitation, inpatient hospital stay, and inpatient rehabilitation stay. Additionally, stroke patients reported fewer visits to general practitioners and allied health and mental healthcare professionals in the second year after stroke compared to the first year. The non-healthcare costs were lower in the second year, but this difference was not statistically significant (mean = −EUR 2426, 95%CI = −EUR 5079, EUR 246). In the second-year post-stroke, significantly higher costs were reported for the inability to perform unpaid labor. In the first year, the estimated costs due to productivity losses were higher compared to the second year. This was caused by the method used for the calculation of the productivity losses (friction cost method).

3.4. Generic Health-Related Quality of Life 2 Years Post-Stroke

The scores with respect to the five dimensions of the EQ-5D-3L were comparable at 12 months post-stroke compared to 24 months post-stroke. This also accounts for the utilities estimated using the Dutch tariffs for either group. When the patients were divided into subgroups for “gender” (male/female) and “severity of stroke” (NIHSS categories 0, 1–4, 5–12 and ≥13), no significant differences in utilities were reported in time. Only patients over 75 years of age had a significant decrease and clinically meaningful lower utility score at 24 months compared to 12 months post-stroke (mean = −0.14, 95%CI = −0.23, −0.05). For details, see Table 4.

3.5. Sensitivity Analyses & Subgroup Analyses

The sensitivity analysis shows that the cost extrapolation method in the second year after stroke did not change the base case results. In another sensitivity analysis, it was found that societal costs were significantly higher compared to healthcare costs (mean = −EUR 15,382, 95%CI = −EUR 21,244, −EUR 9785).
When the Dutch utilities were compared with UK tariffs at one year, no significant difference was reported (mean = −0.0506, 95%CI = −0.1104, 0.0081). At 24 months, however, significantly different utilities were observed (mean = −0.0644, 95%CI = −0.1122, −0.0167). However, this difference could not be defined as clinically meaningful. For details, see Table 5.
At 12 months utility, significant differences were observed in the subgroups “age” (65+/65−) and “discharge at home” (Yes/No), the 24 months utility measurements, and for the subgroup “stroke type” (Infarction/Hemorrhage). However, only the subgroup “stroke type” could also be defined as clinically meaningful. In other words, in the hemorrhage subgroup, the utilities were lower compared to the infarction group. After two years, the societal costs were significantly higher when the patients were transferred to rehabilitation clinics or geriatric rehabilitation centers (n = 97) compared to home discharge (Table 5). Patients discharged to the geriatric rehabilitation centers (n = 49) incurred twice as many costs as patients who went home (n = 247) or were transferred to rehabilitation clinics (n = 48) in the second year (Figure 2A). However, this difference was not observed in the first year post-stroke. The costs of patients with moderate to severe stroke symptoms were on average twice as high as those with fewer symptoms during a follow-up (Table 5, Figure 2B).

4. Discussion

Examining the recent period, this is the first prospective burden of disease study performed using a societal perspective and a bottom-up costing approach with a two-year follow-up. The average societal cost for a stroke patient after 24 months was EUR 47,502 (SD = EUR 2628). A decline in societal costs in the second year was observed (mean = −EUR 16,703, 95% CI = −EUR 21,243, −EUR 12,039). However, the non-healthcare costs, such as (in)formal care costs and the cost of not being able to perform unpaid labor, have a substantial impact on the total costs in the second year after a stroke. The sensitivity analyses confirmed the importance of including non-healthcare costs for the long-term follow-up. The subgroup analyses showed that the patients who were transferred to rehabilitation clinics or geriatric centers, and those with moderate to severe stroke symptoms, incurred significantly more costs compared to patients who went directly home and reported fewer stroke symptoms. The QoL was stable over time except for stroke patients over 75 years of age, where a significant and clinically meaningful decrease in QoL over time was observed.
In general, studies investigating the economic burden of strokes often do not document non-healthcare costs (e.g., costs related to informal care provision, unpaid help, and productivity losses), despite their significant contribution to the total costs [8,14]. In addition, most burden of disease studies involve top-down methods of costing [15]. Although time-consuming, bottom-up micro-costing is generally seen as the gold-standard method for hospital service costing, leaving the top-down method arguably inferior [35,36]. Based on the findings of a recent systematic review [8], there is a need for long-term (>18 months) post-stroke burden of disease studies. Only three of the included studies [37,38,39] report findings on two-year cost data [8]. The differences in costs of these three studies compared to our study could be explained by methodological discrepancies. For instance, our 24-month estimate of over EUR 47,000 per stroke patient is almost EUR 27,000 (recalculated using purchasing power parity) higher than the Swedish estimate of Ghatnekar et al., 2014 [37]. In the Swedish study, the source for the estimation of resource use (such as rehabilitation, secondary prevention drugs, and productivity losses) was the literature, whereas the Restore4Stroke study used questionnaires. Furthermore, the friction cost method [13] was used to estimate the costs of productivity losses in the Restore4stroke study compared to the human capital approach in the Swedish study [37]. The latter method generates higher costs as it includes every hour not worked due to illness, possibly until the patient’s retirement age. The friction cost method only counts hours lost as time taken until another person assumes the patient’s work [28]. In the two other cost of illness studies reporting two-year data—one performed in Germany [39] (healthcare perspective) and the other in Australia (societal perspective) [38]—the estimated direct medical costs ranged from EUR 13,000 to EUR 17,000 (recalculated using purchasing power parity).However, there are striking differences between the design of each of these studies and the Restore4stroke study. In the German study [39], the cost estimates were based on tariffs, which do not reflect actual costs unlike the real cost prices used in the Restore4Stroke study. The Australian COI study [38] used a top-down approach for costing and claims data for the identification of resource use, which was different to a bottom-up approach for costing and patient-reported resource use in the Restore4Stroke study. These cost differences could be explained by disparities in the study populations and divergences in the provided treatments or clinical practice guidelines for strokes [40,41]. For example, recent changes in stroke care due to the implementation of better acute medical care, such as thrombolysis and thrombectomy, may differ between countries. Finally, cultural differences such as the availability of informal care [42] in a specific country could also have influenced the study findings.
The costs of a stroke have previously been associated with stroke severity in the first-year post-stroke [43,44] and were confirmed in our study. Additionally, we were able to observe this for a long-term follow-up. Furthermore, discharge to rehabilitation clinics and nursing homes was also a significant determinant for higher costs in both short- and long-term follow-ups, indicating the importance of considering this factor for the calculation of total costs in a specific stroke cohort. Our study confirmed the statement of Evers et al. in 2004 [45]: “Stroke puts a substantial burden on the informal caregivers in the first 2 years post-stroke”. In both the first and the second year after stroke, this could be considered high, with an annual average cost of EUR 2000 (150 h). The reason for this is unclear and needs further investigation. It could be related to emotional support or more practical help for stroke patients, including household tasks or transport.
Besides the costs, the QoL was also investigated. For stroke survivors, a QoL utility score of 0.68 to 0.73 was reported in previous research [46,47], which is comparable to the observed two-year utility score of 0.71 in the Restore4Stroke Cohort. However, there is a need to carefully monitor post-stroke patients as they have a lower generic QoL compared to age group norms [48,49,50]. This is especially important for stroke patients in the Restore4Stroke Cohort over 75 years of age; besides a low score in the first 2 years, they also show a clinically relevant decline in the second year post-stroke. A recent systematic review on health state utility values of people with strokes reported the same findings [50]. A stroke aftercare program, which provides emotional support and psycho-education to stroke patients, could focus on this elderly group [48].
The strengths of the current study are: (1) the data were obtained through a prospective multi-center observational cohort study entitled ‘’Restore4Stroke’’, of which the design [14,17] was published, and due to strict monitoring of patients missing data were severely limited; (2) the bottom-up costing approach—assisted by trial nurses—is more reliable for resource measurement compared to top-down costing methods [51,52]; (3) the study was performed according to the national guidelines for conducting economic evaluations [19] and guidelines for reporting [20,21]; and (4) the geographical area of the Restore4Stroke Cohort is broad, which could have a positive effect on the generalization of the study findings for the stroke population in the Netherlands.
This study has the following limitations: (1) the use of retrospective, patient-reported resource use might have led to recall bias [53]; (2) only 18% of the patients suffered from moderate or major stroke symptoms, which limits the validity of our findings for this population; and (3) the generic QoL was measured using EQ-5D-3L, which seems not to be the most optimal measure for stroke patients [29].
Currently, there is a lack of recent data regarding long-term follow-up (>18 months) of BoD studies, using a societal perspective, a prospective design, and a bottom-up costing approach for stroke survivors. Detailed information on the BoD methodology used, the population included, and the treatment given is needed to compare different study findings; it is clear that guidance is highly recommended on how to interpret and report the results of different BoD studies [54].
The data of the BoD studies are also essential for developing reliable model-based economic evaluations, which are needed to estimate the cost-effectiveness of stroke treatments with a lifelong follow-up. These models can be used by policymakers to make better-informed decisions by taking into account both the costs and effects of stroke treatments.
In addition, these studies provide policymakers with better insights into national health reforms in society. The current Dutch policy aims to stimulate the informal care of (stroke) patients, rather than reimbursing paid home care to decrease healthcare spending. This study shows that the hours spent by informal caregivers of stroke patients in the first two years are relatively high. Besides other factors such as the patient’s health-related quality of life and the severity of the stroke, the number of hours informal care received are highly associated with the risk of burnout for caregivers [55].
Finally, more research is needed to investigate the impact of older age (>75 years) on generic QoL ratings in post-stroke patients. For instance, does this group require special monitoring and help to improve their QoL after stroke?

5. Conclusions

The average total societal cost for patients two years post-stroke was almost EUR 50,000. The total healthcare cost decreased in the second year compared to the first-year post-stroke due to a decrease in the costs of inpatient care and “rehabilitation treatments” in the second year. However, the healthcare costs in the second year post-stroke could still be considered high. On the other hand, non-healthcare costs have a substantial impact on the total societal costs at 24 months. Home care, informal care, the inability to perform unpaid labor, and productivity losses are all important cost categories to consider for the long-term cost of illness studies. The severity of disease and discharge destination have an impact on total societal costs. The stroke patient scores included in the Restore4Stroke cohort reported a lower QoL than the age group norms but was stable over the first two years post-stroke. Patients over 75 years of age show a clinically meaningful decline in QoL in the first two years post-stroke, which requires further attention.

Supplementary Materials

The following supporting information can be downloaded at: https://www.mdpi.com/article/10.3390/ijerph191711110/s1, supplementary file: including Supplementary S1: Example Cost questionnaire (2 months) and Supplementary S2: table Cost prices by categories.

Author Contributions

S.E., A.V.-M. and C.v.H. were involved in funding acquisition. G.v.M. performed data curation, data analysis, and writing of the original draft of the manuscript. L.B. also performed data curation. All authors reviewed the manuscript, provided significant editing of the article, and approved the final manuscript. All authors have read and agreed to the published version of the manuscript.

Funding

This work research was funded by the VSBfund (Dutch organization for supporting Dutch society with money, knowledge and networks, PO Box 16, 3500 AA, Utrecht, The Netherlands, project number 60-61300-98-022), the Dutch Heart Foundation (PO Box 300 2501 CH Den Haag, the Netherlands) and coordinated by Zon-Mw (Dutch Organisation for Health Research and Development). The funding bodies were not involved in the design of the study, collection, analysis, interpretation of data, or writing of the manuscript.

Institutional Review Board Statement

The study was conducted following the Declaration of Helsinki, and approved by the medical ethics committees of all participating hospitals in the Restore4Stroke Cohort study.

Informed Consent Statement

Informed consent was obtained from all subjects involved in the study.

Data Availability Statement

The datasets used and/or analyzed during the current study are available from the corresponding author upon reasonable request.

Acknowledgments

We would like to thank all patients for their contribution to this study. Furthermore, we want to thank the staff of the participating Dutch hospitals, as well as all research assistants who collected the data at St. Antonius Hospital (Nieuwegein), Diakonessenhuis (Utrecht), Canisius Wilhelmina Hospital (Nijmegen), TweeSteden Hospital (Tilburg), St. Elisabeth Hospital (Tilburg) and Catharina Hospital (Eindhoven). In addition, we would like to thank Mitchel van Eeden for the data preparation of the one year’s data.

Conflicts of Interest

The authors declare no conflict of interest.

References

  1. Feigin, V.L.; Nguyen, G.; Cercy, K.; Johnson, C.O.; Alam, T.; Collaborators GBDLRoS. Global, regional, and country-specific lifetime risks of stroke, 1990 and 2016. N. Engl. J. Med. 2018, 379, 2429–2437. [Google Scholar] [CrossRef] [PubMed]
  2. Gorelick, P.B. The global burden of stroke: Persistent and disabling. Lancet Neurol. 2019, 18, 417–418. [Google Scholar] [CrossRef]
  3. Campbell, B.C.V.; Khatri, P. Stroke. Lancet 2020, 396, 129–142. [Google Scholar] [CrossRef]
  4. Ovbiagele, B.; Goldstein, L.B.; Higashida, R.T.; Howard, V.J.; Johnston, S.C.; Khavjou, O.A.; Lackland, D.T.; Lichtman, J.H.; Mohl, S.; Sacco, R.L.; et al. Forecasting the future of stroke in the United States: A policy statement from the American heart association and American stroke association. Stroke 2013, 44, 2361–2375. [Google Scholar] [CrossRef] [PubMed]
  5. Virani, S.S.; Alonso, A.; Aparicio, H.J.; Benjamin, E.J.; Bittencourt, M.S.; Callaway, C.W.; Carson, A.P.; Chamberlain, A.M.; Cheng, S.; Delling, F.N.; et al. American Heart Association council on epidemiology and prevention statistics committee and stroke statistics subcommittee. heart disease and stroke statistics-2021 update: A report from the American Heart Association. Circulation 2021, 23, e254–e743. [Google Scholar] [CrossRef]
  6. Luengo-Fernandez, R.; Violato, M.; Candio, P.; Leal, J. Economic burden of stroke across Europe: A population-based cost analysis. Eur. Stroke J. 2020, 5, 17–25. [Google Scholar] [CrossRef]
  7. Eeden, M.V.; Heugten, C.V.; Mastrigt, G.A.P.G.V.; Mierlo, M.V.; Visser-Meily, J.M.; Evers, S.M. The burden of stroke in the Netherlands: Estimating quality of life and costs for 1 year poststroke. BMJ Open 2015, 5, e008220. [Google Scholar] [CrossRef]
  8. Rajsic, S.; Gothe, H.; Borba, H.H.; Sroczynski, G.; Vujicic, J.; Toell, T.; Siebert, U. Economic burden of stroke: A systematic review on post-stroke care. Eur. J. Health Econ. 2019, 20, 107–134. [Google Scholar] [CrossRef]
  9. Carod-Artal, F.J.; Egido, J.A. Quality of life after stroke: The importance of a good recovery. Cerebrovasc. Dis. 2009, 27, 204–214. [Google Scholar] [CrossRef]
  10. Rebchuk, A.D.; O’Neill, Z.R.; Szefer, E.K.; Hill, M.D.; Field, T.S. Health utility weighting of the modified rankin scale: A systematic review and meta-analysis. JAMA Netw. Open 2020, 3, e203767. [Google Scholar] [CrossRef]
  11. Wassenius, C.; Claesson, L.; Blomstrand, C.; Jood, K.; Carlsson, G. Integrating consequences of stroke into everyday life-Experiences from a long-term perspective. Scand. J. Occup. Ther. 2022, 29, 126–138. [Google Scholar] [CrossRef]
  12. Campos, L.M.D.; Martins, B.M.; Cabral, N.L.; Franco, S.C.; Pontes-Neto, O.M.; Mazin, S.C.; Reis, F.I.D. How many patients become functionally dependent after a stroke? A 3-year population-based study in Joinville, Brazil. PLoS ONE 2017, 12, e0170204. [Google Scholar] [CrossRef] [PubMed]
  13. Eeden, M.V.; Heugten, C.M.V.; Evers, S.M. The economic impact of stroke in the Netherlands: The €-Restore4stroke study. BMC Public Health 2012, 12, 122. [Google Scholar] [CrossRef] [PubMed]
  14. Joo, H.; George, M.G.; Fang, J.; Wang, G. A literature review of indirect costs associated with stroke. J. Stroke Cerebrovasc. Dis. 2014, 23, 1753–1763. [Google Scholar] [CrossRef]
  15. Luengo-Fernandez, R.; Gray, A.M.; Rothwell, P.M. Costs of stroke using patient-level data: A critical review of the literature. Stroke 2009, 40, e18–e23. [Google Scholar] [CrossRef]
  16. Lopez-Bastida, J.; Oliva Moreno, J.; Worbes Cerezo, M.; Perestelo Perez, L.; Serrano-Aguilar, P.; Montón-Álvarez, F. Social and economic costs and health-related quality of life in stroke survivors in the Canary Islands, Spain. BMC Health Serv. Res. 2012, 12, 315. [Google Scholar] [CrossRef]
  17. Mierlo, M.L.V.; Heugten, C.M.V.; Post, M.W.M.; Lindeman, E.; Kort, P.L.M.D.; Visser-Meily, J.M.A. A longitudinal cohort study on quality of life in stroke patients and their partners: Restore4stroke cohort. Int. J. Stroke 2014, 9, 148–154. [Google Scholar] [CrossRef]
  18. Verberne, D.; Moulaert, V.; Verbunt, J.; Heugten, C.V. Factors predicting quality of life and societal participation after survival of a cardiac arrest: A prognostic longitudinal cohort study. Resuscitation 2018, 123, 51–57. [Google Scholar] [CrossRef]
  19. Zorginstituut Nederland, Guideline for Cost Research: Methodology and Reference Prices for Economic Evaluations in Healthcare (in Dutch). 2016. Available online: https://www.genesyze.com/resource_guide/zorginstitut-nederland-2016-guideline-economic-evaluations-healthcare-netherlands/ (accessed on 9 September 2019).
  20. Husereau, D.; Drummond, M.; Augustovski, F.; de Bekker-Grob, E.; Briggs, A.H.; Carswell, C.; Caulley, L.; Chaiyakunapruk, N.; Greenberg, D.; Loder, E.; et al. Consolidated health economic evaluation reporting standards 2022 (CHEERS 2022) statement: Updated reporting guidance for health economic evaluations. Value Health 2022, 1, 3–9. [Google Scholar] [CrossRef]
  21. Elm, E.V.; Altman, D.G.; Egger, M.; Pocock, S.J.; Gøtzsche, P.C.; Vandenbroucke, J.P.; STROBE Initiative. The Strengthening the reporting of observational studies in epidemiolog (STROBE) statement: Guidelines for reporting observational studies. Lancet 2014, 12, 1495–1499. [Google Scholar] [CrossRef] [Green Version]
  22. Collin, C.; Wade, D.T.; Davies, S.; Horne, V. The Barthel ADL index: A reliability study. Int. Disabil. Stud. 1988, 10, 61–63. [Google Scholar] [CrossRef] [PubMed]
  23. Meijer, R.; Limbeek, J.V.; Haan, R.D. Development of the stroke-unit discharge guideline: Choice of assessment instruments for prediction in the subacute phase post-stroke. Int. J. Rehabil. Res. 2006, 29, 1–8. [Google Scholar] [CrossRef] [PubMed]
  24. Federatie Medisch Specialisten. Herseninfarct en Hersenbloeding. Available online: https://richtlijnendatabase.nl/richtlijn/herseninfarct_en_hersenbloeding/startpagina_herseninfarct_-bloeding.html (accessed on 13 December 2019).
  25. Brooks, R. Euroqol: The current state of play. Health Policy 1996, 37, 53–72. [Google Scholar] [CrossRef]
  26. Tan, S.S.; Bouwmans-Frijters, C.; Roijen, L.H.V. Cost research guide: Methods and reference prices for economic evaluations in health care (in Dutch). Tijds. Gezondheids. Wet. 2012, 90, 367–372. [Google Scholar] [CrossRef]
  27. Medicijnkosten.nl. Available online: https://medicijnkosten.nl/ (accessed on 10 September 2019).
  28. Koopmanschap, M.A.; Rutten, F.F.; Ineveld, B.M.V.; Roijen, L.V. The friction cost method for measuring indirect costs of disease. J. Health Econ. 1995, 14, 171–189. [Google Scholar] [CrossRef]
  29. Hunger, M.; Sabariego, C.; Stollenwerk, B.; Cieza, A.; Leidl, R. Validity, reliability and responsiveness of the eq-5D in German stroke patients undergoing rehabilitation. Qual. Life Res. 2012, 21, 1205–1216. [Google Scholar] [CrossRef]
  30. Lamers, L.M.; Stalmeier, P.F.; McDonnell, J.; Krabbe, P.F.; Busschbach, J.J.V. Measuring the quality of life in economic evaluations: The Dutch eq-5D tariff. Ned. Tijdschr. Voor Geneeskd. 2005, 149, 1574–1578. [Google Scholar]
  31. Norman, G.R.; Sloan, J.A.; Wyrwich, K.W. Interpretation of changes in health-related quality of life: The remarkable universality of half a standard deviation. Med. Care 2003, 41, 582–592. [Google Scholar] [CrossRef] [PubMed]
  32. Jakobsen, J.C.; Gluud, C.; Wetterslev, J. When and how should multiple imputation be used for handling missing data in randomised clinical trials–a practical guide with flowcharts. BMC Med. Res. Methodol 2017, 17, 162. [Google Scholar] [CrossRef]
  33. Oostenbrink, J.B.; Al, M.J. The analysis of incomplete cost data due to dropout. Health Econ. 2005, 14, 763–776. [Google Scholar] [CrossRef]
  34. Dolan, P. Modeling valuations for Europol health states. Med. Care 1997, 35, 1095–1108. [Google Scholar] [CrossRef] [PubMed]
  35. Vogl, M. Improving patient-level costing in the English and German ‘DRG’ system. Health Policy 2013, 109, 290–300. [Google Scholar] [CrossRef] [PubMed]
  36. Tan, S.S.; Rutten, F.F.; Ineveld, B.M.V.; Redekop, W.K.; Roijen, L.H.V. Comparing methodologies for the cost estimation of hospital services. Eur. J. Health Econ. 2009, 10, 39–45. [Google Scholar] [CrossRef] [PubMed]
  37. Ghatnekar, O.; Persson, U.; Asplund, K.; Glader, E.L. Costs for stroke in Sweden 2009 and developments since 1997. Int. J. Technol. Assess. Health Care 2014, 30, 203–209. [Google Scholar] [CrossRef]
  38. Gloede, T.D.; Halbach, S.M.; Thrift, A.G.; Dewey, H.M.; Pfaff, H.; Cadilhac, D.A. Long-term costs of stroke using 10-year longitudinal data from the northeast Melbourne stroke incidence study. Stroke 2014, 45, 3389–3394. [Google Scholar] [CrossRef]
  39. Kolominsky-Rabas, P.L.; Heuschmann, P.U.; Marschall, D.; Emmert, M.; Baltzer, N.; Neundorfer, B.; Schoffski, O.; Krobot, K.J. Lifetime cost of ischemic stroke in Germany: Results and national projections from a population-based stroke registry: The Erlangen stroke project. Stroke 2006, 37, 1179–1183. [Google Scholar] [CrossRef]
  40. Dewey, H.M.; Thrift, A.G.; Mihalopoulos, C.; Carter, R.; Macdonell, R.A.; McNeil, J.J.; Donnan, G.A. Cost of stroke in Australia from a societal perspective: Results from the northeast Melbourne stroke incidence study (nemesis). Stroke 2001, 32, 2409–2416. [Google Scholar] [CrossRef]
  41. Payne, K.A.; Huybrechts, K.F.; Caro, J.J.; Craig Green, T.J.; Klittich, W.S. Long term cost-of-illness in stroke: An international review. Pharmacoeconomics 2002, 20, 813–825. [Google Scholar] [CrossRef]
  42. Verbakel, E. How to understand informal caregiving patterns in Europe? The role of formal long-term care provisions and family care norms. Scand. J. Public Health 2018, 46, 436–447. [Google Scholar] [CrossRef]
  43. Van Exel, J.; Koopmanschap, M.A.; Van Wijngaarden, J.D.; Reimer, W.J.S.O. Costs of stroke and stroke services: Determinants of patient costs and a comparison of costs of regular care and care organised in stroke services. Cost Eff. Resour. Alloc. 2003, 1, 2. [Google Scholar] [CrossRef]
  44. Godwin, K.M.; Wasserman, J.; Ostwald, S. Cost associated with stroke: Outpatient rehabilitative services and medication. Stroke Rehabil. 2011, 18, 676–684. [Google Scholar] [CrossRef] [PubMed]
  45. Evers, S.M.; Struijs, J.N.; Ament, A.J.; Genugten, M.L.V.; Jager, J.H.; Bos, G.A.V.D. International comparison of stroke cost studies. Stroke 2004, 35, 1209–1215. [Google Scholar] [CrossRef] [PubMed]
  46. Tengs, T.O.; Lin, T.H. A meta-analysis of quality-of-life estimates for stroke. Pharmacoeconomics 2003, 21, 191–200. [Google Scholar] [CrossRef]
  47. Haacke, C.; Althaus, A.; Spottke, A.; Siebert, U.; Back, T.; Dodel, R. Long-term outcome after stroke: Evaluating health-related quality of life using utility measurements. Stroke 2006, 37, 193–198. [Google Scholar] [CrossRef] [PubMed]
  48. Verberne, D.P.J.; Mastrigt, G.A.P.G.V.; Ponds, R.W.H.M.; Heugten, C.M.V.; Kroese, M.E.A.L. An economic evaluation of nurse-led stroke aftercare addressing long-term psychosocial outcome: A comparison to care-as-usual. BMJ Open 2021, 11, e039201. [Google Scholar] [CrossRef] [PubMed]
  49. Szende, A.; Janssen, B.; Cabases, J. Self-Reported Population Health: An International Perspective Based on EQ-5D; Springer publishing: Berlin, Germany, 2014. [Google Scholar]
  50. Joundi, R.A.; Adekanye, J.; Leung, A.A.; Ronksley, P.; Smith, E.E.; Rebchuk, A.D.; Field, T.S.; Hill, M.D.; Wilton, S.B.; Bresee, L.C. Health State Utility Values in People With Stroke: A Systematic Review and Meta-Analysis. J. Am. Heart Assoc. 2022, 11, 13. [Google Scholar] [CrossRef]
  51. Tarricone, R. Cost-of-illness analysis. What room in health economics? Health Policy 2006, 77, 51–63. [Google Scholar] [CrossRef]
  52. Lundstrom, E.; Smits, A.; Borg, J.; Terent, A. Four-fold increase in direct costs of stroke survivors with spasticity compared with stroke survivors without spasticity: The first year after the event. Stroke 2010, 41, 319–324. [Google Scholar] [CrossRef]
  53. Coughlin, S.S. Recall bias in epidemiologic studies. J. Clin. Epidemiol. 1990, 43, 87–91. [Google Scholar] [CrossRef]
  54. Larg, A.; Moss, J.R. Cost-of-illness studies: A guide to critical evaluation. Pharmacoeconomics 2011, 29, 653–671. [Google Scholar] [CrossRef]
  55. Oliva-Moreno, J.; Peña-Longobardo, L.M.; Mar, J.; Masjuan, J.; Soulard, S.; Gonzalez-Rojas, N.; Becerra, V.; Casado, M.Á.; Torres, C.; Yebenes, M.; et al. Determinants of informal care, burden, and risk of burnout in caregivers of stroke survivors: The CONOCES study. Stroke 2018, 49, 140–146. [Google Scholar] [CrossRef] [PubMed]
Figure 1. Flowchart for patient inclusion and missing data. Abbreviations: CQ—cost questionnaire; EQ-5D—three-level EuroQoL questionnaire.
Ijerph 19 11110 g001
Figure 2. (A): subgroup analyses: mean (standard deviation) costs for discharge group, home (n = 247, in blue) and rehabilitation clinics (n = 48, in red), or Nursing home (n = 49, in grey). (B): subgroup analyses: mean (standard deviation) costs per NIHSS scores, 1–4 (in blue) and >5 (in red). NIHSS—National Institutes of Health Stroke Scale.
Ijerph 19 11110 g002
Table 1. Baseline patients’ characteristics (n = 344).
NMean (SD) or %
Age (in years)34466.7 (12.2%)
Gender344
Female12135.2%
Male22364.8%
Marital status344
Living together24069.8%
No relationship10430.2%
Education341
Low25073.3%
High9126.7%
Stroke type343
Ischaemic stroke31992.7%
Hemorrhagic stroke/Infarction stroke247.0%
Severity of stroke (NIHSS)344
No stroke symptoms (NIHSS 0)8424.4%
Minor stroke symptoms (NIHSS 1–4)19757.3%
Moderate stroke symptoms (NIHSS 5–12)5816.8%
Moderate to severe stroke symptoms (NIHSS ≥ 13)51.5%
Residence after discharge344
Home24771.7%
Rehabilitation center4814.0%
Geriatric rehabilitation4914.2%
SD—standard deviation; NIHSS—National Institutes of Health Stroke Scale.
Table 2. Total resource use and costs (bootstrapped) in the first two years post-stroke (n = 344).
UsersResource Use Per PatientCosts Per Patient
UnitN%MeanSDMeanSDMedian
Healthcare costs
General practitionerContact33296.513.716.79€481€34€478
SpecialistContact33597.411.29.45€1335€65€1333
Allied health professionalsContact26978.232.246.33€1105€93€1104
Mental healthcare professionalsContact12536.31.95.93€197€35€195
Rehabilitation treatmentsDay26175.929.941.31€8664€673€8645
HospitalNight30789.210.211.39€6864€448€6851
Rehabilitation clinicNight13037.813.029.66€6301€822€6279
Nursing homeNight9427.35.936.40€1038€351€1012
Psychiatric clinicNight6117.70.43.67€133€69€127
MedicationVarious----€1119€53€1118
Total healthcare costs €27,159€1611€27,174
Non-healthcare costs
Paid home careHours15344.5185.7569.81€3979€695€3925
Informal careHours23869.2291.5598.66€4320€512€4298
Inability to perform unpaid laborDay21662.869.0130.96€8284€895€8241
Productivity
Losses *
Day4111.922.076.01€3810€406€3791
Total non-healthcare costs €20,330€1603€20,302
Total societal costs €47,502€2628€47,384
SD—standard deviation, * estimated by the friction cost method.
Table 3. Resource use and costs (bootstrapped) for the first year and the second year post-stroke (n = 344).
Unit0–12 Months Post-Stroke12–24 Months Post-StrokeDifference
Per PatientResource UseCostResource UseCost
MeanSDMeanSDMedianMeanSDMeanSDMedianMean (95% CI) *
Healthcare Costs
GPContact6.95.00€237€9.68€2366.915.60€247€32€243€10 (−€44, €87)
SpecialistContact8.16.73€946€44.67€9473.25.11€391€37€389−€556 (−€667, −€437)
Allied HPContact21.228.03€718€55.13€71711.027.38€386€56€385−€332 (−€487, −€181)
Mental HPContact1.34.12€136€23.92€1350.63.15€61€19€59−€75 (−€138, −€15)
Rehabilitation treatmentsDay22.929.86€6582€480.22€65957.023.49€2064€387€2050−€4518 (−€5,768, −€3226)
HospitalNight8.48.68€5601€336.73€55871.86.74€1241€272€1233−€4360 (−€5233, −€3494)
Rehabilitation clinicNight10.925.68€5205€713.72€51642.115.31€1089€455€1033−€4116 (−€5761, −€2478)
Nursing homeNight4.018.91€711€195.33€6921.920.16€346€208€334−€365 (−€879, €210)
Psychiatric clinicNight0.10.70€28€12.41€260.33.54€102€65€98€74 (−€14, €236)
MedicationVarious--€531€23.77€531--€536€38€533€5 (−€80, €96)
Total healthcare costs€20,709€1282€20,639--€6431€846€6406−€14,277 (−€17,319 −€11,236)
Paid home careHours97.4349.47€2056€430€202388.3385.73€1878€459€1836−€178 (−€1431, €1042)
Informal careHours159.7359.73€2323€290€2304131.8423.28€1996€378€1970−€326 (−€1228, €660)
Inability to perform unpaid laborDay27.450.98€3186€347€318041.7106.17€5068€744€5081€1882 (€327, €3478)
Productivity
Losses *
Day22.076.01€3819€389€3807--000−€3819 (−€4558, −€3065)
Total non-healthcare costs€11,336€817€11,324 €8910€1078€8874−€2426 (−€5079, €246)
Total societal costs €32,085€1743€31,984 €15,383€1526€15,372−€16,703 (−€21,243, −€12,039)
Abbreviations: GP—general practitioner, HP—healthcare professionals, SD—standard deviation, NA—Not applicable, 95%CI—95% confidence interval. * estimated by the friction cost method. All significant differences are highlighted in red.
Table 4. EQ-5D-3L dimensions and Dutch utilities at 12 months and 24 months post-stroke (n = 344).
N12 Months Post-Stroke24 Months Post-Stroke
Dimensions EuroQoL mean (SD)mean (SD)Mean difference * (95%CI)
Mobility3441.54 (0.59)1.60 (0.58)0.06 (−0.03, 0.15)
Self-care3441.23 (0.52)1.30 (0.59)0.07 (−0.02, 0.16)
Usual activities3441.67 (0.70)1.63 (0.69)−0.04 (−0.15, 0.07)
Pain/discomfort3441.56 (0.59)1.64 (0.64)0.08 (−0.02, 0.17)
Anxiety/depression3441.38 (0.57)1.45 (0.62)0.06 (−0.03, 0.16)
Average utility score3440.7400 (0.2662)0.7094 (0.3153)−0.03 (−0.08, 0.01)
Utility score EuroQoL: Age
<651460.7611 (0.2546)0.7688 (0.2667)0.01 (−0.05, 0.07)
65–75990.7023 (0.3060)0.7277 (0.2894)0.03 (−0.06, 0.10)
>75990.7467 (0.2378)0.6036 (0.37714)−0.14 (−0.23, −0.05)
Utility score EuroQoL: Gender
Male2230.7497 (0.2619)0.7290 (0.3182)−0.02 (−0.07, 0.03)
Female1210.7222 (0.2744)0.6734 (0.3080)−0.05 (−0.12,0.02)
Utility score EuroQoL: Severity of stroke
No stroke symptoms (NIHSS 0)840.7305 (0.2782)0.7076 (0.3414)0.02 (−0.07, 0.11)
Minor stroke symptoms (NIHSS 1–4)1970.7352 (0.2519)0.7280 (0.2892)−0.01 (−0.06, 0.04)
Moderate stroke symptoms (NIHSS 5–12)580.7713 (0.2918)0.6501 (0.3550)−0.12 (−0.23, 0.01)
Moderate to severe stroke symptoms (NIHSS ≥ 13)50.7302 (0.3668)0.6973 (0.37659)−0.03 (−0.42, 0.38)
* Bootstrapped mean difference, 95%CI: 95% confidence interval, NIHSS—National Institutes of Health Stroke Scale. All significant differences are highlighted in red.
Table 5. Sensitivity and Subgroup analyses.
Sensitivity Analyses CostsBase Case *Sensitivity Analyses
CostsMean Total Costs (€)SDMean Total Costs (€)SDMean Difference95% CI
Method extrapolation costs(18–24M)*2)/
(6–12M) + (18–24M)
€42,378€2225€46,282€2597€3904(€−2751, €11,146)
Perspective(Societal/Healthcare)€42,506€2389€27,125€1620€−15,382(€−21,244, €−9785)
Sensitivity analyses Quality of lifeUtilitySDUtilitySDMean difference95% CI
Average utility 12MDutch/UK0.71100.01850.66040.0215−0.0506(−0.1104, 0.0081)
Average utility 24MDutch/UK0.74130.01560.67690.0192−0.0644(−0.1122, −0.0167)
Subgroup analysis of quality of life12 months post-stroke24 months post-stroke
CharacteristicsGroupMean difference (utility)95% CIMean difference (utility)95% CI
GenderMale/Female−0.0277(−0.0883, 0.0301)−0.0559(−0.1262, 0.0111)
Age65+/65−−0.0361(−0.0932, 0.0193)0.1030(0.0395, 0.1664)
Stroke typeInfarction/Haemorrhage−0.1245(−0.2638, 0.0058)0.0557(−0.0459, 0.1388)
Recurrent strokeYes/No−0.0048(−0.0941, 0.0913)0.0502(−0.0610, 0.1699)
EducationHigh/Low0.0198(−0.0473, 0.0910)0.0118(−0.0722, 0.0901)
Home DischargeYes/No−0.0292(−0.0960, 0.0351)−0.1030(−0.1796, 0.0298)
Stroke severity0–4/>50.0343(−0.0426, 0.1100)−0.0695(−0.1666, 0.0147)
Subgroup analysis costs0-12 months post-stroke12-24 months post-stroke0-24 months post-stroke
CharacteristicGroupMean difference
(€)
95% CIMean difference
(€)
95% CIMean difference
(€)
95% CI
GenderMale/Female−€1280(−€7583, €5729)€3897(−€1620, €9587)€2352(−€5555, €10,872)
Age65+/65−−€3148(−€9339, €2894)€4435(−€945, €9583)€2224(−€6147, €10,050)
Stroke typeInfarction/Haemorrhage€3323(−€10,441, €18,298)€2806(−€9427, €18,949)€7114(−€13,288, €31,104)
Recurrent strokeYes/No€4631(−€3222, €11,567)€5596(−€2933, €14,694)−€814(−€11,490, €11,589)
EducationHigh/Low€2870(−€4068, €9835)€3276(−€2029, €8888)€5311(−€4122, €14,389)
Home DischargeYes/No€38,535(€31,117, €45,654)€9347(€2602, €16,283)€46,503(€36,877, €56,409)
Stroke severity0–4/>5€29,971(€19,768, €40,477)€11,545(€2993, €20,705)€40,144(€26,561, €54,317)
* Base case analysis uses the original cost exploration method, it uses the societal perspective to calculate total costs and calculates utilities with a Dutch tariff. Sensitivity analyses use another extrapolation method to calculate the costs for the second year post-stroke, estimates of total healthcare costs and utilities are calculated with a UK tariff. All significant differences are highlighted in red. Abbreviations: M—months, SD—standard deviation, UK—United Kingdom, and 95%CI—confidence interval, Stroke severity—National Institutes of Health Stroke Scale.
Publisher’s Note: MDPI stays neutral with regard to jurisdictional claims in published maps and institutional affiliations.

