Article

Multivariate Statistics, Mineralogy, and Radiological Hazards Assessment Due to the Natural Radioactivity Content in Pyroclastic Products from Mt. Etna, Sicily, Southern Italy

by
Francesco Caridi
1,*,
Sebastiano Ettore Spoto
1,
Antonio Francesco Mottese
1,
Giuseppe Paladini
1,*,
Vincenza Crupi
1,
Alberto Belvedere
2,
Santina Marguccio
2,
Maurizio D’Agostino
2,
Giuliana Faggio
3,*,
Rossella Grillo
3,
Giacomo Messina
3,
Francesco Barreca
1,
Valentina Venuti
1,* and
Domenico Majolino
1
1
Dipartimento di Scienze Matematiche e Informatiche, Scienze Fisiche e Scienze della Terra, Università degli Studi di Messina, V.le F. Stagno D’Alcontres 31, 98166 Messina, Italy
2
Agenzia Regionale per la Protezione dell’Ambiente della Calabria (ARPACal)—Dipartimento di Reggio Calabria, Via Troncovito SNC, 89135 Reggio Calabria, Italy
3
Dipartimento di Ingegneria dell’Informazione, delle Infrastrutture e dell’Energia Sostenibile (DIIES), Università “Mediterranea”, Loc. Feo di Vito, 89122 Reggio Calabria, Italy
*
Authors to whom correspondence should be addressed.
Int. J. Environ. Res. Public Health 2022, 19(17), 11040; https://doi.org/10.3390/ijerph191711040
Submission received: 19 July 2022 / Revised: 22 August 2022 / Accepted: 31 August 2022 / Published: 3 September 2022
(This article belongs to the Special Issue Radioecology: The Fate of Radionuclides)

Abstract

:
In this article, an investigation of the natural radioactivity content of pyroclastic products from Mt. Etna, eastern Sicily, Southern Italy, was carried out. In particular, the assessment of the average activity concentration of the investigated radionuclides, related to the mineralogical phase composition of the analyzed samples, and the radiological health risk for the population, was performed. High Purity Germanium (HPGe) gamma-ray spectrometry was employed in order to quantify the average specific activity of 226Ra, 232Th, and 40K natural radioisotopes. The absorbed gamma dose rate (D), the radium equivalent activity (Raeq), the hazard indices (Hin and Hex), the annual effective dose equivalent outdoor (AEDEout), and the excess lifetime cancer risk (ELCR) were also estimated in order to assess any possible radiological hazard for the population. In our case, they were found to be lower than the maximum recommended values for the population members, thus reasonably excluding radiological hazard effects. Moreover, the identification of the source of the aforementioned naturally occurring radionuclides was attempted by X-ray Diffraction (XRD) and Micro-Raman Scattering (MRS), thereby recognizing the main radioisotope-bearing minerals present in the investigated pyroclastic products. Finally, Pearson correlation, Principal Component Analysis (PCA), and Hierarchical Cluster Analysis (HCA) were performed by processing observed radioactivity and radiological parameters in order to determine their correlation with the sampling locations.

1. Introduction

Natural radionuclides from the Earth’s crust and cosmic rays and artificial radioisotopes from nuclear tests and nuclear power plant accidents are always present in the environment and represent significant sources of radiation exposure for humans [1]. Natural radionuclides mainly consist of uranium (238U and 235U) and thorium (232Th) decay chains products and 40K, which are primordial and vary in concentrations according to local geological formations [2,3]. Their importance lies in the fact that their annual effective dose rate outdoors accounts for more than half of the radiation exposure to which the public is exposed [4,5]. Therefore, the activity concentrations of radionuclides in environmental matrices are significant for determining background radiation levels in order to evaluate the effects of radiation exposure for human beings [6].
In particular, pyroclastic products, mixtures of rock, mineral, and glass particles expelled during a volcanic eruption, are natural pozzolanic materials available in many volcanic areas [7]. They are considered as natural resources for the production of low-cost and environmentally friendly building materials with acceptable strength and durability characteristics, which can contribute to sustainable development [8,9]. In particular, the partial replacement of Portland cement by pyroclastic products in mortars and concrete, when available, may lead to a cheaper solution [10]. Moreover, in countries with active volcanoes, such as Southern Italy, pyroclastic products could be used to supply nutrients and reduce CO2 from the atmosphere [11].
Mt. Etna (eastern Sicily, Southern Italy) is an active volcano built up during the last 540,000 years by the alternate superimposition of lava flows and pyroclastic deposits [12], and its edifice grew over a sedimentary substratum whose thickness is greater than 1.5 km [13]. The source of Mt. Etna’s magmatism is presumably connected with voluminous mantle melting, likely resulting from the suction of asthenosphere material induced by the backward rolling of the subducting Ionian crustal slab [14,15].
In this study, a multidisciplinary approach was developed with the aim of evaluating the natural radioactivity content of pyroclastic products coming from Mt. Etna [16] and sampled in a surrounding area and assessing any possible radiological hazard for the population due to the external exposure to ionizing radiations. In particular, several analytical techniques such as High Purity Germanium (HPGe) gamma-ray spectrometry, X-ray Diffraction (XRD), and Micro-Raman Scattering (MRS) were employed to estimate the radioactivity contents of the investigated samples and to relate them to the mineralogical composition of the investigated pyroclastic products. Moreover, calculations of the absorbed gamma dose rate (D), radium equivalent activity (Raeq), hazard indices (Hin and Hex), annual effective dose equivalent outdoors (AEDEout), and excess lifetime cancer risk (ELCR) were performed in order to assess any possible radiological health risk for the population [17]. This appears to be a crucial task since, on one side, as widely reported in the literature [18], long-term exposure to uranium and thorium has several health effects, such as chronic lung diseases, acute leucopenia, anemia, and necrosis of the mouth. On the other side, radium exposure can cause bone, cranial, and nasal tumors, whereas thorium exposure can be responsible for lung, pancreas, hepatic, bone, and kidney cancers and leukemia. Finally, in order to analyze the radioactivity and radiological parameters in the pyroclastic product samples, multivariate statistical analyses, i.e., Pearson correlation, Principal Component Analysis (PCA), and Hierarchical Cluster Analysis (HCA), were conducted to find out the possible link between the investigated variables [19,20].

2. Materials and Methods

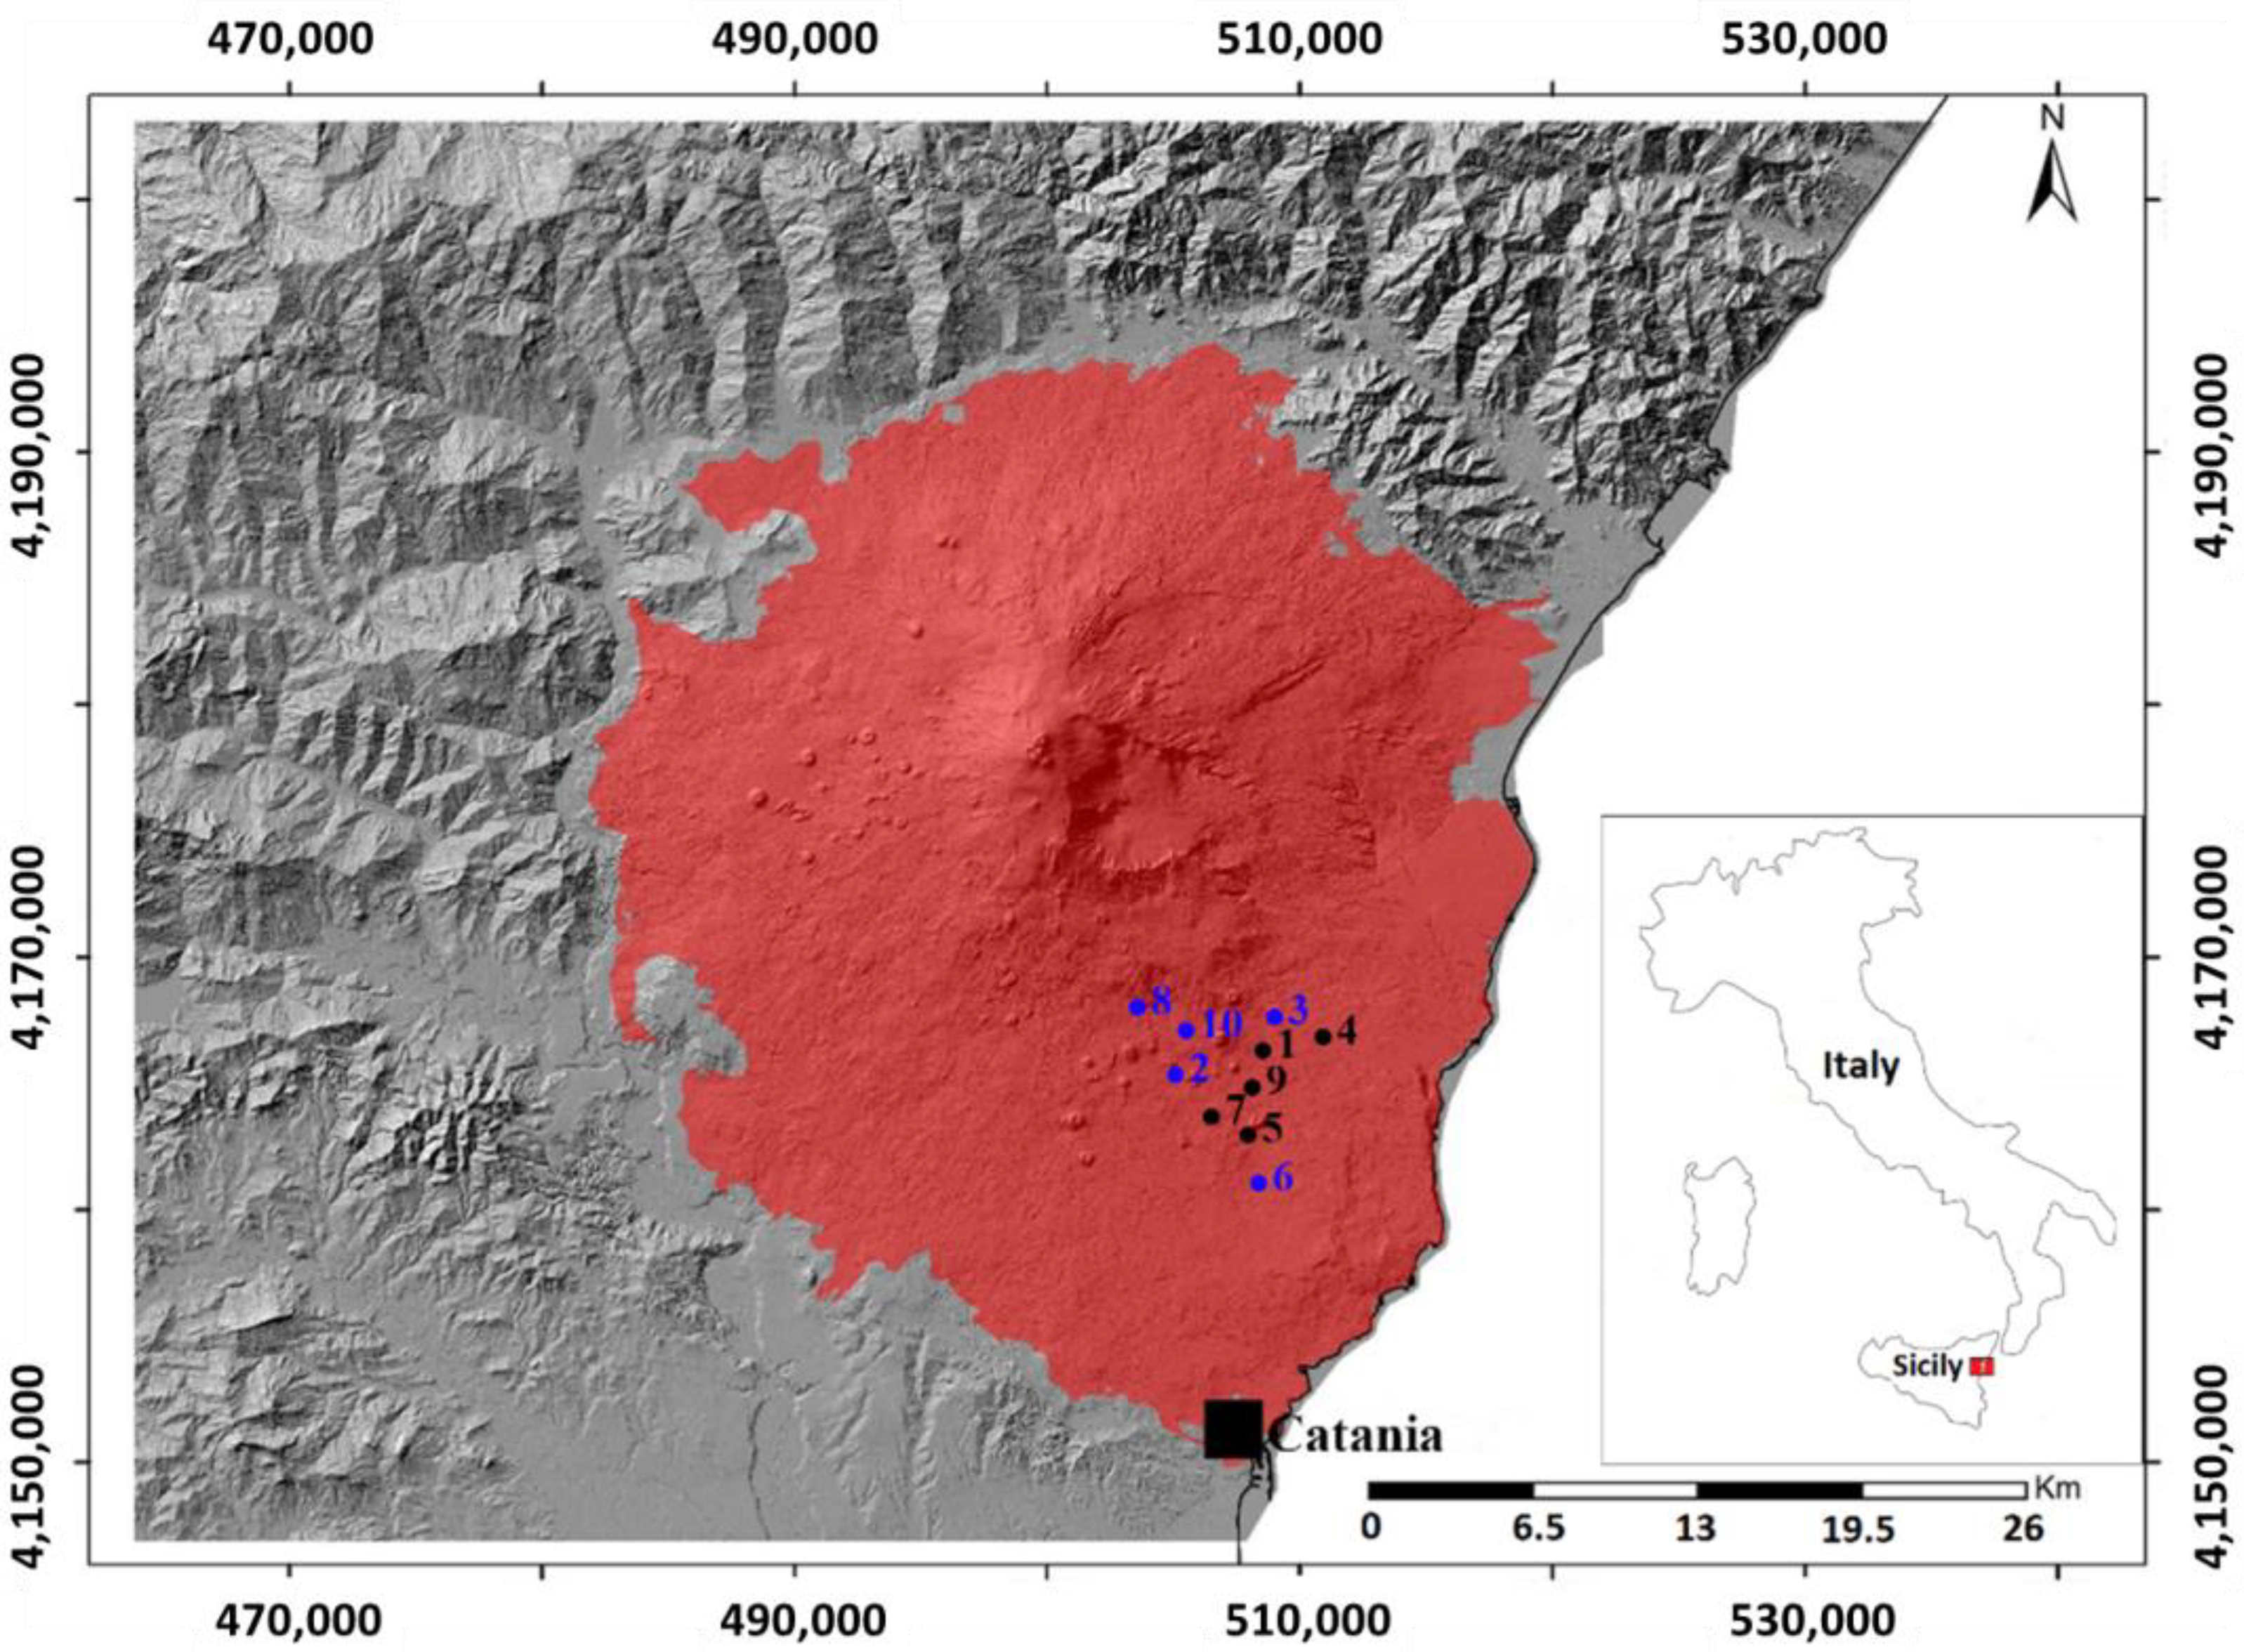
2.1. Geological Notes and Sampling

Mt. Etna is one of the most active basaltic stratovolcanoes in the world, where the combination of lava flow with explosive phases takes place [21]. Its structure is constituted by several nested strato-volcanoes [15] that, together with other coeval small eruptive centers, grew on a lava plateau of tholeiitic/transitional composition produced by fissural eruptions [22]. The post-plateau volcanic products, emitted through almost continuous eruptive activity, show a composition ranging from picritic and alkali basalt to trachytes, with mugearites and hawaiites as dominant products [23].
Explosive eruptions of magma, which may last from a few days to several weeks, produce ejected pyroclastic products that fall out over the volcano flanks, disrupting transport systems, contaminating the air, and damaging buildings and infrastructures, having a considerable effect on urban communities living close to the volcano and being potentially hazardous to human health [24]. Despite the abundance of pyroclastic products, they are considered a waste material according to the existing laws, thus limiting their use as construction materials [25]. The distribution of pyroclastic products depends on the initial particle size of the fragments, the height of the eruption column, the rate and duration of the eruption, the prevailing wind conditions, the slope and the roughness of the surface upon which the ash is deposited [26,27].
In this scenario, fifty samples of pyroclastic products, around 500 g each, were collected in ten selected sites (ID#, # = 1, …, 10), five samples for each site, of an area surrounding the Mt. Etna volcano (see Table 1 and Figure 1), for subsequent laboratory measurements.
Pyroclastic products were collected during the activity of Mt. Etna that occurred on 21 February 2022. The samples, with sizes ranging from lapilli to ash, were collected according to the protocol for analysis of volcanic ash samples for assessment of hazards from leachable elements [28]. In particular, the sampling was performed from a relatively flat, clean, dry, hard surface, avoiding locations where other surface dust or salts are likely to have accumulated. After the collection, pyroclastic products were stored in clear plastic bags and subsequently transported to the laboratory, avoiding long periods of storage before analysis in order to reduce the impacts of ongoing surface acid reactions with volcanic glass. In five of the selected sites (IDs 1, 4, 5, 7, and 9), freshly erupted air-fall pyroclastic products were collected at the same time or shortly after deposition. In the remaining sites (IDs 2, 3, 6, 8, and 10), samples from heaps of pyroclastic wastes from previous volcanic activities were collected according to the protocol mentioned above [28]. During the sampling of the freshly erupted products, special attention was taken to prevent contact with water either during deposition or after the sampling. Particular precautions were also taken to avoid the contamination of the freshly erupted products with other natural or anthropic particulates.

2.2. HPGE Gamma Spectrometry Measurements

For the gamma spectrometry analysis, pyroclastic products were dried until moisture was completely removed, and constant mass was attained. After that, they were inserted into Marinelli hermetically sealed containers of 250 mL capacity in order to be homogeneously distributed around the detector. After 40 days, the secular radioactive equilibrium between 226Ra and its daughter products was reached, and the samples were ready for gamma spectrometry counting.
In order to reduce the statistical uncertainty, the samples were counted for 70,000 s, and the spectra were analyzed in order to obtain the specific activity of 226Ra, 232Th, and 40K. In particular, the 226Ra activity concentration was calculated by using the 295.21 keV and 351.92 keV 214Pb and 1120.29 keV 214Bi gamma-ray lines, and the 232Th specific activity was determined by using the 911.21 keV and 968.97 keV 228Ac γ-ray lines. Finally, for 40K, the evaluation was performed from its γ-line at 1460.8 keV.
The experimental set-up was composed of a negative-biased Ortec HPGe detector (GMX), whose operating parameters are reported in Table 2 [29].
The detector was placed inside lead wells to shield the background radiation environment, and a multi-peak Marinelli geometry gamma source (BC-4464) of 250 mL capacity, covering the energy range 60 keV–1836 keV and customized to reproduce the exact geometries of samples in a water-equivalent epoxy resin matrix, was employed for the energy and efficiency calibrations according to the procedure reported in [30].
The activity concentration (Bq kg−1 dry weight, d.w.) of the investigated radionuclides was calculated using the following formula [31]:
C = N E ε E t γ d M  
where NE indicates the net area of a peak at energy E, εE and γd are the efficiency and yield of the photopeak at energy E, respectively, M is the mass of the sample (kg), and t is the live time (s) [32].
The accuracy and repeatability of the results were certified by the Italian Accreditation Body (ACCREDIA) [33].

2.3. Assessment of Radiological Hazard Effects

Several radiological parameters, such as the absorbed gamma dose rate (D), the radium equivalent activity (Raeq), the hazard indices (Hin and Hex), the annual effective dose equivalent outdoor (AEDEout), and the excess lifetime cancer risk (ELCR), were calculated in order to evaluate the potential radiological hazards and assess the radiation risk to humans.

2.3.1. Absorbed Gamma Dose Rate

The absorbed gamma dose rate calculation is the first major step to evaluate the health risk [34]. This index was calculated as follows [35]:
D (nGy h−1) = 0.462CRa + 0.604CTh + 0.0417CK
where CRa, CTh, and CK are the mean activity concentrations of 226Ra, 232Th, and 40K in the pyroclastic products, respectively.

2.3.2. Radium Equivalent Activity

In order to estimate the gamma radiation dose due to activity concentrations of 226Ra, 232Th, and 40K in the pyroclastic products when used as components of building construction, the radium equivalent activity is regularly utilized. It is an index that describes the activities of 226Ra, 232Th, and 40K in a single activity term [36]:
Raeq (Bq kg−1) = CRa + 1.43CTh + 0.077CK
with CRa, CTh, and CK as the activity concentrations of 226Ra, 232Th, and 40K, respectively. This index is evaluated with conditions that 1 Bq kg−1 of 226Ra or 1.43 Bq kg−1 of 232Th or 0.077 Bq kg−1 of 40K produce an equal gamma dose rate [37].

2.3.3. Hazard Indices

In order to limit the radiation dose to 1 mSv y−1, two indices (external and internal radiation hazards) were defined [38]. The internal hazard index (Hin) gives the internal exposure to carcinogenic radon and its short-lived progeny, and it is given by the following formula:
Hin = (CRa/185 + CTh/259 + CK/4810) ≤ 1
where CRa, CTh, and CK are the mean activity concentrations of 226Ra, 232Th, and 40K, respectively. The external hazard index (Hex) was calculated using the given equation:
Hex = (CRa/370 + CTh/259 + CK/4810) ≤ 1
Both indices must not exceed the limit of unity for the radiation hazard to be negligible.

2.3.4. The Annual Effective Dose Equivalent Outdoor

The estimated annual effective dose equivalent outdoor received by an individual was calculated using the following equation with an outdoor occupancy of 20% [39]:
AEDEout (mSv y−1) = D (nGy h−1) × 8760 h × 0.7 Sv Gy−1 × 0.2 × 10−6

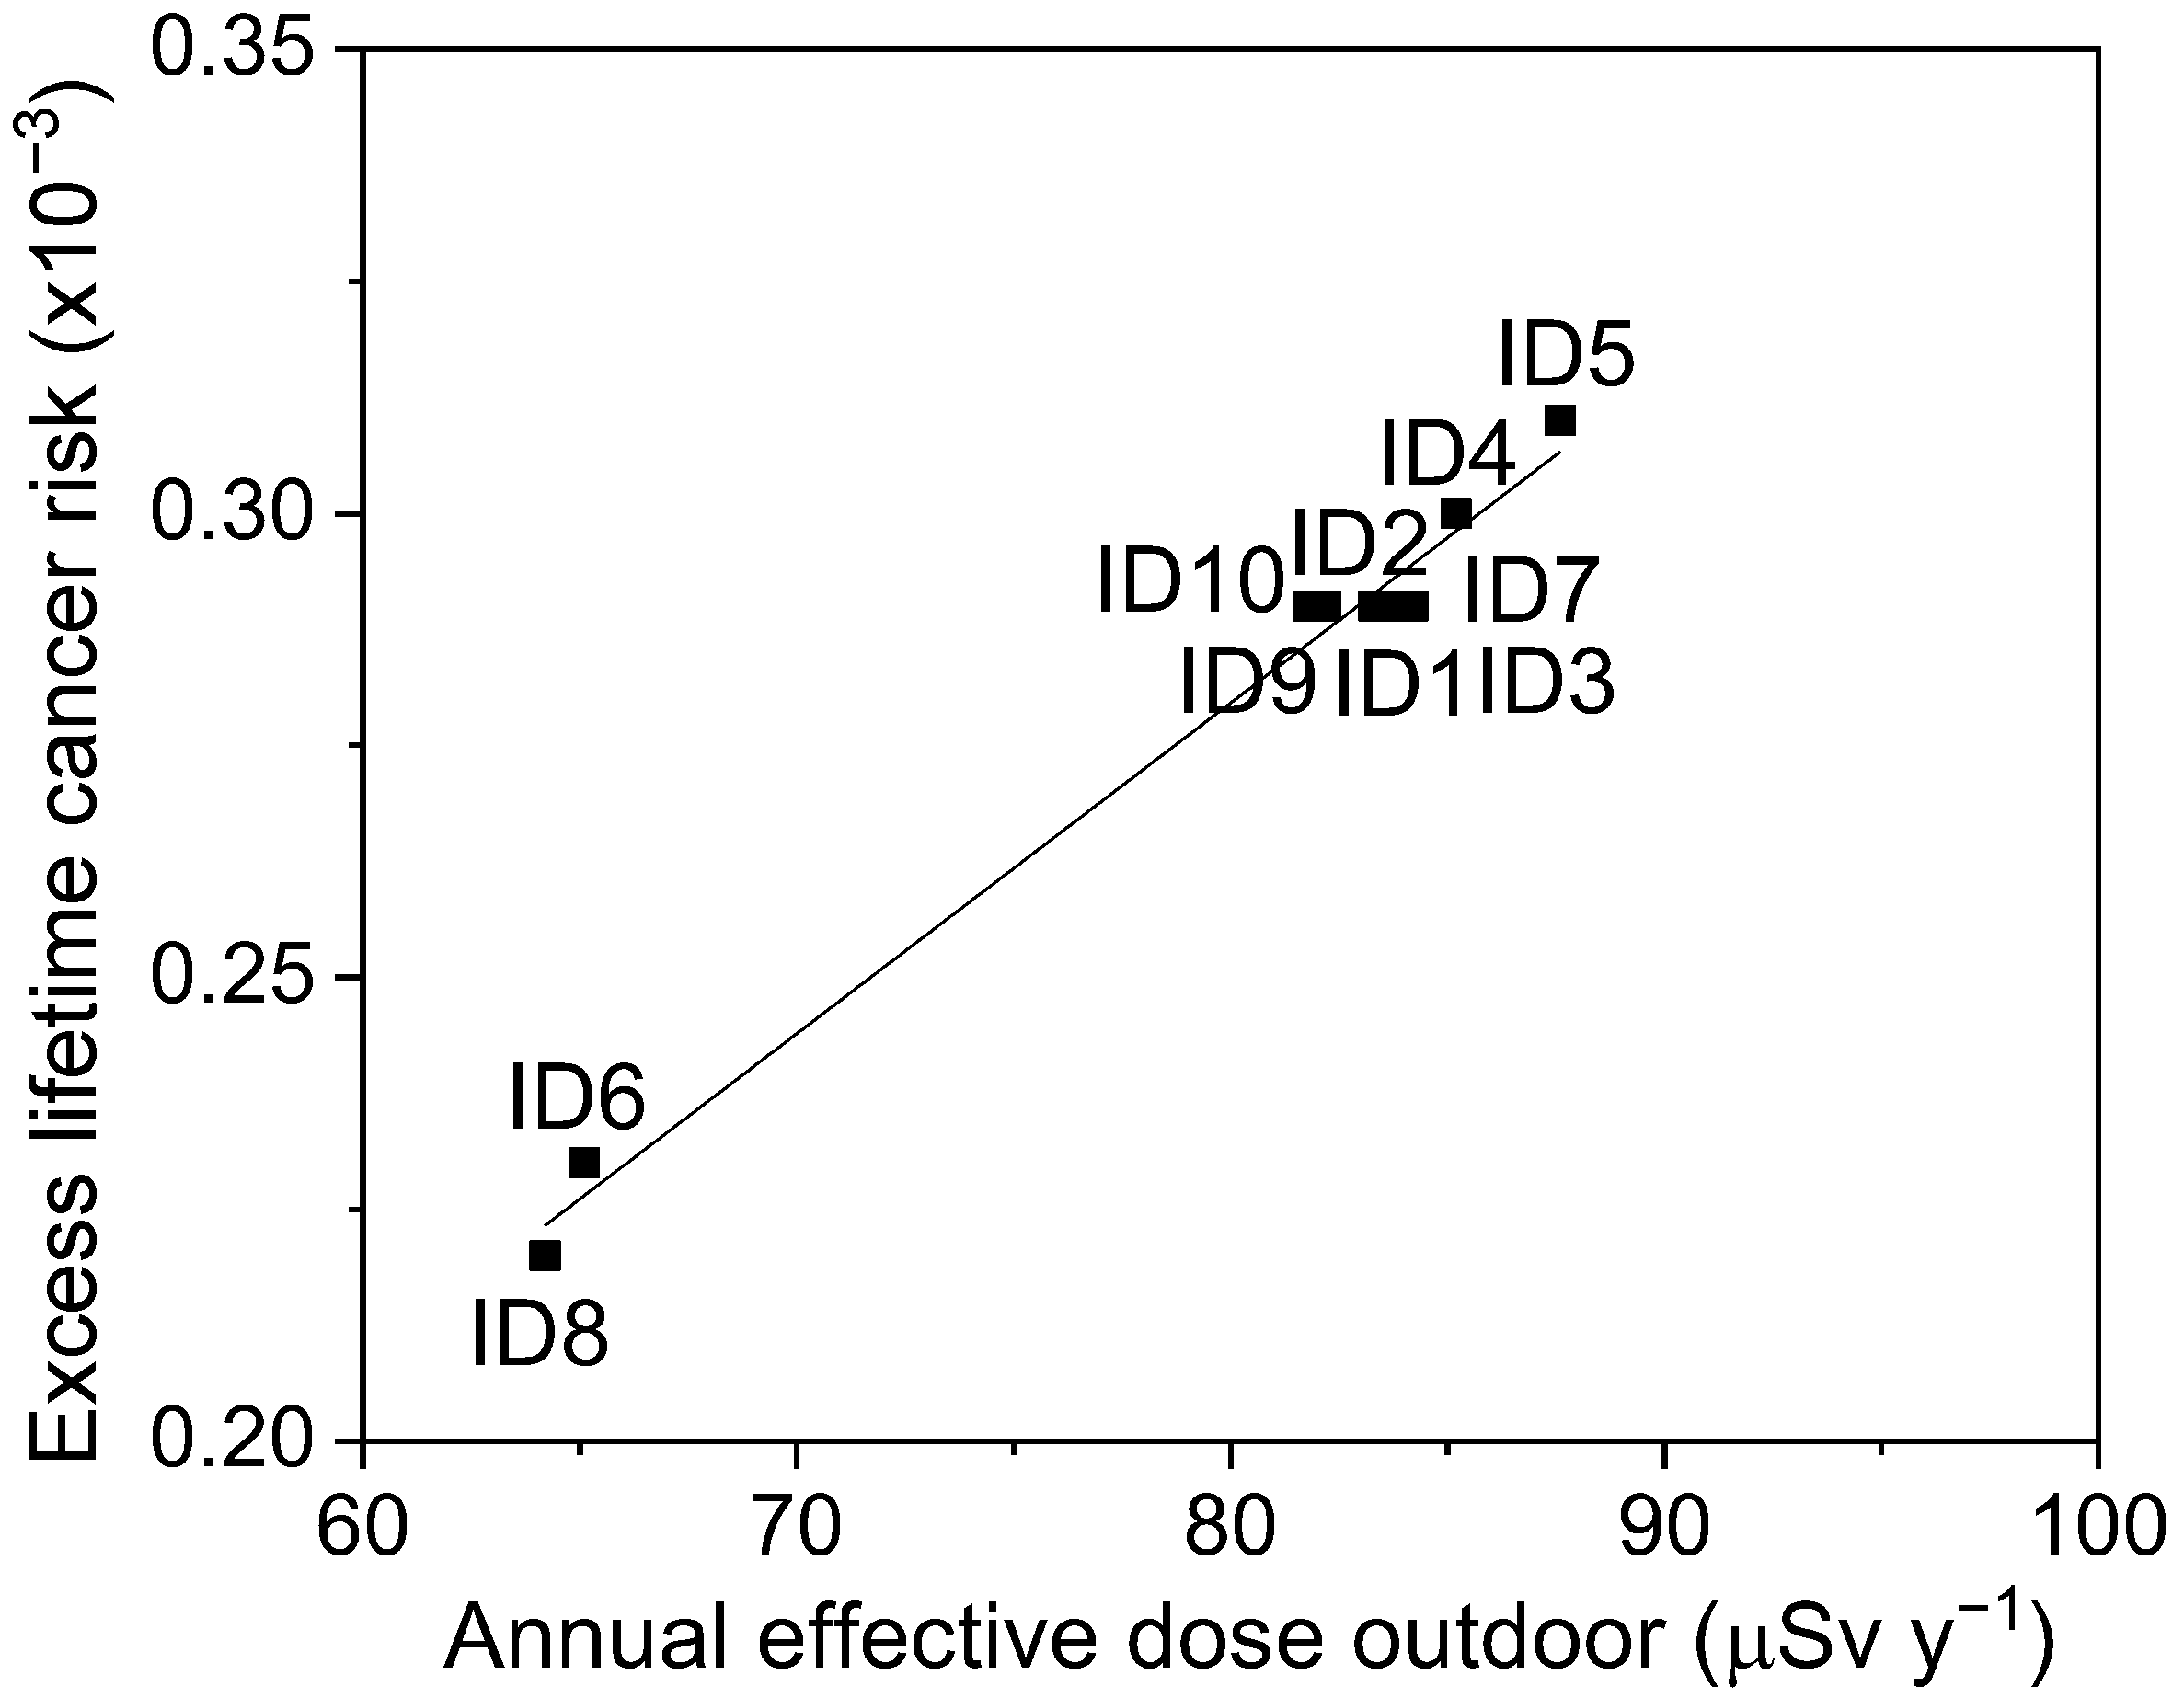
2.3.5. Excess Lifetime Cancer Risk

The Excess lifetime cancer risk (ELCR) index expresses the probability of developing cancer over a lifetime at a given exposure level. It represents the number of extra cancers expected in a given population as a consequence of exposure to a carcinogen at a given dose and is given by [40]:
ELCR = AEDEout × DL × RF
where AEDEout is the annual effective dose equivalent outdoors, DL is the average duration of life (estimated to be 70 years), and RF is the risk factor (Sv−1), i.e., fatal cancer risk per Sievert [41]. For stochastic effects, International Commission on Radiological Protection (ICRP) recommends, for this last parameter, a value of 0.05 for the public [41].

2.4. Statistical Treatments

Chemometric approaches were conducted using a dedicated statistical software known as XLSTAT (Addinsoft, New York, NY, USA) [42].
In particular, the Principal Component Analysis (PCA) elaboration was run in order to develop an exploratory method useful to reduce the data dimensionality, investigate the correlation degrees among the original variables (Pearson correlation analysis), and identify the principal components (PCs) able to explain the highest values of the sample variability [43]. In order to verify the suitability of the data for factor analysis, the measure of sampling adequacy and Bartlett’s Test of Sphericity were carried out. Both tests’ results (Kaiser–Meyer–Olkin value of 0.722 and chi-square value equal to 37.520 with a statistical significance at p < 0.0001) suggested that the correlation matrix was factored and appropriate for Principal Components Analysis. Moreover, the Hierarchical Clusters Analysis (HCA) was also employed to reduce the number of observations, coherently with the Ward’s algorithm, which regroups the samples based on the extent of dissimilarity among them in terms of Euclidian distance [44]. In our case, each group was formed by the samples that show comparable values in terms of radiological parameters and radionuclides activities [45].

2.5. XRD Analysis

X-ray diffraction analyses were performed by using a Panalytical Empyrean Diffractometer with Cu Kα radiation on a Bragg–Brentano theta–theta goniometer equipped with a solid-state detector, PIXcel [46].
The generator operating parameters were 40 kV and 40 mA. For the measurements, glass slide holders were employed. The 2Θ incidence angle was 5–60°, with a scan speed of 1.2° per minute (continuous scan mode). The total runtime for each analysis was about 45 min.
In order to identify the crystalline mineral components of the investigated samples, COD and RRUFF databases were employed [47].

2.6. MRS Analysis

Micro-Raman Scattering (MRS) analyses were performed by using a portable “BTR 111 Mini-RamTM” spectrometer (λ = 785 nm, Pmax = 280 mW at the excitation port, CCD detector (thermoelectric cooled, TE)) [48,49]. The 65 cm−1–3153 cm−1 spectral range was investigated, with a resolution of 10 cm−1, and an acquisition time of 10 s × 32 scans. The peak at 520.6 cm−1 of a silicon chip was used for calibration before each measurement. The system was equipped with a BAC151B Raman microscope. An 80×\40× objective was used, with a working distance of 1.25 mm\3.98 mm and laser beam spot size of 26 µm\50 µm. The maximum power at the samples was ~ 15 mW. Punctual analyses were performed on small sample quantities (about 2 mg). Due to the micrometric size of the grains, a microscopic approach was mandatory in order to select by visual inspection the grains of suspected interest and to that guarantee a good S/N ratio. For each sample, we collected 15–20 spectra from different grains.
For a reliable assignment of the bands, the spectra were compared with the literature [50,51].

3. Results and Discussion

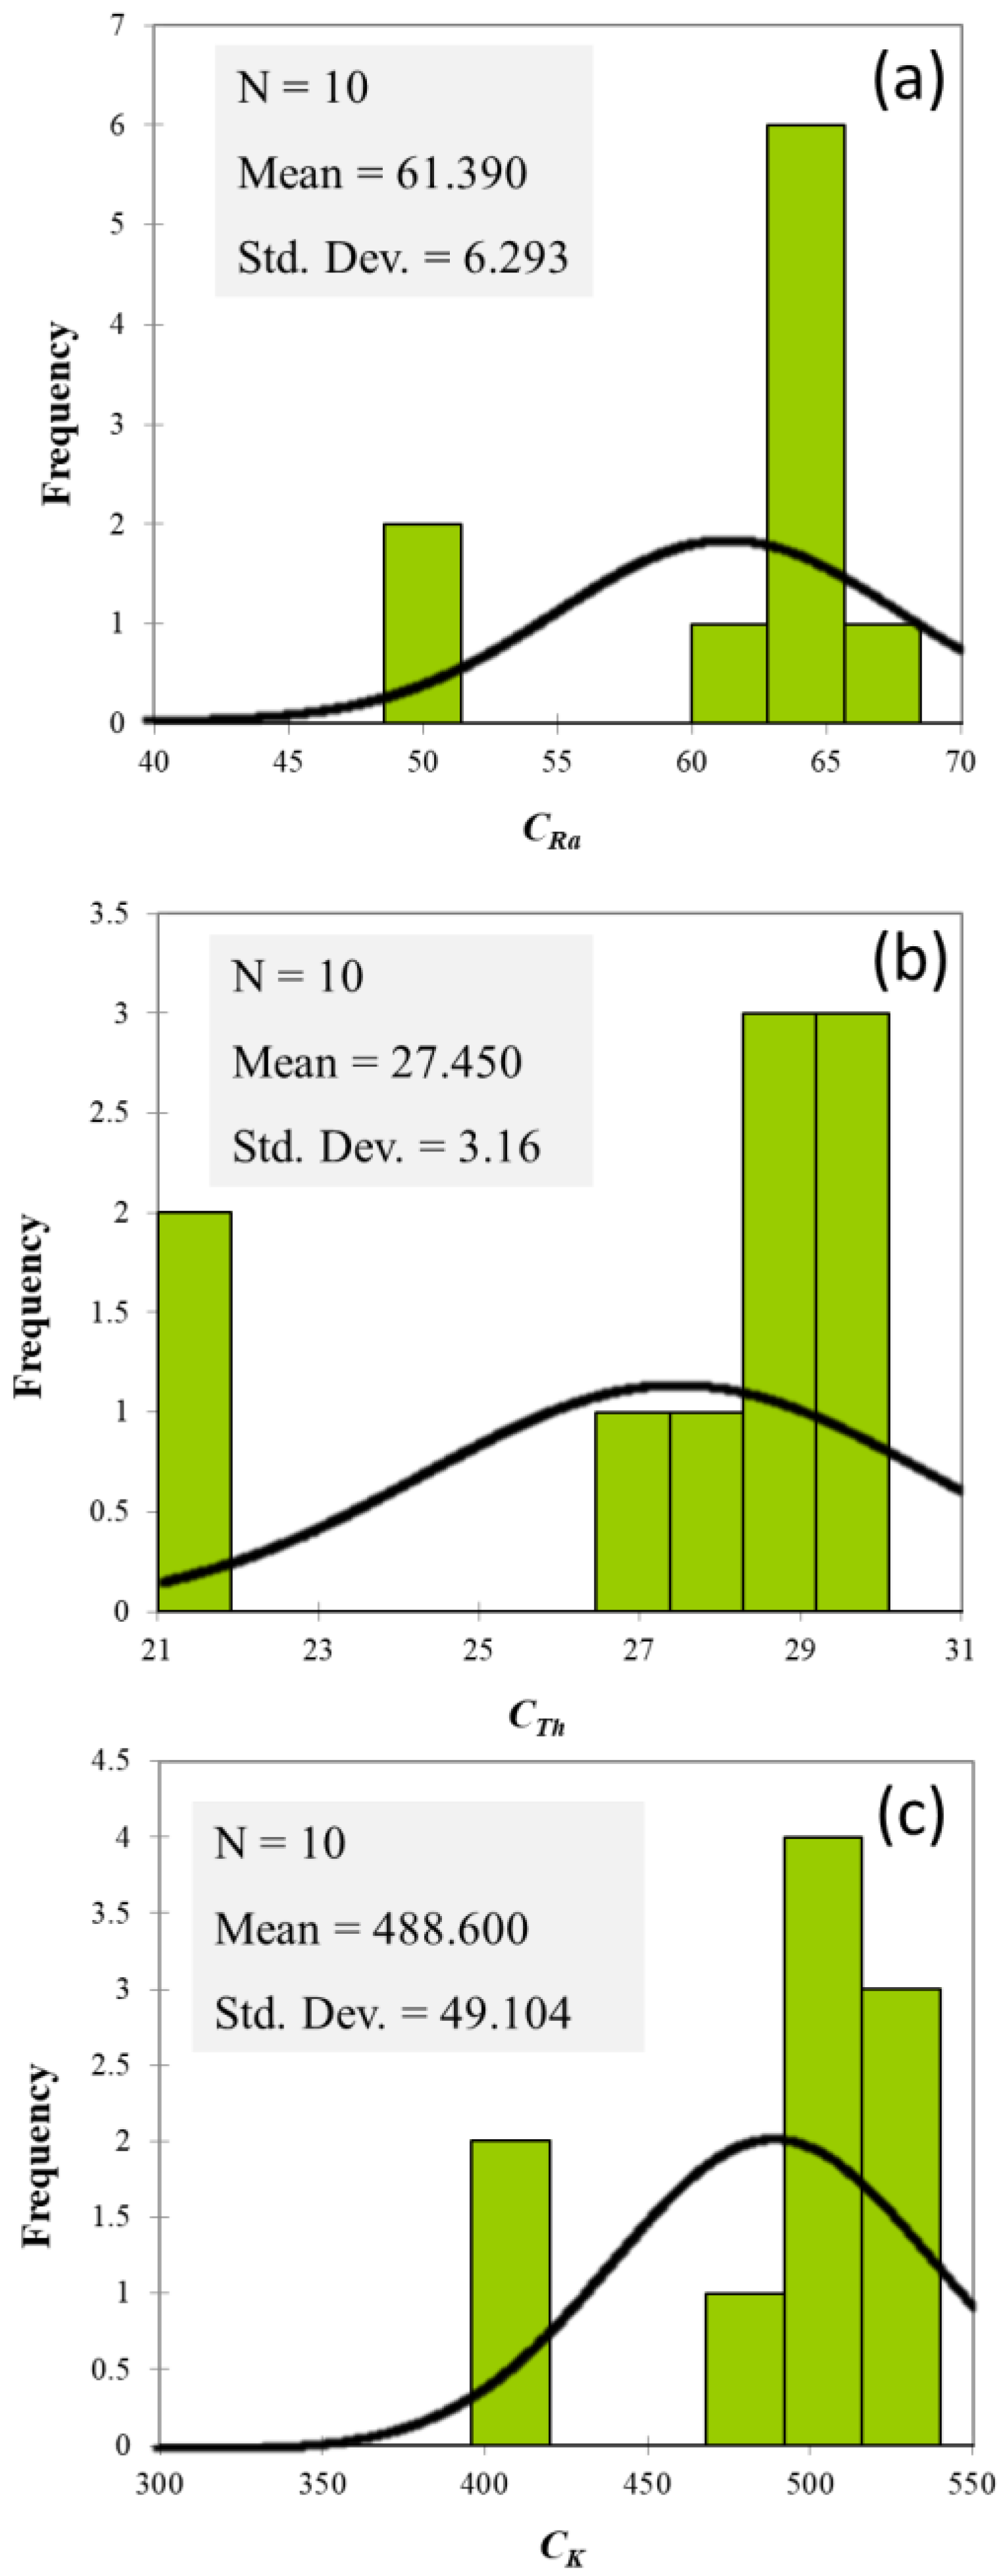
3.1. The Activity Concentration of the Radionuclides

The average activity concentrations of detected radionuclides, 226Ra, 232Th, and 40K, in the investigated pyroclastic products, are reported in Table 3.
Moreover, some important statistical information (min, max, mean, geometric mean, median, standard deviation, skewness, and kurtosis) of the previous dataset, which is the basic statistic information useful to describe the dataset distribution, is reported in Table 4.
The analysis of natural radionuclide-specific activities was also finalized to build up a model of frequency distributions, as demonstrated by dedicated graphical interfaces (Figure 2).
The highest values of 226Ra (67.5 ± 7.5 Bq Kg−1 d.w.), 232Th (30.0 ± 4.3 Bq Kg−1 d.w.), and 40K (530 ± 61 Bq Kg−1 d.w.) specific activities were detected in the pyroclastic products collected in the Site ID5.
From a statistical point of view, the obtained values of skewness indicate an asymmetric distribution, whereas the kurtosis coefficients confirm how the empirical distribution of 226Ra, 232Th, and 40K, in agreement with the null kurtosis value, can be considered as normal.
Worthy of note, the value of CRa was higher than the mean value (61.390) in 80% of the samples, whereas in 70% of the pyroclastic products, the 232Th and 40K specific activities exceed the corresponding average values.

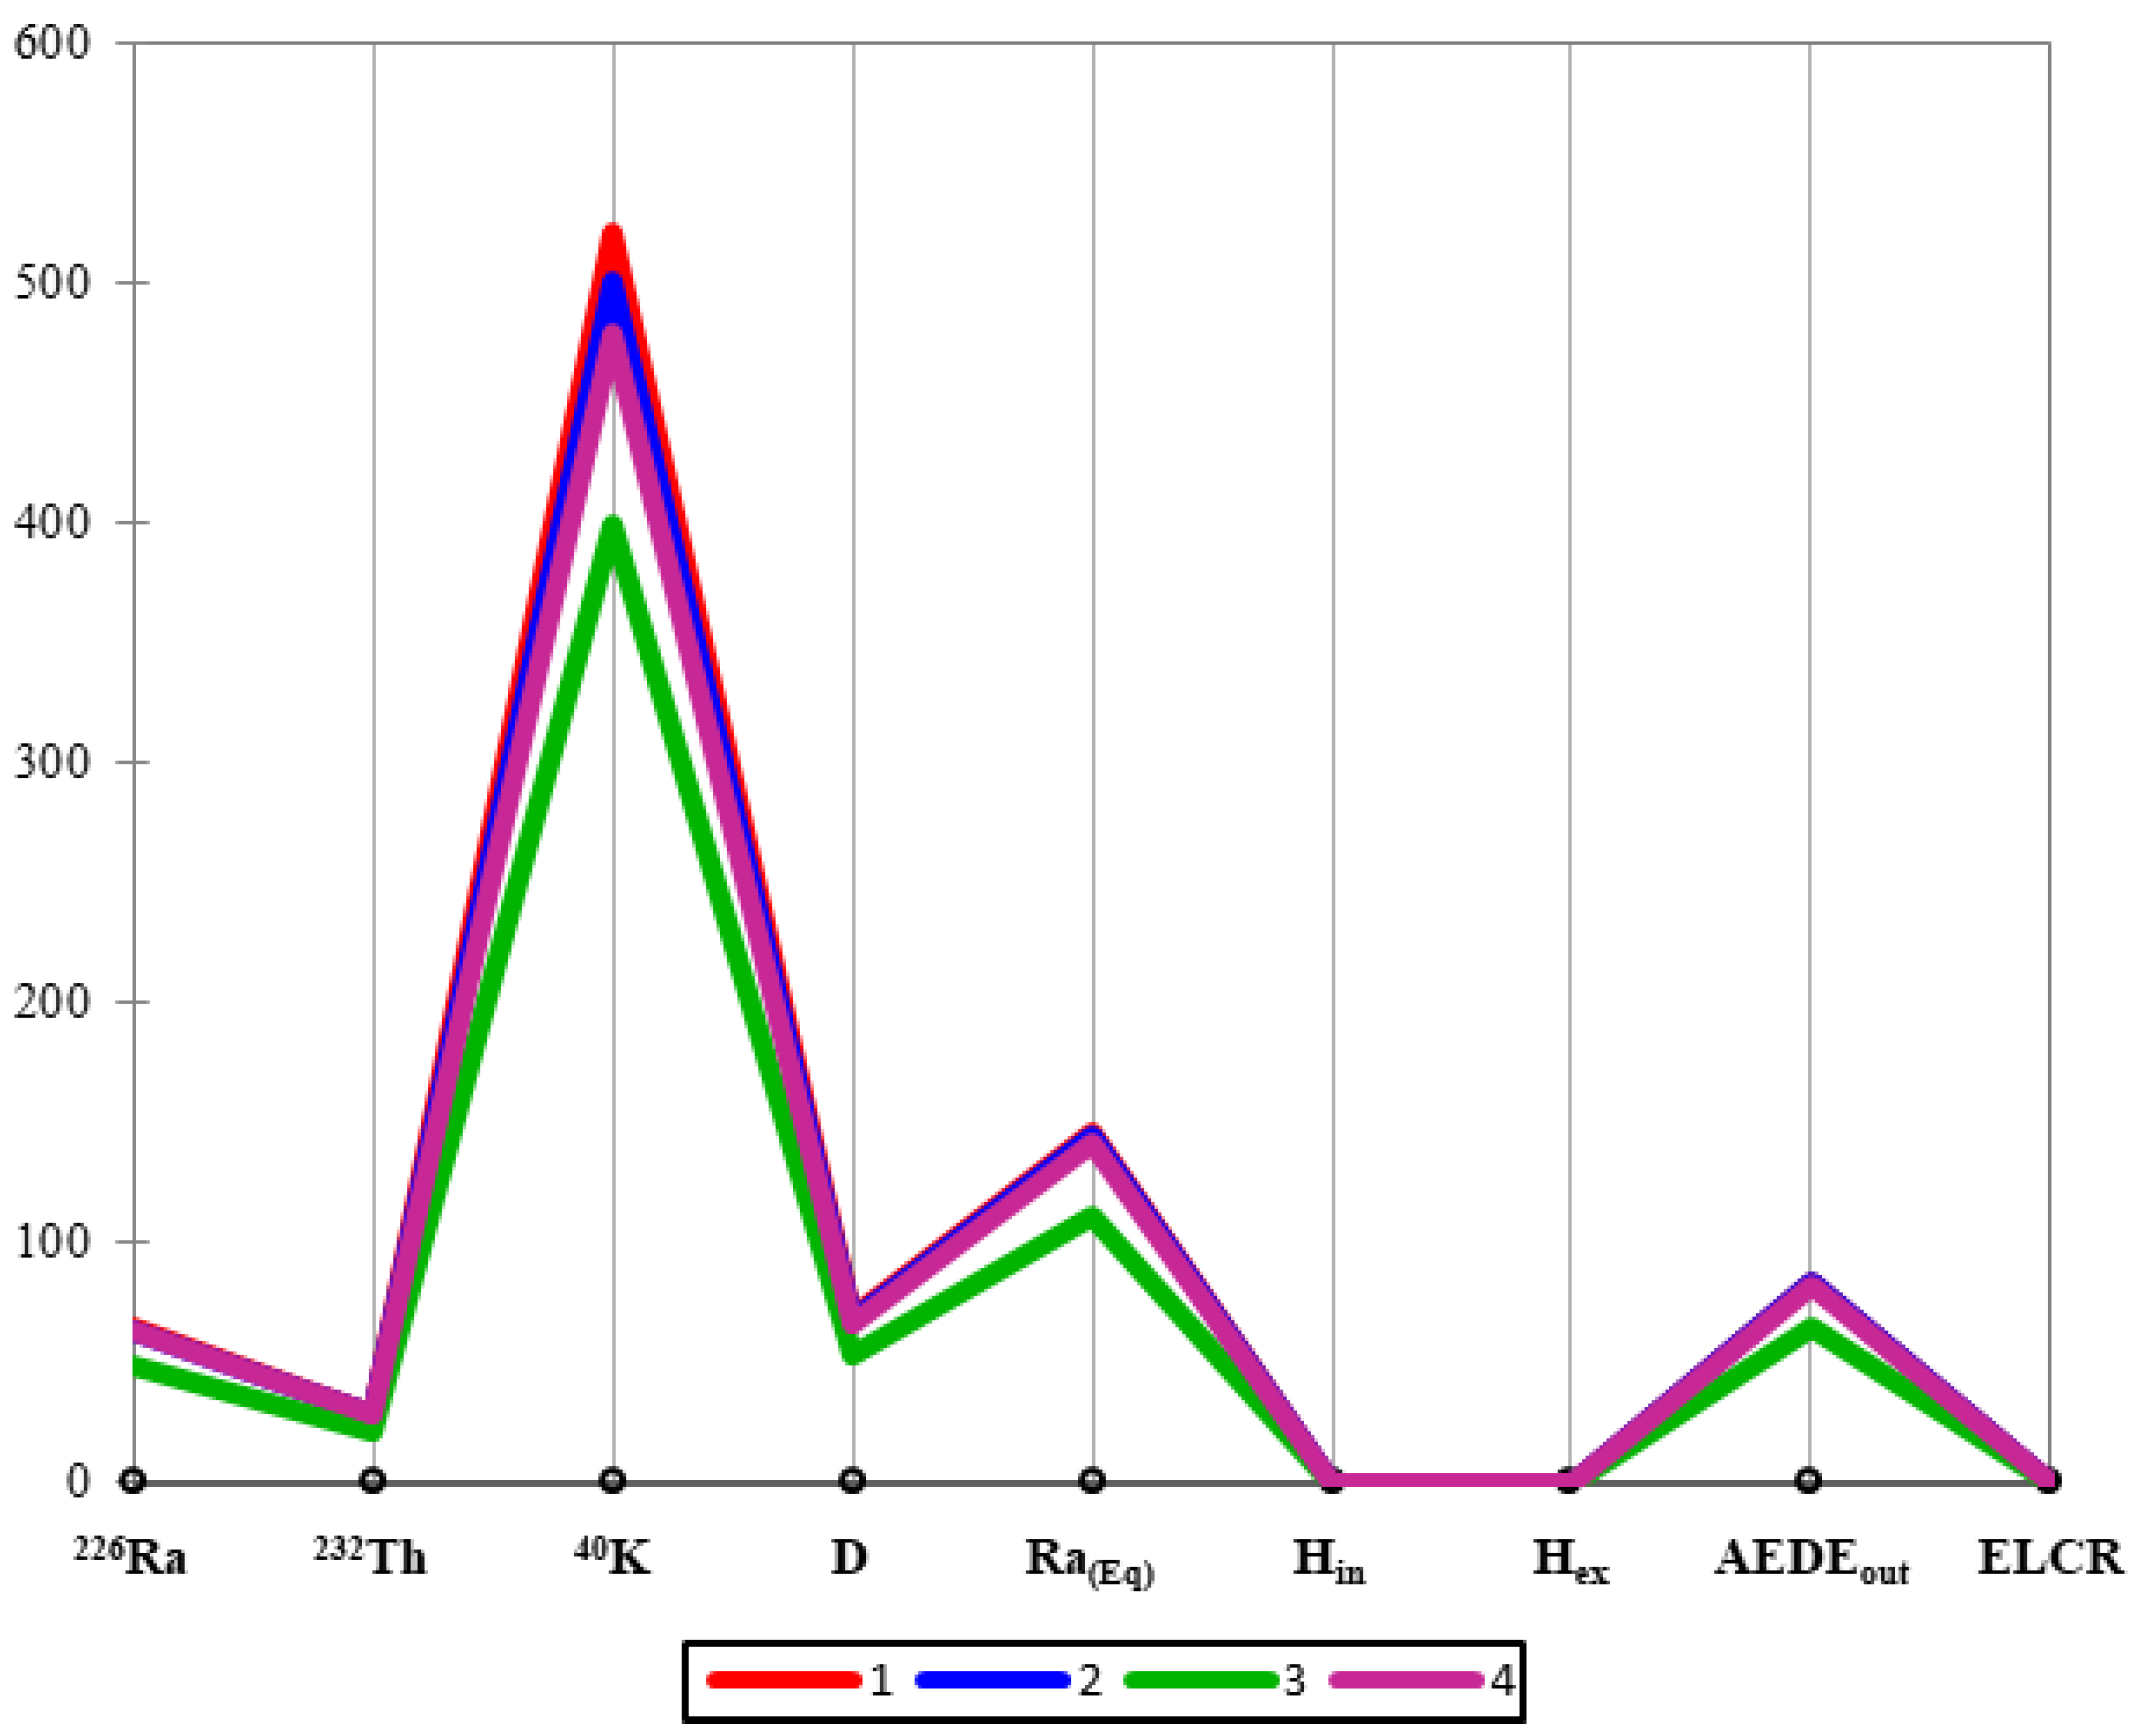
3.2. Dose Assessment and Hazard Indices

Table 5 reports the calculated values of the absorbed gamma dose rate together with the radiological hazard indices. The absorbed dose rate was estimated using Equation (2) and values range from 52.4 nGy h−1 to 71.4 nGy h−1, with an average value of 65.3 nGy h−1. The variability of the absorbed doses is attributable to the different lithologic components of the considered areas [52].
The radium equivalent activity (Raeq) was calculated using Equation (3), giving values from 111 Bq kg−1 to 151 Bq kg−1, with an average value of 138 Bq kg−1, lower than 370 Bq kg−1, set as the threshold limit for building materials [53]. This indicates that the investigated samples may not be hazardous if used in the field of civil construction. The minimum value of Raeq was obtained for the pyroclastic products coming from the site, ID8, while the maximum one characterizes the samples collected at the site, ID5.
Going on, the internal and external hazard indices, given by Equations (4) and (5), are lower than unity in all cases, thus excluding radiological health risks.
Equation (6) was used to evaluate the annual effective dose equivalent outdoors due to the activities of 226Ra, 232Th, and 40K in the analyzed samples. The obtained values range from 64.2 µSv y−1 to 87.6 µSv y−1, with an average value of 80.2 µSv y−1, lower than 1 mSv y−1, which is set as the maximum limit by [54]. Worthy of note, a linear relationship between ELCR, as calculated by Equation (7), and the annual effective dose equivalent outdoor is found, as shown in Figure 3, is in good agreement with the literature [55]. It is important to underline that the evaluation of the radiological health hazards for the population, only on the basis of the calculated excess lifetime cancer risk, is not possible, since reliable and standardized mortality and morbidity statistics are not accessible.

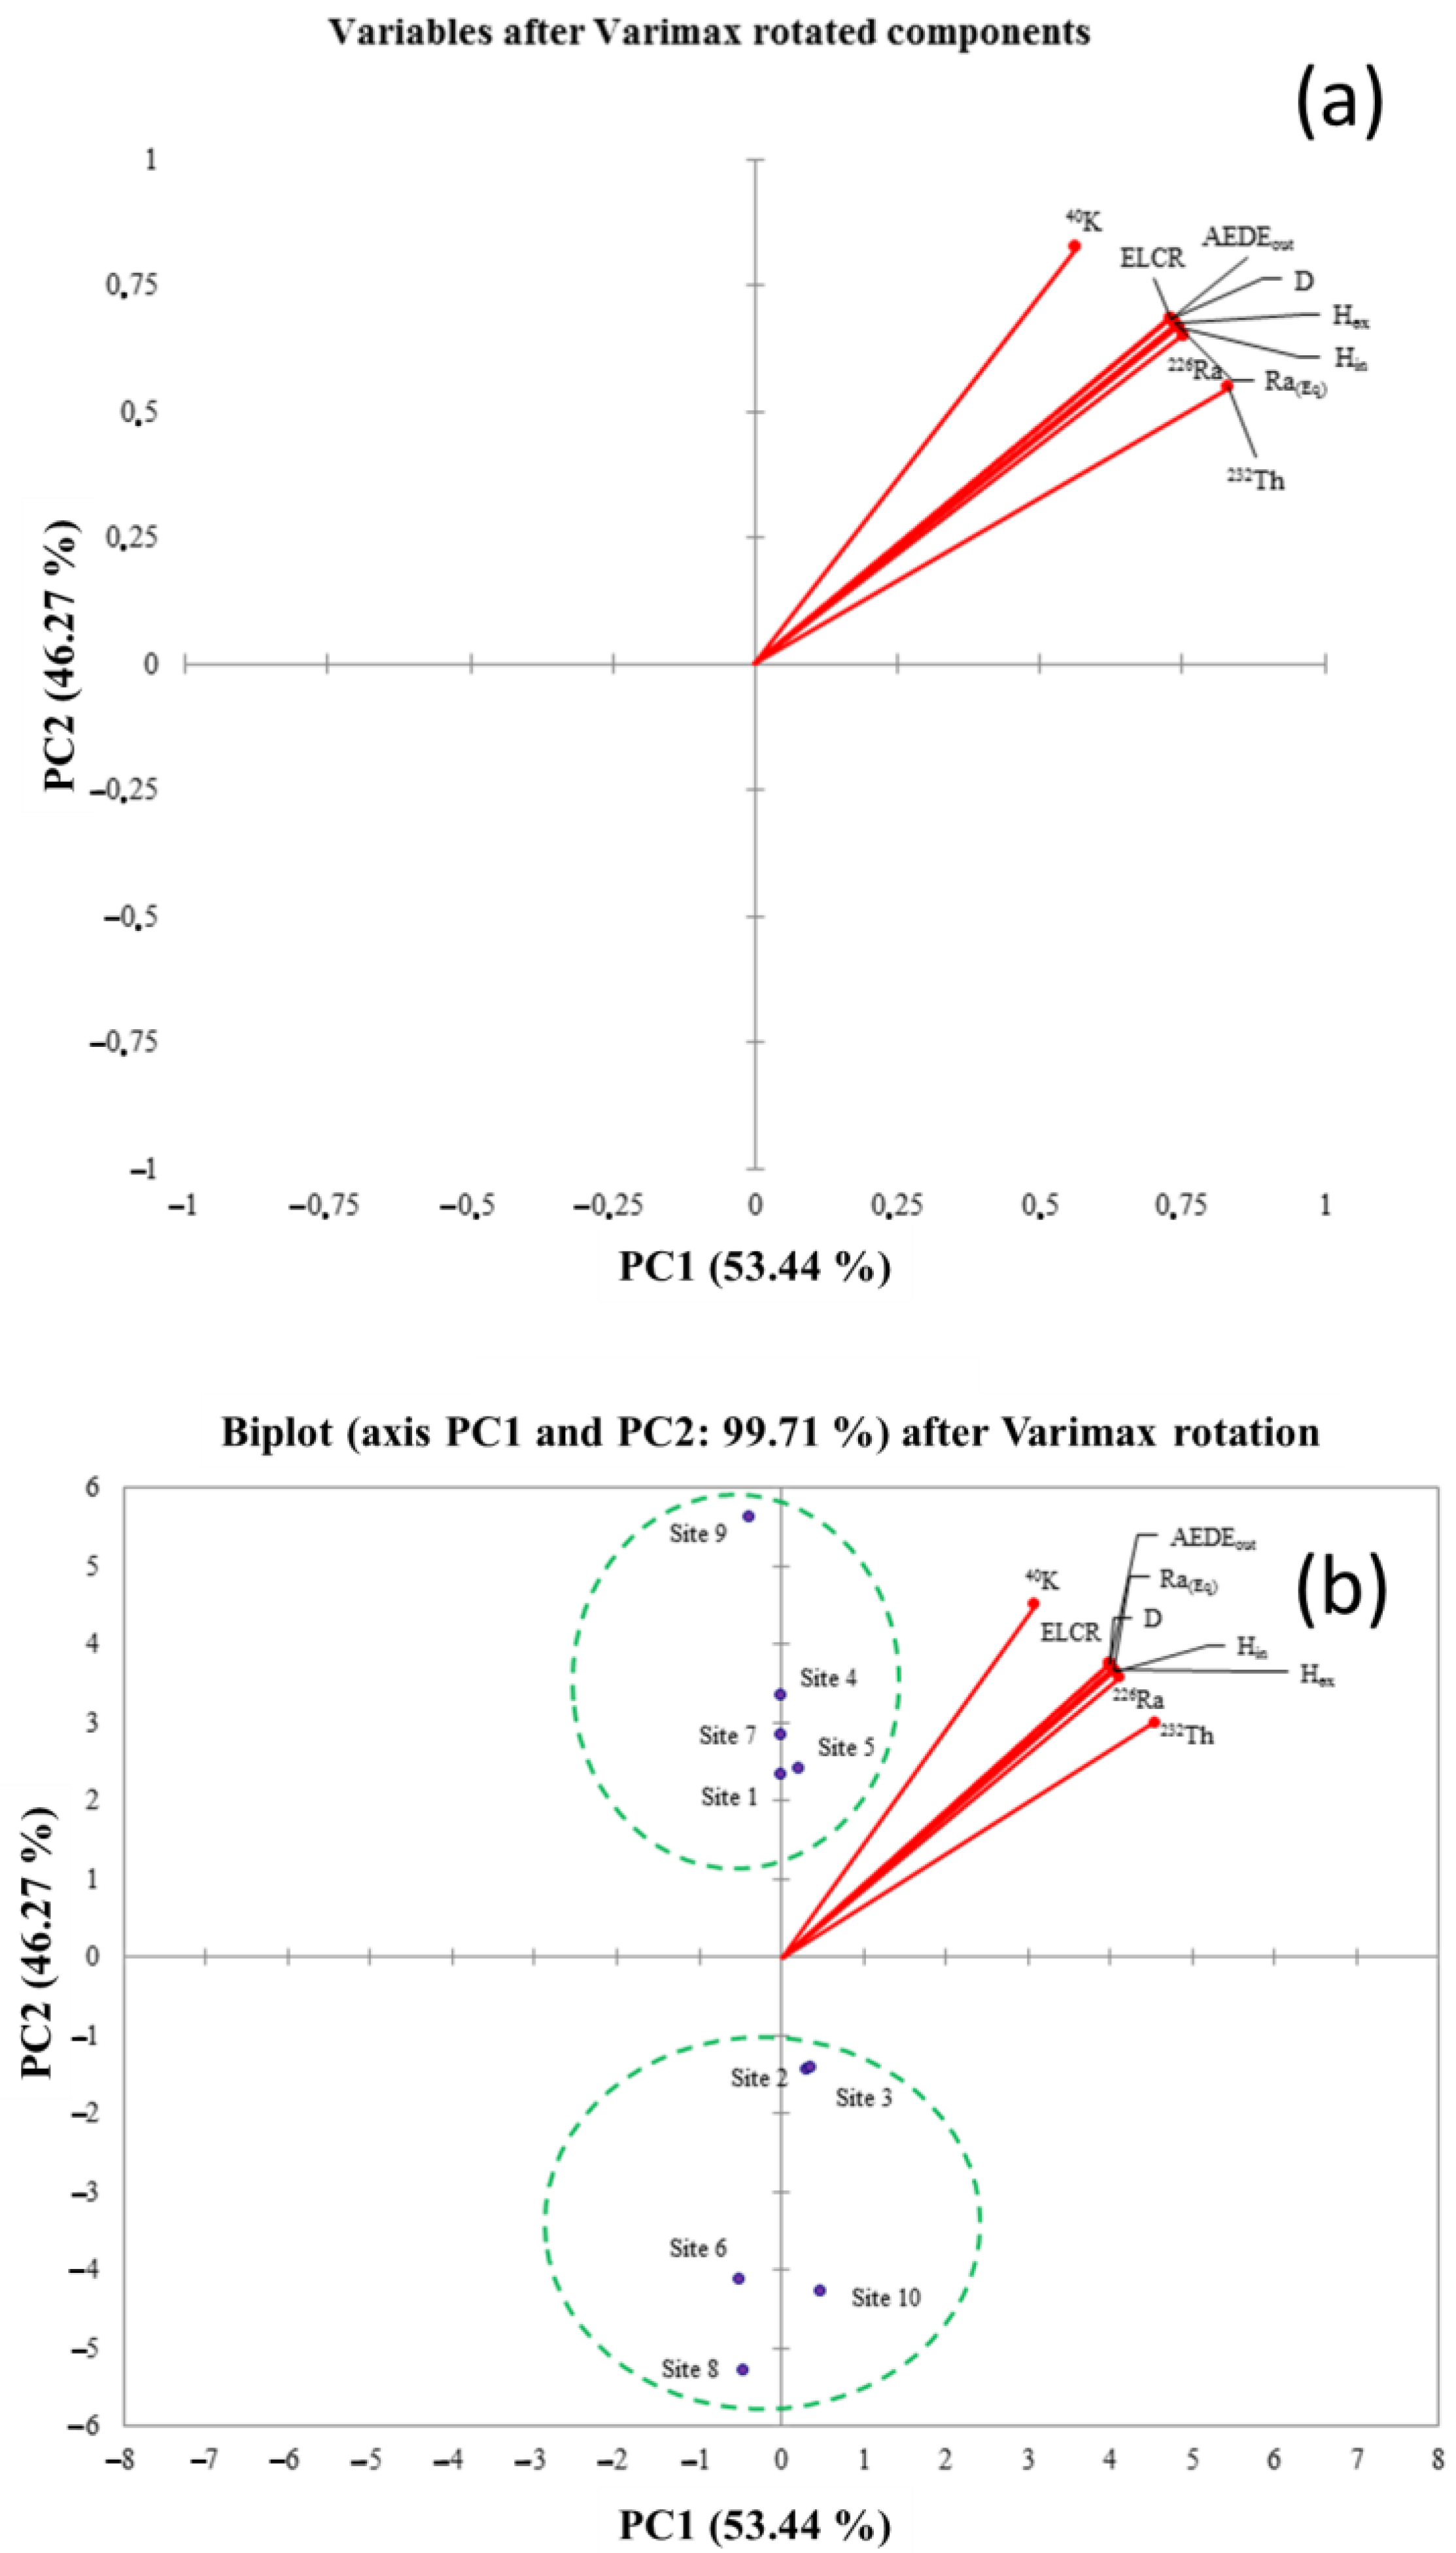
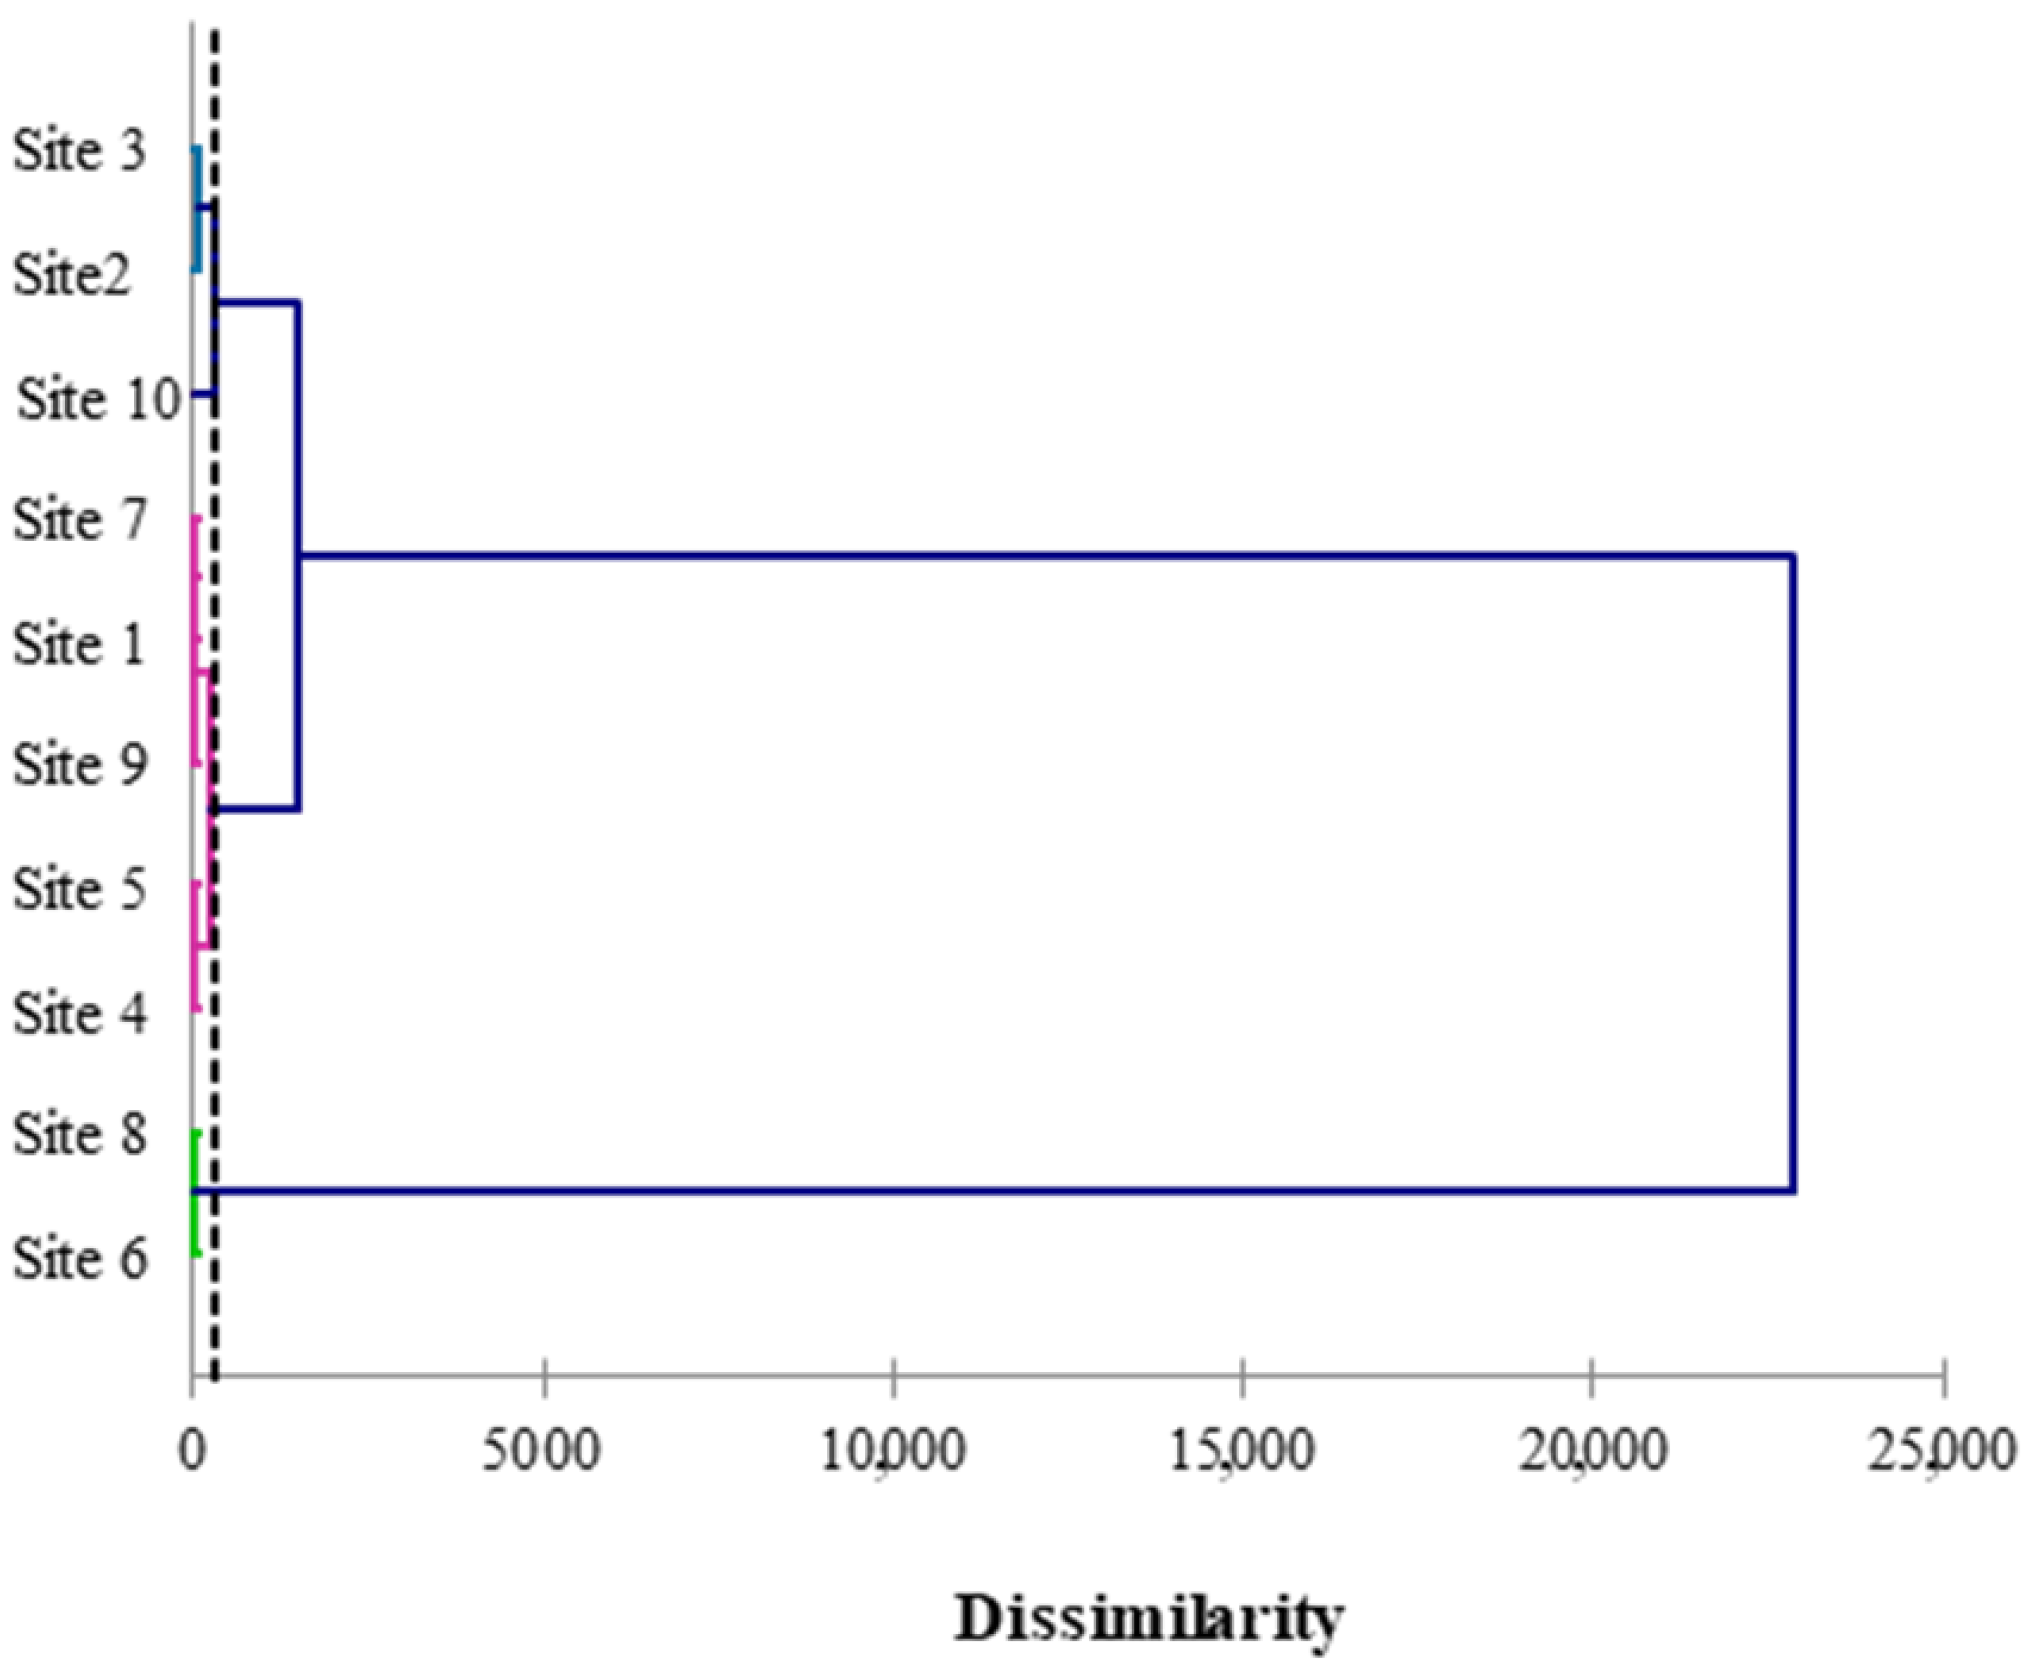
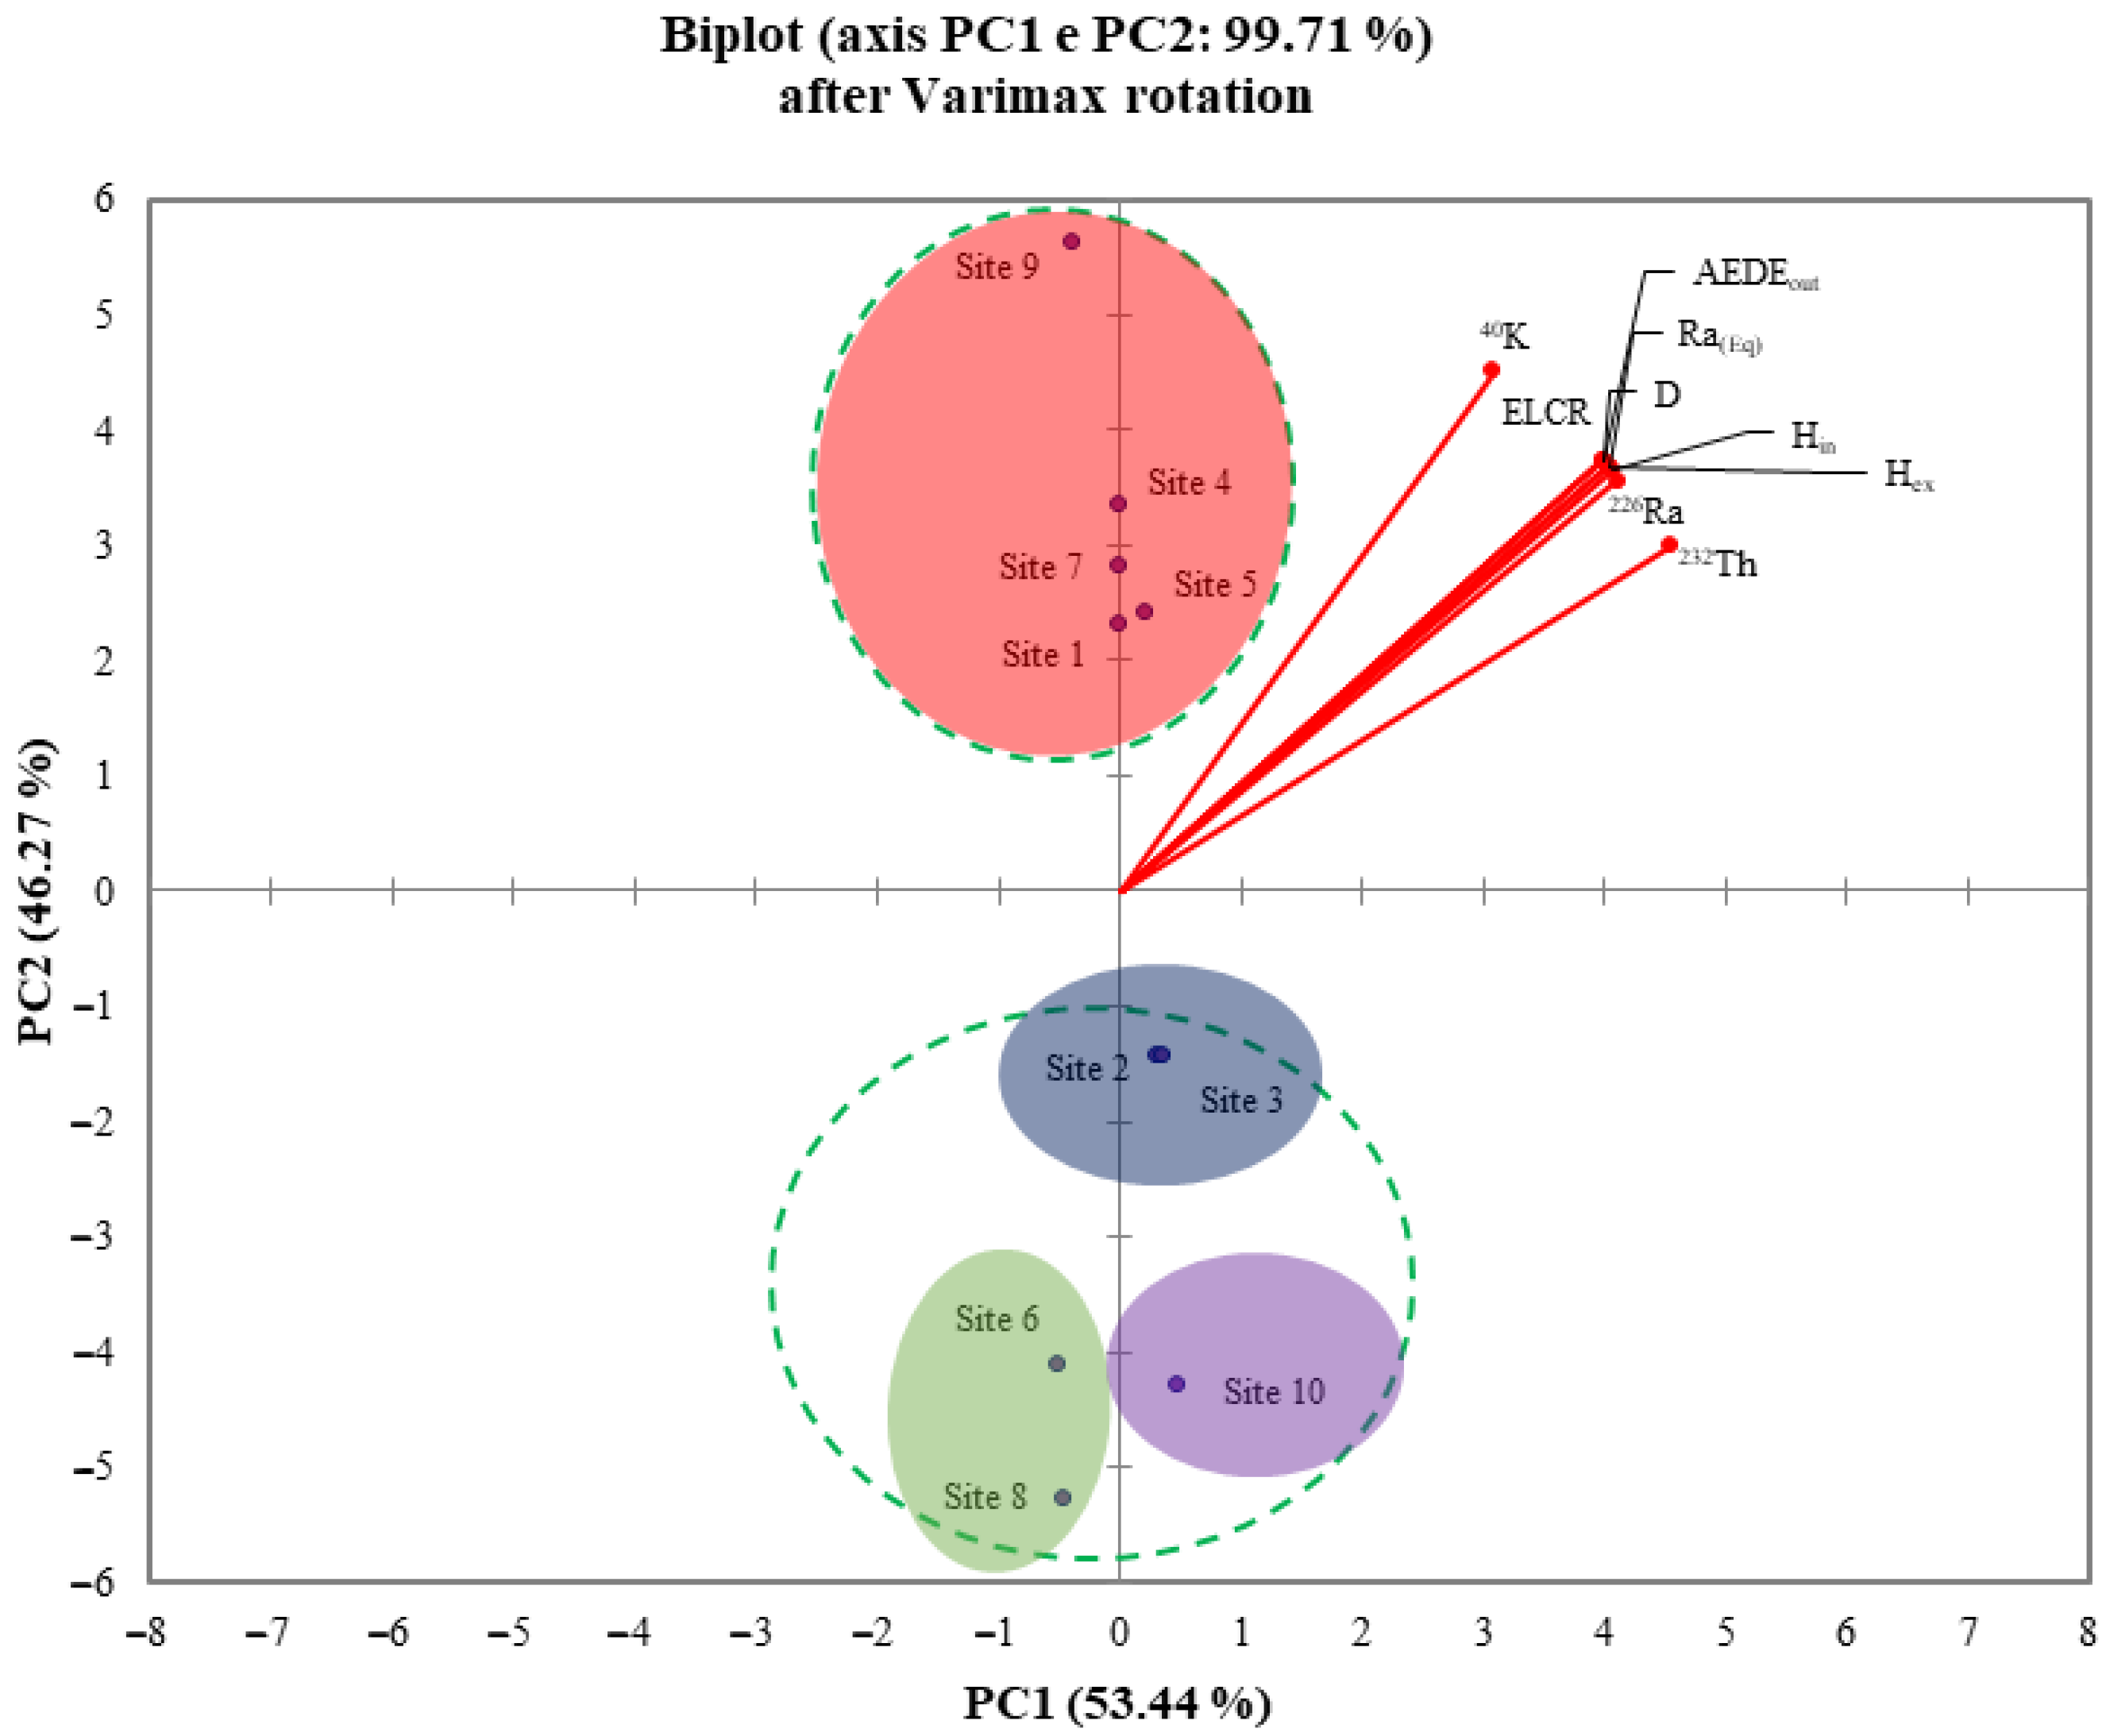
3.3. Statistical Features

As is well established, the determination of a certain distribution of the data plays a key role in parametric statistical elaboration, because if the assumption of the normal distribution is violated, the interpretation of the results could be not valid or reliable. Hence, before proceeding with any relevant statistical procedures, it is fundamental to verify the adequacy of the assumption of the normal distribution of data. For this purpose, Shapiro– Wilk, Anderson–Darling, and Lilliefors tests were run [56].
Table 6 reports the results, in terms of p-values, provided by different algorithms used to verify the distribution of data.
The p-values results provided by all parametric tests are always lower than the 0.05 value that corresponds to the significant statistic level, confirming the assumption of the normal distribution [57].
The specific activities of detected radionuclides and the radiological parameters were subjected to Pearson’s correlation analysis, in order to put into evidence the interdependency and, at the same time, to assess any existing relationships between the radiological hazard indices and the activity concentrations of the radioisotopes. Table 7 reports the Pearson’s correlation matrix.
The Pearson test shows a significant positive correlation (r = 0.970) between CTh and CRa, for CK and CRa (r = 0.954), as well as for CK and CTh (r = 0.925). Furthermore, all detected radiological parameters exhibit a positive strong correlation among them. In more detail, the positive correlations range between 0.968, which indicates the CKHin correspondence between CK and Hin, and 1.000, obtained for HexD, HexRaeq, DRaeq, AEDEoutD, AEDEoutRaeq, AEDEoutHex, ELCRD, ELCRRaeq, ELCRHex, and ELCRAEDEout correspondences.
Going on, ten variables (Site IDs, CRa, CTh, CK, D, Raeq, Hin, Hex, AEDEout, and ELCR) were processed by the PCA algorithm. To make the interpretation of the PCA results easier, the Varimax rotation was also performed using the Kaiser normalization procedure [58]. In detail, Table 8 shows the significant factors, extracted before the PCA elaboration, which are the main factors able to explain the variance of the dataset.
The PCA and Pearson’s matrix results are coherent, as shown in Figure 4a. In addition, in this figure, the PC1 and PC2 after the Varimax rotation are put into evidence, totally accounting for 99.71% of the total variance. In Figure 4b, the variable “Site IDs” were also inserted, with the attempt to evaluate the possibility of regrouping for those samples that exhibit homogeneous behavior, in terms of activity concentrations and radiological parameters. On that score, the PCA has shown two clusters, the first one composed of ID 1, 4, 5, 7, and 9 sites, whereas the second one was formed by ID 2, 3, 6, 8, and 10 sites. In particular, cluster 1 shows a positive correlation between the analyzed samples coming from ID 1, 4, 5, 7, and 9 sites and all the considered variables. This condition can be graphically appreciated in the PCA plot because cluster 1 and the considered variables fall into the same quadrant. The opposite was found for cluster 2.
Thus, on the basis of the results obtained by the PCA elaboration, it is possible to clearly discriminate two groups of samples. A more critical interpretation will be given in the following, on the basis of the mineralogical composition of the pyroclastic products themselves.
Finally, with reference to the HCA, the outcome dendrogram is shown in Figure 5.
The dotted line represents the automatic cut, which implies the formation of four clusters, and it was placed on the dendrogram at a 292.11 distance. The first cluster (displayed in a pink color) is more homogeneous and regrouped the ID 1, 4, 5, 7, and 9 sites, whereas the pyroclastic products collected from the ID 2 and 3 sites fall into the second cluster (blue color). Instead, the third cluster was composed of the samples coming from ID 6 and 8 sites (green color), whereas the fourth cluster was formed only by the sample collected in site ID10 (black color).
In order to provide information on the discriminating factors used in cluster analysis, the values of the original variables for the four clusters are reported in Figure 6. In detail, the red, blue, green, and purple lines account for clusters 1, 2, 3, and 4, respectively.
Notably, the maximum difference between the reported values was found for 40K, Raeq, and AEDEout.
The HCA results are in very good agreement with those obtained after the Pearson’s matrix and PCA elaborations. Moreover, the HCA results increased the degree of detail by grouping in four clusters the site IDs with a good degree of agreement. By carefully observing the site IDs that fall into the respective clusters, it is possible to see how they can be grouped in this way even in the PCA loading plot, as shown in Figure 7.

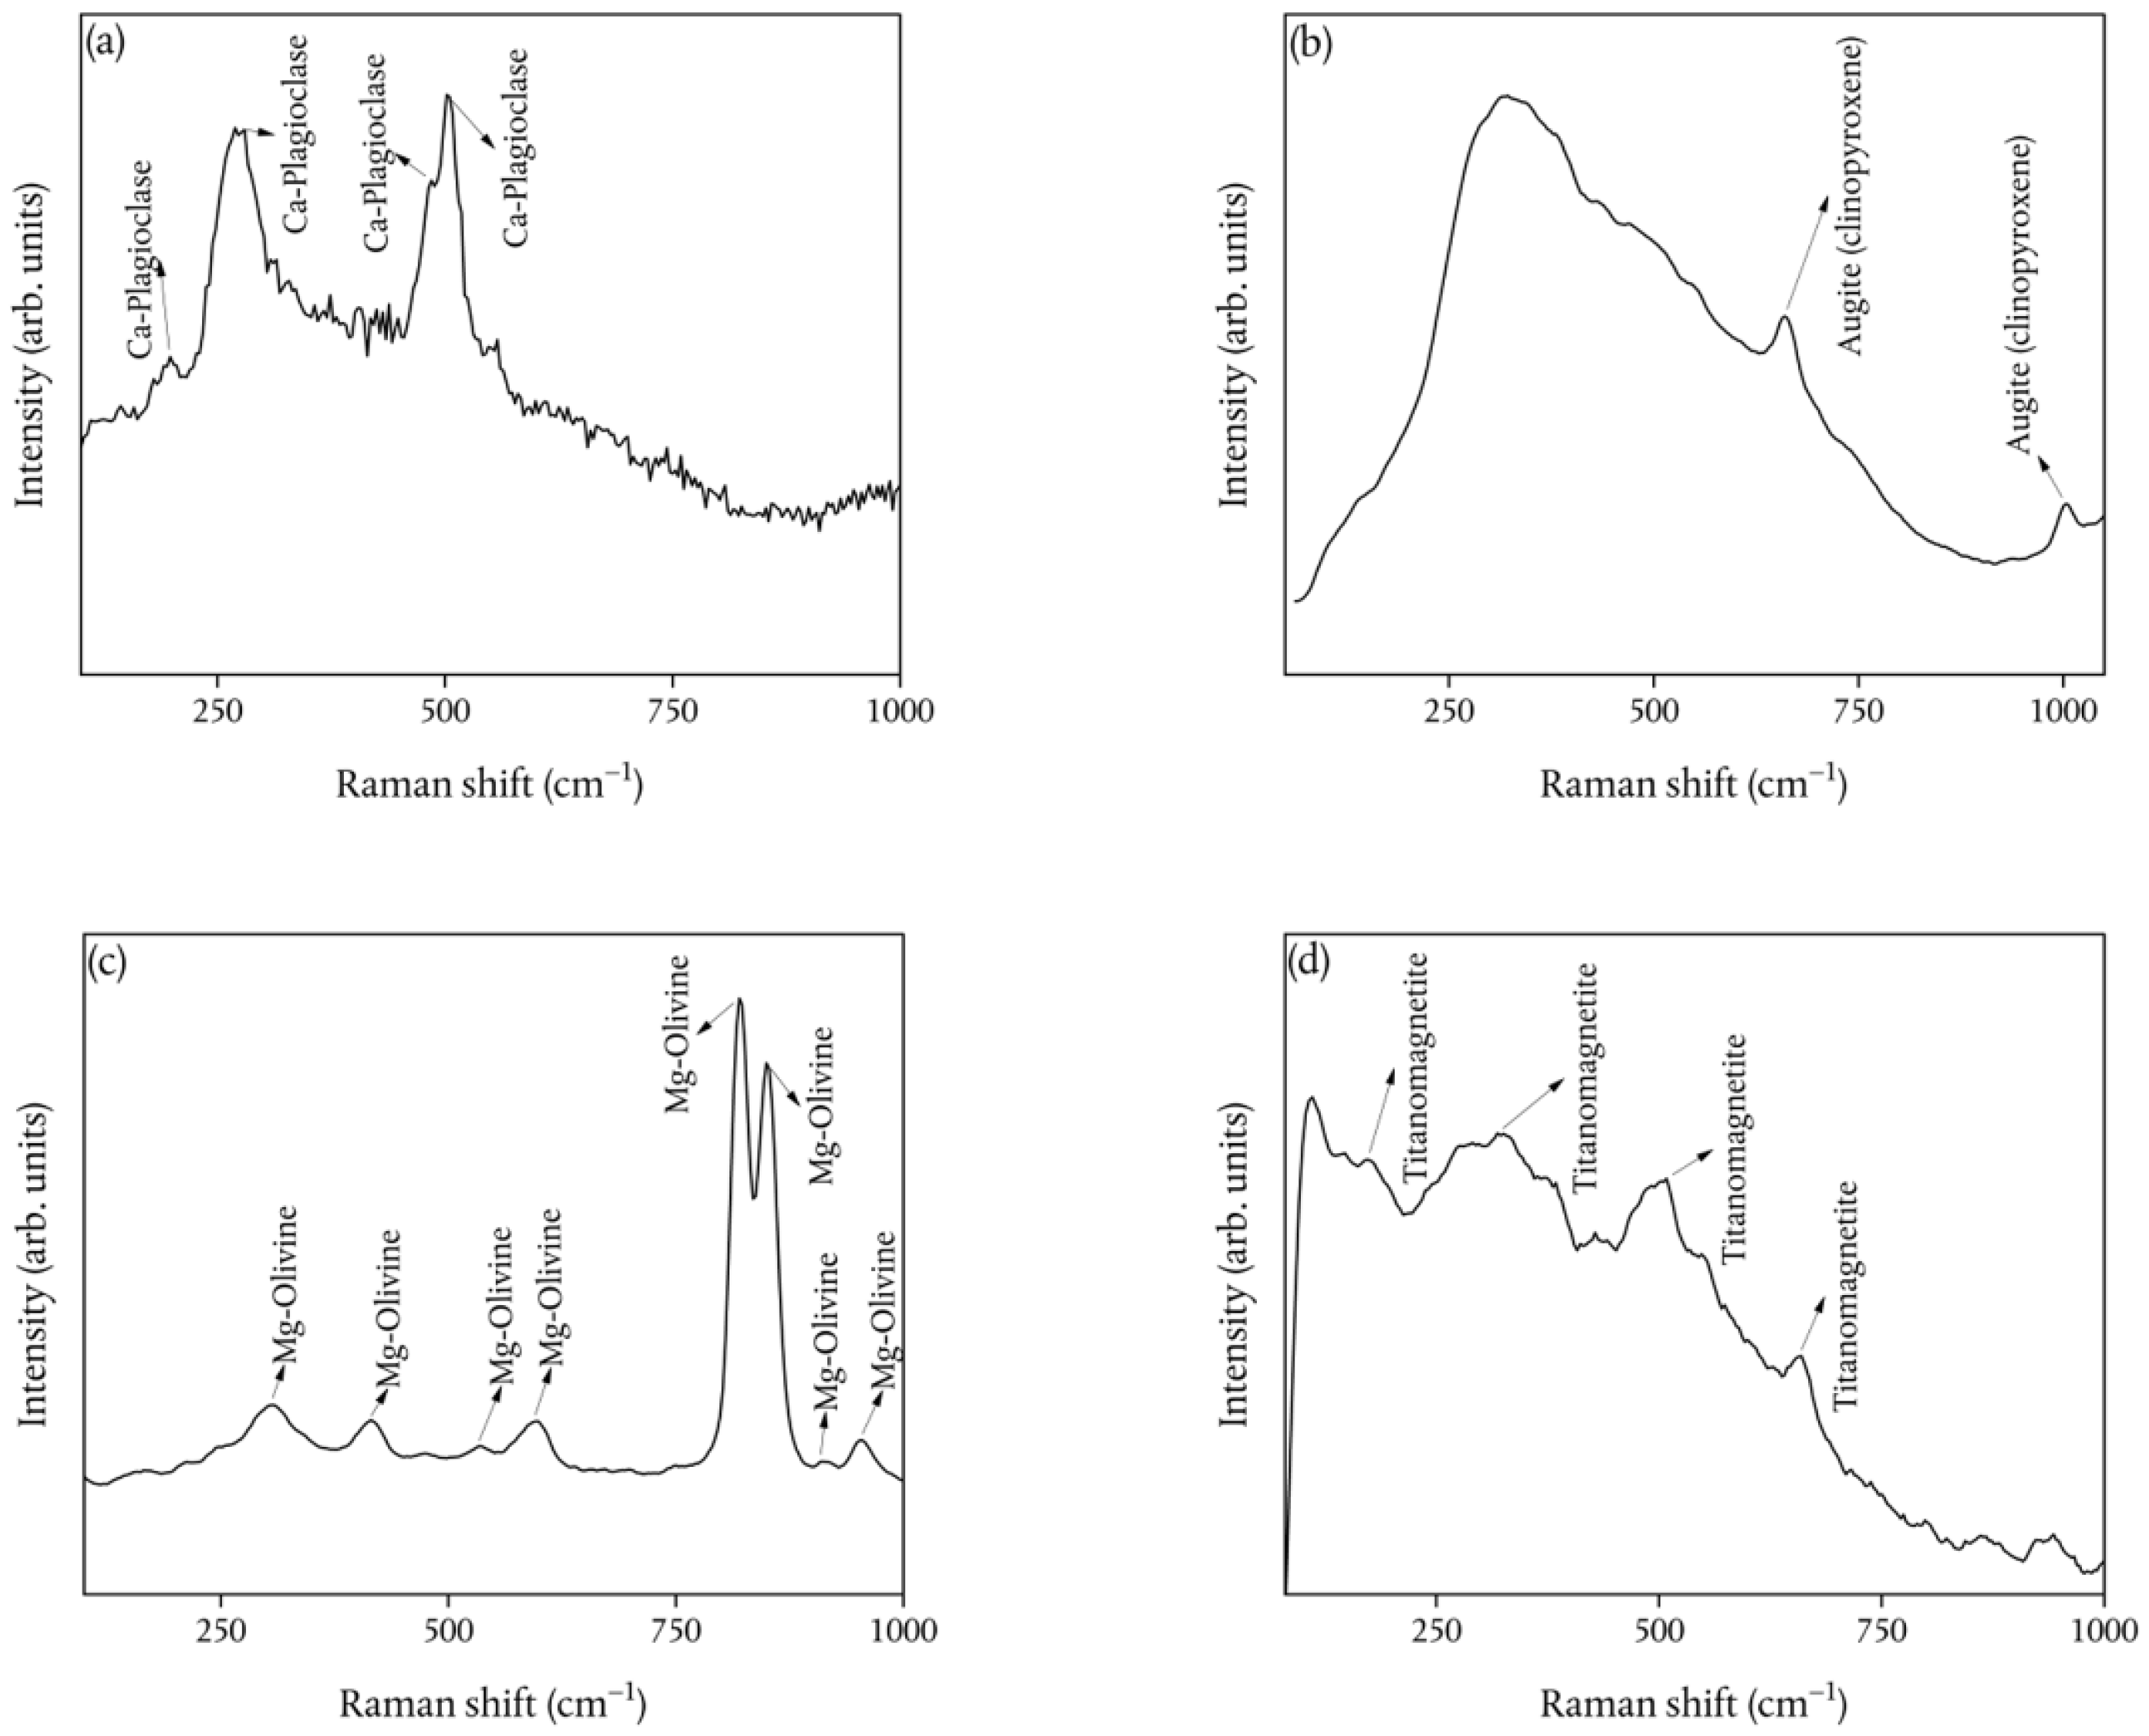
3.4. Mineralogical Composition

Minerals identification was firstly carried out, by matching the measured X-ray Diffraction (XRD) peak positions to the American Mineralogist Crystal Structure Database.
The XRD patterns of the investigated pyroclastic products reveal a common assemblage of Ca-plagioclase, Augite (clinopyroxene), Mg-rich–olivine, and Titanomagnetite, superimposed to a glassy groundmass (Figure 8).
Secondly, Micro-Raman Scattering (MRS) was applied in order to support the XRD results.
Figure 9 shows the Raman spectra collected on different grains of the whole set of investigated samples.
Feldspars are revealed (Figure 9a), as recognized according to [59]. In particular, the two intense Raman peaks in the ~450–520 cm−1 range are associated with the ring-breathing modes of the four-membered rings of tetrahedra [60]. Based on a comparison with the literature [59], we can conclude that the feldspars are present as Ca-plagioclases.
Going on, MRS analysis also revealed a second mineralogical phase (Figure 9b), characterized by two Raman bands at ~660 cm−1 and at ~1004 cm−1. From a comparison with the literature [61], these bands are, respectively assigned to the Si–O bridging stretching and to the Si–O non-bridging stretching of augite (clinopyroxene).
The average spectra reported in Figure 9c exhibit several Raman bands that, according to [62], are ascribed to external SiO4 and Mg vibrations (~308 cm−1), ν2 bending vibrations (~408 cm−1), ν4 bending vibrations (~ 536 cm−1 and ~ 596 cm−1), coupled ν1– ν3 stretching vibrations (~821 cm−1 and ~850 cm−1), ν3 stretching vibrations (~913 cm−1 and ~950 cm−1), of a Mg-rich–olivine phase.
A less common mineralogical phase is revealed by the Raman spectrum reported in Figure 9d. As a matter of fact, the comparison with the literature data [63] allowed us to recognize the T2g (1) mode (~ 182 cm−1), Eg mode (~324 cm−1), T2g (2) mode (510 cm−1), and A1g mode (~660 cm−1) of titanomagnetite.
Finally, it is worthy of note that the mineralogical phase composition, as obtained from our samples by XRD and MRS techniques, turns out to be in agreement with that reported in the literature for similar systems [25,64,65].
For the whole set of data reported in this work, we can reasonably retain the detected mineralogical phases and the glassy groundmass responsible for the content of radionuclides previously described. In particular, the activity concentrations reported in Table 3 put in evidence a 40K value that appears to be high if compared with the literature data regarding radiological analyses in Etnean volcanic rocks [52].
This can be explained by taking into account that a magmatic system can be described as a liquid silicate melt containing dissolved gas (mainly H2O, CO2, and S) and variable amounts of crystals [66]. Pyroclastic products are mainly composed of volcanic glass, which is, among volcanic products, the most weatherable component [67]. Freshly deposited pyroclastic products can release high amounts of potentially harmful compounds because adsorbed acidic gases and salts formed by their reaction with the glass are readily soluble [68,69]. In this scenario, radionuclides are vehiculated by volcanic gasses [70].
As underlined in the statistical results, the samples of pyroclastic wastes show different trends from the freshly deposited pyroclastic products. This is explained by the fact that the pyroclastic wastes have undergone contamination and chemical weathering. In this last scenario, according to [71], alkali elements, such as potassium, are more strongly attracted by water than by other inorganic ligands. The same fate is for radionuclides, such as U and Th, that are easily mobilized by dissolution and/or leaching of the pyroclastic products and by devitrification effects [68]. It is important to note how basaltic glass dissolves faster than microcrystalline basalt, according to [72], and the release of alkalis and alkaline earths also varies between glassy and crystalline basalts [72].

4. Conclusions

The natural radioactivity content of pyroclastic products coming from the Mt. Etna volcano (Sicily, Southern Italy) was investigated. In particular, calculations of radiological hazard indices were performed in order to assess any possible radiological health risk for the population due to the external exposure to ionizing radiations. In our case, the obtained D, Raeq, Hin, Hex, and AEDEout values were found to be lower than the maximum recommended ones for the population members, thus reasonably excluding radiological hazard effects.
Going on, the mineralogical/geochemical composition of the investigated samples was characterized and correlated with the radioactivity emission. From the results, we can conclude that the investigated pyroclastic products reveal a common assemblage of Ca-plagioclase, Augite (clinopyroxene), Mg-rich olivine, and titanomagnetite. Moreover, the natural radionuclides’ activity concentration reported in this paper put in evidence a high value of 40K if compared with the literature data of radiological analyses in Etnean volcanic rocks. This can be explained by taking into account the capability of freshly deposited pyroclastic products of releasing great quantities of potentially harmful compounds. In this scenario, radionuclides are vehiculated by volcanic gasses. At the same time, pyroclastic wastes show different trends from freshly deposited products due to their contamination and chemical weathering.
Finally, multivariate statistical analyses were performed by processing observed radioactivity and radiological parameters in order to determine their correlation with the sampling locations. In particular, the HCA results, in very good agreement with Pearson correlation and PCA, increased the degree of detail by grouping in four clusters the site sampling IDs with a good degree of agreement. Worthy of note, the observed radioactivity and radiological parameters are correlated with the sampling locations following the mineralogical composition of the analyzed samples, i.e., freshly erupted air-fall pyroclastic products in five of the selected sites (IDs 1, 4, 5, 7, and 9), and samples from heaps of pyroclastic wastes from previous volcanic activities in the remaining sites (IDs 2, 3, 6, 8, and 10).

Author Contributions

Conceptualization, F.C. and V.V.; methodology, F.C. and V.C.; validation, D.M.; formal analysis, A.F.M., G.F., R.G., A.B., S.M. and M.D.; investigation, F.C., G.M., S.E.S., G.P., F.B. and V.V.; resources, F.C., V.C. and D.M.; data curation, F.C.; writing—original draft preparation, F.C.; supervision, D.M., G.M. and V.V. All authors have read and agreed to the published version of the manuscript.

Funding

This research received no external funding.

Institutional Review Board Statement

Not applicable.

Informed Consent Statement

Not applicable.

Data Availability Statement

Not applicable.

Conflicts of Interest

The authors declare no conflict of interest.

References

  1. United Nations Scientific Committee on the Effects of Atomic Radiation. Sources and Effects of Ionizing Radiation: Report to the General Assembly, with Scientific Annexes; UNSCEAR: New York, NY, USA, 2000; Volume I, ISBN 92-1-142238-8. [Google Scholar]
  2. Caridi, F.; Acri, G.; Belvedere, A.; Crupi, V.; D’Agostino, M.; Marguccio, S.; Messina, M.; Paladini, G.; Venuti, V.; Majolino, D. Evaluation of the radiological and chemical risk for public health from flour sample investigation. Appl. Sci. 2021, 11, 3646. [Google Scholar] [CrossRef]
  3. Caridi, F.; Marguccio, S.; Durante, G.; Trozzo, R.; Fullone, F.; Belvedere, A.; D’Agostino, M.; Belmusto, G. Natural radioactivity measurements and dosimetric evaluations in soil samples with a high content of NORM. Eur. Phys. J. Plus 2017, 132, 56. [Google Scholar] [CrossRef]
  4. Caridi, F.; D’Agostino, M.; Belvedere, A.; Marguccio, S.; Belmusto, G. Radon radioactivity in groundwater from the Calabria region, south of Italy. J. Instrum. 2016, 11, P05012. [Google Scholar] [CrossRef]
  5. Caridi, F.; D’Agostino, M.; Messina, M.; Marcianò, G.; Grioli, L.; Belvedere, A.; Marguccio, S.; Belmusto, G. Lichens as environmental risk detectors. Eur. Phys. J. Plus 2017, 132, 189. [Google Scholar] [CrossRef]
  6. Caridi, F.; Messina, M.; D’Agostino, M. An investigation about natural radioactivity, hydrochemistry, and metal pollution in groundwater from Calabrian selected areas, southern Italy. Environ. Earth Sci. 2017, 76, 668. [Google Scholar] [CrossRef]
  7. Reino, W.; Pucha, G.; Recalde, C.; Tene, T.; Cadena, P. Occurrence of radioactive materials in pyroclastic flows of Tungurahua volcano using gamma spectrometry. In AIP Conference Proceedings; AIP Publishing LLC: Melville, NY, USA, 2018; Volume 2003, p. 020014. [Google Scholar] [CrossRef]
  8. Raja, S.L.; Marpaung, H.; Simanjuntak, S.; Simanjuntak, C.; Pudjadi, E. Distribution and risk assessment of natural radioactive elements in volcanic ashes, cold lava, river waters due to volcanic eruption of Mount Sinabung. In AIP Conference Proceedings; AIP Publishing LLC: Melville, NY, USA, 2021; Volume 2342, p. 020008. [Google Scholar] [CrossRef]
  9. Zagorodnyuk, L.H.; Mestnikov, A.E.; Makhortov, D.S.; Akhmed, A.A.A. Mixed binders with the use of volcanic ash. Lect. Notes Civ. Eng. 2021, 95, 9–15. [Google Scholar] [CrossRef]
  10. Ahmedai, M.A.; Ahmed, S.A.M.; Ahmed, Y.H.; Ibrahiem, E.-S.M. Tagabo Volcanic Ash as Cement Replacing Materials. FES J. Eng. Sci. 2021, 9, 35–39. [Google Scholar] [CrossRef]
  11. Ranatunga, T.D.; Taylor, R.W.; Bhat, K.N.; Reddy, S.S.; Senwo, Z.N.; Jackson, B. Inorganic phosphorus forms in soufrière hills volcanic ash and volcanic ash-derived soil. Soil Sci. 2009, 174, 430–438. [Google Scholar] [CrossRef]
  12. Chester, D.K.; Duncan, A.M.; Guest, J.E.; Kilburn, C.R.J. Mount Etna. The Anatomy of a Volcano. Geol. Mag. 1986, 123, 463–464. [Google Scholar] [CrossRef]
  13. Tanguy, J.-C.; Condomines, M.; Kieffer, G. Evolution of the Mount Etna magma: Constraints on the present feeding system and eruptive mechanism. J. Volcanol. Geotherm. Res. 1997, 75, 221–250. [Google Scholar] [CrossRef]
  14. Gvirtzman, Z.; Nur, A. The formation of Mount Etna as the consequence of slab rollback. Nature 1999, 401, 782–785. [Google Scholar] [CrossRef]
  15. Condomines, M.; Tanguy, J.-C.; Michaud, V. Magma dynamics at Mt Etna: Constraints from U-Th-Ra-Pb radioactive disequilibria and Sr isotopes in historical lavas. Earth Planet. Sci. Lett. 1995, 132, 25–41. [Google Scholar] [CrossRef]
  16. Kozłowska, B.; Walencik-łata, A.; Giammanco, S.; Immè, G.; Catalano, R.; Mangano, G. Radioactivity of mt. Etna volcano and radionuclides transfer to groundwater. Ann. Geophys. 2019, 62, VO565. [Google Scholar] [CrossRef]
  17. Caridi, F.; D’Agostino, M.; Belvedere, A.; Marguccio, S.; Belmusto, G.; Gatto, M.F. Diagnostics techniques and dosimetric evaluations for environmental radioactivity investigations. J. Instrum. 2016, 11, C10012. [Google Scholar] [CrossRef]
  18. Omar-Nazir, L.; Shi, X.; Moller, A.; Mousseau, T.; Byun, S.; Hancock, S.; Seymour, C.; Mothersill, C. Long-term effects of ionizing radiation after the Chernobyl accident: Possible contribution of historic dose. Environ. Res. 2018, 165, 55–62. [Google Scholar] [CrossRef]
  19. Giorgia Potortì, A.; Francesco Mottese, A.; Rita Fede, M.; Sabatino, G.; Dugo, G.; Lo Turco, V.; Costa, R.; Caridi, F.; Di Bella, M.; Di Bella, G. Multielement and chemometric analysis for the traceability of the Pachino Protected Geographical Indication (PGI) cherry tomatoes. Food Chem. 2022, 386, 132746. [Google Scholar] [CrossRef] [PubMed]
  20. Mottese, A.F.; Sabatino, G.; Di Bella, M.; Fede, M.R.; Parisi, F.; Marcianò, G.; Tripodo, A.; Italiano, F.; Dugo, G.; Caridi, F. Contribution of soil compositions, harvested times and varieties on chemical fingerprint of Italian and Turkish citrus cultivars. Int. J. Food Sci. Technol. 2021, 56, 2628–2639. [Google Scholar] [CrossRef]
  21. Andronico, D.; Corsaro, R. Lava fountains during the episodic eruption of South-East Crater (Mt. Etna), 2000: Insights into magma-gas dynamics within the shallow volcano plumbing system. Bull. Volcanol. 2011, 73, 1165–1178. [Google Scholar] [CrossRef]
  22. Hirn, A.; Nicolich, R.; Gallart, J.; Laigle, M.; Cernobori, L. ETNASEIS Scientific Group Roots of Etna volcano in faults of great earthquakes. Earth Planet. Sci. Lett. 1997, 148, 171–191. [Google Scholar] [CrossRef]
  23. Giammanco, S.; Valenza, M.; Pignato, S.; Giammanco, G. Mg, Mn, Fe, and V concentrations in the ground waters of Mount Etna (Sicily). Water Res. 1996, 30, 378–386. [Google Scholar] [CrossRef]
  24. Fano, V.; Cernigliaro, A.; Scondotto, S.; Perucci, C.A.; Forastiere, F. The fear of volcano: Short-term health effects after Mount Etna’s eruption in 2002. Eur. Respir. J. 2010, 36, 1216–1218. [Google Scholar] [CrossRef] [PubMed]
  25. Cultrone, G. The use of Mount Etna volcanic ash in the production of bricks with good physical-mechanical performance: Converting a problematic waste product into a resource for the construction industry. Ceram. Int. 2022, 48, 5724–5736. [Google Scholar] [CrossRef]
  26. Spoto, S.E.; Boncaldo, A.; Capodivento, A.; Di Agosto, M.; Maccarrone, D.; Scibilia, D. Aviation and volcanic ash hazards: A flipped classroom approach to study complex systems. AAPP Atti Della Accad. Peloritana Pericolanti-Cl. Sci. Fis. Mat. Nat. 2021, 99, 36. [Google Scholar] [CrossRef]
  27. Rizza, U.; Brega, E.; Caccamo, M.T.; Castorina, G.; Morichetti, M.; Munaò, G.; Passerini, G.; Magazù, S. Analysis of the ETNA 2015 Eruption Using WRF–Chem Model and Satellite Observations. Atmosphere 2020, 11, 1168. [Google Scholar] [CrossRef]
  28. Stewart, C.; Horwell, C.; Plumlee, G.; Cronin, S.; Delmelle, P.; Baxter, P.; Calkins, J.; Damby, D.; Morman, S.; Oppenheimer, C. Protocol for analysis of volcanic ash samples for assessment of hazards from leachable elements. IAVCEI Comm. Jt. Rep. Int. Volcan. Health Hazard Netw. Cities Volcanoes 2013, 1, 1–22. [Google Scholar]
  29. Caridi, F.; Messina, M.; Belvedere, A.; D’Agostino, M.; Marguccio, S.; Settineri, L.; Belmusto, G. Food salt characterization in terms of radioactivity and metals contamination. Appl. Sci. 2019, 9, 2882. [Google Scholar] [CrossRef]
  30. Ortec Gamma Vision Software User Manual. Available online: https://www.ortec-online.com/products/application-software/gammavision (accessed on 18 July 2022).
  31. Caridi, F.; D’Agostino, M.; Belvedere, A. Radioactivity in calabrian (Southern Italy) wild boar meat. Appl. Sci. 2020, 10, 3580. [Google Scholar] [CrossRef]
  32. Caridi, F.; Belvedere, A.; Agostino, M.D.; Marguccio, S.; Marino, G.; Messina, M.; Belmusto, G. An investigation on airborne particulate radioactivity, heavy metals and polycyclic aromatic hydrocarbons composition in Calabrian selected sites, Southern Italy. Indian J. Environ. Prot. 2019, 39, 321–326. [Google Scholar]
  33. ACCREDIA. Available online: https://www.accredia.it (accessed on 18 July 2022).
  34. Picciotto, A.; Krása, J.; Láska, L.; Rohlena, K.; Torrisi, L.; Gammino, S.; Mezzasalma, A.M.; Caridi, F. Plasma temperature and ion current analysis of gold ablation at different laser power rates. Nucl. Instr. and Meth. in Phys. Res. Sect. B 2006, 247, 261–267. [Google Scholar] [CrossRef]
  35. Caridi, F.; Testagrossa, B.; Acri, G. Elemental composition and natural radioactivity of refractory materials. Environ. Earth Sci. 2021, 80, 170. [Google Scholar] [CrossRef]
  36. Ravisankar, R.; Vanasundari, K.; Chandrasekaran, A.; Rajalakshmi, A.; Suganya, M.; Vijayagopal, P.; Meenakshisundaram, V. Measurement of natural radioactivity in building materials of Namakkal, Tamil Nadu, India using gamma-ray spectrometry. Appl. Radiat. Isot. 2012, 70, 699–704. [Google Scholar] [CrossRef] [PubMed]
  37. Beretka, J.; Matthew, P.J. Natural radioactivity of Australian building materials, industrial wastes and by-products. Health Phys. 1985, 48, 87–95. [Google Scholar] [CrossRef]
  38. Sabatino, G.; Di Bella, M.; Caridi, F.; Italiano, F.; Romano, D.; Magazù, S.; Gnisci, A.; Faggio, G.; Messina, G.; Santangelo, S.; et al. Radiological assessment, mineralogy and geochemistry of the heavy-mineral placers from the Calabrian coast (South Italy). J. Instrum. 2019, 14, P05015. [Google Scholar] [CrossRef]
  39. Ramasamy, V.; Suresh, G.; Meenakshisundaram, V.; Ponnusamy, V. Horizontal and vertical characterization of radionuclides and minerals in river sediments. Appl. Radiat. Isot. 2011, 69, 184–195. [Google Scholar] [CrossRef] [PubMed]
  40. Avwiri, G.O.; Egieya, J.M. Radiometric assay of hazard indices and excess lifetime cancer risk due to natural radioactivity in soil profile in Ogba/Egbema/Ndoni local government area of Rivers state, Nigeria. Acad. Res. Int. 2013, 4, 54–65. [Google Scholar]
  41. Taskin, H.; Karavus, M.; Ay, P.; Topuzoglu, A.; Hidiroglu, S.; Karahan, G. Radionuclide concentrations in soil and lifetime cancer risk due to gamma radioactivity in Kirklareli, Turkey. J. Environ. Radioact. 2009, 100, 49–53. [Google Scholar] [CrossRef]
  42. Caridi, F.; D’Agostino, M.; Belvedere, A.; Mottese, A.F. Multi-element Analysis and Geographical Origin Classification of Italian (Calabrian) Wines. Curr. Nutr. Food Sci. 2020, 16, 1259–1264. [Google Scholar] [CrossRef]
  43. Mottese, A.F.; Fede, M.R.; Caridi, F.; Sabatino, G.; Marcianò, G.; Ravenda, P.; Gaetano, A.D.; Dugo, G. Fingerprint of PGI Mantova Cucumis melo by ICP-MS and Chemometric Analysis. Curr. Nutr. Food Sci. 2021, 17, 94–104. [Google Scholar] [CrossRef]
  44. Albergamo, A.; Mottese, A.F.; Bua, G.; Caridi, F.; Sabatino, G.; Barrega, L.; Costa, R.; Dugo, G. Discrimination of the Sicilian Prickly Pear (Opuntia Ficus-Indica L., CV. Muscaredda) According to the Provenance by Testing Unsupervised and Supervised Chemometrics. J. Food Sci. 2018, 83, 2933–2942. [Google Scholar] [CrossRef]
  45. Mottese, A.F.; Sabatino, G.; Di Bella, M.; Fede, M.R.; Caridi, F.; Parisi, F.; Marcianò, G.; Caccamo, M.T.; Italiano, F.; Yuce, G.; et al. Environmental screening for the assessment of potentially toxic elements content in PGI soils from the Mediterranean region (Italy and Turkey). Environ. Earth Sci. 2020, 79, 499. [Google Scholar] [CrossRef]
  46. Malvern Panalytical. Empyrean Diffractometer User Manual; Malvern Panalytical Ltd.: Malvern, UK, 2013. [Google Scholar]
  47. Available online: https://www.icdd.com (accessed on 18 July 2022).
  48. BW TEK BTR 111 Mini-RamTM Datasheet. 2019. Available online: https://bwtek.com/products/i-raman-plus/ (accessed on 18 July 2022).
  49. Crupi, V.; D’Amico, S.; Denaro, L.; Donato, P.; Majolino, D.; Paladini, G.; Persico, R.; Saccone, M.; Sansotta, C.; Spagnolo, G.V.; et al. Mobile Spectroscopy in Archaeometry: Some Case Study. J. Spectrosc. 2018, 2018, 8295291. [Google Scholar] [CrossRef]
  50. Caridi, F.; Santangelo, S.; Faggio, G.; Gnisci, A.; Messina, G.; Belmusto, G. Compositional and Mineralogical Analysis of Marine Sediments from Calabrian Selected Areas, Southern Italy. Int. J. Environ. Res. 2019, 13, 571–580. [Google Scholar] [CrossRef]
  51. Warr, L.N. IMA–CNMNC approved mineral symbols. Mineral. Mag. 2021, 85, 291–320. [Google Scholar] [CrossRef]
  52. Morelli, D.; Immé, G.; Cammisa, S.; Catalano, R.; Mangano, G.; La Delfa, S.; Patanè, G. Radioactivity measurements in volcano-tectonic area for geodynamic process study. Eur. Phys. J. Web Conf. 2012, 24, 05009. [Google Scholar] [CrossRef]
  53. Ramasamy, V.; Meenakshisundaram, V.; Venkatachalapathy, R.; Ponnusamy, V. Influence of mineralogical and heavy metal composition on natural radionuclide concentrations in the river sediments. Appl. Radiat. Isot. 2011, 69, 1466–1474. [Google Scholar] [CrossRef]
  54. Italian Legislation D.Lgs. 101/20. Available online: https://www.gazzettaufficiale.it/eli/gu/2020/08/12/201/so/29/sg/pdf (accessed on 18 July 2022).
  55. Qureshi, A.A.; Tariq, S.; Din, K.U.; Manzoor, S.; Calligaris, C.; Waheed, A. Evaluation of excessive lifetime cancer risk due to natural radioactivity in the rivers sediments of Northern Pakistan. J. Radiat. Res. Appl. Sci. 2014, 7, 438–447. [Google Scholar] [CrossRef]
  56. Mohd Razali, N.; Yap, B. Power Comparisons of Shapiro-Wilk, Kolmogorov-Smirnov, Lilliefors and Anderson-Darling Tests. J. Stat. Model. Anal. 2011, 2, 21–33. [Google Scholar]
  57. Seier, E. Normality Tests: Power Comparison BT-International Encyclopedia of Statistical Science; Lovric, M., Ed.; Springer: Berlin/Heidelberg, Germany, 2011; pp. 1000–1003. ISBN 978-3-642-04898-2. [Google Scholar]
  58. Weide, A.C.; Beauducel, A. Varimax Rotation Based on Gradient Projection Is a Feasible Alternative to SPSS. Front. Psychol. 2019, 10, 645. [Google Scholar] [CrossRef]
  59. Freeman, J.J.; Wang, A.; Kuebler, K.E.; Jolliff, B.L.; Haskin, L.A. Characterization of natural feldspars by raman spectroscopy for future planetary exploration. Can. Mineral. 2008, 46, 1477–1500. [Google Scholar] [CrossRef]
  60. Mckeown, D.A. Raman spectroscopy and vibrational analyses of albite: From 25 °C through the melting temperature. Am. Mineral. 2005, 90, 1506–1517. [Google Scholar] [CrossRef]
  61. Buzatu, A.; Buzgar, N. The Raman study of single-chain silicates. An. Stiintifice De Univ. AI Cuza Din Iasi. Sect. 2 Geol. 2010, 56, 107–125. [Google Scholar]
  62. Kolesov, B.; Geiger, C. A Raman spectroscopic study of Fe–Mg olivines. Phys. Chem. Miner. 2004, 31, 142–154. [Google Scholar] [CrossRef]
  63. Zinin, P.; Tatsumi-Petrochilos, L.; Bonal, L.; Acosta, T.; Hammer, J.; Gilder, S.; Fuller, M. Raman spectroscopy of titanomagnetites: Calibration of the intensity of Raman peaks as a sensitive indicator for their Ti content. Am. Mineral. 2011, 96, 1537–1546. [Google Scholar] [CrossRef]
  64. Corsaro, R.; Miraglia, L.; Pompilio, M. Petrologic evidence of a complex plumbing system feeding the July–August 2001 eruption of Mt. Etna, Sicily, Italy. Bull. Volcanol. 2007, 69, 401–421. [Google Scholar] [CrossRef]
  65. Corsaro, R.; Miraglia, L. Dynamics of 2004-2005 Mt. Etna effusive eruption as inferred from petrologic monitoring. Geophys. Res. Lett. 2005, 32, 13302. [Google Scholar] [CrossRef]
  66. Sigurdsson, H. Part I Origin and Transport of Magma. In The Encyclopedia of Volcanoes, 2nd ed.; Sigurdsson, H.B.T.-T.E. of V.; Academic Press: Amsterdam, The Netherlands, 2015; pp. 33–34. ISBN 978-0-12-385938-9. [Google Scholar]
  67. Di Genova, D.; Brooker, R.A.; Mader, H.M.; Drewitt, J.W.E.; Longo, A.; Deubener, J.; Neuville, D.R.; Fanara, S.; Shebanova, O.; Anzellini, S.; et al. In situ observation of nanolite growth in volcanic melt: A driving force for explosive eruptions. Sci. Adv. 2020, 6, eabb0413. [Google Scholar] [CrossRef]
  68. Witham, C.S.; Oppenheimer, C.; Horwell, C.J. Volcanic ash-leachates: A review and recommendations for sampling methods. J. Volcanol. Geotherm. Res. 2005, 141, 299–326. [Google Scholar] [CrossRef]
  69. Cangemi, M.; Speziale, S.; Madonia, P.; D’Alessandro, W.; Andronico, D.; Bellomo, S.; Brusca, L.; Kyriakopoulos, K. Potentially harmful elements released by volcanic ashes: Examples from the Mediterranean area. J. Volcanol. Geotherm. Res. 2017, 337, 16–28. [Google Scholar] [CrossRef]
  70. Smith, D.B.; Zielinski, R.A.; Rose, W.I. Leachability of uranium and other elements from freshly erupted volcanic ash. J. Volcanol. Geotherm. Res. 1982, 13, 1–30. [Google Scholar] [CrossRef]
  71. Aiuppa, A.; Allard, P.; D’Alessandro, W.; Agnès, M.; Parello, F.; Treuil, M.; Valenza, M. Mobility and fluxes of major, minor and trace metals during basalt weathering and groundwater transport at Mt. Etna volcano (Sicily). Geochim. Cosmochim. Acta 2000, 64, 1827–1841. [Google Scholar] [CrossRef]
  72. Gislason, S.R.; Oelkers, E.H. Mechanism, rates, and consequences of basaltic glass dissolution: II. An experimental study of the dissolution rates of basaltic glass as a function of pH and temperature. Geochim. Cosmochim. Acta 2003, 67, 3817–3832. [Google Scholar] [CrossRef]
Figure 1. The map of the sampling area. The site IDs of freshly erupted air-fall pyroclastic products (black circle), and of heaps of pyroclastic wastes from previous volcanic activities (blue circle) are reported.
Ijerph 19 11040 g001
Figure 2. The frequency distributions of 226Ra (a), 232Th (b), and 40K (c) specific activities.
Ijerph 19 11040 g002
Figure 3. The linear relationship between ELCR and the annual effective dose equivalent for all the investigated sampling sites.
Ijerph 19 11040 g003
Figure 4. PCA loading plot of the nine original variables (a). PCA loading plot with the insert of pyroclastic product sampling sites (b).
Ijerph 19 11040 g004
Figure 5. Dendrogram reporting the HCA statistical results.
Ijerph 19 11040 g005
Figure 6. The values of the original variables for the four clusters.
Ijerph 19 11040 g006
Figure 7. PCA loading plot.
Ijerph 19 11040 g007
Figure 8. A representative XRD pattern of the sampled pyroclastic products.
Ijerph 19 11040 g008
Figure 9. Ca-plagioclase (a); Augite (clinopyroxene) (b); Mg-olivine (c); Titanomagnetite (d) Raman spectra, each one being the average of 30 measurements exhibiting similar profiles, collected on different grains of each investigated sample.
Ijerph 19 11040 g009
Table 1. Site IDs, locations, and GPS coordinates.
Site IDSampling SiteGPS Position
LatitudeLongitude
1Zafferana Etnea37.68864115.094988
2Tarderia37.64974815.056632
3Milo37.7145615.116151
4Santa Venerina37.68808915.131235
5Viagrande37.61574315.098462
6S. Giovanni La Punta37.5798415.093265
7Pedara37.61872715.056004
8Rifugio Sapienza37.69898815.001205
9Fleri37.65249215.095406
10Piano del Vescovo37.69900415.053896
Table 2. The GMX settings.
GMX Detector
ParameterValue
FWHM1.94 keV
Peak/Compton 65:1
εr37.5% (at the 1.33 MeV 60Co γ-line)
ΔV−4800 V
ΔεE5 keV–2 MeV
Table 3. The average activity concentrations CRa, CTh, and CK of, respectively, 226Ra, 232Th, and 40K, in the investigated samples.
Site IDCRa
(Bq kg−1 d.w.)
CTh
(Bq kg−1 d.w.)
CK
(Bq kg−1 d.w.)
163.5 ± 7.228.7 ± 3.9515 ± 60
264.6 ± 7.328.8 ± 3.9495 ± 56
363.4 ± 7.129.9 ± 4.3506 ± 58
464.2 ± 7.129.4 ± 4.2528 ± 62
567.5 ± 7.530.0 ± 4.3530 ± 61
650.1 ± 5.721.7 ± 3.0404 ± 47
765.4 ± 7.328.2 ± 3.8514 ± 58
849.4 ± 5.621.6 ± 3.1396 ± 46
962.4 ± 7.127.2 ± 3.9519 ± 61
1063.4 ± 7.128.9 ± 4.0479 ± 55
Table 4. Statistical parameters concerning the natural radionuclides activity concentrations.
Statistically FunctionCRaCThCK
Min49.421.6396
Max67.530.0530
Mean61.3927.45488.6
Geometric mean61.0727.26486.18
Median63.4528.75510.00
Standard deviation 5.973.0046.58
Skewness−1.31−1.26−1.19
Kurtosis 0.05−0.08−0.20
Table 5. Radiological hazard indices in the investigated sampling sites.
Site IDD
(nGy h1)
Raeq
(Bq kg1)
HinHexAEDEout
(µSv y1)
ELCR
(×10−3)
168.11440.560.3983.60.29
267.91440.560.3983.30.29
368.51450.560.3984.00.29
469.41470.570.4085.20.30
571.41510.590.4187.60.31
653.11120.440.3065.10.23
768.71450.570.3984.20.29
852.41110.430.3064.20.22
966.91410.550.3882.20.29
1066.71420.550.3881.80.29
Average65.31380.540.3780.20.28
Table 6. p-value results of different statistic tests used to verify the normal distribution of data.
Variablesp-Value
Shapiro–WilkAnderson-DarlingLilliefors
CRa0.0010.0010.000
CTh0.0020.0020.015
CK0.0060.0060.007
Table 7. Pearson’s correlation matrix.
VariablesCRaCThCKDRaeqHinHexAEDEoutELCR
CRa1
CTh0.9701
CK0.9540.9251
D0.9940.9800.9751
Raeq0.9940.9830.9721.0001
Hin0.9970.9800.9680.9990.9991
Hex0.9940.9830.9721.0001.0000.9991
AEDEout0.9940.9800.9751.0001.0000.9991.0001
ELCR0.9940.9800.9751.0001.0000.9991.0001.0001
Table 8. Significant factors, extracted before the PCA elaboration.
PC1PC2PC3
Eigenvalues8.8970.0770.026
Variability (%)98.8550.8580.287
% Total Variance Explained98.85599.713100.000
Publisher’s Note: MDPI stays neutral with regard to jurisdictional claims in published maps and institutional affiliations.

