
Loss to Follow-Up Risk among HIV Patients on ART in Zimbabwe, 2009–2016: Hierarchical Bayesian Spatio-Temporal Modeling


Abstract
1. Introduction
2. Materials and Methods
2.1. Study Design
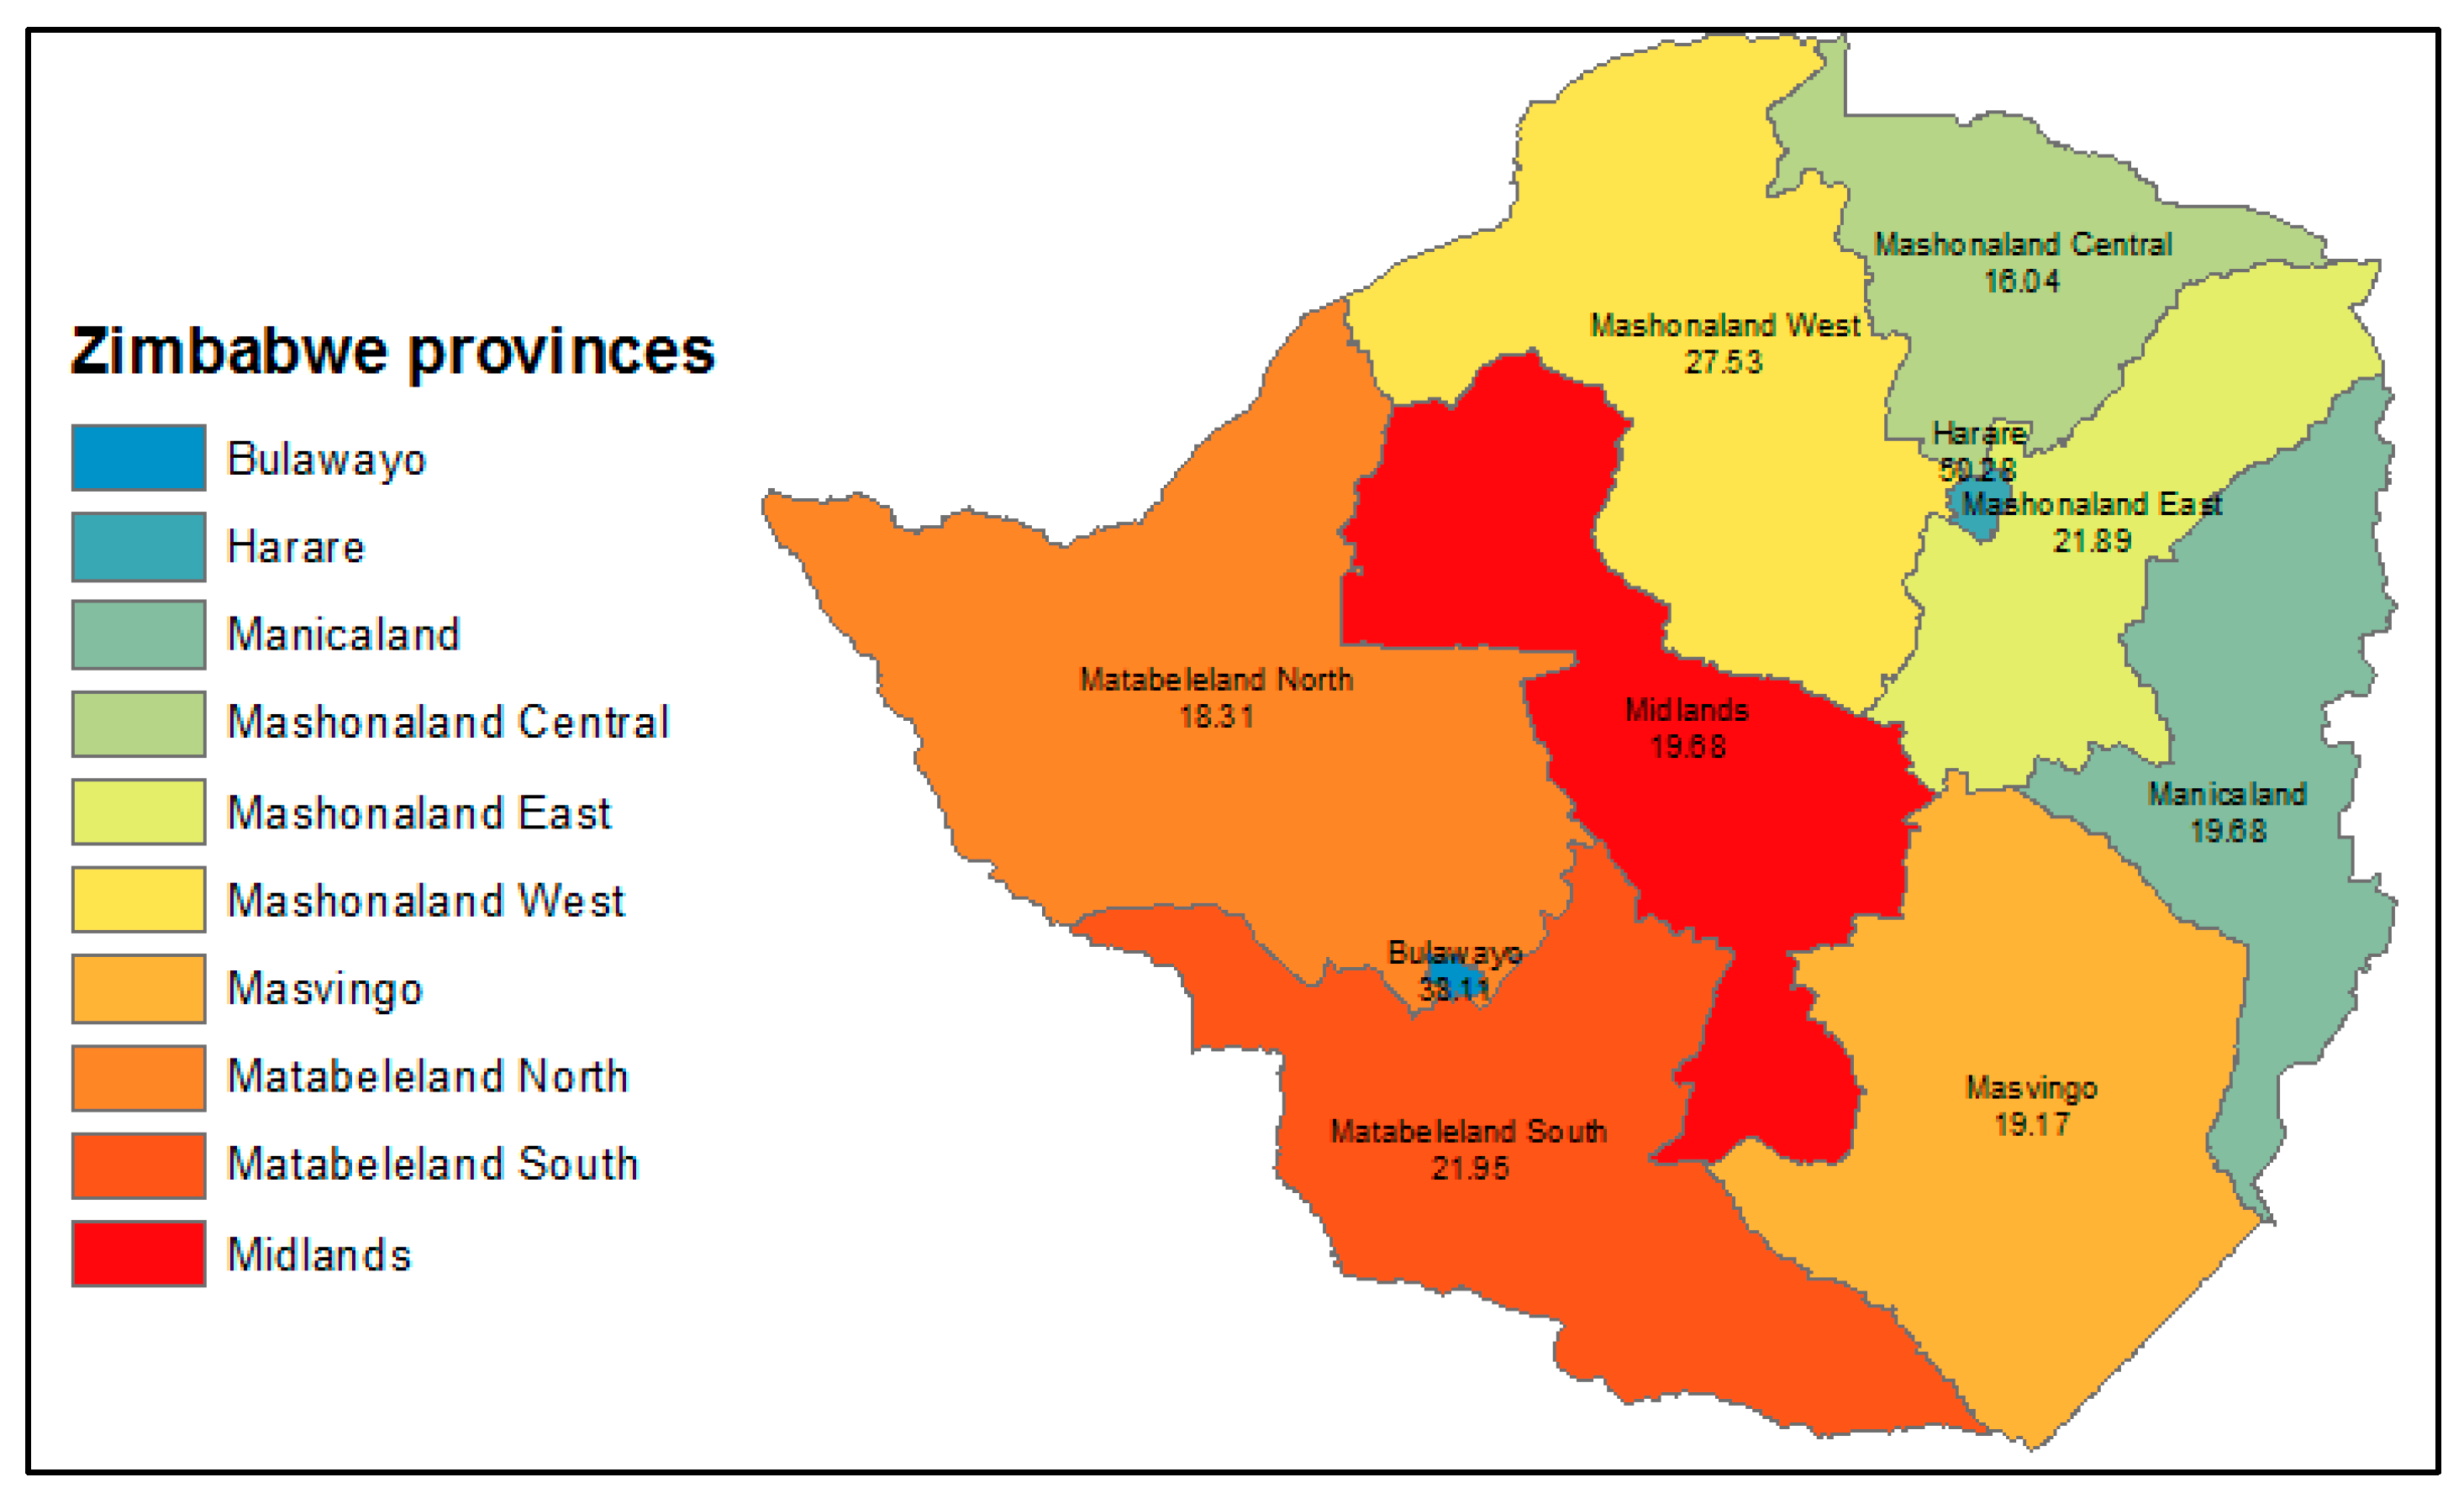
2.2. Study Site
2.3. Data Source
2.4. Statistical Analysis
2.4.1. The Bayesian Spatio-Temporal Poisson Regression Model Specification
Likelihood Function
Linear Predictor Function
The Space-Time Interaction Terms
2.4.2. Bayesian Model Fitting and Model Comparison
3. Results
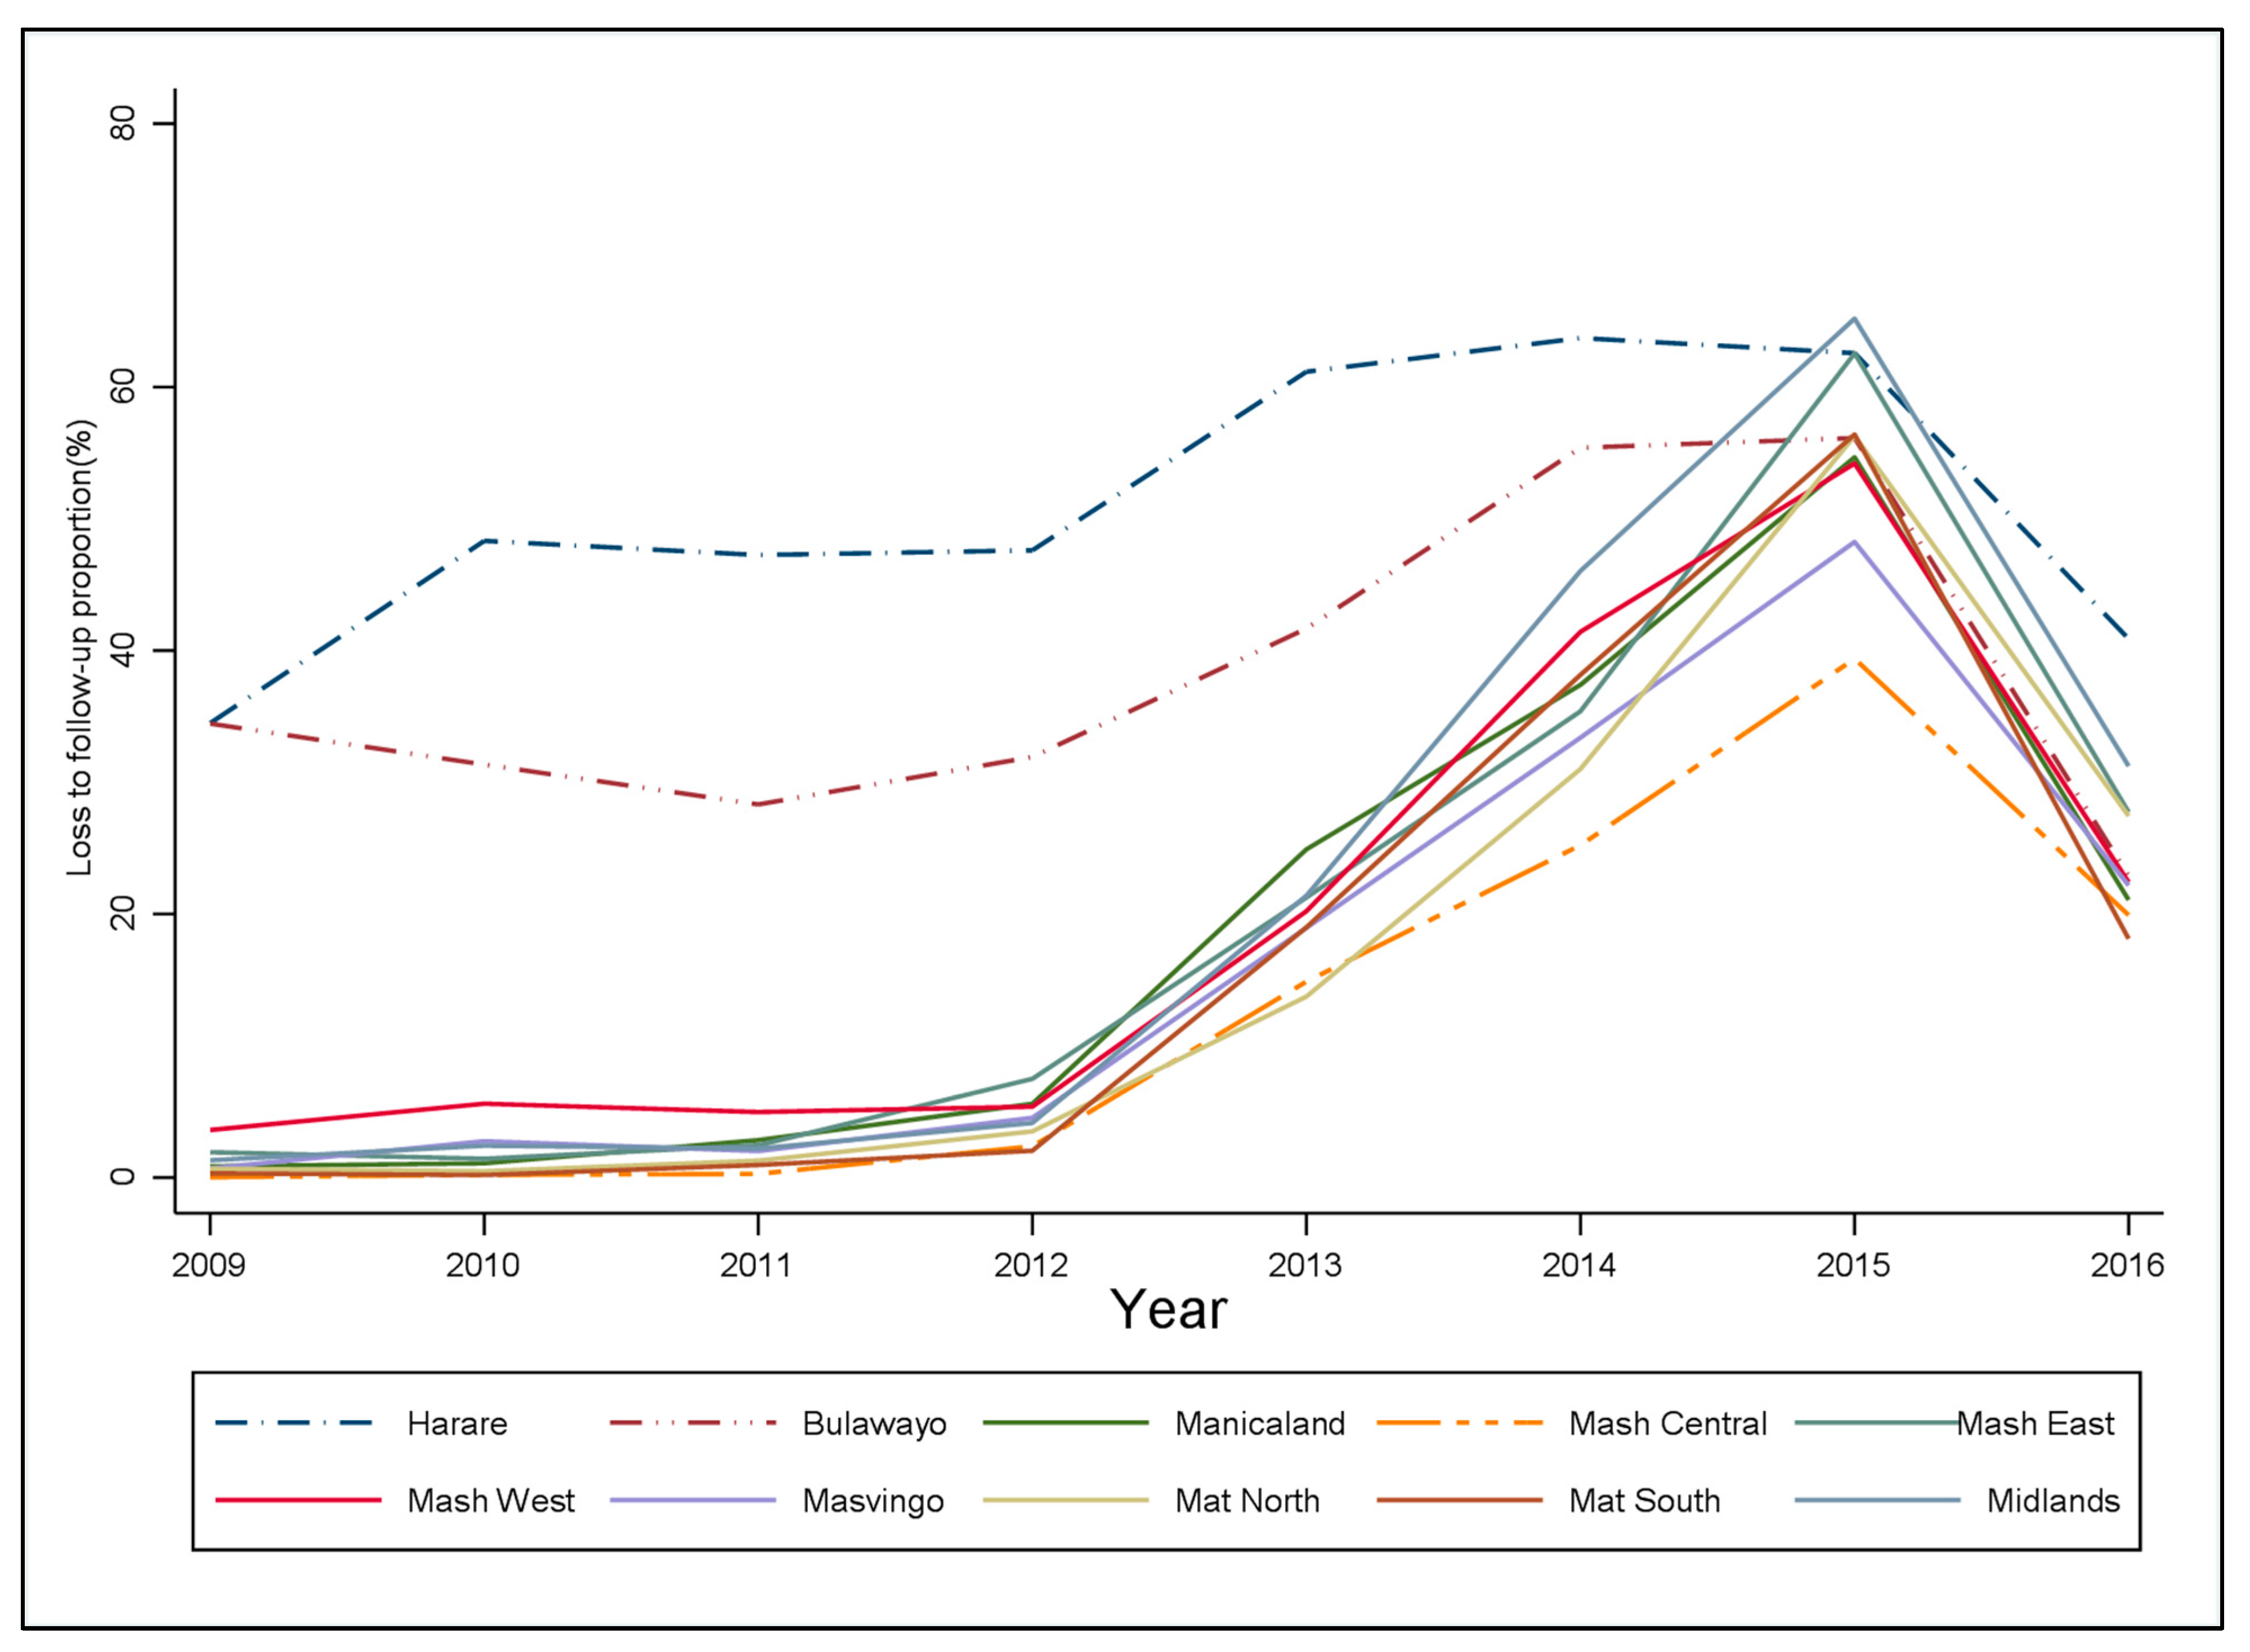
3.1. Loss to Follow-Up Trend and Descriptive Statistics
3.2. Factors Associated with LTFU
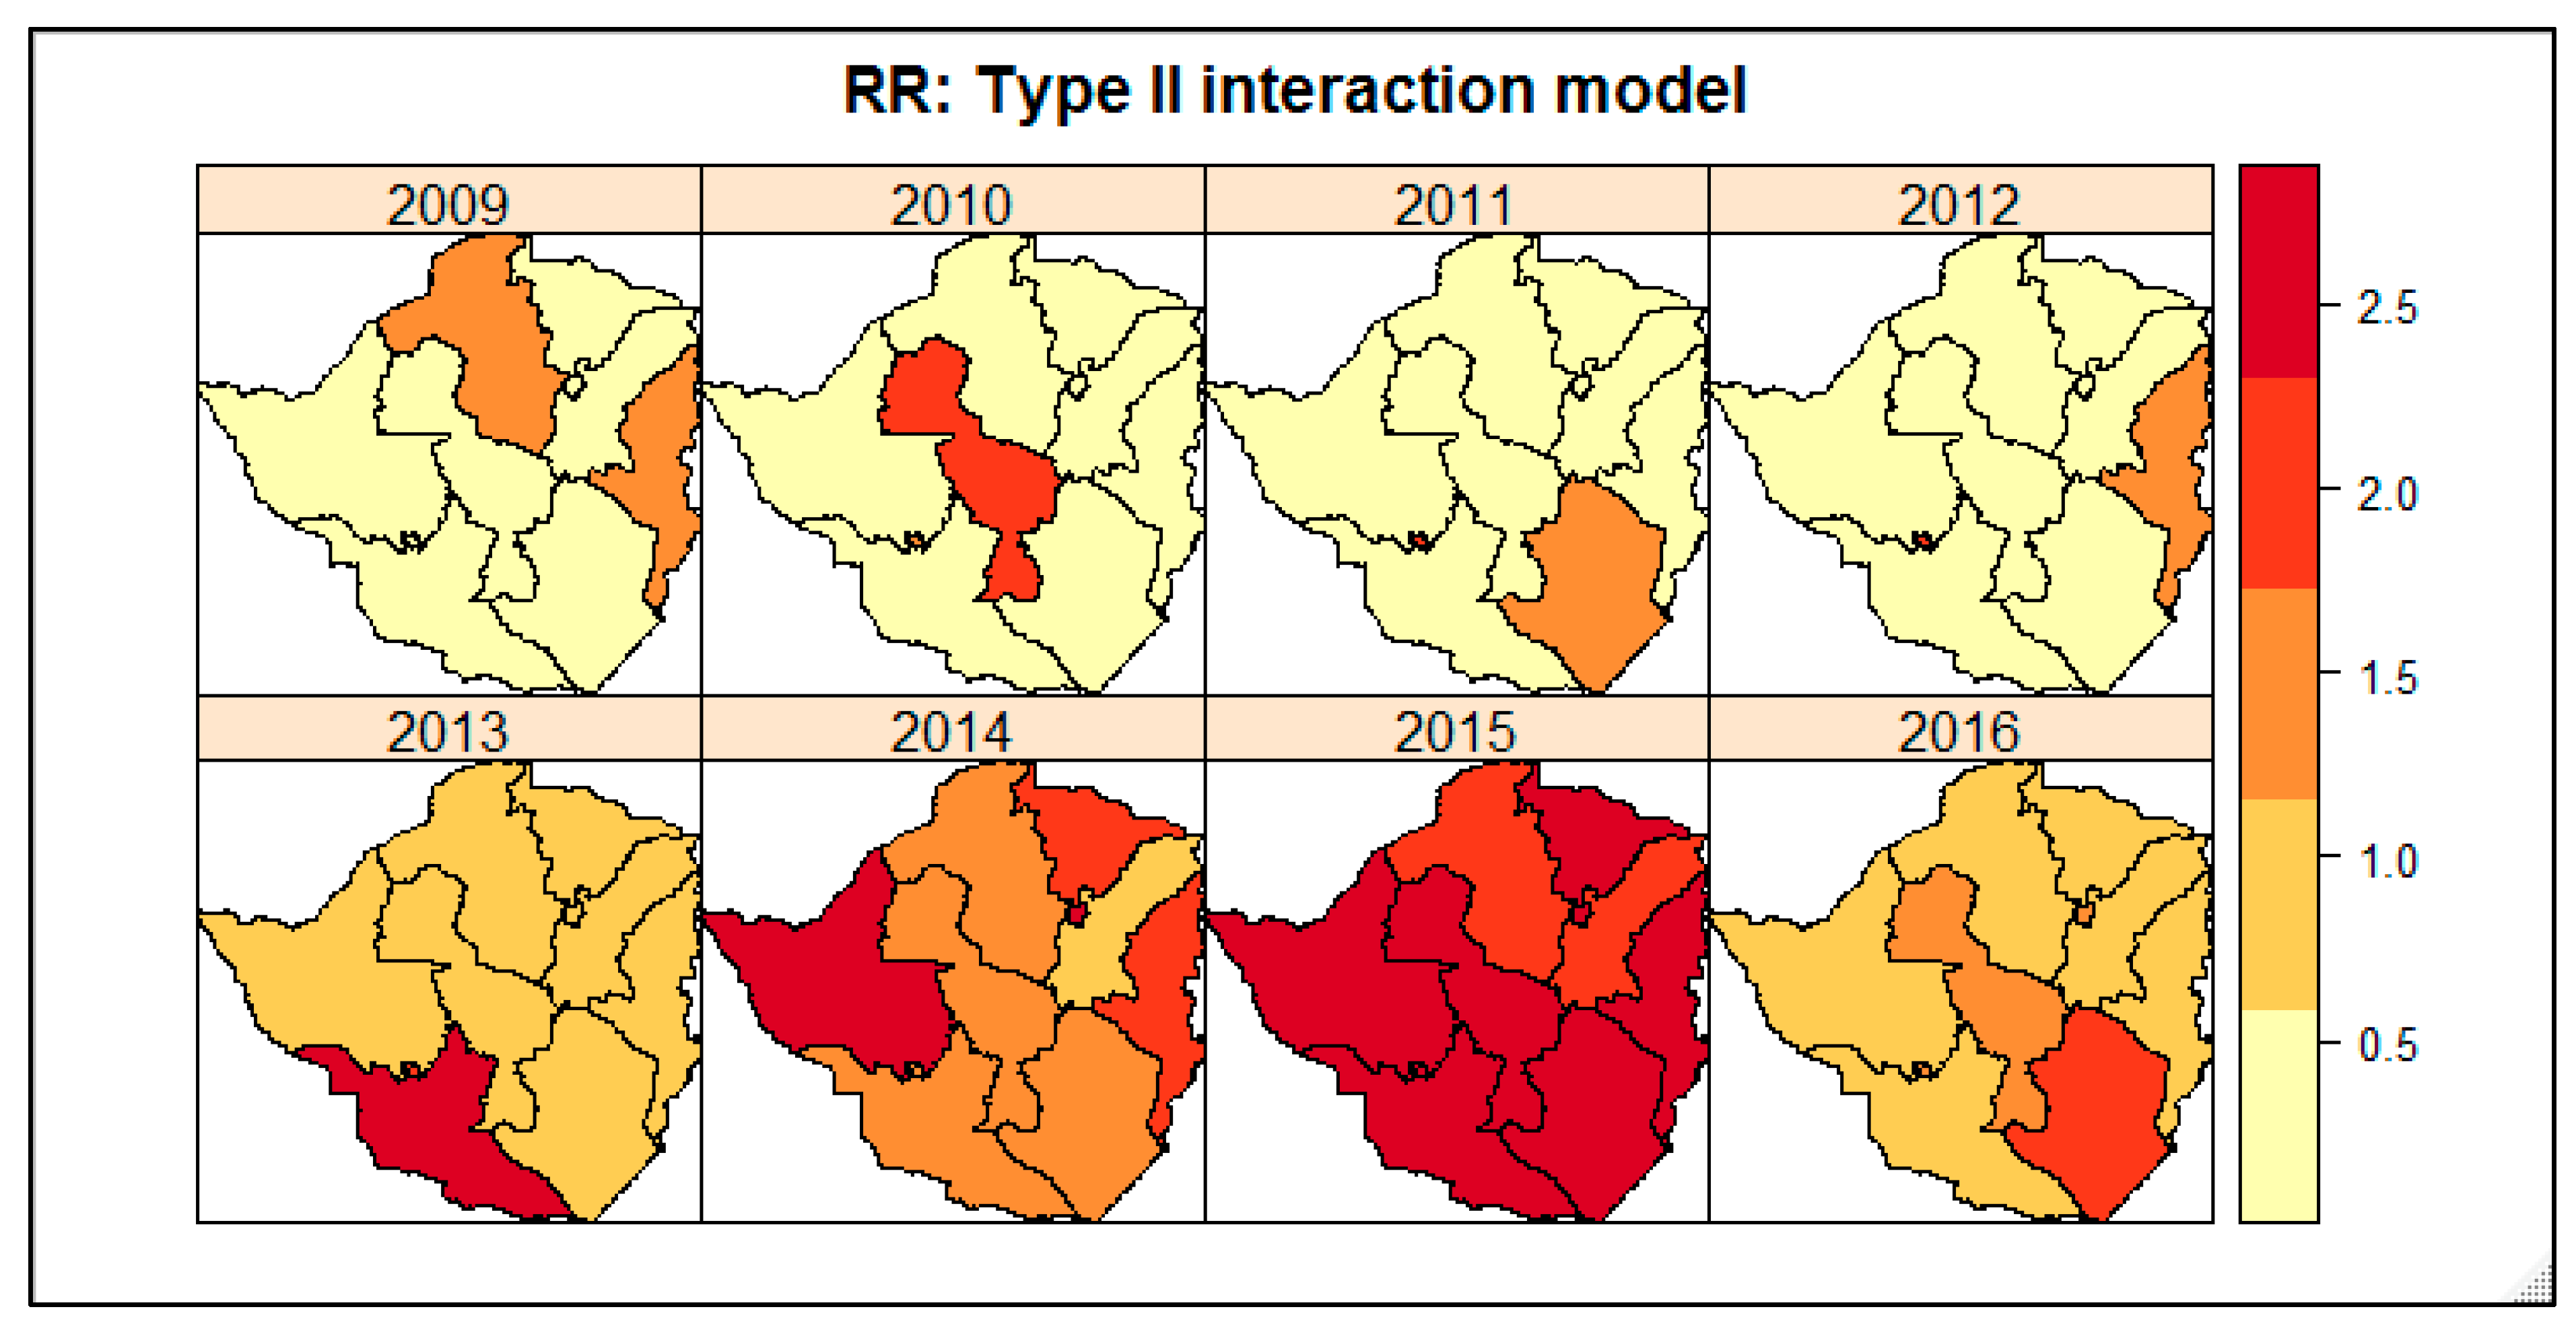
3.3. Spatio-Temporal Patterns of LTFU
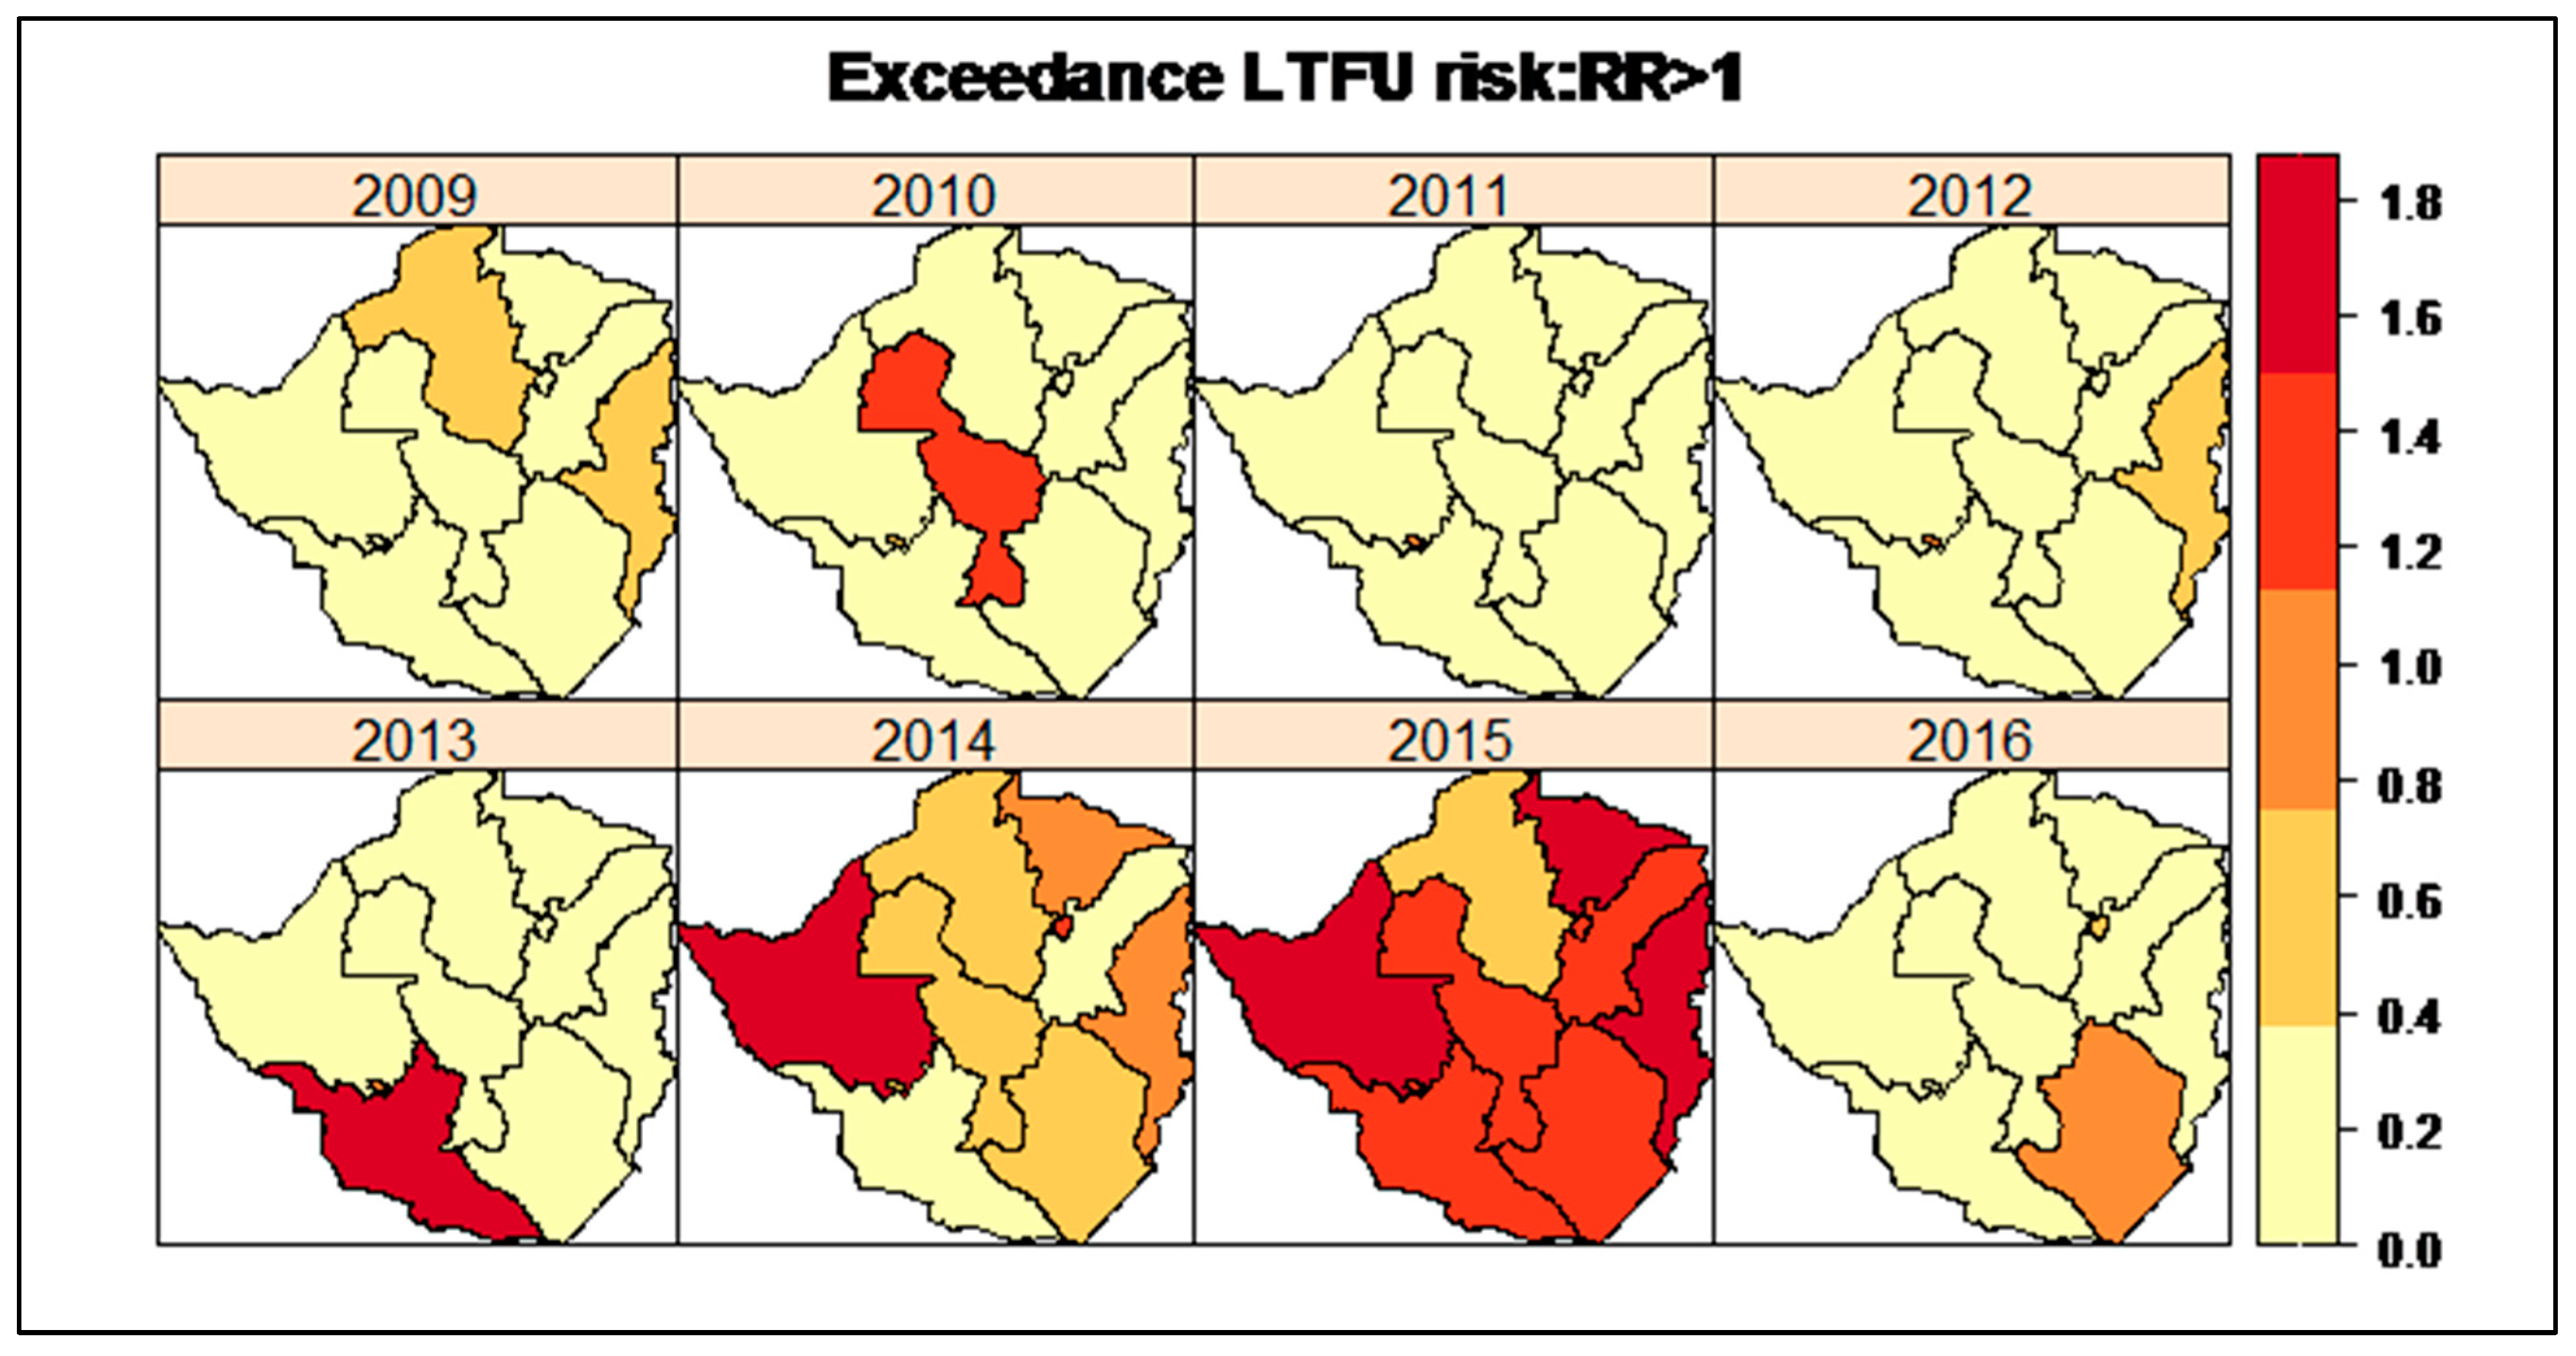
3.4. Provinces with Exceedance LTFU Risk
4. Discussion
5. Conclusions
Supplementary Materials
Author Contributions
Funding
Institutional Review Board Statement
Informed Consent Statement
Data Availability Statement
Acknowledgments
Conflicts of Interest
References
- Nosyk, B.; Min, J.; Lima, V.D.; Yip, B.; Hogg, R.; Montaner, J.S.G. HIV-1 Disease Progression During Highly Active Antiretroviral Therapy: An application using population-level data in British Columbia: 1996–2011. JAIDS J. Acquir. Immune Defic. Syndr. 2013, 63, 653–659. [Google Scholar] [CrossRef]
- Tlhajoane, M.; Masoka, T.; Mpandaguta, E.; Rhead, R.; Church, K.; Wringe, A.; Kadzura, N.; Arinaminpathy, N.; Nyamukapa, C.; Schur, N.; et al. A longitudinal review of national HIV policy and progress made in health facility implementation in Eastern Zimbabwe. Health Res. Policy Syst. 2018, 16, 92. [Google Scholar] [CrossRef]
- Babo, Y.D.; Alemie, G.A.; Fentaye, F.W. Predictors of first-line antiretroviral therapy failure amongst HIV-infected adult clients at Woldia Hospital, Northeast Ethiopia. PLoS ONE 2017, 12, e0187694. [Google Scholar] [CrossRef]
- UNAIDS. Undetectable = Untransmittable Public Health and HIV Viral Load Suppression 2018; pp. 1–4. Available online: http://www.unaids.org/sites/default/files/media_asset/undetectable-untransmittable_en.pdf (accessed on 5 February 2019).
- UNAIDS. 90-90-90. An Ambitious Treatment Target to Help End the AIDS Epidemic. United Nations 2014. Available online: http://www.unaids.org/sites/default/files/media_asset/90-90-90_en.pdf (accessed on 25 January 2019).
- Zingoni, Z.M.; Chirwa, T.; Todd, J.; Musenge, E. Competing risk of mortality on loss to follow-up outcome among patients with HIV on ART: A retrospective cohort study from the Zimbabwe national ART programme. BMJ Open 2020, 10, e036136. [Google Scholar] [CrossRef]
- Mutasa-Apollo, T.; Shiraishi, R.W.; Takarinda, K.C.; Dzangare, J.; Mugurungi, O.; Murungu, J.; Abdul-Quader, A.; Woodfill, C.J. Patient retention, clinical outcomes and attrition-associated factors of HIV-infected patients enrolled in Zimbabwe’s National Antiretroviral Therapy Programme, 2007–2010. PLoS ONE 2014, 9, e86305. [Google Scholar] [CrossRef]
- Makurumidze, R.; Mutasa-Apollo, T.; DeCroo, T.; Choto, R.C.; Takarinda, K.C.; Dzangare, J.; Lynen, L.; Van Damme, W.; Hakim, J.; Magure, T.; et al. Retention and predictors of attrition among patients who started antiretroviral therapy in Zimbabwe’s national antiretroviral therapy programme between 2012 and 2015. PLoS ONE 2020, 15, e0222309. [Google Scholar] [CrossRef]
- Ferrand, R.A.; Simms, V.; Dauya, E.; Bandason, T.; Mchugh, G.; Mujuru, H.; Chonzi, P.; Busza, J.; Kranzer, K.; Munyati, S.; et al. The effect of community-based support for caregivers on the risk of virological failure in children and adolescents with HIV in Harare, Zimbabwe (ZENITH): An open-label, randomised controlled trial. Lancet Child Adolesc. Health 2017, 1, 175–183. [Google Scholar] [CrossRef]
- Ministry of Health and Child Care; National AIDS Council. Global AIDS Response Progress-Fact Track Commitment to End by 2030. In Gam Zimbabwe Country Report 2017; UNAIDS: Geneva, Switzerland, 2017; pp. 1–24. Available online: http://www.unaids.org/sites/default/files/country/documents/ZWE_2018_countryreport.pdf (accessed on 27 September 2018).
- Anderson, C.; Lee, D.; Dean, N. Bayesian Cluster Detection via Adjacency Modelling. Spat. Spatio-Temporal Epidemiol. 2016, 16, 11–20. [Google Scholar] [CrossRef]
- Besag, J.; York, J.; Mollie, A. Bayesian image restoration, with two applications in spatial statistics. Ann. Inst. Stat. Math. 1991, 43, 1–59. [Google Scholar] [CrossRef]
- Moraga, P. Small Area Disease Risk Estimation and Visualization Using R. R J. 2018, 10, 495–506. [Google Scholar] [CrossRef]
- Knorr-Held, L. Bayesian modelling of inseparable space-time variation in disease risk. Stat. Med. 2000, 19, 2555–2567. [Google Scholar] [CrossRef]
- Spiegelhalter, D.J.; Best, N.G.; Carlin, B.P.; van der Linde, A. Bayesian measures of model complexity and fit. J. R. Stat. Soc. Ser. B Stat. Methodol. 2002, 64, 583–639. [Google Scholar] [CrossRef]
- Ministry of Health and Child Care. Zimbabwe Electronic Patient Management System Strategic Plan Document (Draft Report Version 1.0.2); Ministry of Health and Child Care: Harare, Zimbabwe, 2012; pp. 1–52. [Google Scholar]
- Geng, E.H.; Odeny, T.A.; Lyamuya, R.; Nakiwogga-Muwanga, A.; Diero, L.; Bwana, M.; Braitstein, P.; Somi, G.; Kambugu, A.; Bukusi, E.; et al. Retention in Care and Patient-Reported Reasons for Undocumented Transfer or Stopping Care Among HIV-Infected Patients on Antiretroviral Therapy in Eastern Africa: Application of a Sampling-Based Approach. Clin. Infect. Dis. 2016, 62, 935–944. [Google Scholar] [CrossRef]
- Matsena Zingoni, Z.; Chirwa, T.F.; Todd, J.; Musenge, E. HIV Disease Progression among Antiretroviral Therapy Patients in Zimbabwe: A Multistate Markov Model. Front. Public Health 2019, 7, 326. [Google Scholar] [CrossRef]
- Matsena Zingoni, Z.; Chirwa, T.F.; Todd, J.; Musenge, E. Markov modelling of viral load adjusting for CD4 orthogonal variable and multivariate conditional autoregressive mapping of the HIV immunological outcomes among ART patients in Zimbabwe. Theor. Biol. Med. Model. 2021, 18, 16. [Google Scholar] [CrossRef]
- Tadesse, K.; Haile, F. Predictors of Loss to Follow Up of Patients Enrolled on Antiretroviral Therapy: A Retrospective Cohort Study. AIDS Clin. Res. 2014, 5, 1–6. [Google Scholar]
- Weigel, R.; Estill, J.; Egger, M.; Harries, A.; Makombe, S.; Tweya, H.; Jahn, A.; Keiser, O. Mortality and loss to follow-up in the first year of ART. AIDS 2012, 26, 365–373. [Google Scholar] [CrossRef]
- Alvarez-Uria, G.; Naik, P.K.; Pakam, R.; Midde, M. Factors associated with attrition, mortality, and loss to follow up after an-tiretroviral therapy initiation: Data from an HIV cohort study in India. Glob. Health Action 2013, 6, 21682. [Google Scholar] [CrossRef] [PubMed]
- Mugisha, V.; Teasdale, C.A.; Wang, C.; Sanau, M.L.; Nuwagaba-Biribonwoha, H.; Tayebwa, E.; Ingabire, E.; Ingabire, P.; Sahabo, R.; Twyman, P.; et al. Determinants of Mortality and Loss to Follow-Up among Adults Enrolled in HIV Care Services in Rwanda. PLoS ONE 2014, 9, 1–9. [Google Scholar] [CrossRef]
- Palacio-Vieira, J.; Reyes-Urueña, J.M.; Imaz, A.; Bruguera, A.; Force, L.; Llaveria, A.O.; Llibre, J.M.; Vilaró, I.; Borràs, F.H.; Falcó, V.; et al. Strategies to reengage patients lost to follow up in HIV care in high income countries, a scoping review. BMC Public Health 2021, 21, 1596. [Google Scholar] [CrossRef]
- Zimbabwe Ministry of Health and Child Care (MOHCC). Zimbabwe Population-Based HIV Impact Assessment (ZIMPHIA) 2015–2016: First Report; MOHCC: Harare, Zimbabwe, 2017; pp. 1–79. Available online: https://phia.icap.columbia.edu/wp-content/uploads/2017/11/ZIMPHIA_First_Report_FINAL.pdf (accessed on 7 December 2019).
- National AIDS Council. Extended Zimbabwe National HIV and AIDS Strategic Plan (ZNASP) 2015–2020. Ministry of Health and Child Care 2020: 2015–2020. Available online: https://procurement-notices.undp.org/view_file.cfm?doc_id=114051 (accessed on 16 March 2022).
- Zingoni, Z.M.; Chirwa, T.F.; Todd, J.; Musenge, E. Spatial Heterogeneity of Viral Suppression and Viral Rebound Patterns among ART Patients in Zimbabwe from 2004 to 2017: A Bayesian Mixed Effects Multistate Model. Int. J. Stat. Med. Res. 2020, 8, 98–113. [Google Scholar] [CrossRef]


| Parameter | Parameter Definition | Prior Specification |
|---|---|---|
| This is the mean log overall LTFU risk over all regions. | The parameter was assumed to follow a flat distribution, i.e., to have a “sum to zero” constraint for the structured spatial parameter. | |
| This denotes the fixed effects regression coefficients associated with explanatory variables . | The regression coefficients, , were assumed to follow a non-informative Gaussian distribution with a mean and a wide variance, i.e., , with precision . | |
| The spatial random effects were partitioned into two components were defined as the structured spatial random effects that allow for smoothing amongst adjacent areas and defined as the unstructured spatial random effects to account for the extra-Poisson variability in the observed LTFU counts data [13]. | The unstructured spatial random effects were assumed Gaussian priors, , with precision . The BYM model assumes spatial dependence between neighbouring areas; hence, the spatial polygons were assumed to follow a Gaussian distribution, i.e., where is the mean parameter and is the part of the variance parameter of the structured spatial component. The represents the number of neighbours and represents the sets of neighbours for the region . | |
| This parameter defined the temporal random effects common to all regions. | The temporal random effects were assumed first-order random walk priors and . | |
| This component defined the space-time interaction random effects that explain differences in the time trend of LTFU risk for different regions. | To investigate the space-time interaction, the was modelled as a Gaussian parameter with a precision matrix where is an unknown scalar and is the correlation structure matrix defining the temporal and/or spatial dependence between the elements of . |
| Provinces | Sex (Females) N (%) | Age at ART Initiation Mean ± SD | Tuberculosis Infection (Positive) N (%) | WHO Clinical Stage (Stage III/IV) N (%) | Duration on ART Median(IQR) |
|---|---|---|---|---|---|
| Harare | 9395 (65.77) | 37.8 ± 10.6 | 363 (2.54) | 7251 (50.76) | 2.6 (1.2–5.8) |
| Bulawayo | 5059 (63.0) | 38.9 ± 10.9 | 297 (3.7) | 3699 (46.06) | 2.6 (1.1–5.6) |
| Manicaland | 28,410 (66.07) | 37.6 ± 11.4 | 465 (1.08) | 25,872 (60.17) | 3.7 (2.1–6.5) |
| Mashonaland Central | 23,829 (66.09) | 37.4 ± 11.5 | 225 (0.62) | 23,696 (65.68) | 3.1 (1.7–5.7) |
| Mashonaland East | 36,584 (65.72) | 36.8 ± 11.2 | 625 (1.12) | 30,647 (54.99) | 3.6 (2.1–5.7) |
| Mashonaland West | 33,812 (64.72) | 37.2 ± 11.1 | 583 (1.12) | 31,218 (59.75) | 2.8 (1.8–4.4) |
| Masvingo | 39,614 (66.47) | 37.9 ± 11.6 | 669 (1.12) | 28,621 (48.02) | 3.3 (1.9–5.7) |
| Matabeleland North | 22,677 (63.73) | 37.2 ± 11.8 | 436 (1.23) | 16,463 (46.27) | 3.6 (2.1–5.9) |
| Matabeleland South | 25,977 (66.14) | 36.7 ± 11.8 | 562 (1.43) | 20,911 (53.24) | 3.3 (1.9–5.3) |
| Midlands | 30,487 (64.95) | 37.6 ± 11.4 | 591 (1.26) | 23,439 (49.94) | 3.7 (2.1–6.2) |
| Variables | Province-Level Spatial Unit | ||||
|---|---|---|---|---|---|
| Non-Spatio-Temporal Model RR (95%CI) | Spatio-Temporal Model RR (95%CI) | Type I Interaction Model RR (95%CI) | Type II Interaction Model RR (95%CI) | Type III Interaction Model RR (95%CI) | |
| Sex | |||||
| Male | Reference | Reference | Reference | Reference | Reference |
| Female | 0.914 (0.91–0.92) | 0.975 (0.97–0.98) | 0.915 (0.81–1.04) | 0.976 (0.94–1.01) | 1.011 (1.97–1.05) |
| Age at ART initiation | |||||
| (mean age in years) | 0.601 (0.68–0.71) | 0.818 (0.79–0.84) | 1.092 (0.79–1.51) | 1.004 (1.00–1.01) | 1.014 (0.97–1.06) |
| Tuberculosis co-infection | |||||
| No | Reference | Reference | Reference | Reference | Reference |
| Yes | 0.747 (0.74–0.76) | 0.616 (0.61–0.63) | 0.700 (0.59–0.83) | 0.895 (0.77–1.05) | 0.701 (0.61–0.81) |
| WHO staging | |||||
| I/II | Reference | Reference | Reference | Reference | Reference |
| III/IV | 1.025 (1.02–1.03) | 1.014 (1.01–1.02) | 0.967 (0.93–1.00) | 0.993 (0.97–1.01) | 0.981 (0.96–1.00) |
| Duration on ART | |||||
| (average time since ART initiation | 0.601 (0.59–0.61) | 0.742 (0.71–0.77) | 0.618 (0.44–0.85) | 0.651 (0.59–0.71) | 0.736 (0.56–0.97) |
| Information criterion | |||||
| DIC | 9367.17 | 3079.93 | 787.33 | 784.08 | 789.36 |
| WAIC | 21,338.73 | 6647.31 | 768.86 | 766.81 | 772.89 |
| pD | 3677.72 | 1222.38 | 78.08 | 41.95 | 44.48 |
| Marginal log-likelihood | −8520.78 | −2699.27 | −635.33 | −600.38 | −628.81 |
Publisher’s Note: MDPI stays neutral with regard to jurisdictional claims in published maps and institutional affiliations. |
© 2022 by the authors. Licensee MDPI, Basel, Switzerland. This article is an open access article distributed under the terms and conditions of the Creative Commons Attribution (CC BY) license (https://creativecommons.org/licenses/by/4.0/).
Share and Cite
Matsena Zingoni, Z.; Chirwa, T.; Todd, J.; Musenge, E. Loss to Follow-Up Risk among HIV Patients on ART in Zimbabwe, 2009–2016: Hierarchical Bayesian Spatio-Temporal Modeling. Int. J. Environ. Res. Public Health 2022, 19, 11013. https://doi.org/10.3390/ijerph191711013
Matsena Zingoni Z, Chirwa T, Todd J, Musenge E. Loss to Follow-Up Risk among HIV Patients on ART in Zimbabwe, 2009–2016: Hierarchical Bayesian Spatio-Temporal Modeling. International Journal of Environmental Research and Public Health. 2022; 19(17):11013. https://doi.org/10.3390/ijerph191711013
Chicago/Turabian StyleMatsena Zingoni, Zvifadzo, Tobias Chirwa, Jim Todd, and Eustasius Musenge. 2022. "Loss to Follow-Up Risk among HIV Patients on ART in Zimbabwe, 2009–2016: Hierarchical Bayesian Spatio-Temporal Modeling" International Journal of Environmental Research and Public Health 19, no. 17: 11013. https://doi.org/10.3390/ijerph191711013
APA StyleMatsena Zingoni, Z., Chirwa, T., Todd, J., & Musenge, E. (2022). Loss to Follow-Up Risk among HIV Patients on ART in Zimbabwe, 2009–2016: Hierarchical Bayesian Spatio-Temporal Modeling. International Journal of Environmental Research and Public Health, 19(17), 11013. https://doi.org/10.3390/ijerph191711013