

A Study on a Neural Network Risk Simulation Model Construction for Avian Influenza A (H7N9) Outbreaks in Humans in China during 2013–2017

Abstract
:1. Introduction
2. Materials and Methods
2.1. Data Collection
2.2. Research Methods
2.2.1. Spatial Autocorrelation Analysis
2.2.2. Neural Network Risk Simulation Model of H7N9 Outbreaks
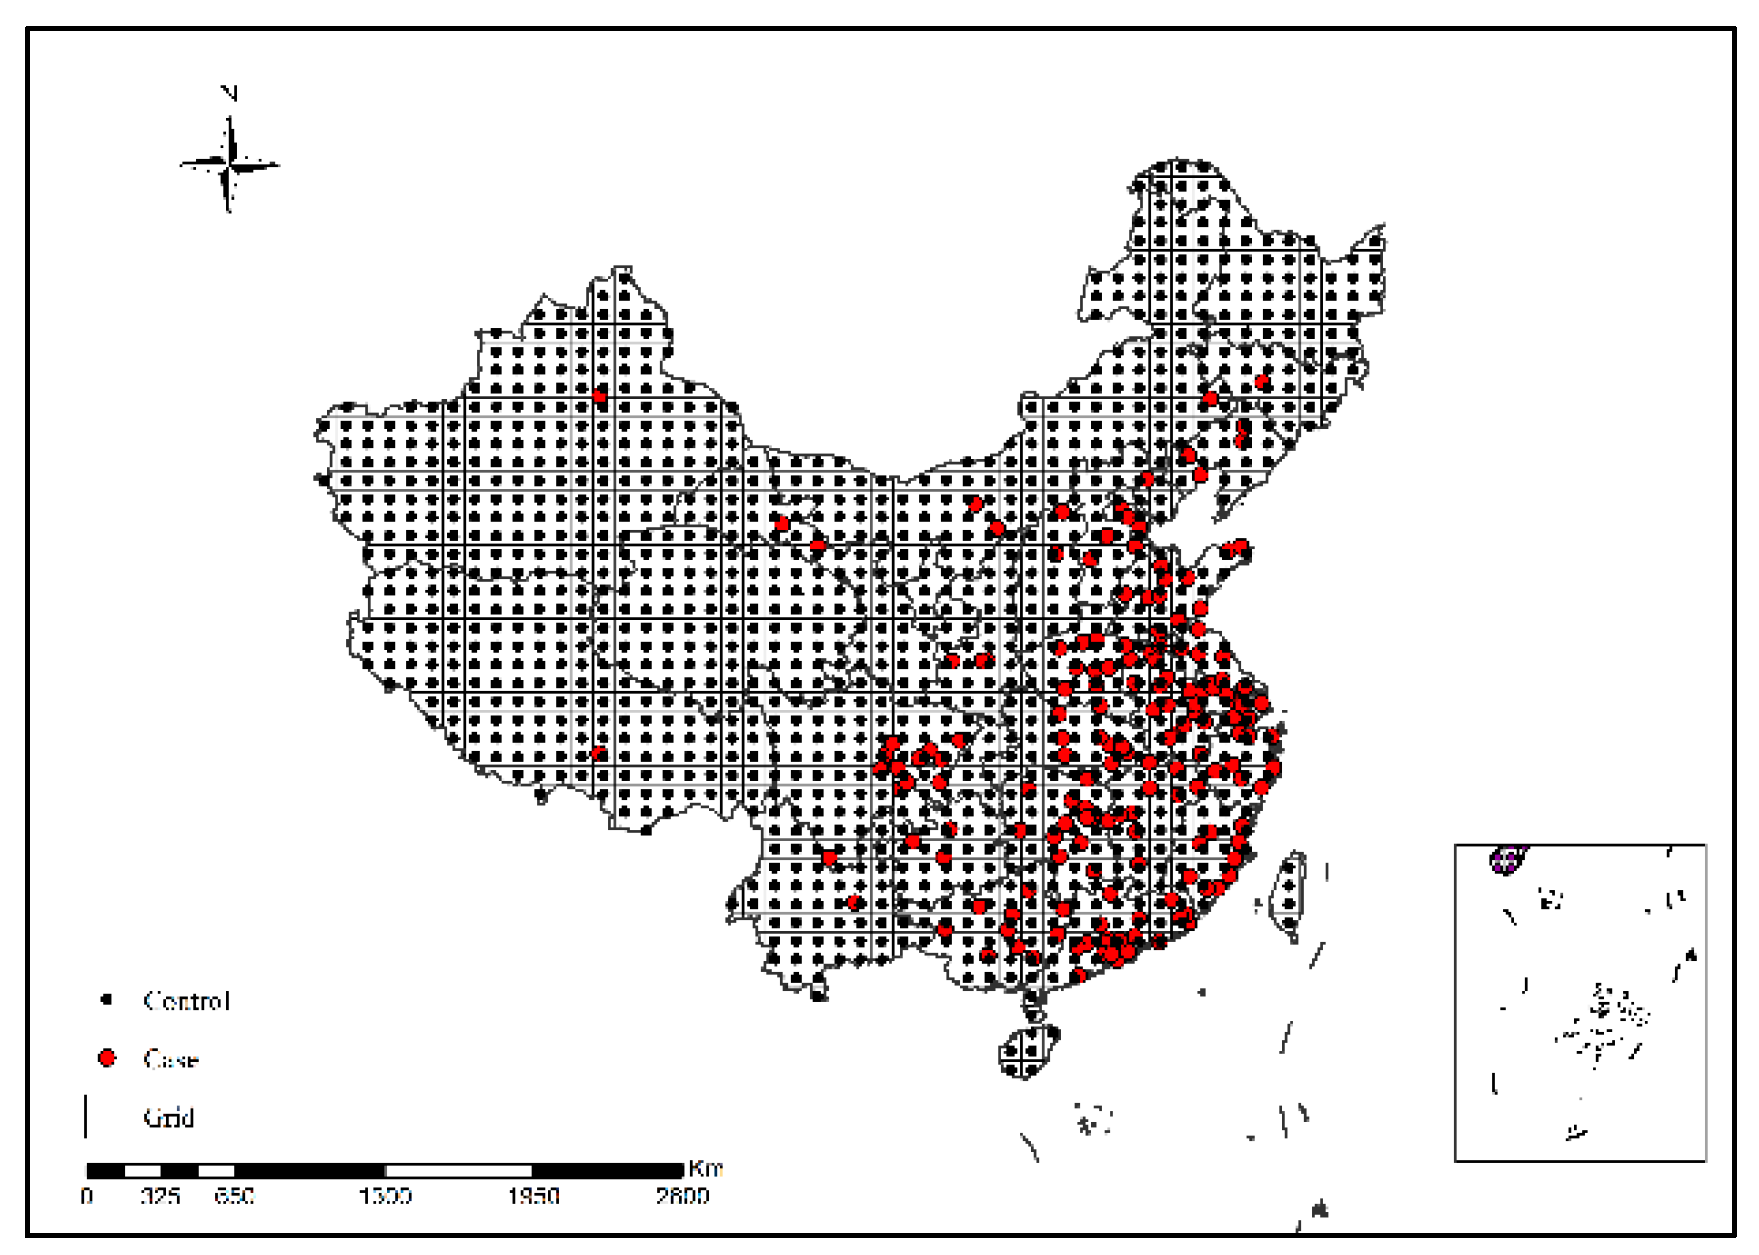
Sample Collection
Neural Network Modeling
3. Results
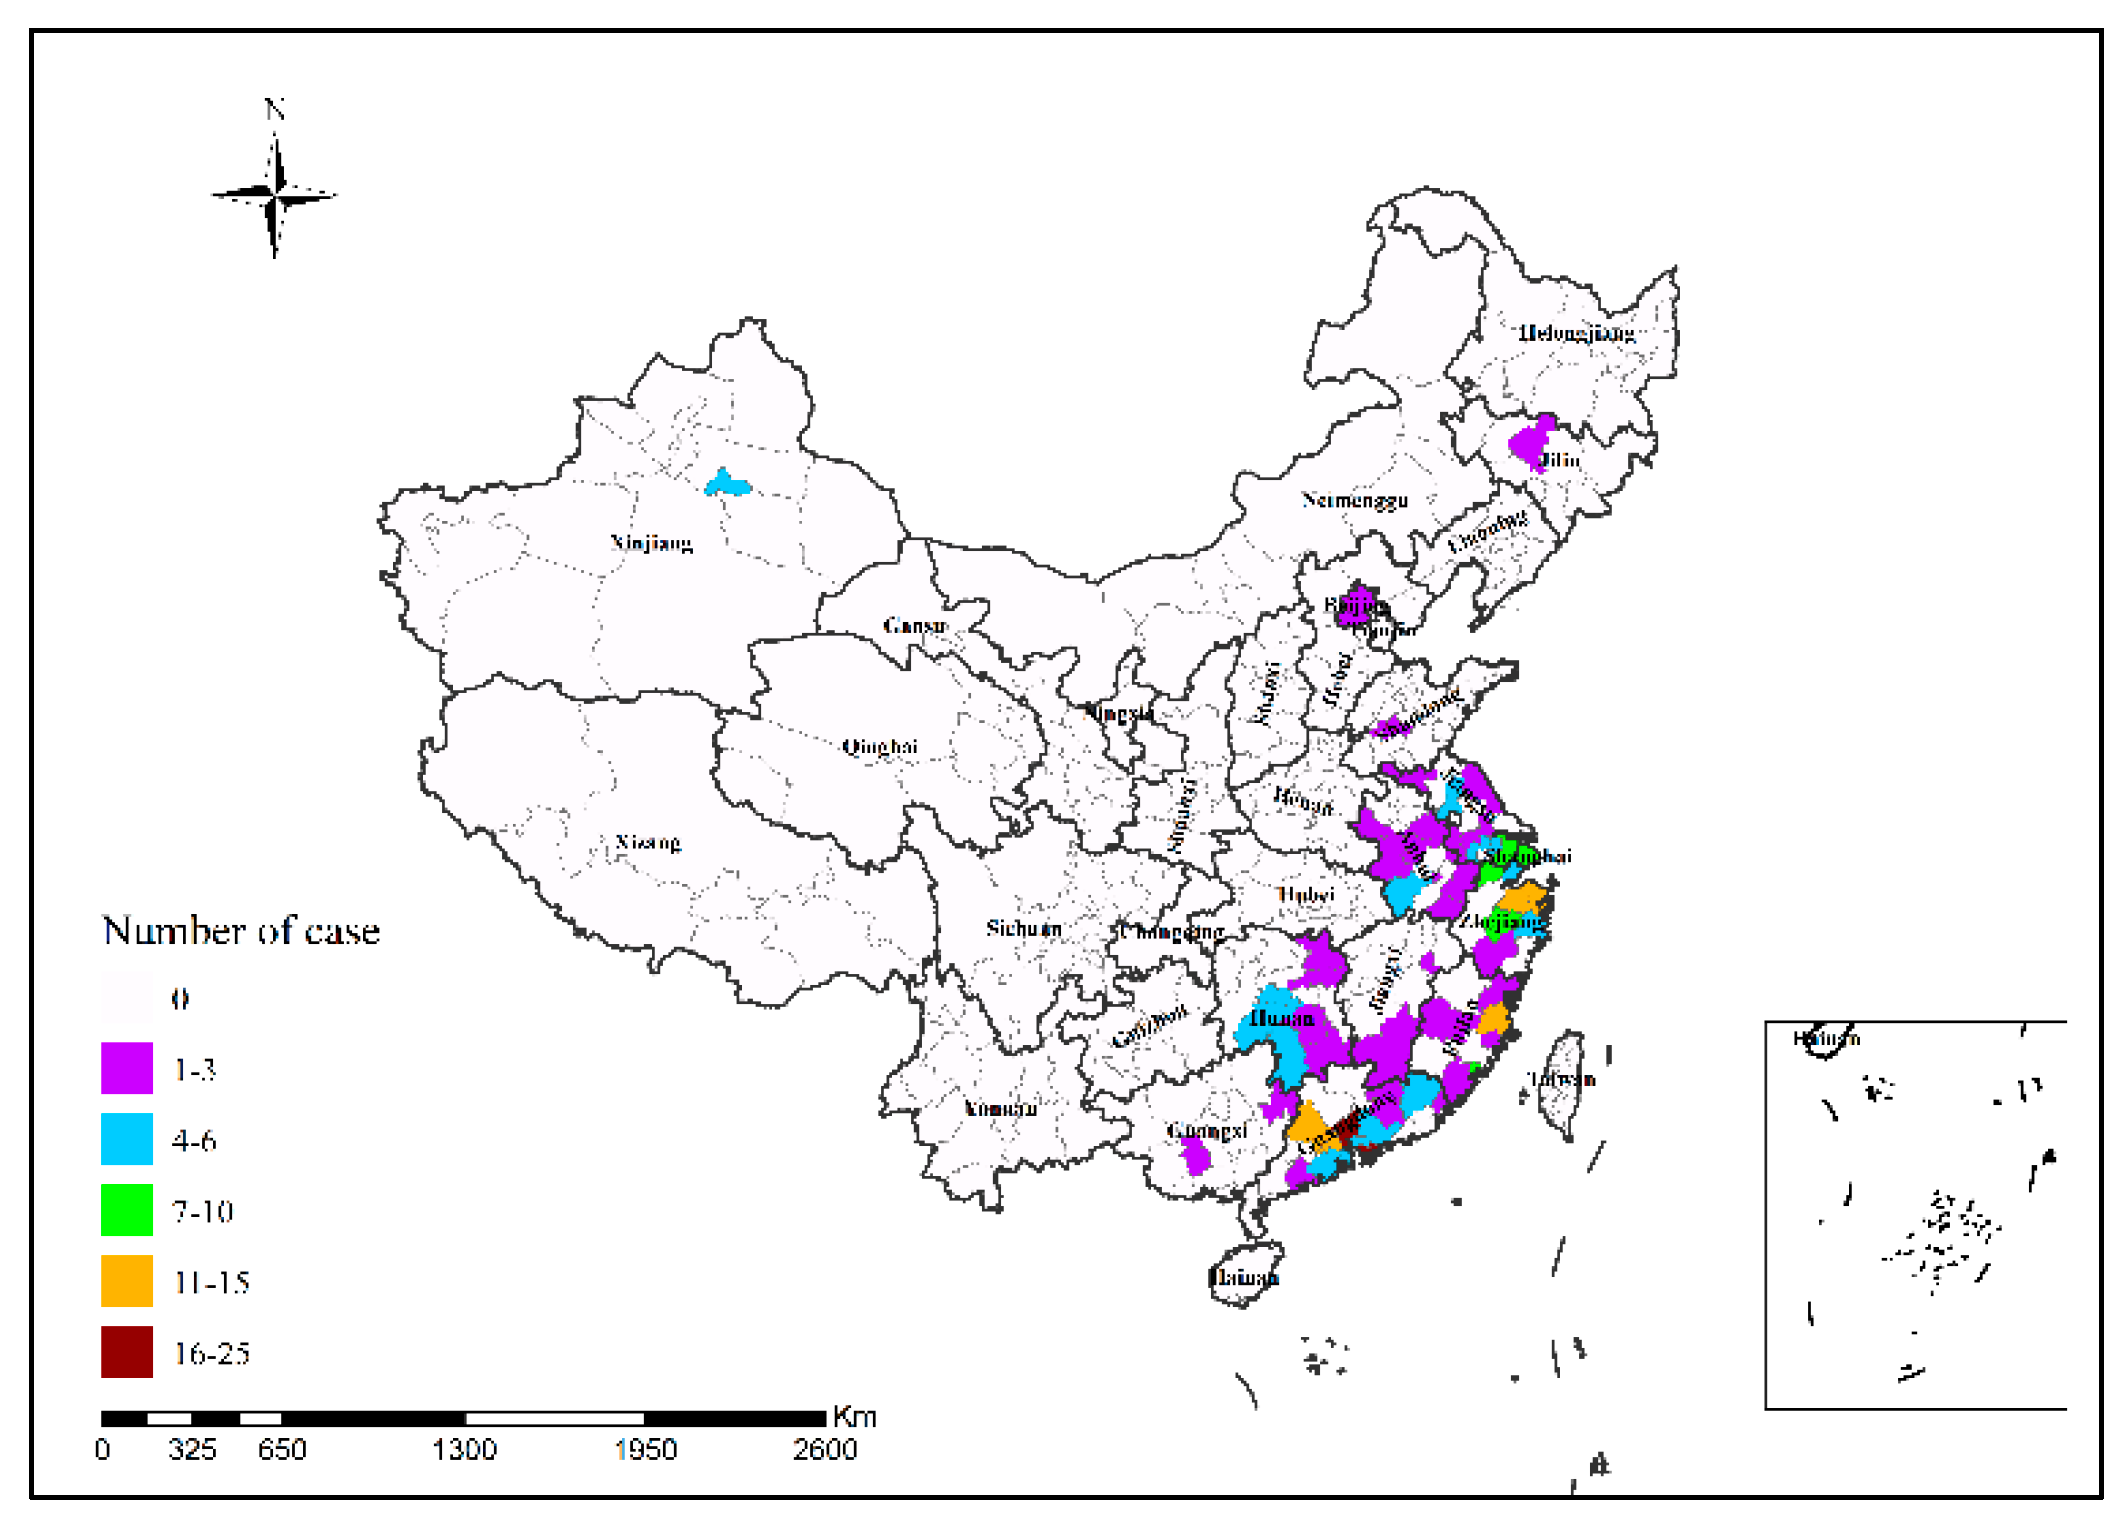
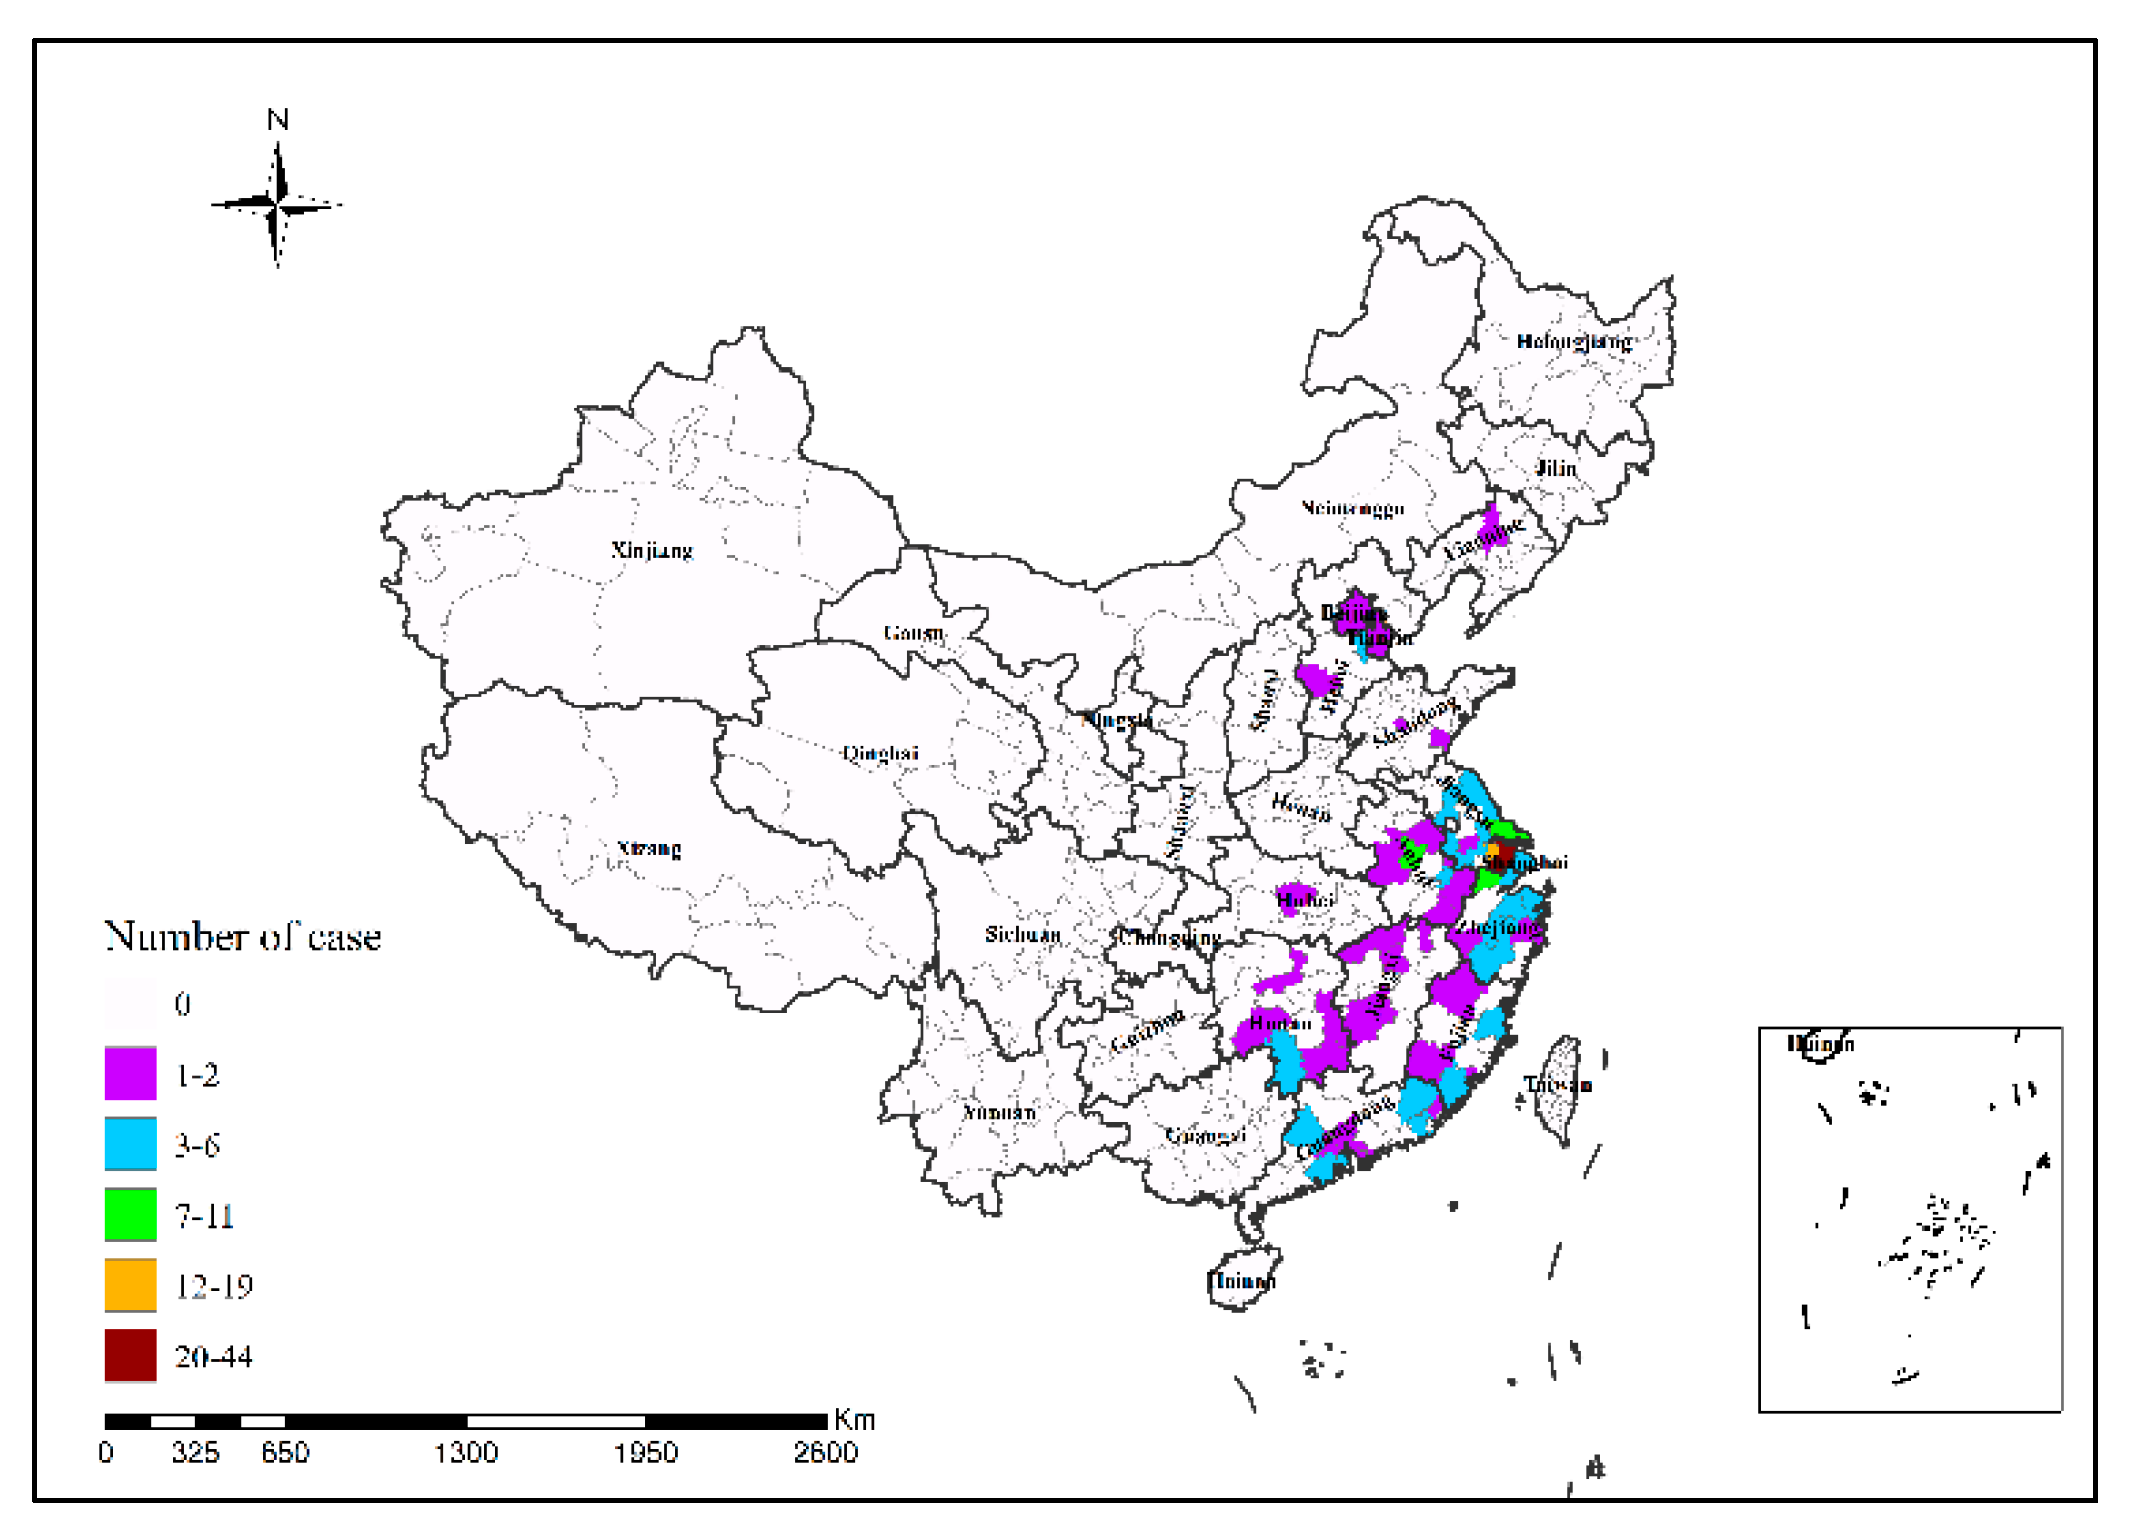
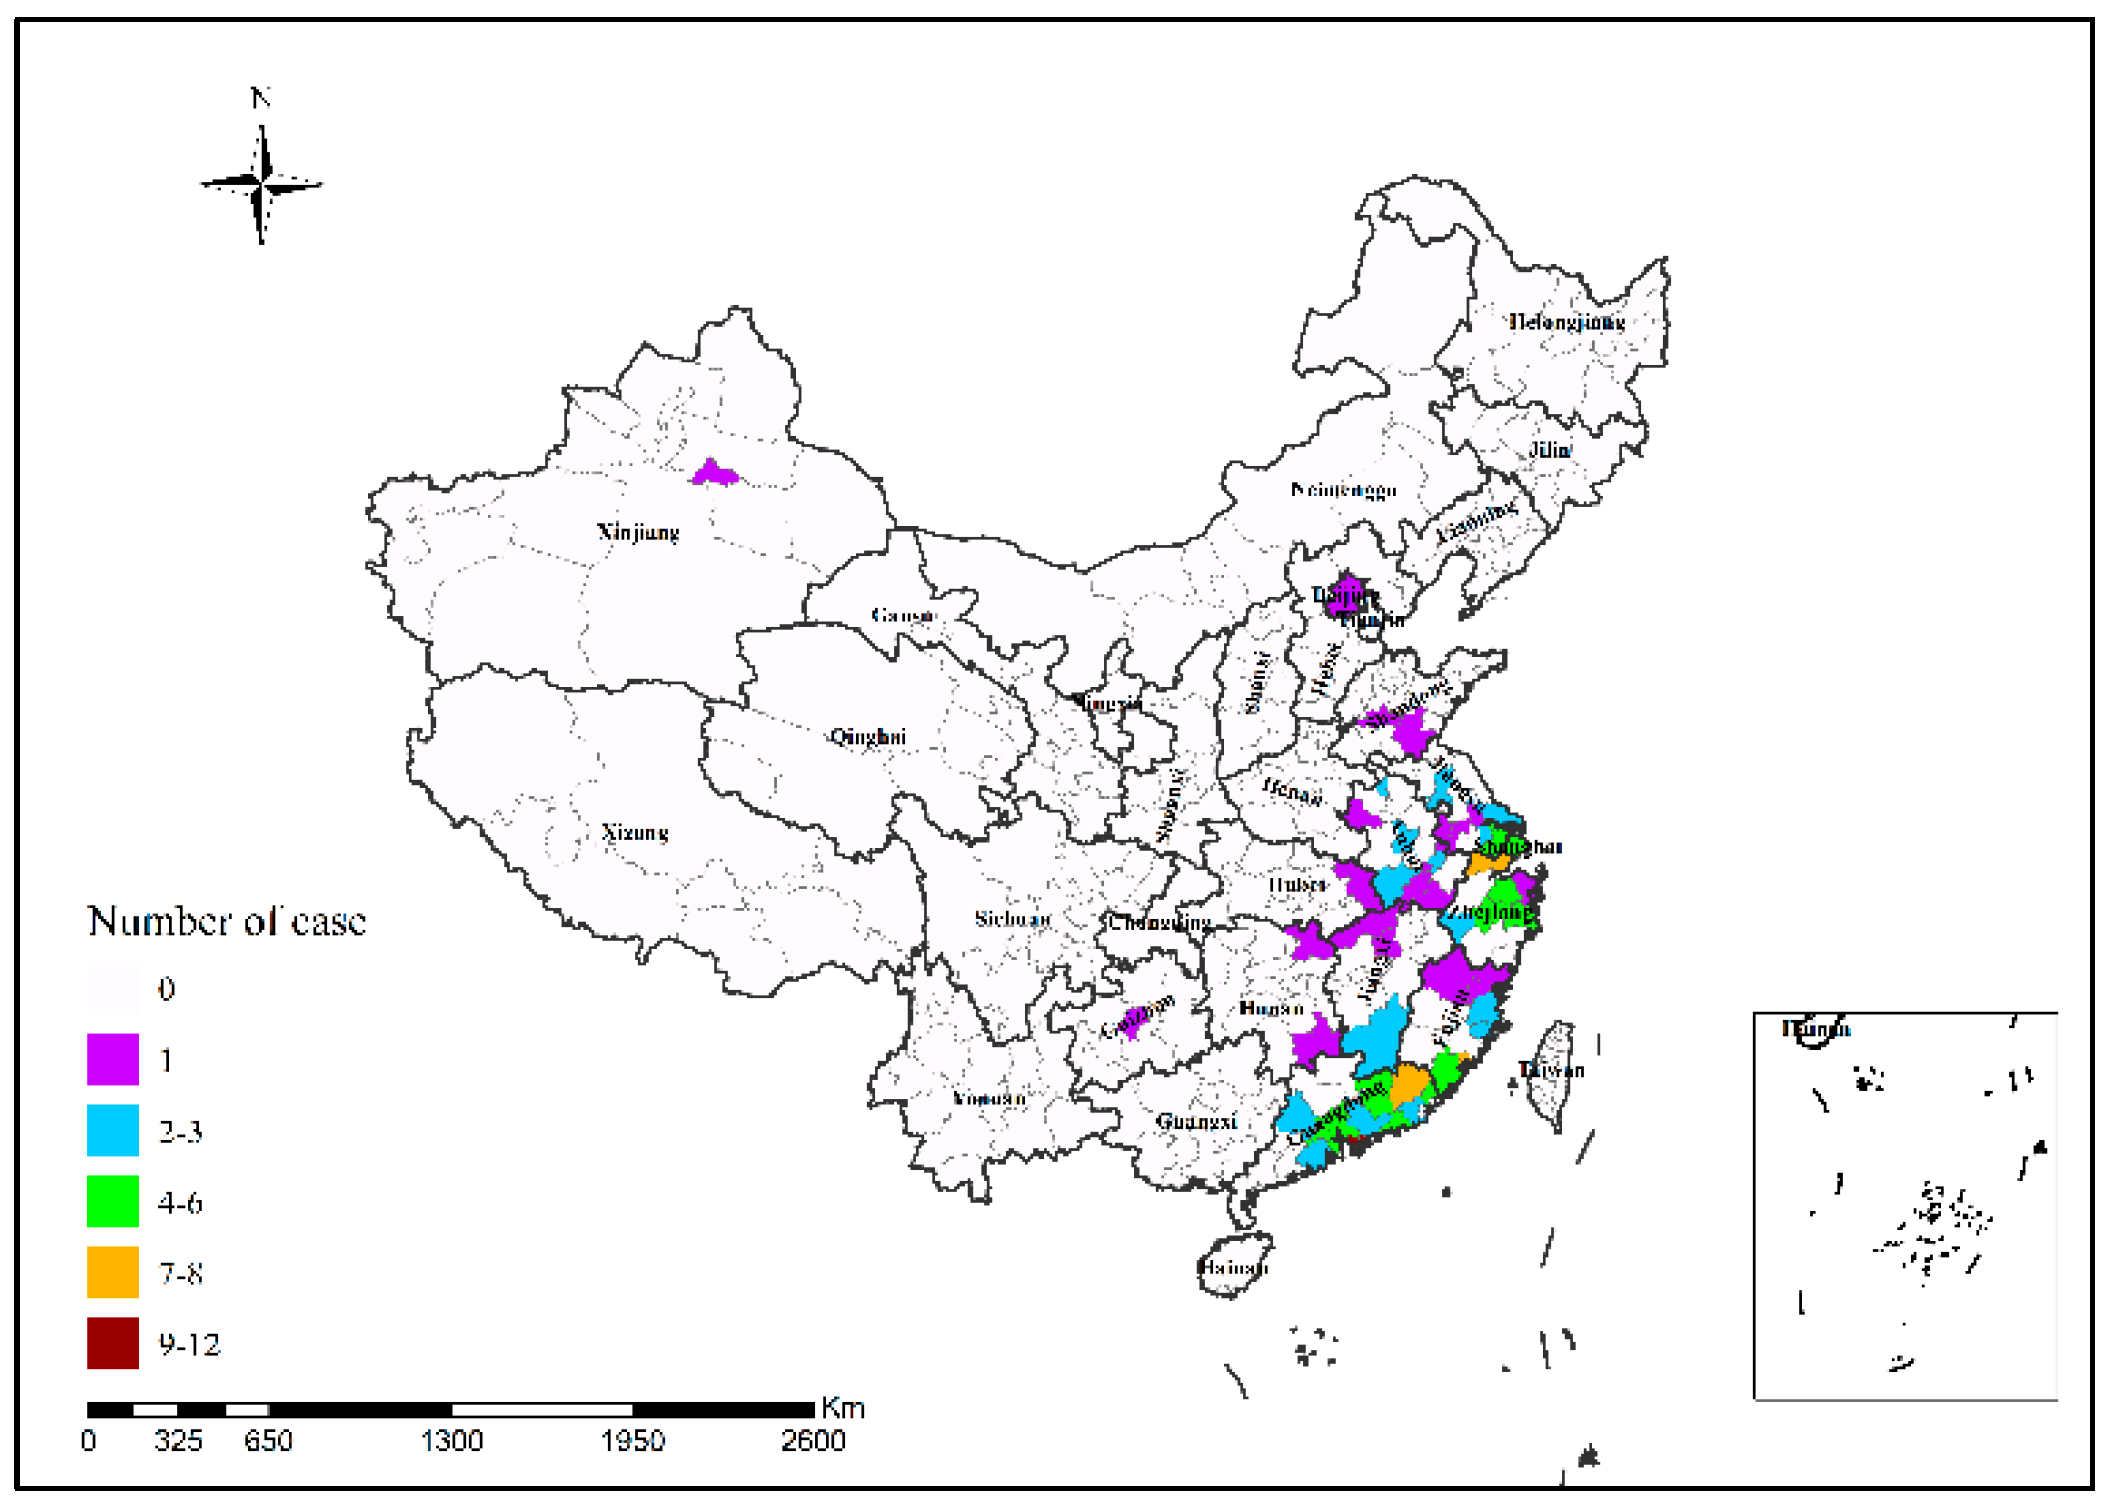
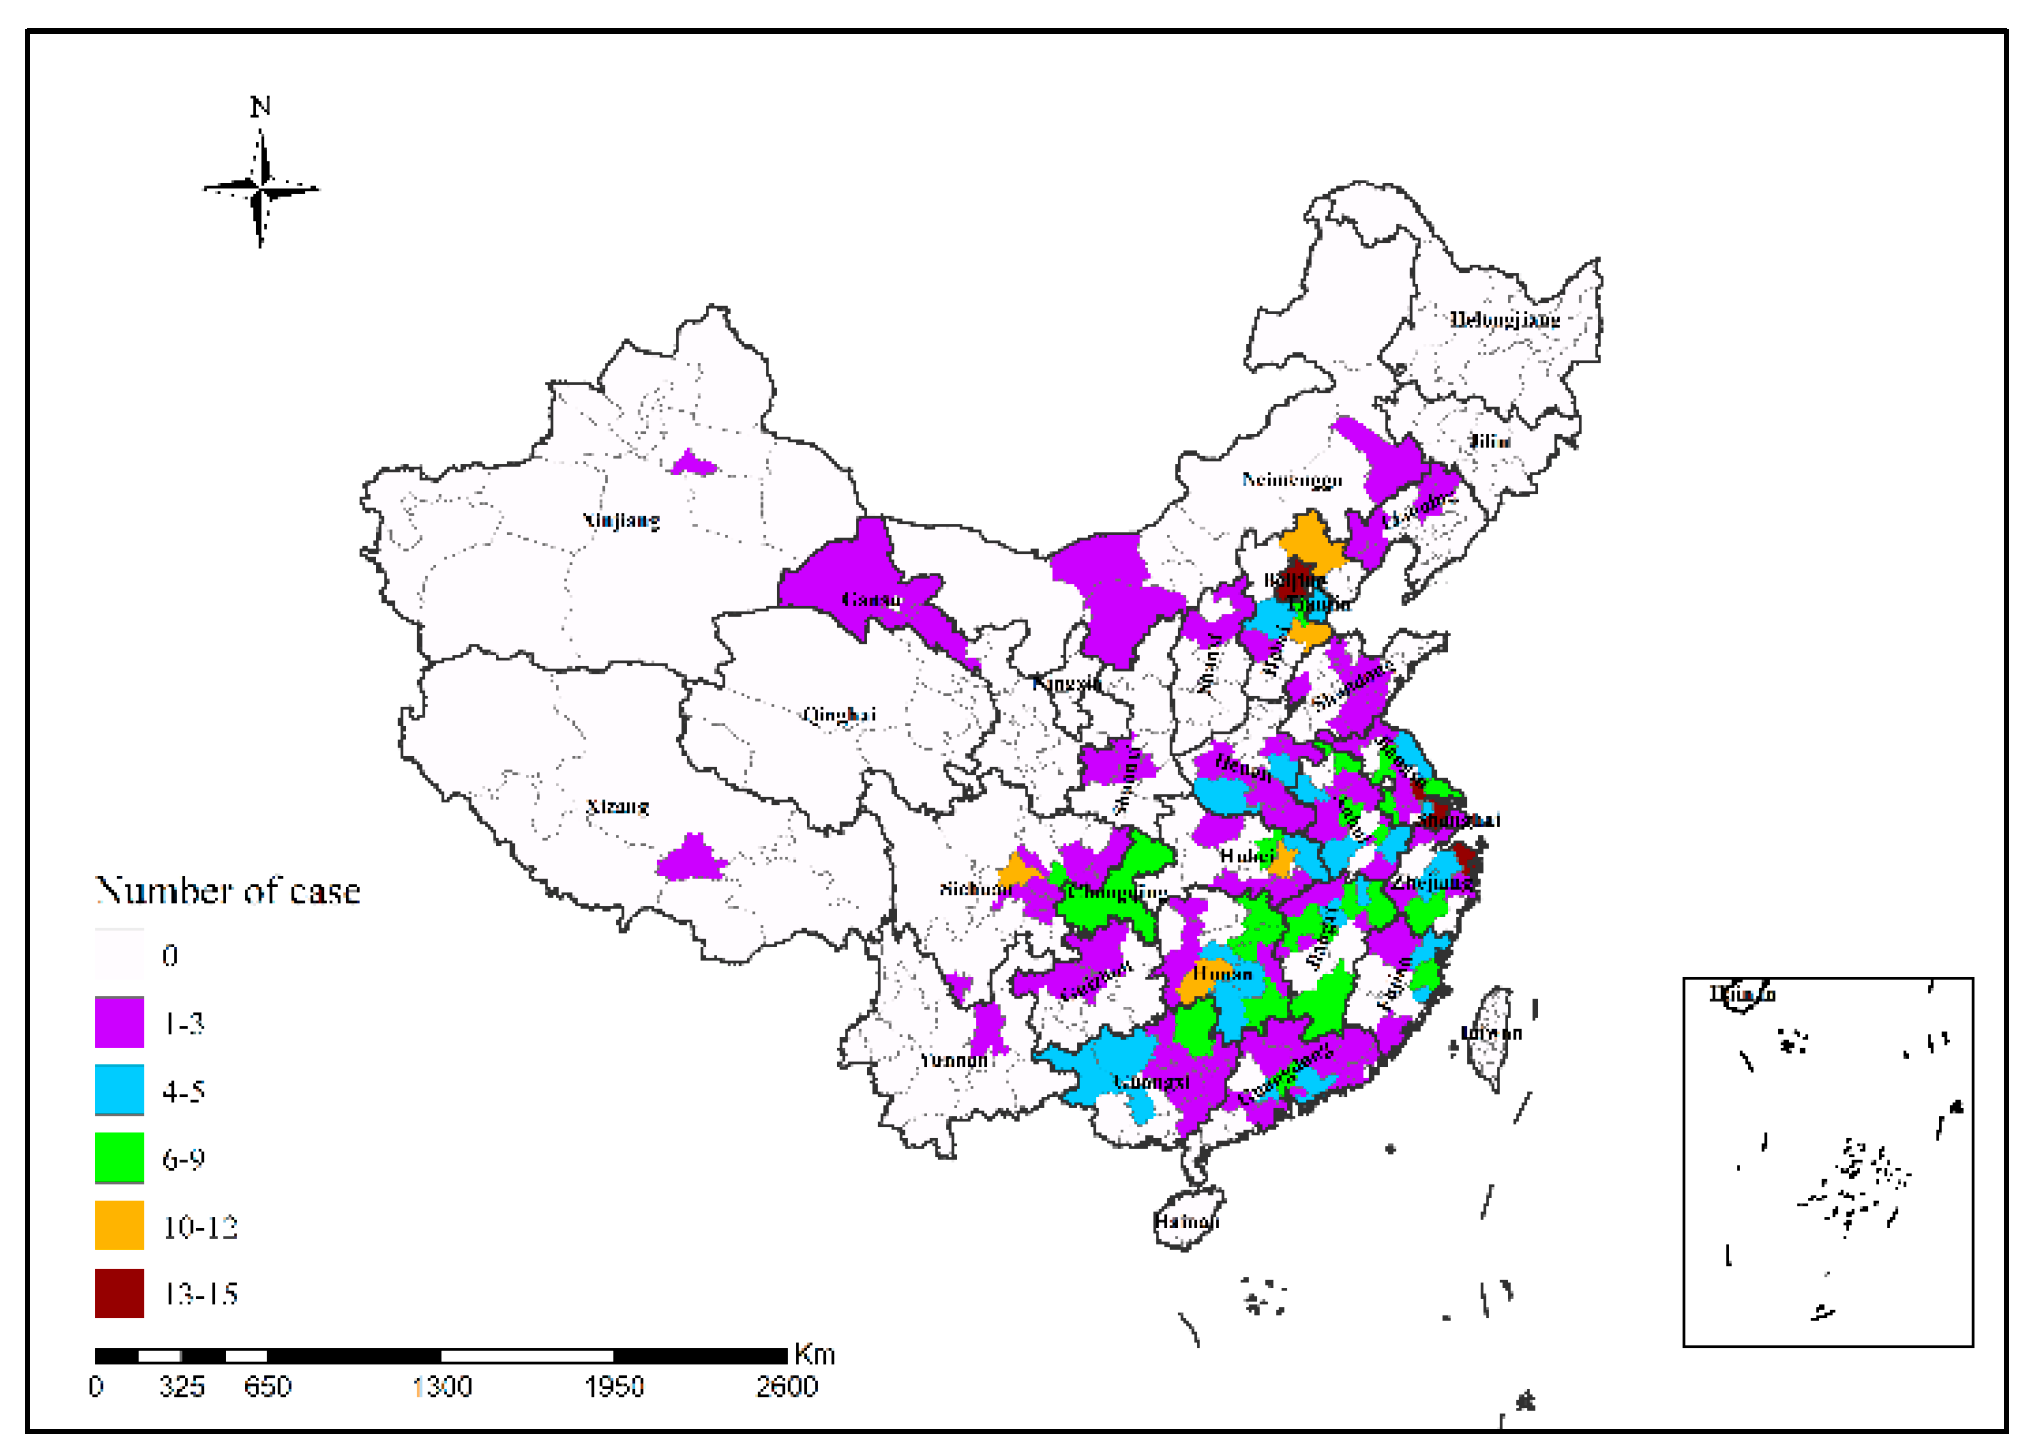
3.1. Spatial Pattern of H7N9 Outbreaks in China
3.2. Spatial Autocorrelation Analysis
3.2.1. Global Spatial Autocorrelation Analysis of H7N9 Outbreaks
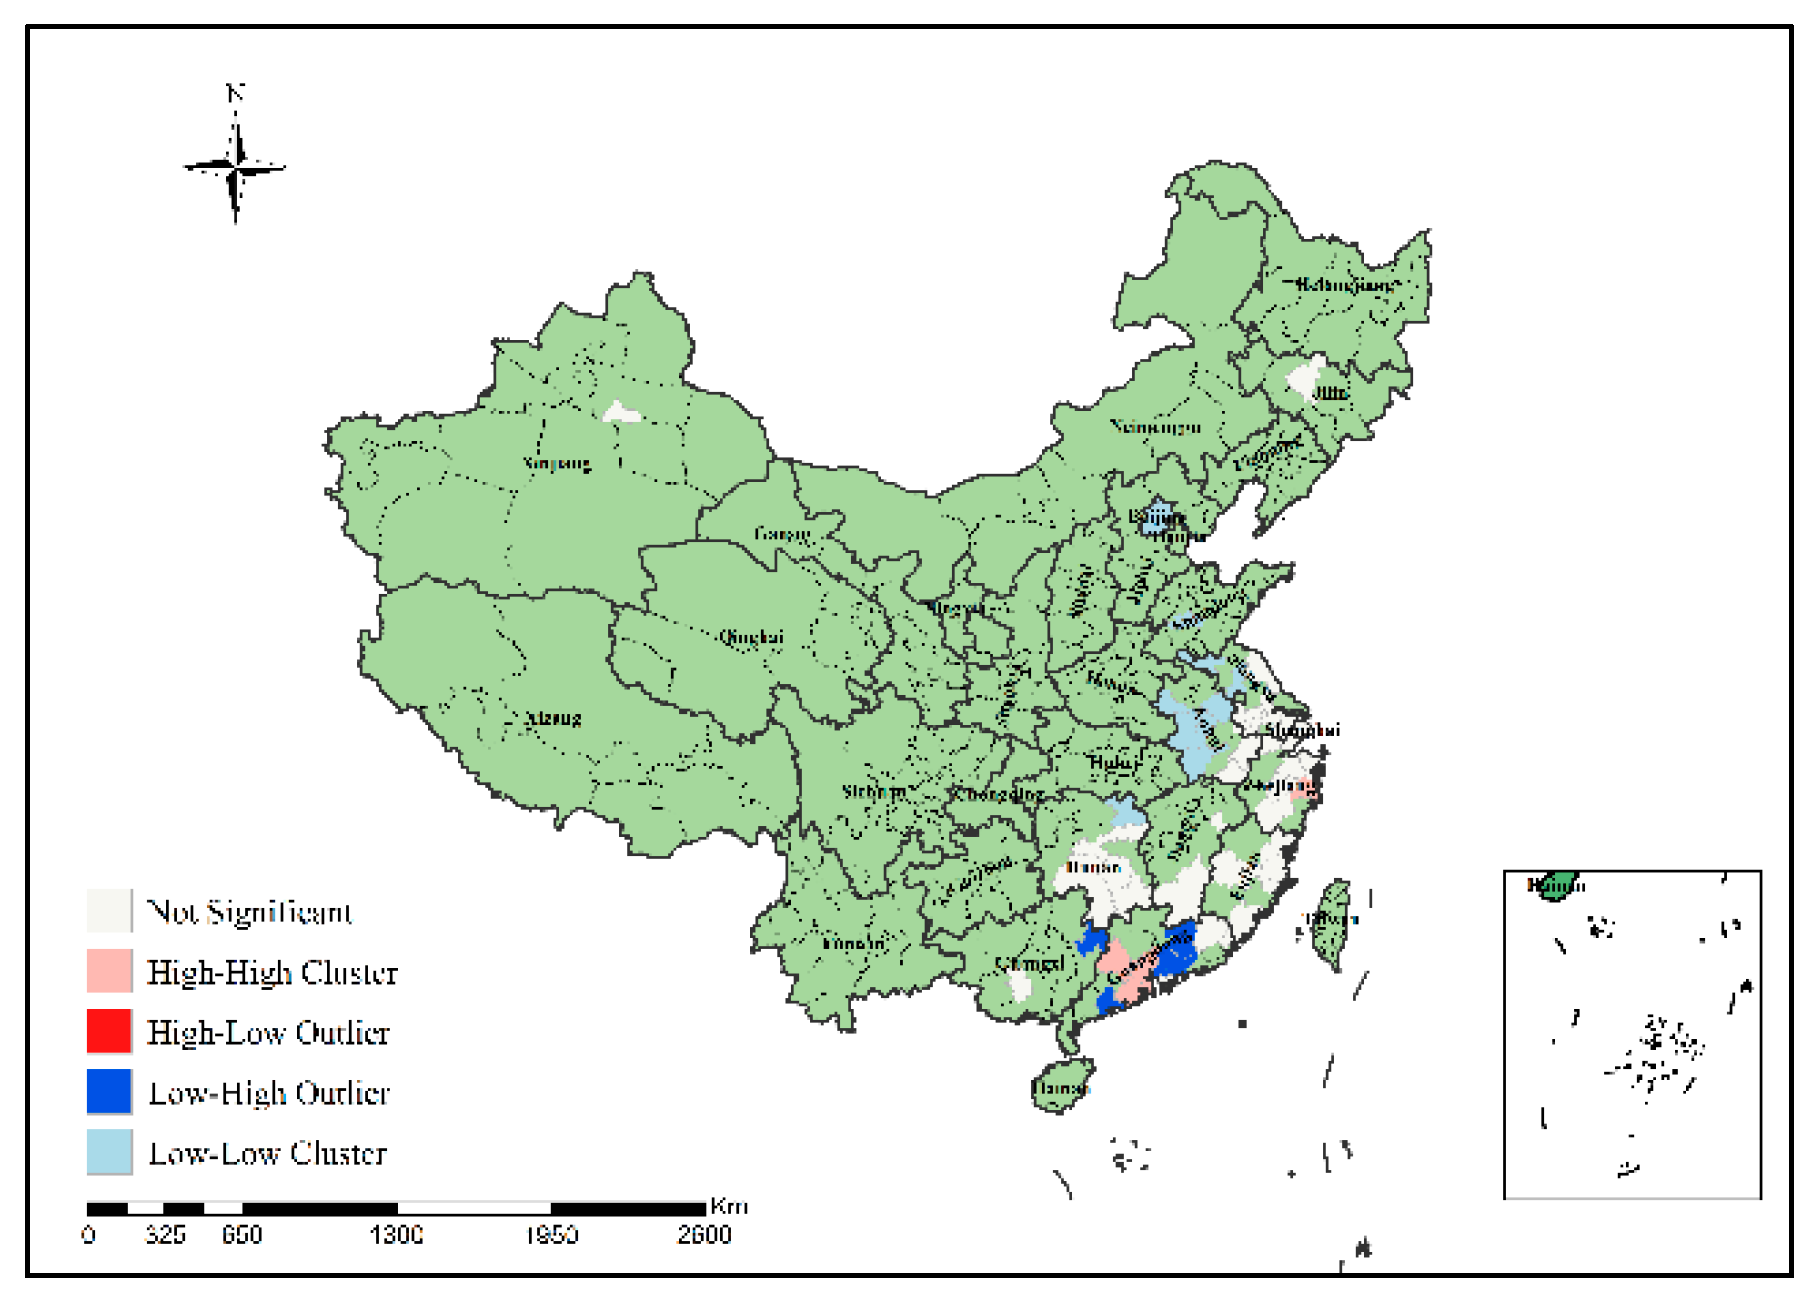
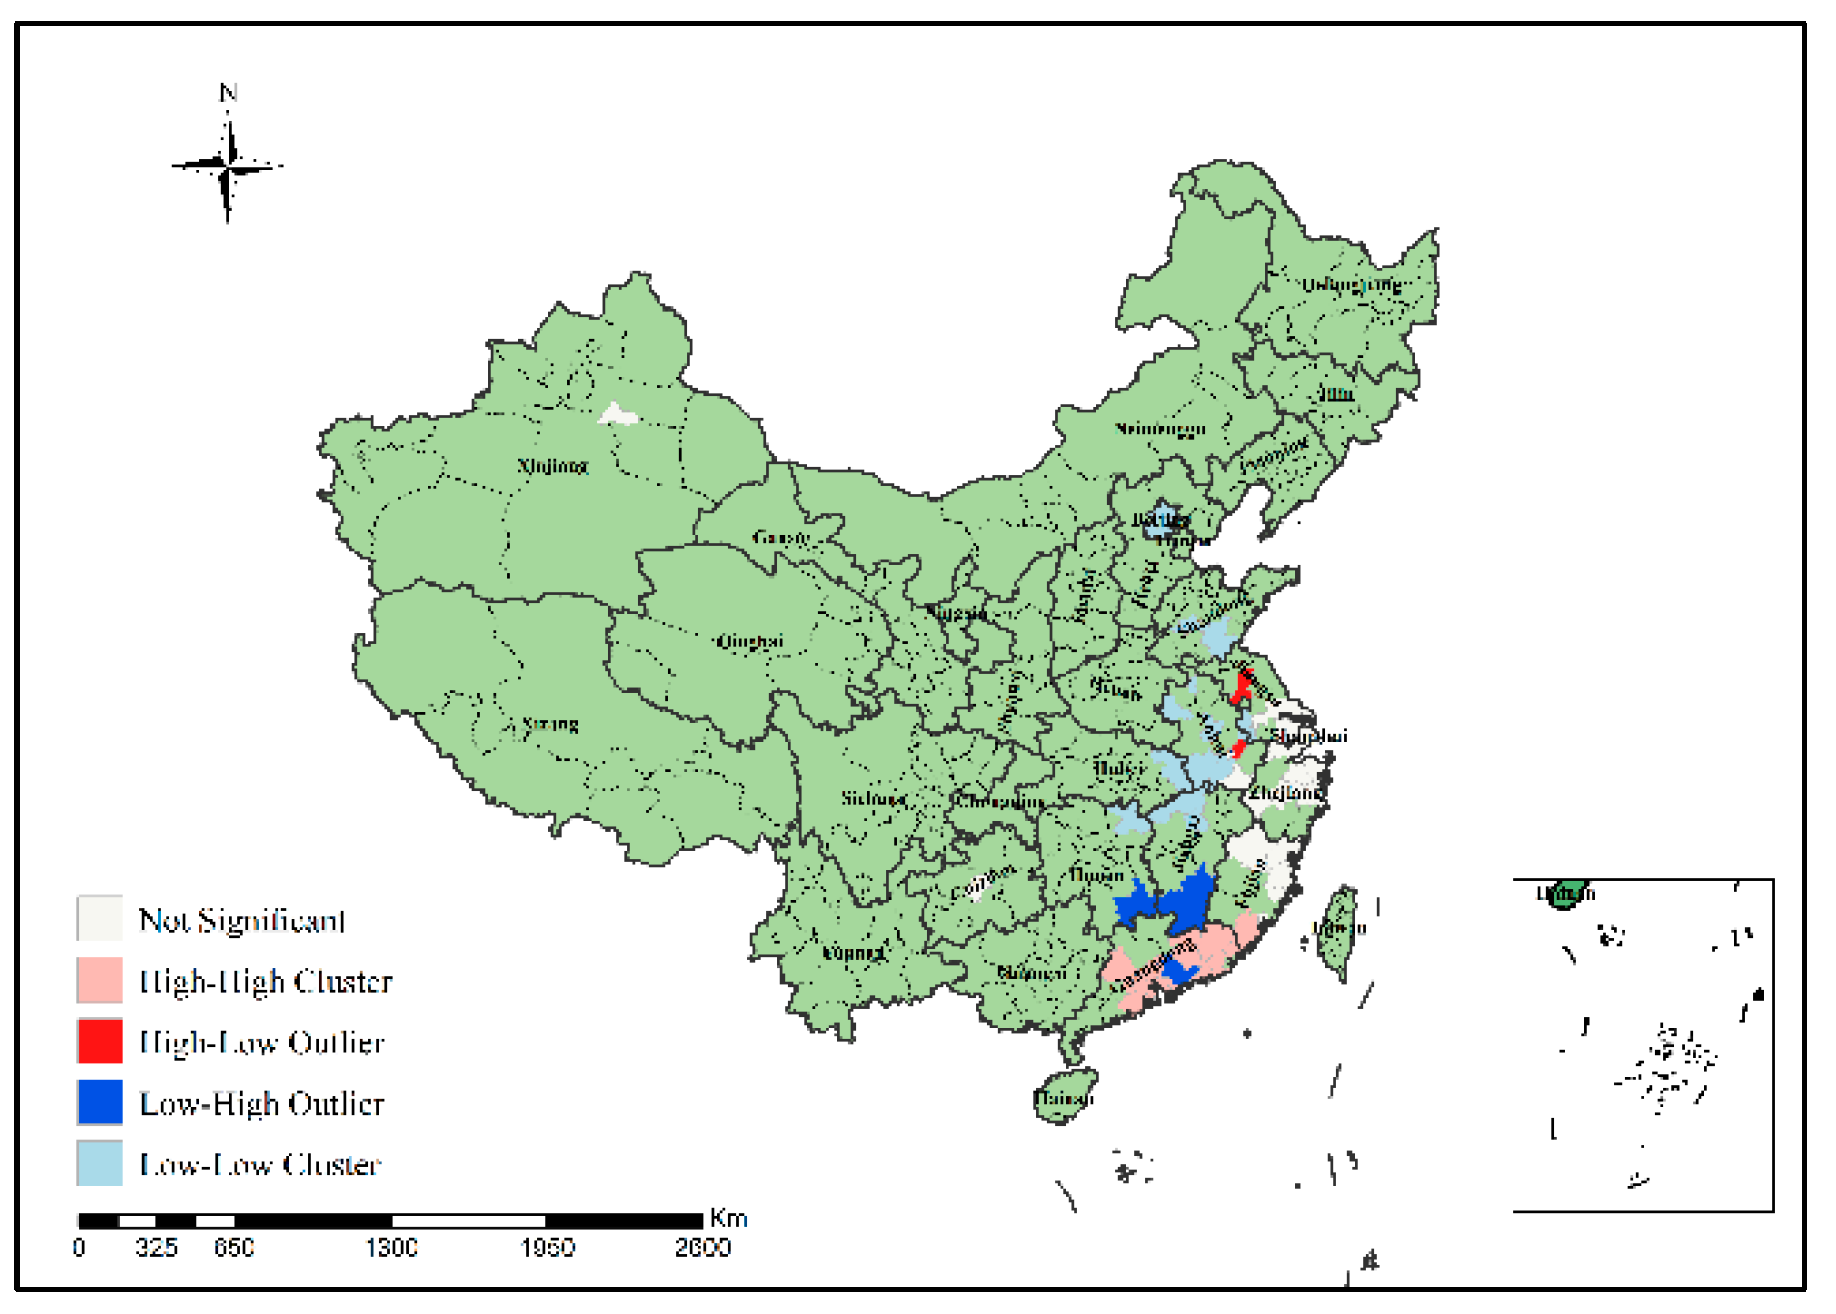
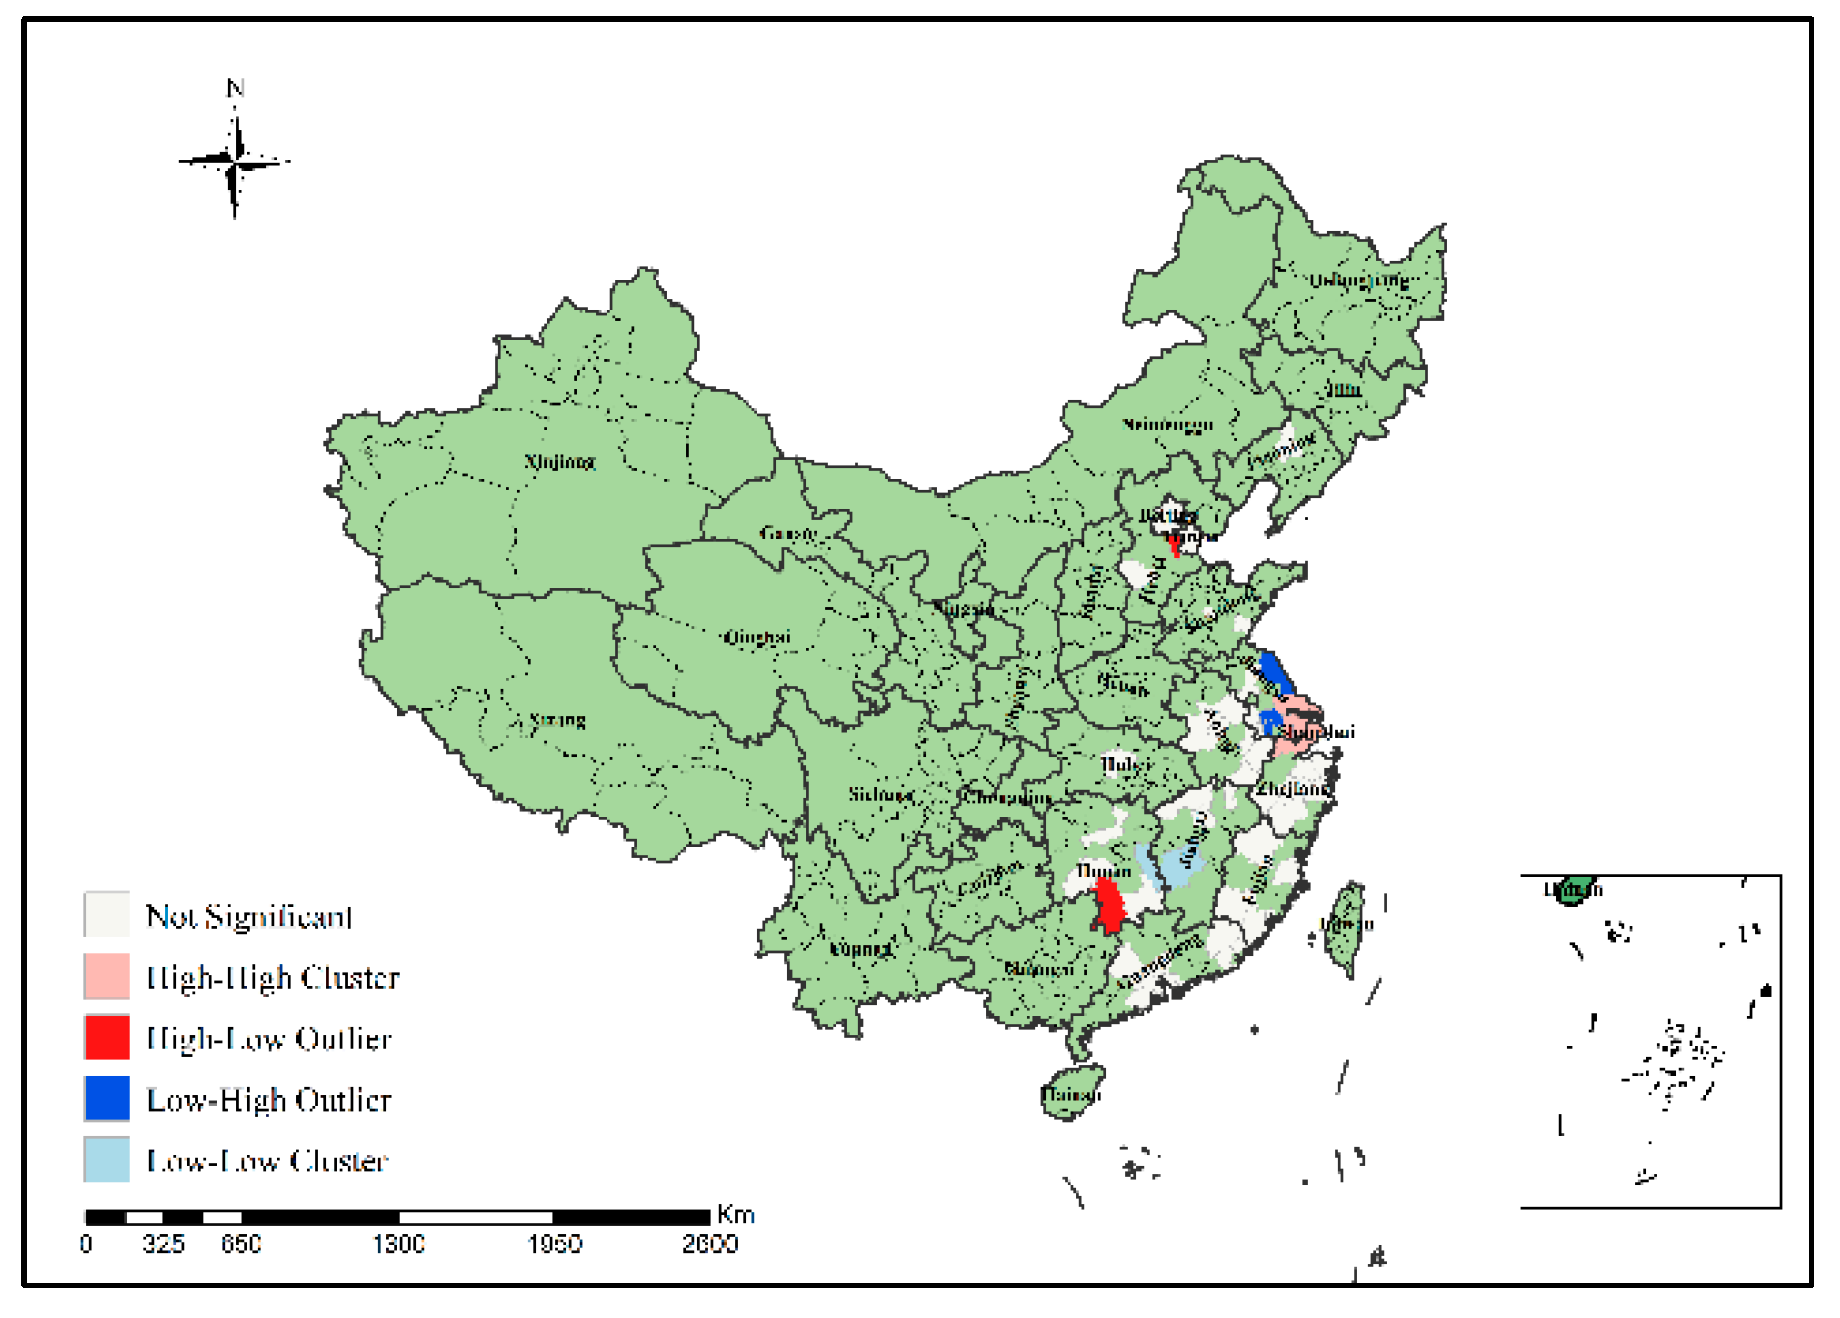
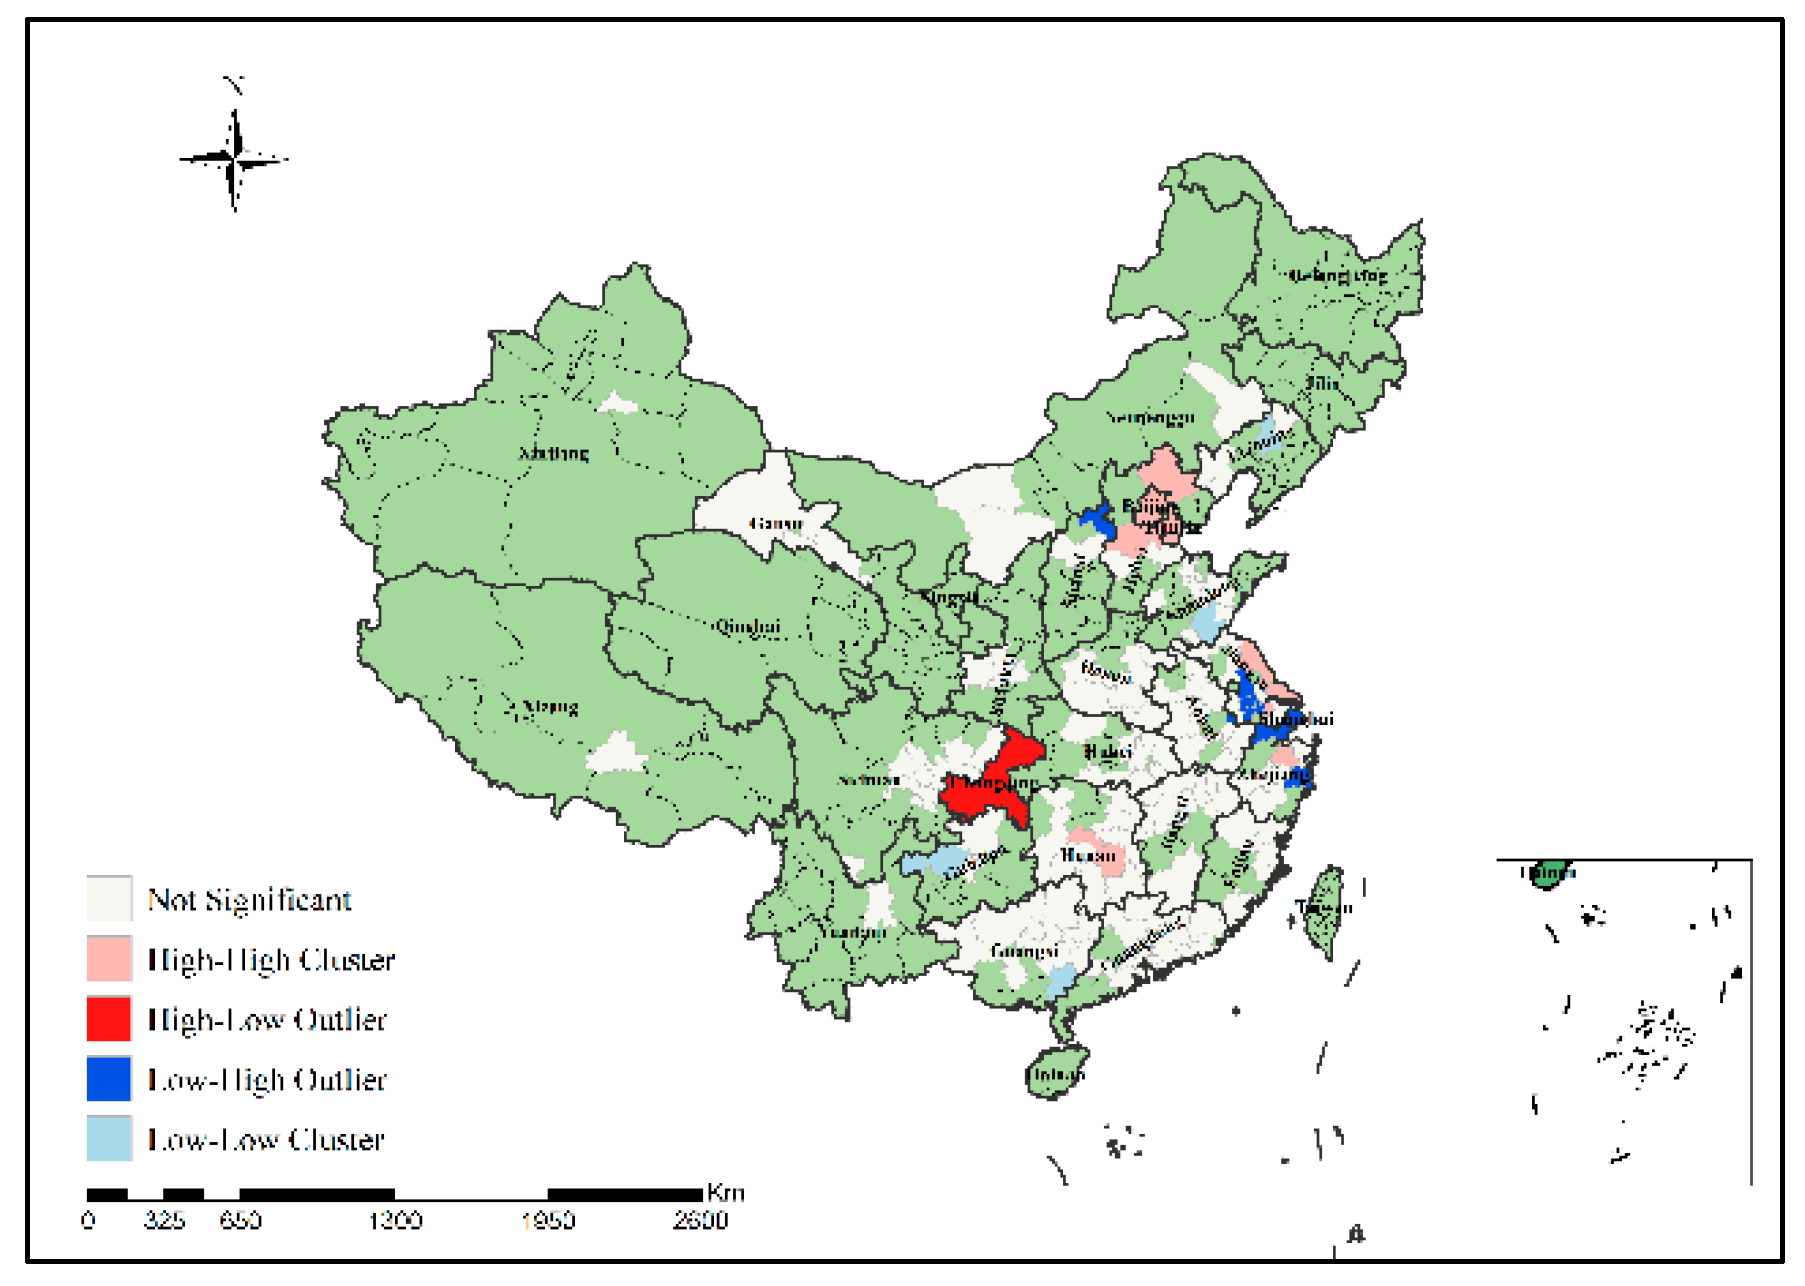
3.2.2. Local Spatial Autocorrelation Analysis of H7N9 Outbreaks
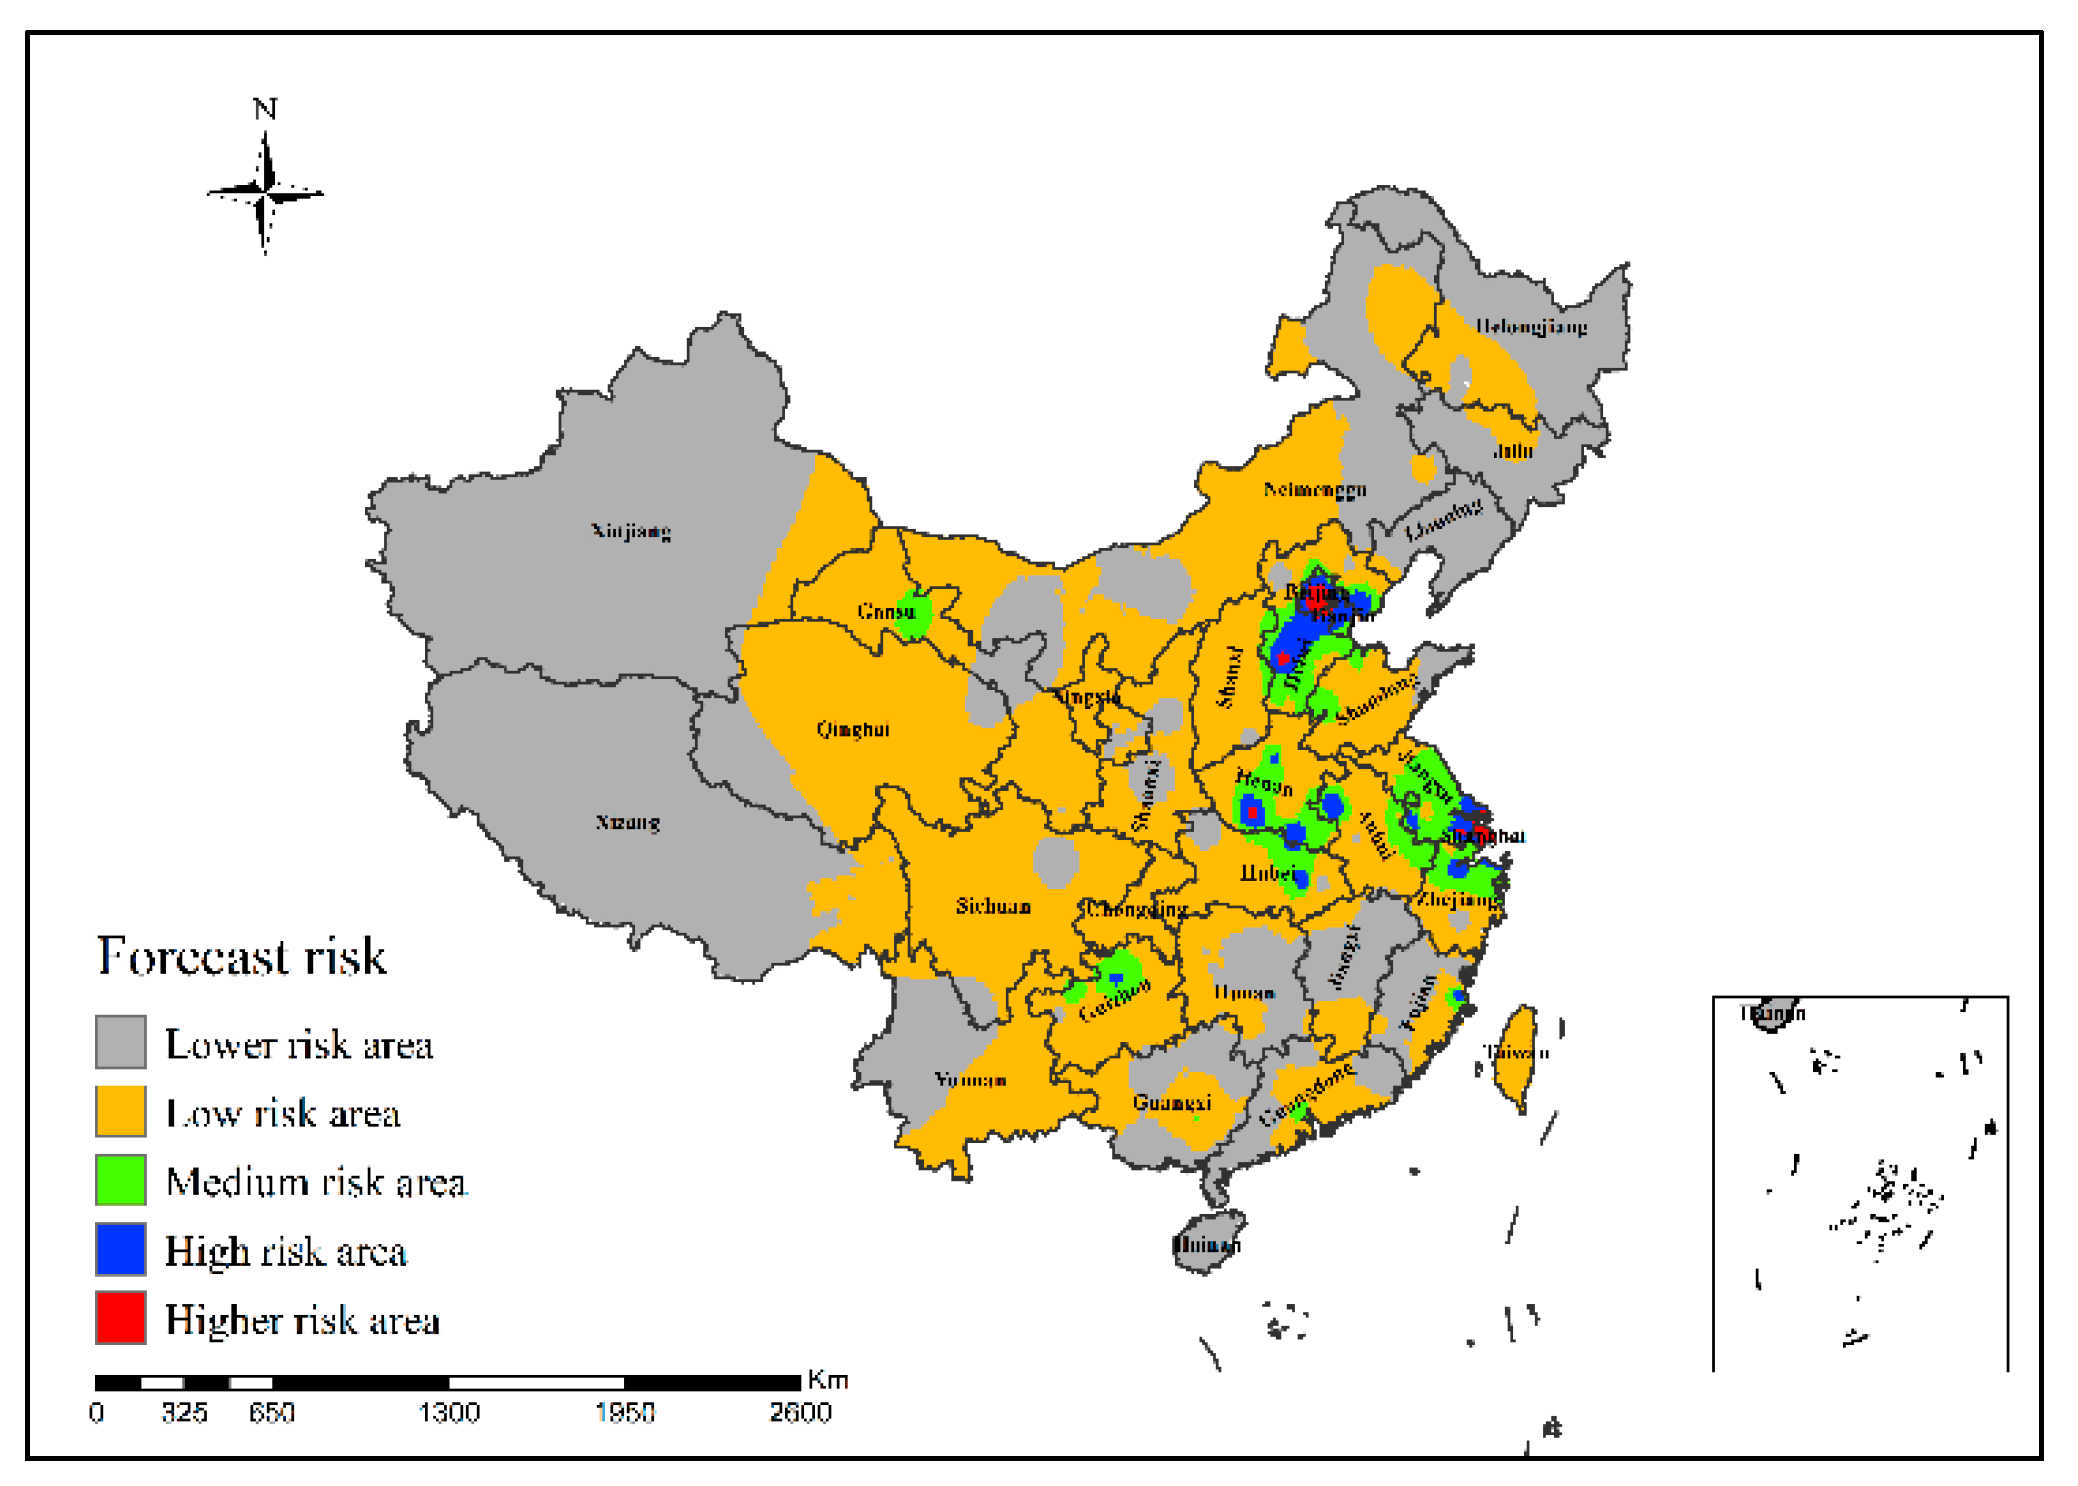
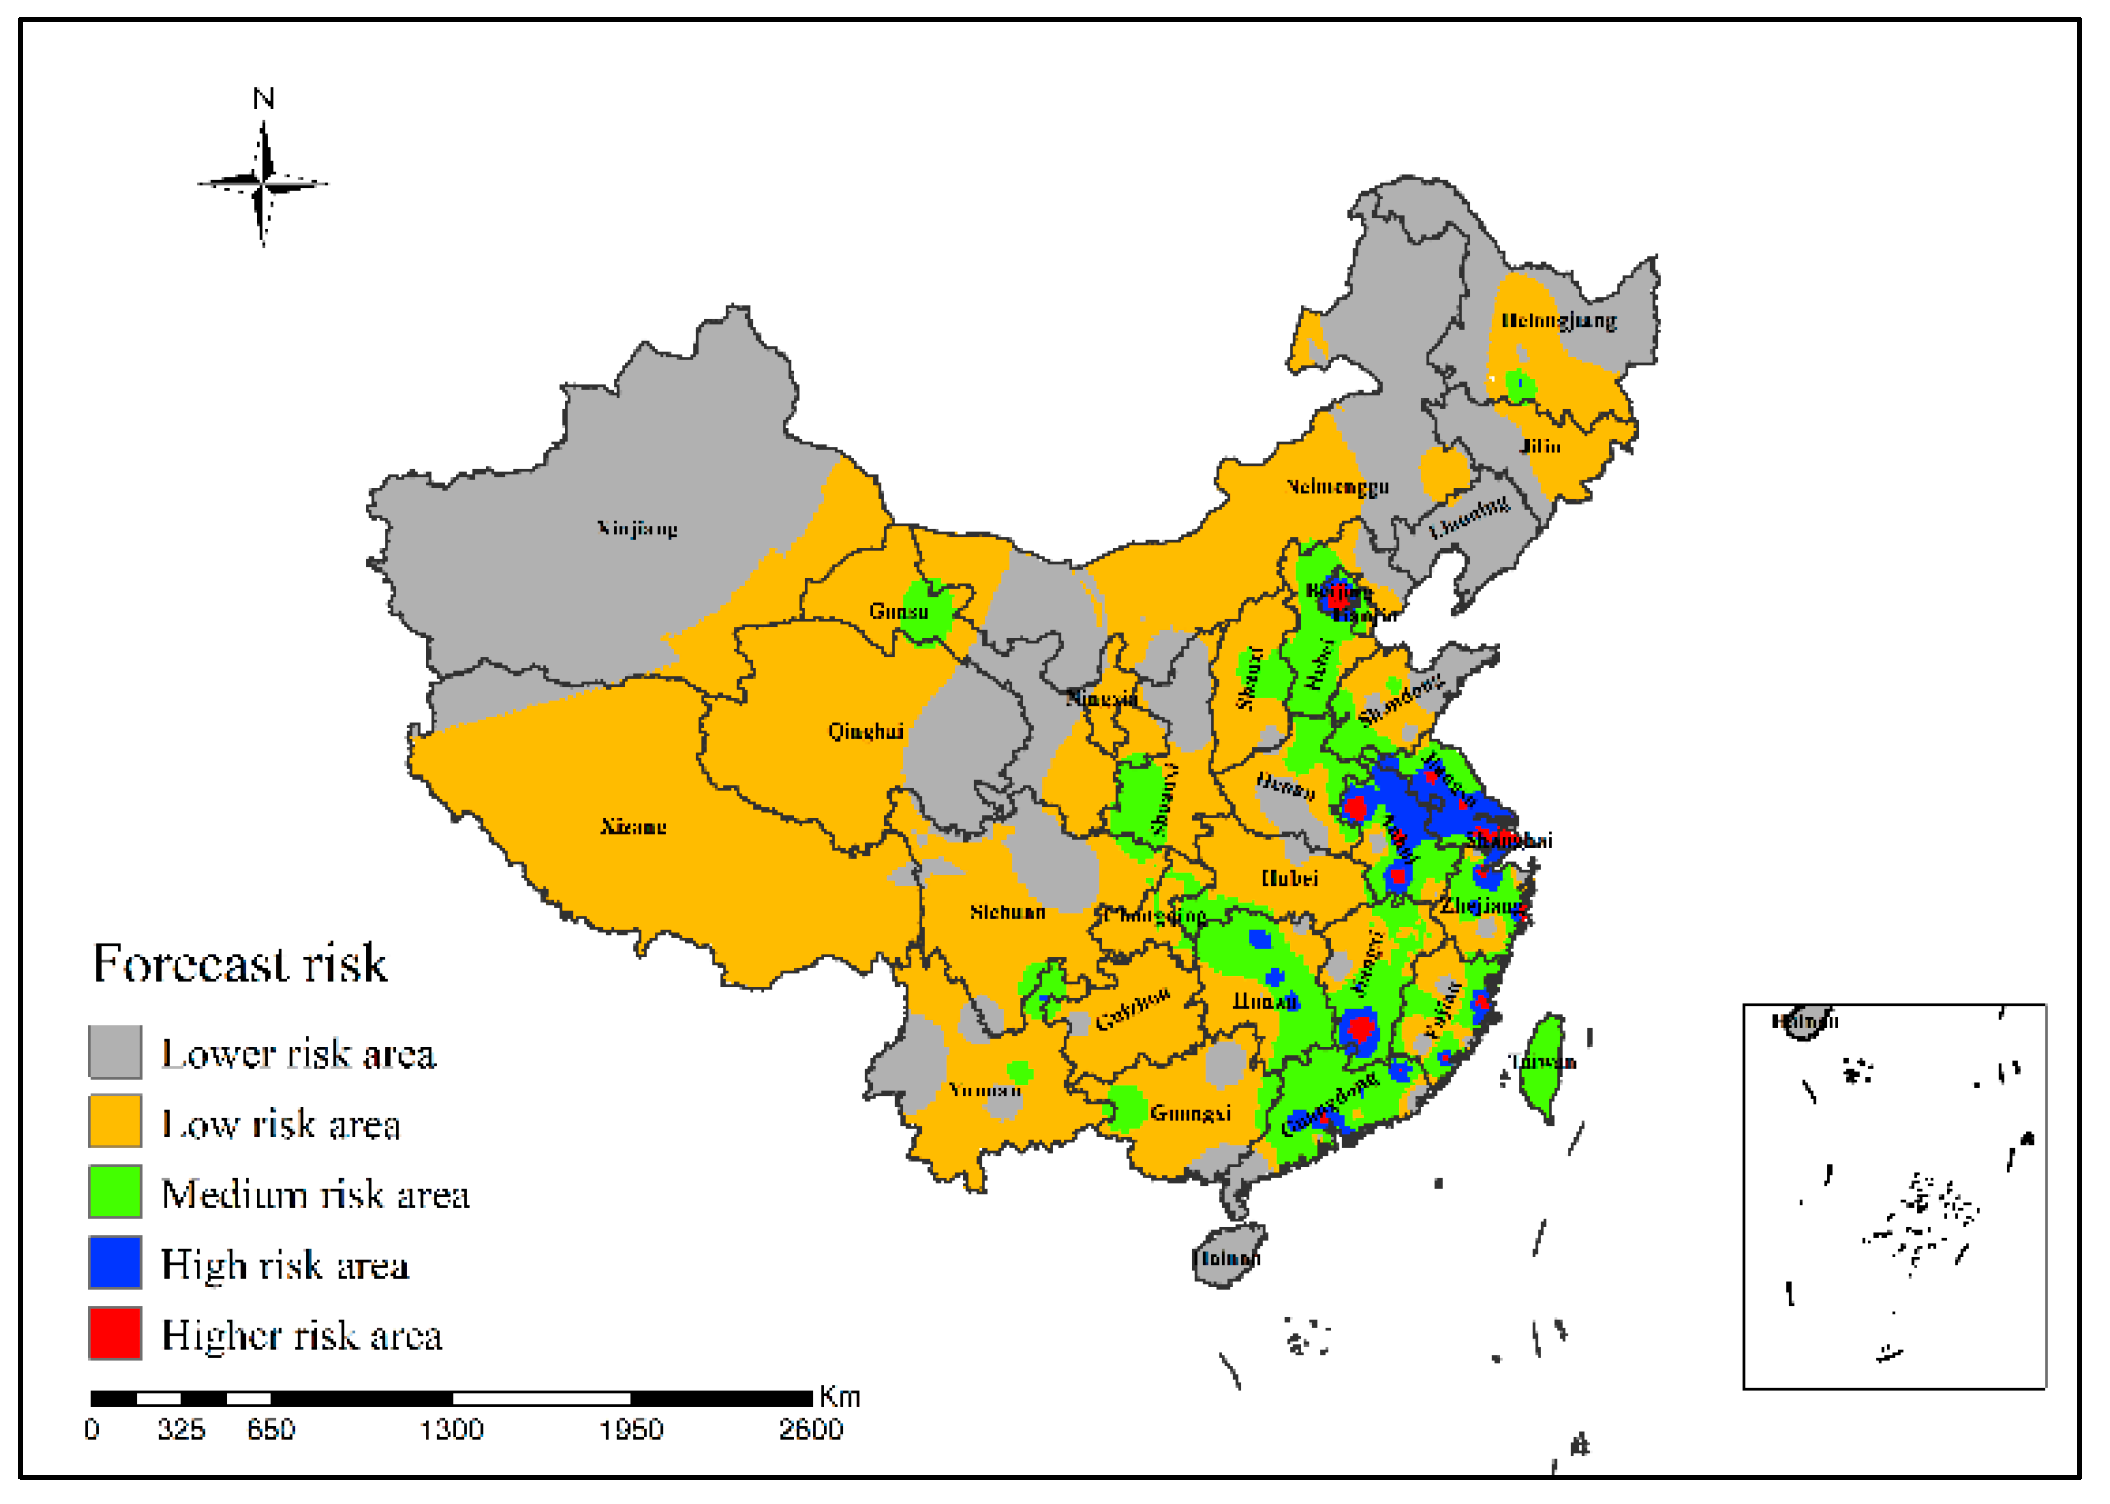
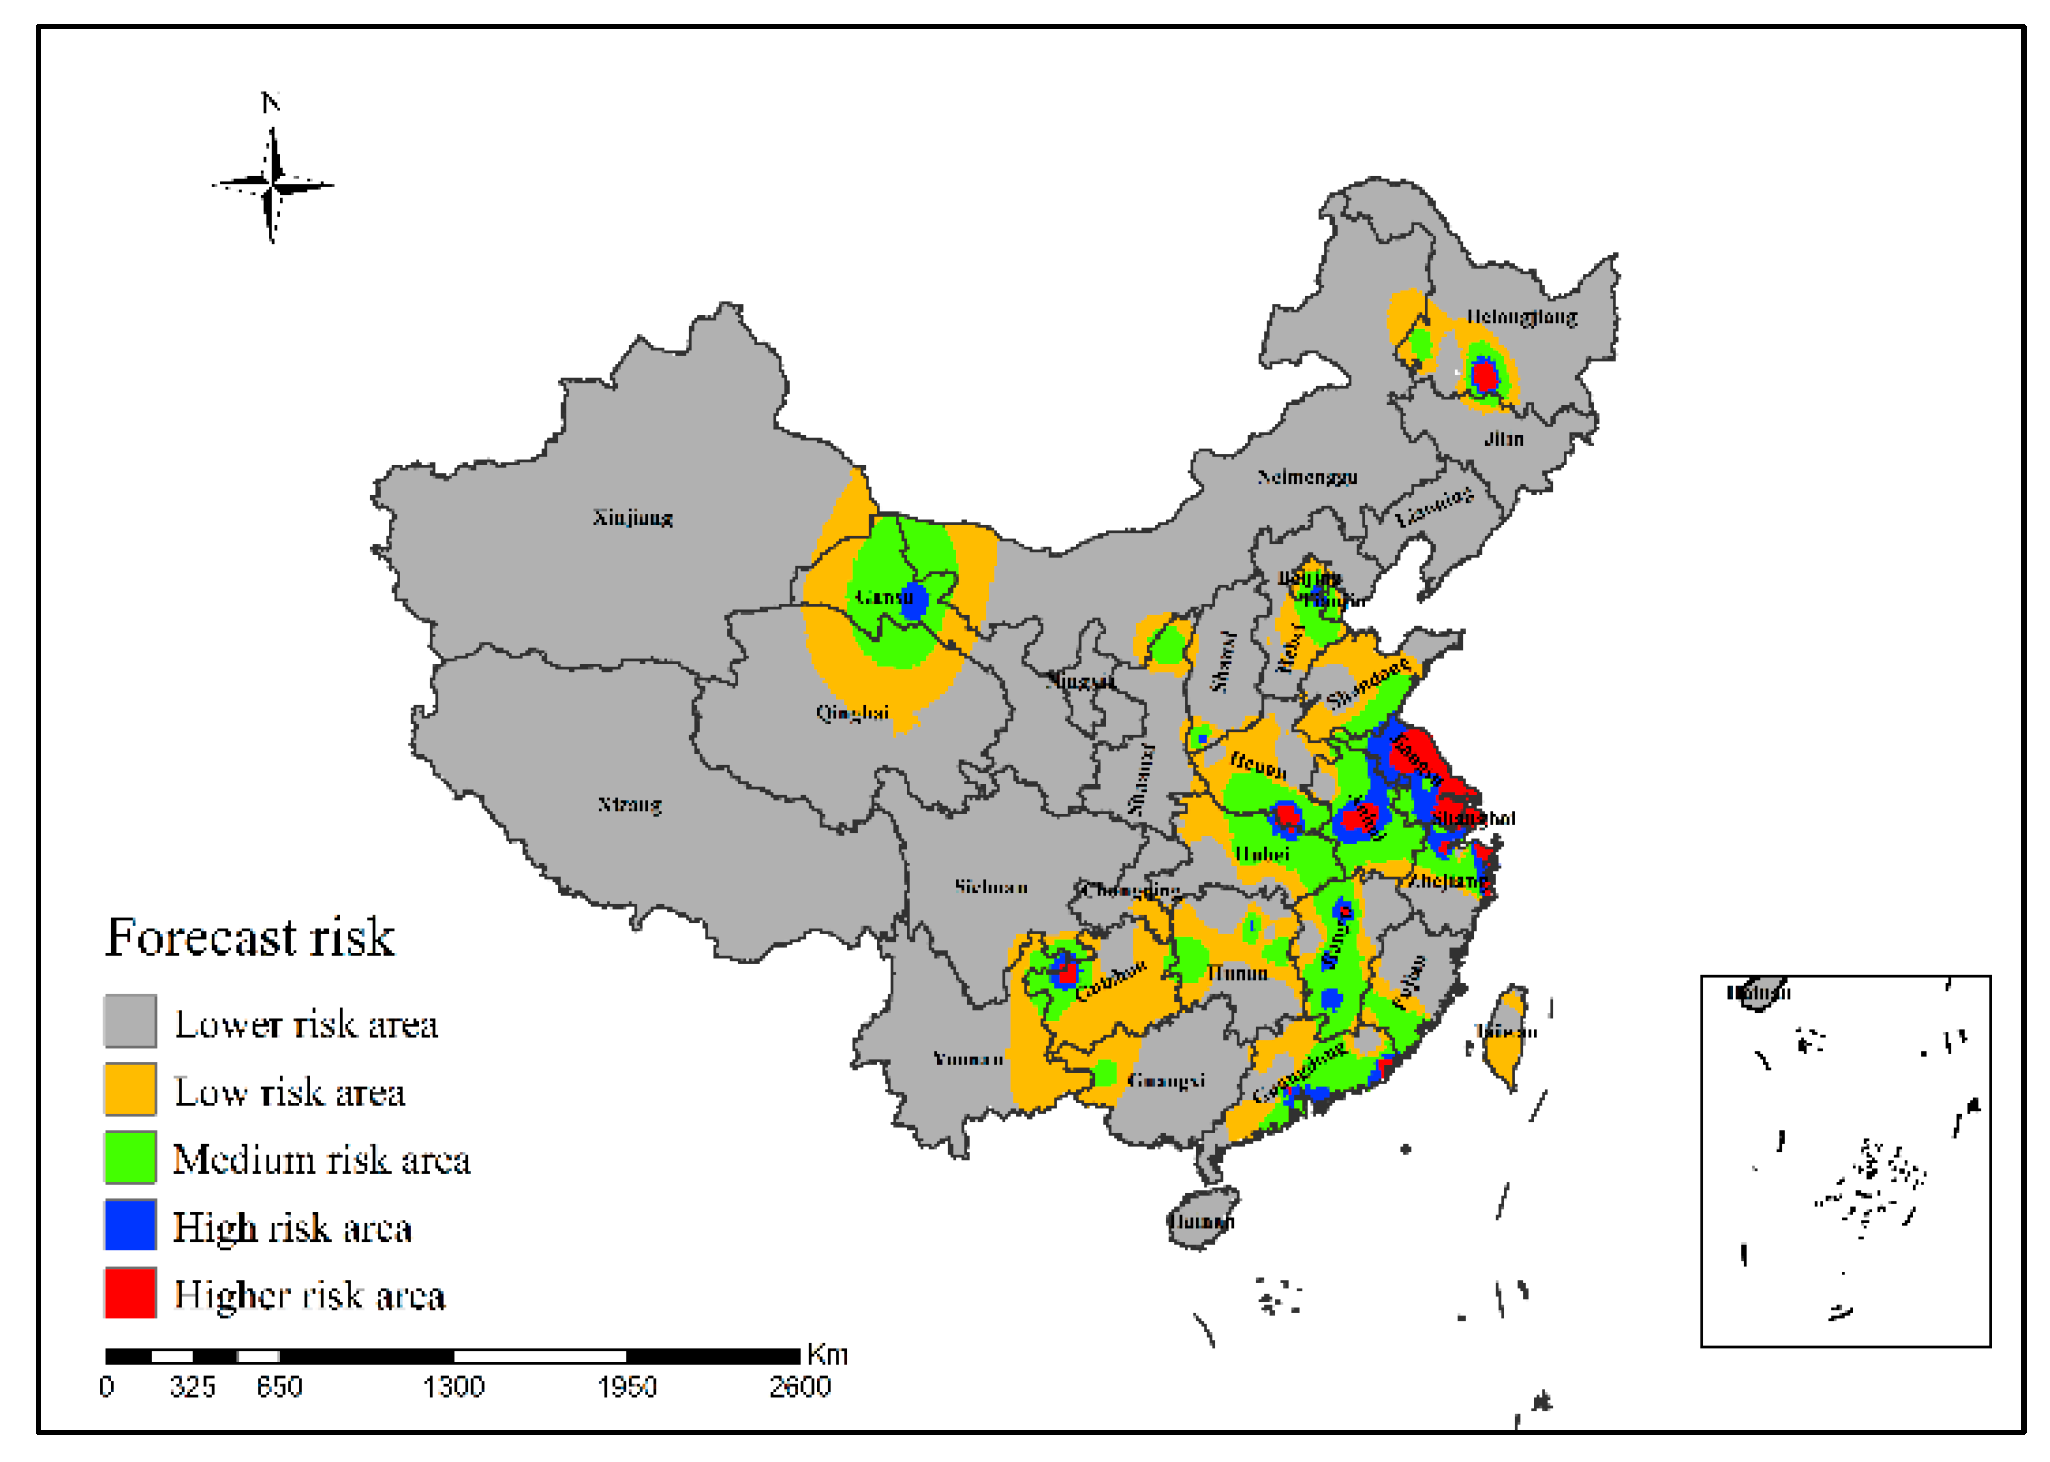
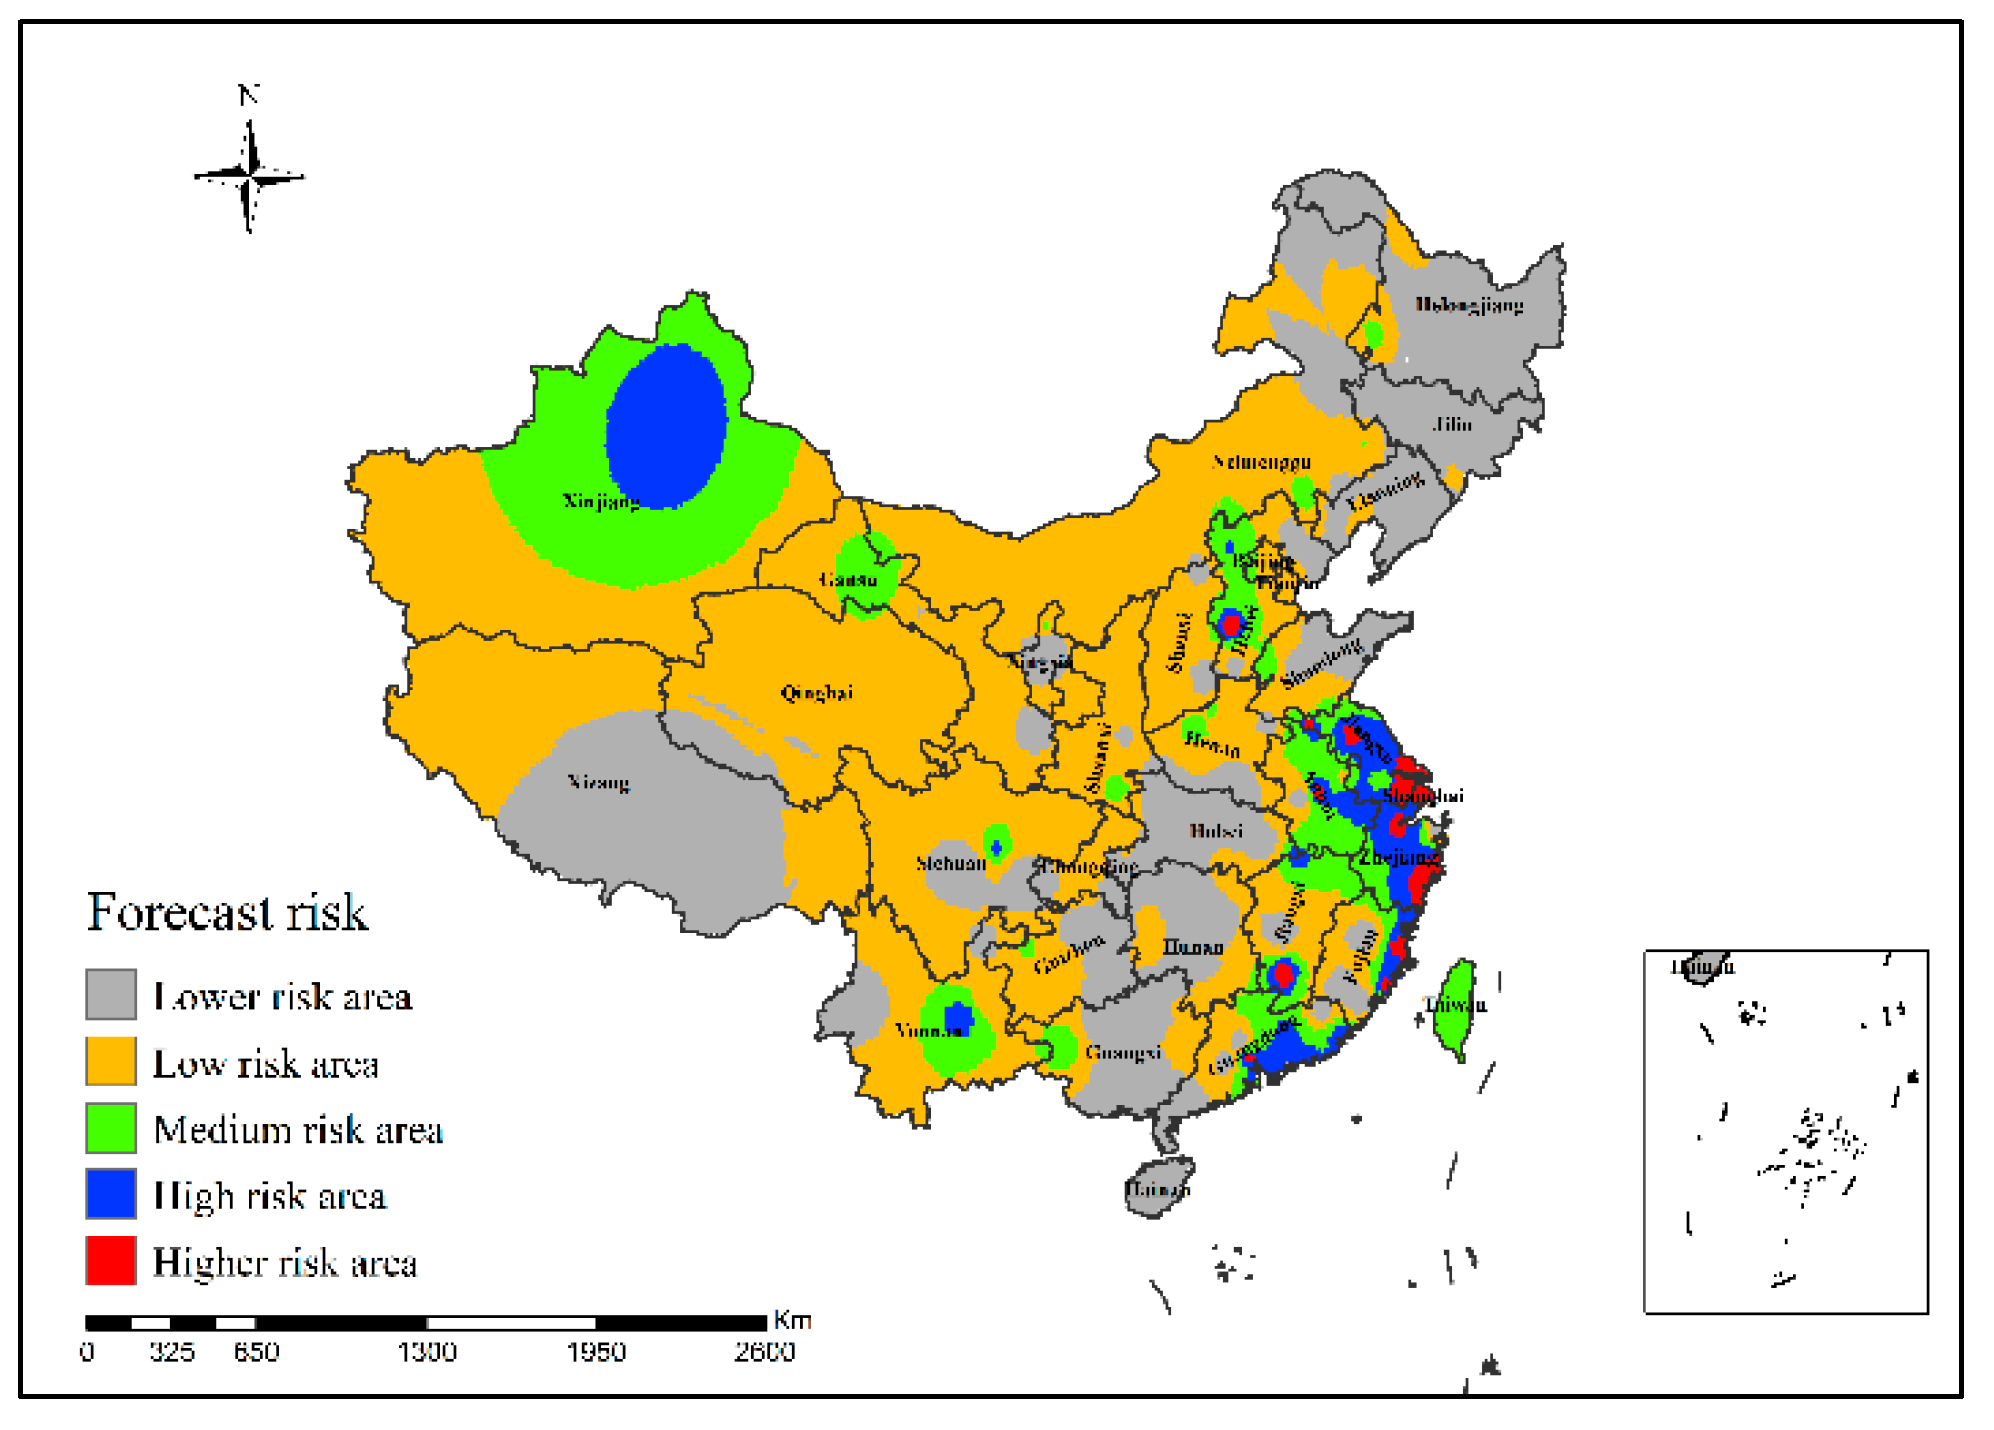
3.2.3. Neural Network Risk Simulation Model of H7N9 Outbreaks in China
4. Discussion
5. Conclusions
Author Contributions
Funding
Institutional Review Board Statement
Informed Consent Statement
Data Availability Statement
Acknowledgments
Conflicts of Interest
References
- Dongqing, H.; Wen, D.; Qian, W. Spatial and temporal analysis of human infection with the avian influenza A (H7N9) virus in China and research on a risk assessment agent-based model. Int. J. Infect. Dis. 2021, 106, 386–394. [Google Scholar]
- Dong, W.; Yang, K.; Xu, Q.; Liu, L.; Chen, J. Spatio-temporal pattern analysis for evaluation of the spread of human infections with avian influenza A(H7N9) virus in China, 2013–2014. BMC Infect. Dis. 2017, 17, 704. [Google Scholar] [CrossRef] [PubMed]
- Liu, D.; Shi, W.; Shi, Y.; Wang, D.; Xiao, H.; Li, W.; Bi, Y.; Wu, Y.; Li, X.; Yan, J. Origin and diversity of novel avian influenza A H7N9 viruses causing human infection: Phylogenetic, structural, and coalescent analyses. Lancet 2013, 381, 1926–1932. [Google Scholar] [CrossRef]
- Shi, B.; Xia, S.; Yang, G.-J.; Zhou, X.-N.; Liu, J. Inferring the potential risks of H7N9 infection by spatiotemporally characterizing bird migration and poultry distribution in eastern China. Infect. Dis. Poverty 2013, 2, 8. [Google Scholar] [CrossRef]
- Li, X.L.; Yang, Y.; Sun, Y.; Chen, W.J.; Sun, R.X.; Liu, K.; Ma, M.J.; Liang, S.; Yao, H.W.; Gray, G.C. Risk Distribution of Human Infections with Avian Influenza H7N9 and H5N1 virus in China. Sci. Rep. 2015, 5, 18610. [Google Scholar] [CrossRef]
- Shi, J.; Deng, G.; Kong, H.; Gu, C.; Ma, S.; Yin, X.; Zeng, X.; Cui, P.; Chen, Y.; Yang, H. H7N9 virulent mutants detected in chickens in China pose an increased threat to humans. Sci. Found. China 2017, 27, 1409–1421. [Google Scholar] [CrossRef]
- Xiang, N.; Li, X.; Ren, R.; Wang, D.; Li, Q. Assessing Change in Avian Influenza A(H7N9) Virus Infections during the Fourth Epidemic—China, September 2015–August 2016. Mmwr. Morb. Mortal. Wkly. Rep. 2016, 65, 1390–1394. [Google Scholar] [CrossRef]
- Fang, L.Q.; Li, X.L.; Liu, K.; Li, Y.J.; Cao, W.C. Mapping Spread and Risk of Avian Influenza A (H7N9) in China. Sci. Rep. 2013, 3, 2722. [Google Scholar] [CrossRef]
- Wu, J.; Lau, E.; Xing, Q.; Zou, L.; Zhang, H.; Yen, H.L.; Song, Y.; Zhong, H.; Lin, J.; Kang, M. Seasonality of avian influenza A(H7N9) activity and risk of human A(H7N9) infections from live poultry markets. J. Infect. 2015, 71, 690–693. [Google Scholar] [CrossRef]
- Li, Q.; Zhou, L.; Zhou, M.; Chen, Z.; Li, F.; Wu, H.; Xiang, N.; Chen, E.; Tang, F.; Wang, D.; et al. Epidemiology of human infections with avian influenza A(H7N9) virus in China. N. Engl. J. Med. 2014, 370, 520–532. [Google Scholar] [CrossRef]
- Zhou, L.; Ren, R.; Yang, L.; Bao, C.; Wu, J.; Wang, D.; Li, C.; Xiang, N.; Wang, Y.; Li, D. Sudden increase in human infection with avian influenza A(H7N9) virus in China, September–December 2016. West. Pac. Surveill. Response J. Wpsar 2017, 8, 6–14. [Google Scholar] [CrossRef] [PubMed] [Green Version]
- Zhou, L.; Tan, Y.; Kang, M.; Liu, F.; Ren, R.; Wang, Y.; Chen, T.; Yang, Y.; Li, C.; Wu, J. Preliminary Epidemiology of Human Infections with Highly Pathogenic Avian Influenza A(H7N9) Virus, China, 2017. Emerg. Infect. Dis. 2017, 23, 1355–1359. [Google Scholar] [CrossRef] [PubMed]
- Su, S.; Min, G.; Di, L.; Jie, C.; Gao, G.F.; Zhou, J.; Liu, X. Epidemiology, Evolution, and Pathogenesis of H7N9 Influenza Viruses in Five Epidemic Waves since 2013 in China—ScienceDirect. Trends Microbiol. 2017, 25, 713–728. [Google Scholar] [CrossRef] [PubMed]
- Guinat, C.; Nicolas, G.; Vergne, T.; Bronner, A.; Paul, M.C. Spatio-temporal patterns of highly pathogenic avian influenza virus subtype H5N8 spread, France, 2016 to 2017. Eur. Commun. Dis. Bull. 2018, 23, 1700791. [Google Scholar] [CrossRef]
- Ramani, R.; Devi, K.V.; Soundar, K.R. MapReduce-based big data framework using modified artificial neural network classifier for diabetic chronic disease prediction. Soft Comput. 2020, 24, 16335–16345. [Google Scholar] [CrossRef]
- Su, X.; Xu, Y.; Tan, Z.; Wang, X.; Shang, L. Prediction for cardiovascular diseases based on laboratory data: An analysis of random forest model. J. Clin. Lab. Anal. 2020, 34, e23421. [Google Scholar] [CrossRef]
- Din, A.; Li, Y.; Khan, T.; Zaman, G. Mathematical analysis of spread and control of the novel corona virus (COVID-19) in China. Chaos Solitons Fractals 2020, 141, 110286. [Google Scholar] [CrossRef]
- Martins-Melo, F.R.; Pinheiro, M.C.C.; Ramos, A.N., Jr.; Alencar, C.H.; Heukelbach, J. Spatiotemporal Patterns of Schistosomiasis-Related Deaths, Brazil, 2000–2011. Emerg. Infect. Dis. 2015, 21, 1820–1823. [Google Scholar] [CrossRef]
- Anselin, L.; Syabri, I.; Kho, Y. GeoDa: An Introduction to Spatial Data Analysis. Geogr. Anal. 2006, 38, 5–22. [Google Scholar] [CrossRef]
- Zheng, Z.; Lu, Y.; Short, K.R.; Lu, J. One health insights to prevent the next HxNy viral outbreak: Learning from the epidemiology of H7N9. Bmc Infect. Dis. 2019, 19, 138. [Google Scholar] [CrossRef]
- Zou, D.; Cao, Y.; Zhou, D.; Gu, Q. Gradient descent optimizes over-parameterized deep ReLU networks. Mach. Learn. 2020, 109, 467–492. [Google Scholar] [CrossRef]
- Yarotsky, D. Error bounds for approximations with deep ReLU networks. Neural Netw. Off. J. Int. Neural Netw. Soc. 2017, 94, 103–114. [Google Scholar] [CrossRef] [PubMed]
- Han, J.; Moraga, C. The Influence of the Sigmoid Function Parameters on the Speed of Backpropagation Learning. In Proceedings of the International Workshop on Artificial Neural Networks: From Natural to Artificial Neural Computation, Malaga-Torremolinos, Spain, 7–9 June 1995. [Google Scholar]
- Baione, F.; Biancalana, D.; Angelis, P. An application of Sigmoid and Double-Sigmoid functions for dynamic policyholder behaviour. Decis. Econ. Financ. 2021, 44, 5–22. [Google Scholar] [CrossRef]
- Xu, W.; Jiang, L.; Li, C. Improving data and model quality in crowdsourcing using cross-entropy-based noise correction. Inf. Sci. 2021, 546, 803–814. [Google Scholar] [CrossRef]
- Hurtik, P.; Tomasiello, S.; Hula, J.; Hynar, D. Binary cross-entropy with dynamical clipping. Neural Comput. Appl. 2022, 34, 12029–12041. [Google Scholar] [CrossRef]
- Wang, Q.; Dong, W.; Yang, K.; Ren, Z.; Huang, D.; Zhang, P.; Wang, J. Temporal and spatial analysis of COVID-19 transmission in China and its influencing factors. Int. J. Infect. Dis. 2021, 105, 675–685. [Google Scholar] [CrossRef]
- Jia, P.; Joyner, A. Human brucellosis occurrences in inner mongolia, China: A spatio-temporal distribution and ecological niche modeling approach. BMC Infect. Dis. 2015, 15, 36. [Google Scholar] [CrossRef]
- Wang, D.; Larder, B.; Revell, A.; Montaner, J.; Harrigan, R.; De Wolf, F.; Lange, J.; Wegner, S.; Ruiz, L.; Perez-Elias, M.J.; et al. A comparison of three computational modelling methods for the prediction of virological response to combination HIV therapy. Artif. Intell. Med. 2009, 47, 63–74. [Google Scholar] [CrossRef]
- Guo, G.Y.; Liu, Z.Y.; Zhao, S.J.; Guo, L.; Liu, T.M. Eliminating Indefiniteness of Clinical Spectrum for Better Screening COVID-19. IEEE J. Biomed. Health Inform. 2021, 25, 1347–1357. [Google Scholar] [CrossRef]
- Oliveira, R.; Bastos, C.J.A.; Medeiros, A.; Buarque, P.; Freire, D.L. Machine learning applied in SARS-CoV-2 COVID 19 screening using clinical analysis parameters. IEEE Lat. Am. Trans. 2021, 19, 978–985. [Google Scholar] [CrossRef]
- Yu, H.; Samuels, D.C.; Zhao, Y.Y.; Guo, Y. Architectures and accuracy of artificial neural network for disease classification from omics data. BMC Genom. 2019, 20, 167. [Google Scholar] [CrossRef] [PubMed] [Green Version]
- Choi, E.; Schuetz, A.; Stewart, W.F.; Sun, J.M. Using recurrent neural network models for early detection of heart failure onset. J. Am. Med. Inform. Assoc. 2017, 24, 361–370. [Google Scholar] [CrossRef] [PubMed]
- Lai, N.H.; Shen, W.C.; Lee, C.N.; Chang, J.C.; Hsu, M.C.; Kuo, L.N.; Yu, M.C.; Chen, H.Y. Comparison of the predictive outcomes for anti-tuberculosis drug-induced hepatotoxicity by different machine learning techniques. Comput. Methods Programs Biomed. 2020, 188, 105307. [Google Scholar] [CrossRef] [PubMed]
- Shh, A.; Cyc, A.; Ych, B.; Syw, C.; Lnka, D.; Kjb, E.; Mcy, E.; Jhcfg, H.; Ehl, E.; Hyca, D. How Platinum-Induced Nephrotoxicity occurs? Machine Learning Prediction in Non-small Cell Lung Cancer Patients. Comput. Methods Programs Biomed. 2022, 221, 106839. [Google Scholar]
- Xu, M.; Cao, C.; Li, Q.; Peng, J.; Jian, Z. Ecological Niche Modeling of Risk Factors for H7N9 Human Infection in China. Int. J. Environ. Res. Public Health 2016, 13, 600. [Google Scholar] [CrossRef] [Green Version]
- Minh, B.C.; Lauren, G.; Raina, M.; Sahotra, S. Influenza A H5N1 and H7N9 in China: A spatial risk analysis. PLoS ONE 2017, 12, e0176903. [Google Scholar]


| Year | Moran’I | p |
|---|---|---|
| 2013 | 0.080128 | 0.047867 |
| 2014 | 0.073792 | 0.000089 |
| 2015 | 0.138015 | <0.01 |
| 2016 | 0.139221 | <0.01 |
| 2017 | 0.050739 | 0.042006 |
| Independent Variable | p | t | Mean Value ± Standard Deviation | 95%CI | |
|---|---|---|---|---|---|
| Lower | Upper | ||||
| population | <0.001 | −5.535 | −0.70 ± 0.012 | −0.094 | −0.045 |
| animal husbandry output value | 0.359 | 1.780 | 0.041 ± 0.023 | −0.004 | 0.086 |
| poultry farming | 0.871 | −0.513 | −0.011 ± 0.022 | −0.055 | 0.032 |
| poultry market | 0.184 | −4.685 | −0.704 ± 0.015 | −0.105 | −0.043 |
| mean vegetation | 0.009 | 1.691 | 0.028 ± 0.016 | −0.004 | 0.061 |
| distance between case and river | <0.001 | 4.376 | 0.047 ± 0.010 | 0.026 | 0.068 |
| city | 0.181 | −2.534 | −0.062 ± 0.024 | −0.111 | −0.141 |
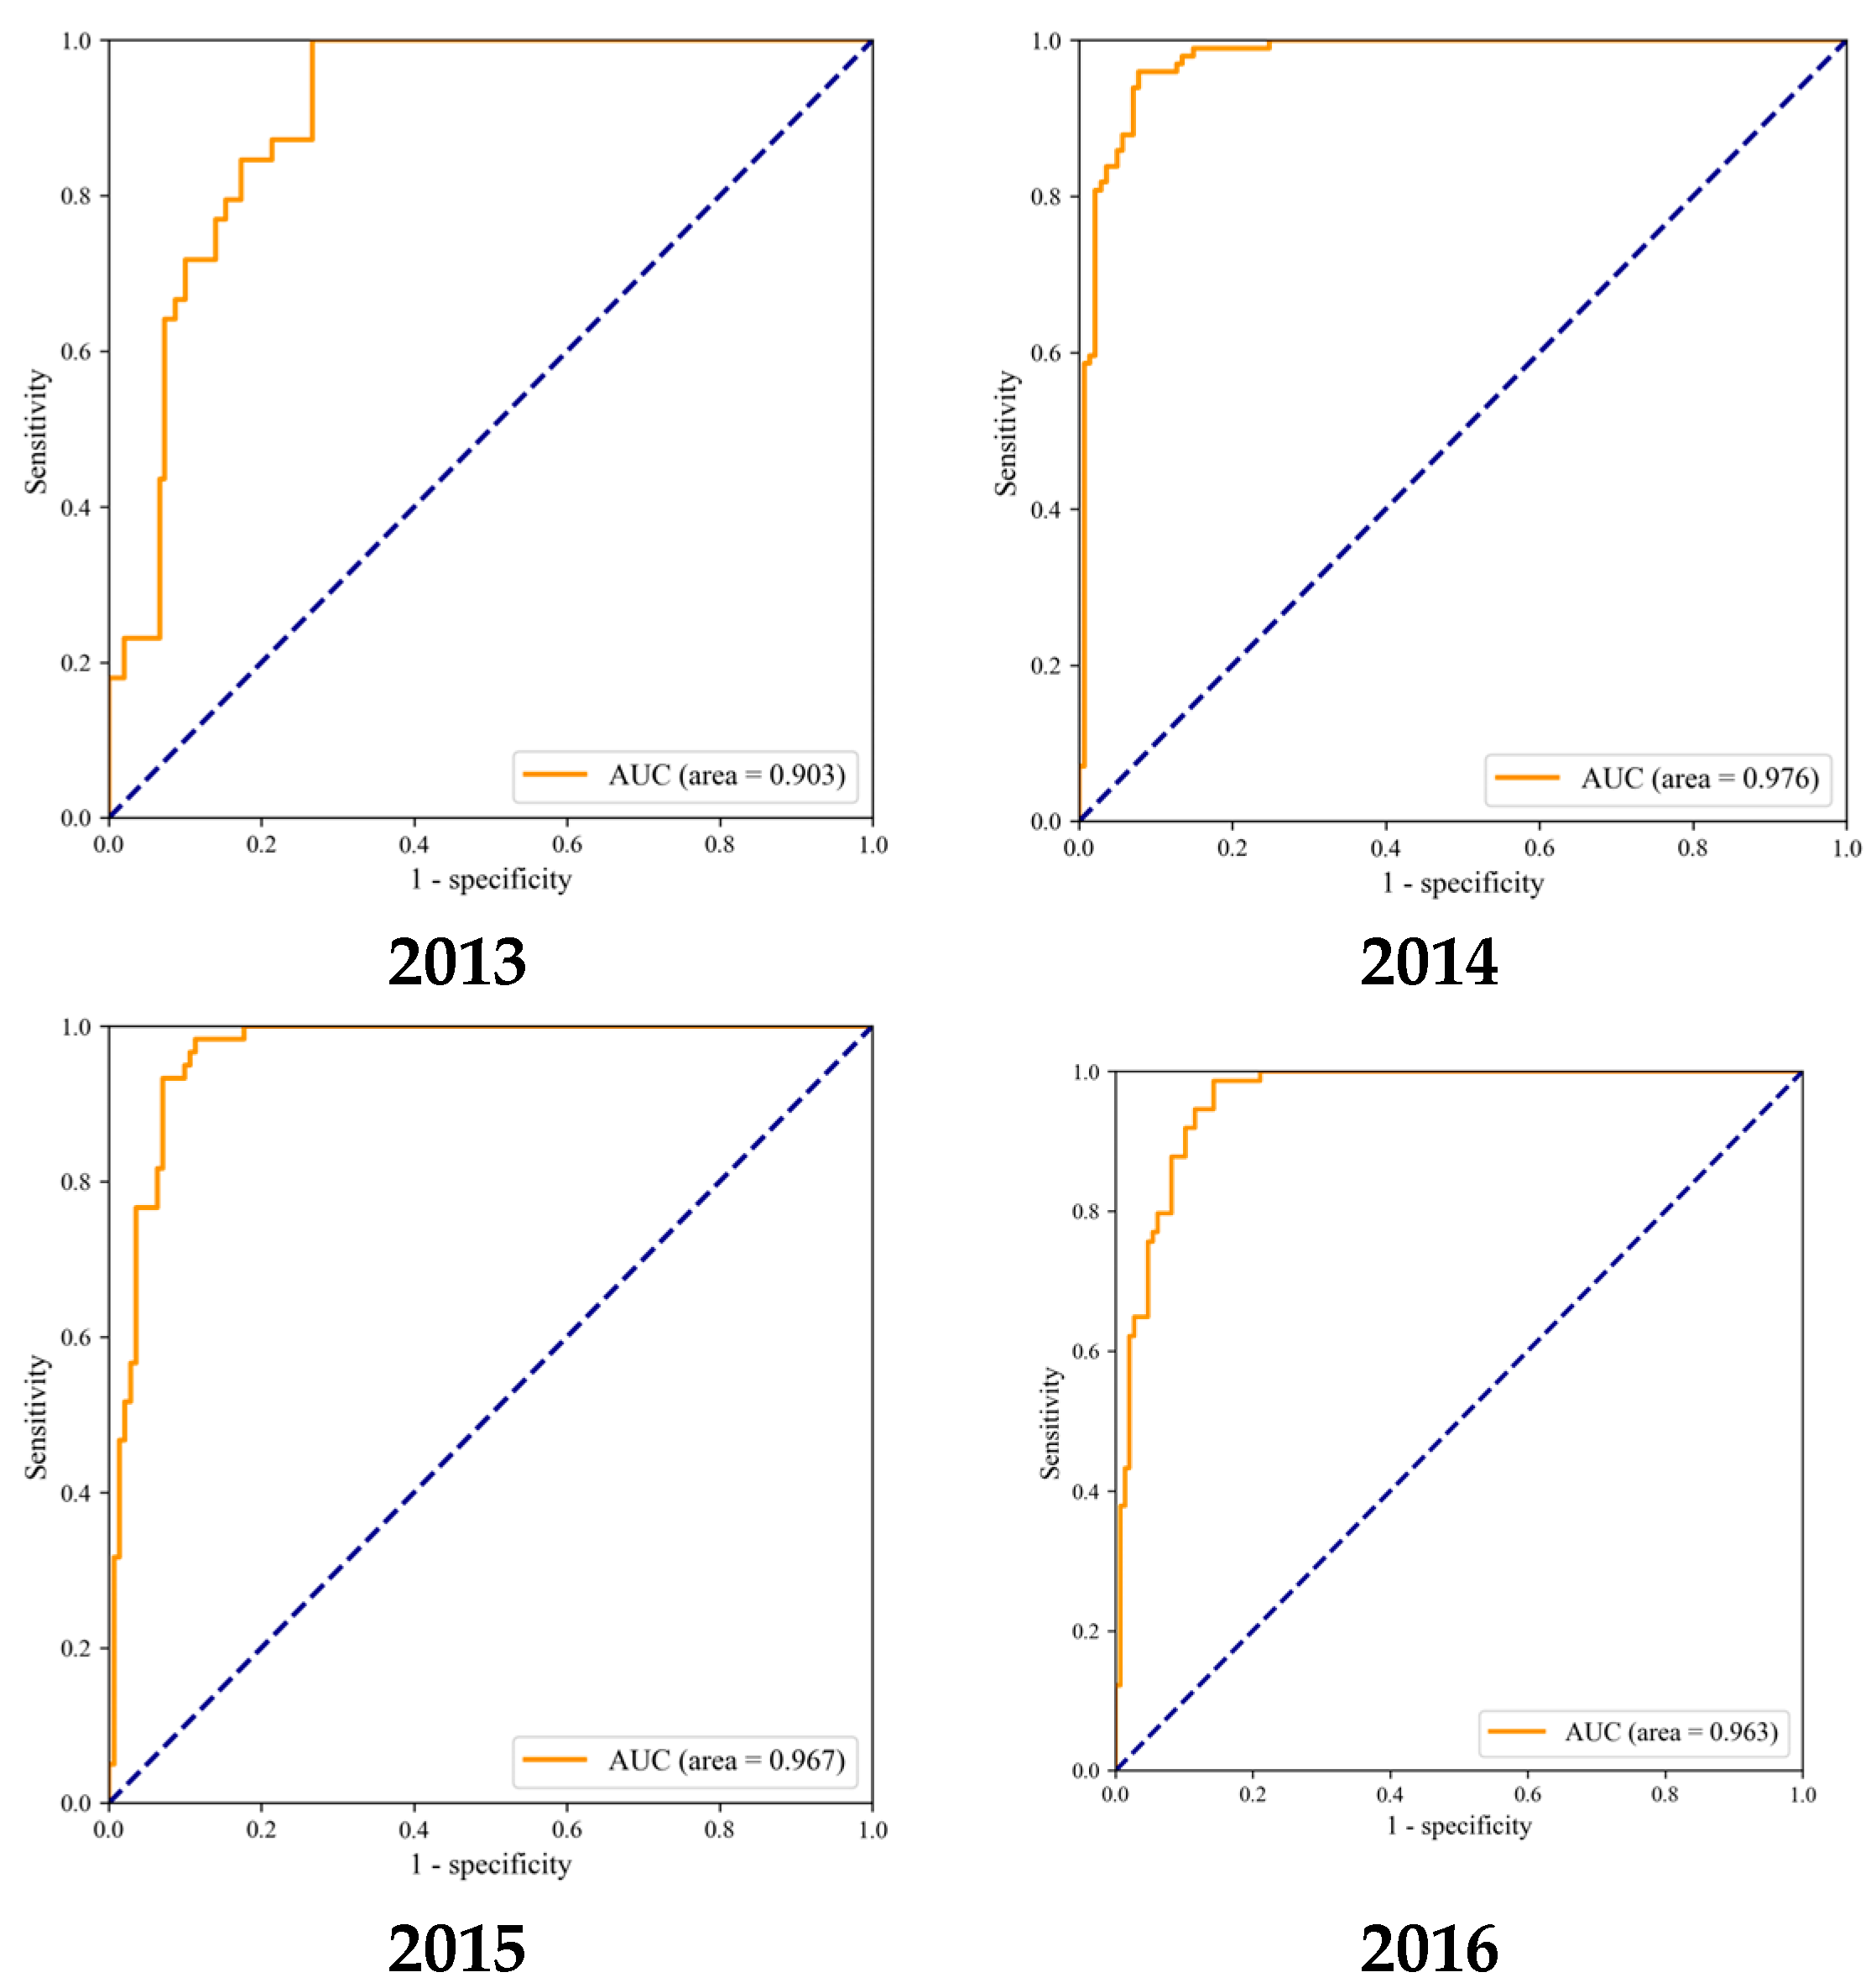
| 2013 | 2014 | 2015 | 2016 | 2017 | |
|---|---|---|---|---|---|
| simulation accuracy | 85.71% | 91.25% | 91.54% | 90.49% | 92.74% |
| AUC | 0.903 | 0.976 | 0.967 | 0.963 | 0.970 |
Publisher’s Note: MDPI stays neutral with regard to jurisdictional claims in published maps and institutional affiliations. |
© 2022 by the authors. Licensee MDPI, Basel, Switzerland. This article is an open access article distributed under the terms and conditions of the Creative Commons Attribution (CC BY) license (https://creativecommons.org/licenses/by/4.0/).
Share and Cite
Dong, W.; Zhang, P.; Xu, Q.-L.; Ren, Z.-D.; Wang, J. A Study on a Neural Network Risk Simulation Model Construction for Avian Influenza A (H7N9) Outbreaks in Humans in China during 2013–2017. Int. J. Environ. Res. Public Health 2022, 19, 10877. https://doi.org/10.3390/ijerph191710877
Dong W, Zhang P, Xu Q-L, Ren Z-D, Wang J. A Study on a Neural Network Risk Simulation Model Construction for Avian Influenza A (H7N9) Outbreaks in Humans in China during 2013–2017. International Journal of Environmental Research and Public Health. 2022; 19(17):10877. https://doi.org/10.3390/ijerph191710877
Chicago/Turabian StyleDong, Wen, Peng Zhang, Quan-Li Xu, Zhong-Da Ren, and Jie Wang. 2022. "A Study on a Neural Network Risk Simulation Model Construction for Avian Influenza A (H7N9) Outbreaks in Humans in China during 2013–2017" International Journal of Environmental Research and Public Health 19, no. 17: 10877. https://doi.org/10.3390/ijerph191710877
APA StyleDong, W., Zhang, P., Xu, Q.-L., Ren, Z.-D., & Wang, J. (2022). A Study on a Neural Network Risk Simulation Model Construction for Avian Influenza A (H7N9) Outbreaks in Humans in China during 2013–2017. International Journal of Environmental Research and Public Health, 19(17), 10877. https://doi.org/10.3390/ijerph191710877