Sequential Multiple Imputation for Real-World Health-Related Quality of Life Missing Data after Bariatric Surgery
Abstract
1. Introduction
2. Materials and Methods
2.1. Data Sources
2.2. SF-36 and SF-6D
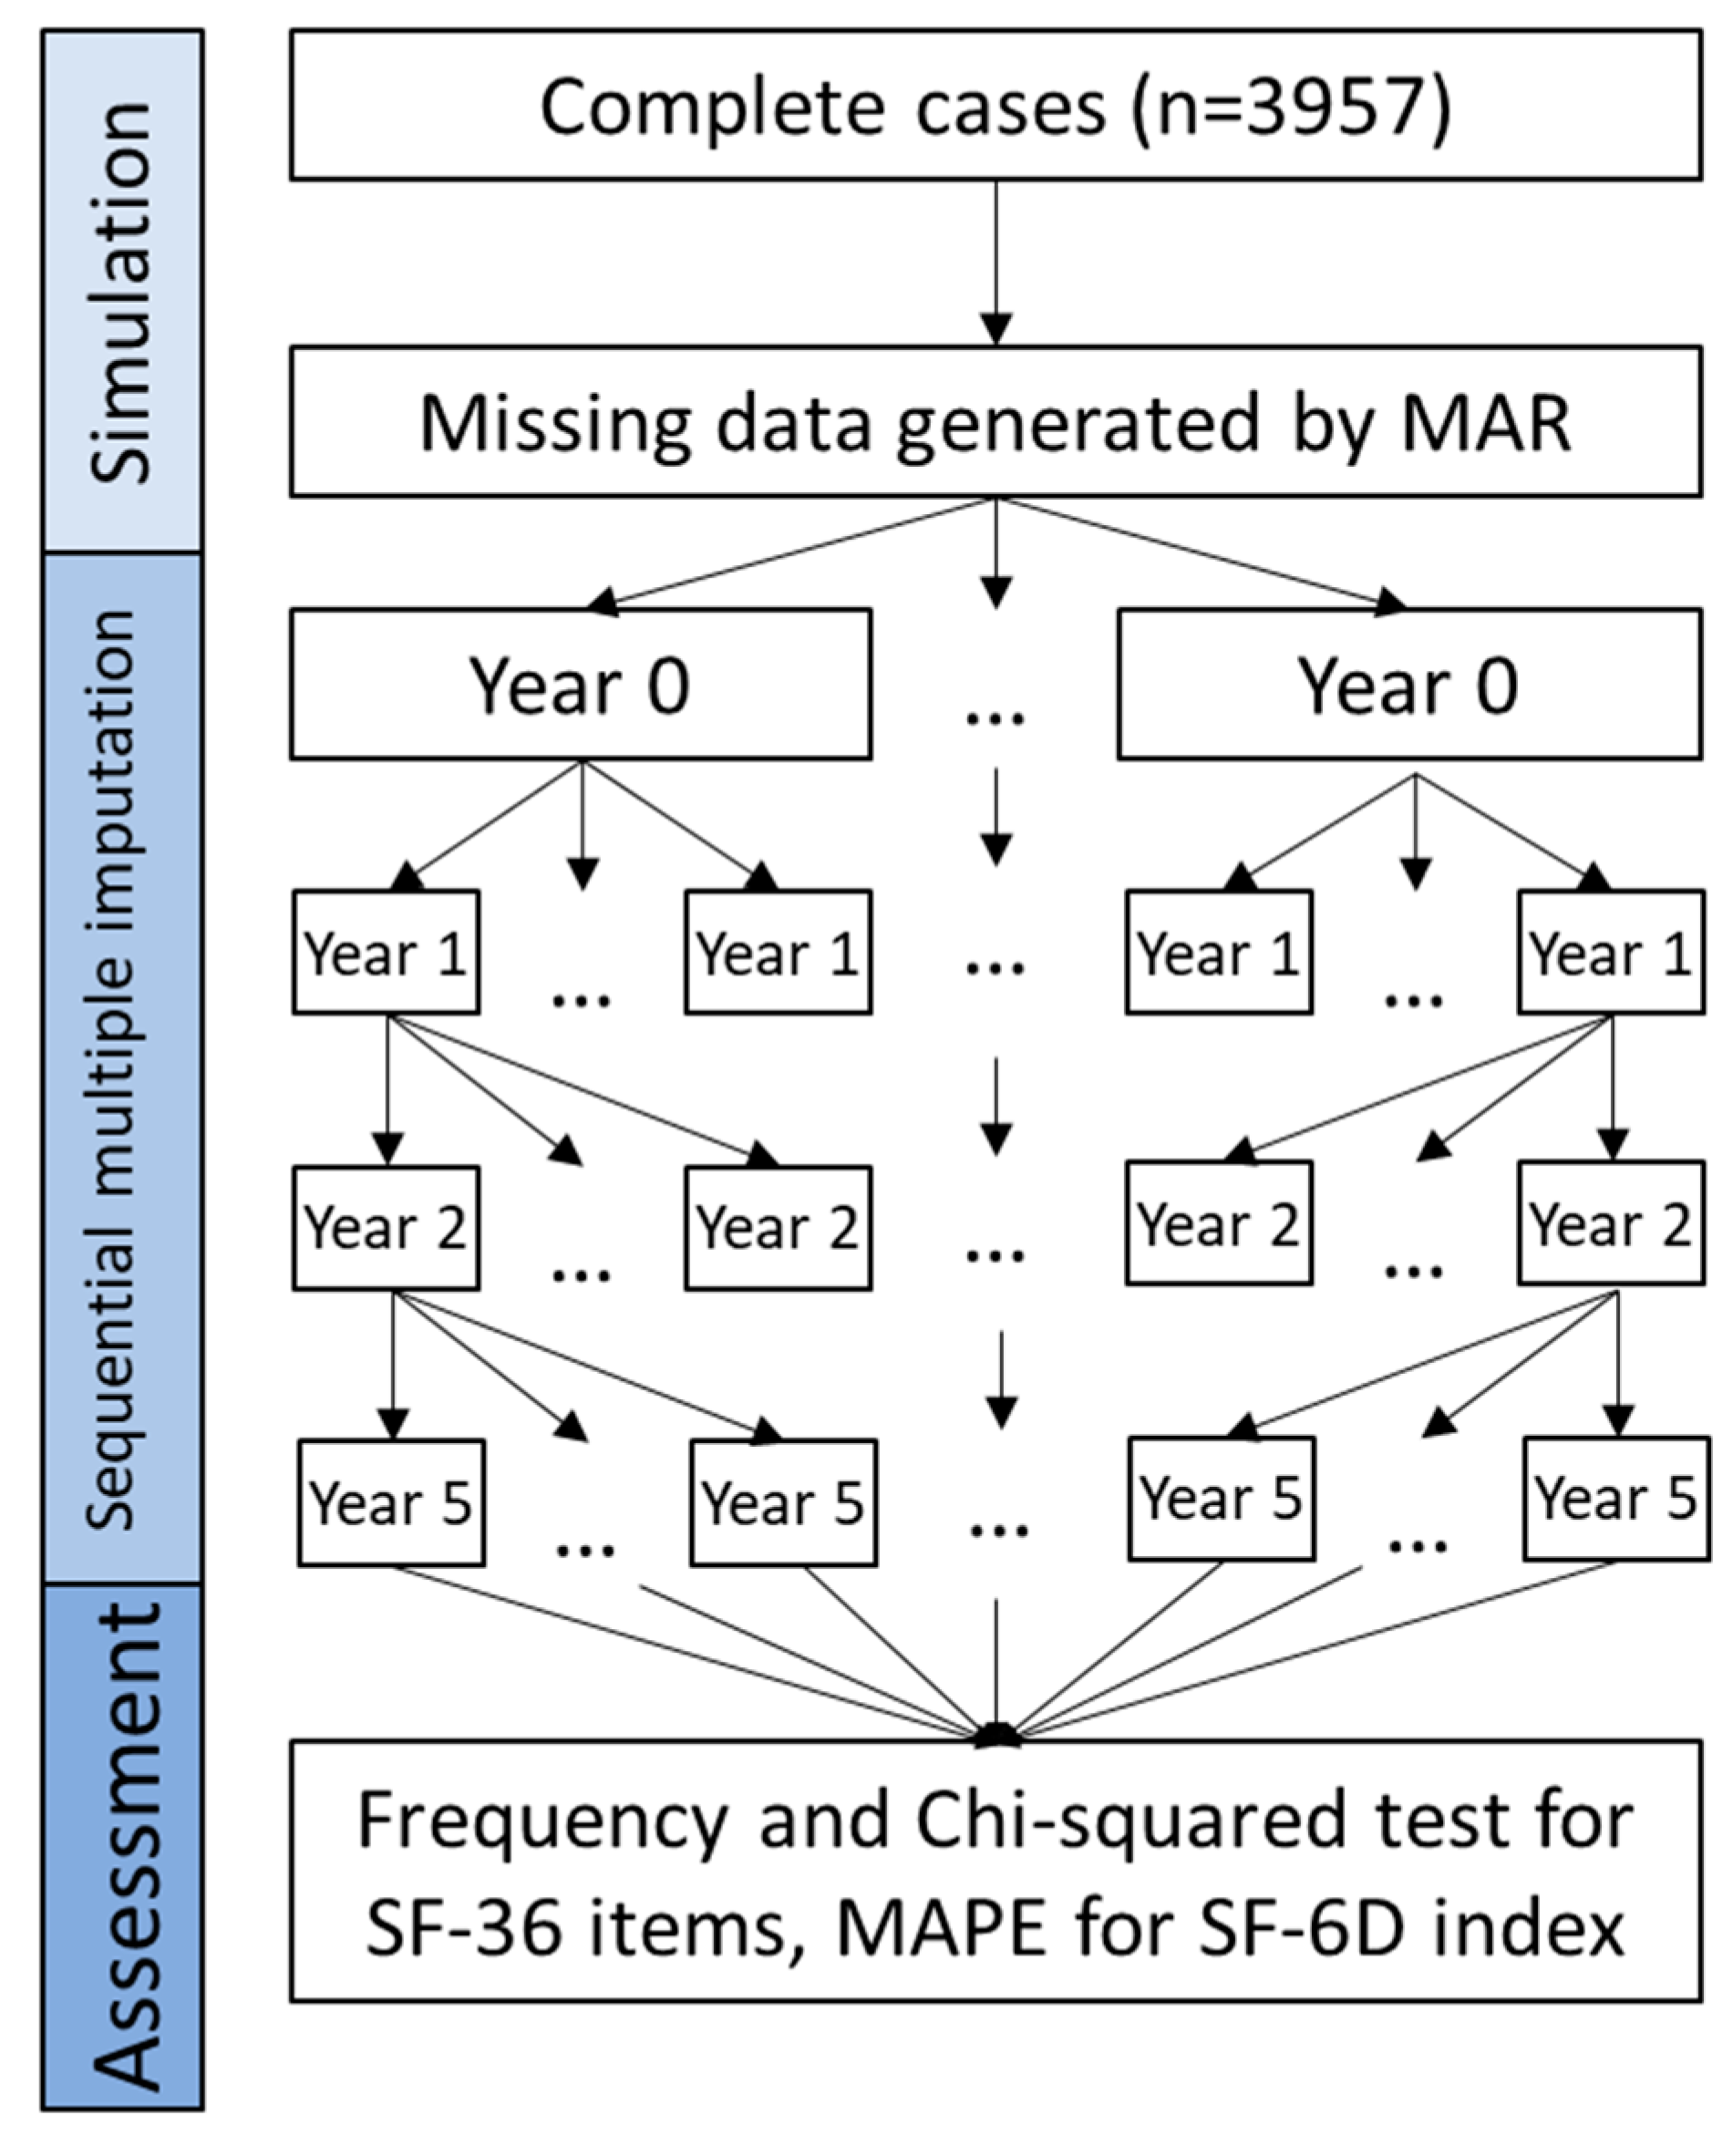
2.3. Missingness Mechanism and Missingness Pattern Simulation
2.4. Process of the Sequential Multiple Imputation
2.5. Assessment of Performance
3. Results
3.1. Characteristics of the Patients
3.2. Imputation Results for the Selected SF-36 Items
3.3. Imputation Results for SF-6D Index
4. Discussion
4.1. Main Findings
4.2. Strengths and Limitations
5. Conclusions
Supplementary Materials
Author Contributions
Funding
Institutional Review Board Statement
Informed Consent Statement
Data Availability Statement
Conflicts of Interest
References
- Fayers, P.M.; Machin, D. Quality of Life: The Assessment, Analysis and Interpretation of Patient-Reported Outcomes, 2nd ed.; John Wiley & Sons: New York, NY, USA, 2006. [Google Scholar]
- Thong, M.S.; Mols, F.; Stein, K.D.; Smith, T.; Coebergh, J.W.; van de Poll-Franse, L.V. Population-based cancer registries for quality-of-life research: A work-in-progress resource for survivorship studies? Cancer 2013, 119 (Suppl. S11), 2109–2123. [Google Scholar] [CrossRef] [PubMed]
- Yang, F.; Dawes, P.; Leroi, I.; Gannon, B. Measurement tools of resource use and quality of life in clinical trials for dementia or cognitive impairment interventions: A systematically conducted narrative review. Int. J. Geriatr. Psychiatr. 2018, 33, E166–E176. [Google Scholar] [CrossRef] [PubMed]
- Clarke, S.A.; Eiser, C. The measurement of health-related quality of life (QOL) in paediatric clinical trials: A systematic review. Health Qual. Life Outcomes 2004, 2, 66. [Google Scholar] [CrossRef]
- Tengs, T.O.; Wallace, A. One thousand health-related quality-of-life estimates. Med. Care 2000, 38, 583–637. [Google Scholar] [CrossRef] [PubMed]
- Rabin, R.; Charro, F.D. EQ-SD: A measure of health status from the EuroQol Group. Ann. Med. 2001, 33, 337–343. [Google Scholar] [CrossRef]
- Brazier, J.; Roberts, J.; Deverill, M. The estimation of a preference-based measure of health from the SF-36. J. Health Econ. 2002, 21, 271–292. [Google Scholar] [CrossRef]
- Brazier, J.E.; Roberts, J. The estimation of a preference-based measure of health from the SF-12. Med. Care 2004, 42, 851–859. [Google Scholar] [CrossRef]
- Horsman, J.; Furlong, W.; Feeny, D.; Torrance, G. The Health Utilities Index (HUI): Concepts, measurement properties and applications. Health Qual. Life Outcomes 2003, 1, 54. [Google Scholar] [CrossRef]
- Drummond, M.F.; Sculpher, M.; Torrance, G.W.; O’Brien, B.J.; Stoddart, G.L. Methods for the Economic Evaluation of Health Care Programs; Oxford University Press: New York, NY, USA, 2005; p. 404. [Google Scholar]
- Zwinderman, A.H. Statistical analysis of longitudinal quality of life data with missing measurements. Qual. Life Res. 1992, 1, 219–224. [Google Scholar] [CrossRef]
- Peyre, H.; Coste, J.; Leplege, A. Identifying type and determinants of missing items in quality of life questionnaires: Application to the SF-36 French version of the 2003 Decennial Health Survey. Health Qual. Life Outcomes 2010, 8, 16. [Google Scholar] [CrossRef]
- Li, T.; Hutfless, S.; Scharfstein, D.O.; Daniels, M.J.; Hogan, J.W.; Little, R.J.A.; Roy, J.A.; Law, A.H.; Dickersin, K. Standards should be applied in the prevention and handling of missing data for patient-centered outcomes research: A systematic review and expert consensus. J. Clin. Epidemiol. 2014, 67, 15–32. [Google Scholar] [CrossRef] [PubMed]
- Rombach, I.; Rivero-Arias, O.; Gray, A.M.; Jenkinson, C.; Burke, O. The current practice of handling and reporting missing outcome data in eight widely used PROMs in RCT publications: A review of the current literature. Qual. Life Res. 2016, 25, 1613–1623. [Google Scholar] [CrossRef]
- Lin, T.H. Missing data imputation in quality-of-life assessment: Imputation for WHOQOL-BREF. Pharmacoeconomics 2006, 24, 917–925. [Google Scholar] [CrossRef]
- Little, R.J.; Rubin, D.B. Statistical Analysis with Missing Data; John Wiley & Sons: New York, NY, USA, 2019; Volume 793. [Google Scholar]
- Jakobsen, J.C.; Gluud, C.; Wetterslev, J.; Winkel, P. When and how should multiple imputation be used for handling missing data in randomised clinical trials—A practical guide with flowcharts. BMC Med. Res. Methodol. 2017, 17, 162. [Google Scholar] [CrossRef] [PubMed]
- Katkade, V.B.; Sanders, K.N.; Zou, K.H. Real world data: An opportunity to supplement existing evidence for the use of long-established medicines in health care decision making. J. Multidiscip. Healthc. 2018, 11, 295–304. [Google Scholar] [CrossRef]
- Berger, M.L.; Sox, H.; Willke, R.J.; Brixner, D.L.; Eichler, H.G.; Goettsch, W.; Madigan, D.; Makady, A.; Schneeweiss, S.; Tarricone, R.; et al. Good Practices for Real-World Data Studies of Treatment and/or Comparative Effectiveness: Recommendations from the Joint ISPOR-ISPE Special Task Force on Real-World Evidence in Health Care Decision Making. Value Health 2017, 20, 1003–1008. [Google Scholar] [CrossRef]
- Hedenbro, J.L.; Naslund, E.; Boman, L.; Lundegayenrdh, G.; Bylund, A.; Ekelund, M.; Laurenius, A.; Moller, P.; Olbers, T.; Sundbom, M.; et al. Formation of the Scandinavian Obesity Surgery Registry, SOReg. Obes. Surg. 2015, 25, 1893–1900. [Google Scholar] [CrossRef]
- Sundbom, M.; Naslund, I.; Naslund, E.; Ottosson, J. High acquisition rate and internal validity in the Scandinavian Obesity Surgery Registry. Surg. Obes. Relat. Dis. 2021, 17, 606–614. [Google Scholar] [CrossRef] [PubMed]
- Ware, J.E., Jr. SF-36 health survey update. Spine 2000, 25, 3130–3139. [Google Scholar] [CrossRef] [PubMed]
- Aasprang, A.; Andersen, J.R.; Vage, V.; Kolotkin, R.L.; Natvig, G.K. Psychosocial functioning before and after surgical treatment for morbid obesity: Reliability and validation of the Norwegian version of obesity-related problem scale. PeerJ 2015, 3, e1275. [Google Scholar] [CrossRef][Green Version]
- Ware, J.E., Jr.; Gandek, B. Overview of the SF-36 Health Survey and the International Quality of Life Assessment (IQOLA) Project. J. Clin. Epidemiol. 1998, 51, 903–912. [Google Scholar] [CrossRef]
- Azur, M.J.; Stuart, E.A.; Frangakis, C.; Leaf, P.J. Multiple imputation by chained equations: What is it and how does it work? Int. J. Methods Psychiatr. Res. 2011, 20, 40–49. [Google Scholar] [CrossRef]
- Simons, C.L.; Rivero-Arias, O.; Yu, L.-M.; Simon, J. Multiple imputation to deal with missing EQ-5D-3L data: Should we impute individual domains or the actual index? Qual. Life Res. 2015, 24, 805–815. [Google Scholar] [CrossRef]
- Rombach, I.; Gray, A.M.; Jenkinson, C.; Murray, D.W.; Rivero-Arias, O. Multiple imputation for patient reported outcome measures in randomised controlled trials: Advantages and disadvantages of imputing at the item, subscale or composite score level. BMC Med. Res. Methodol. 2018, 18, 87. [Google Scholar] [CrossRef]
- Rosel, I.; Serna-Higuita, L.M.; Al Sayah, F.; Buchholz, M.; Buchholz, I.; Kohlmann, T.; Martus, P.; Feng, Y.S. What difference does multiple imputation make in longitudinal modeling of EQ-5D-5L data? Empirical analyses of simulated and observed missing data patterns. Qual. Life Res. 2022, 31, 1521–1532. [Google Scholar] [CrossRef]
- Yang, Y.; Wong, M.Y.; Lam, C.L.; Wong, C.K. Improving the mapping of condition-specific health-related quality of life onto SF-6D score. Qual. Life Res. 2014, 23, 2343–2353. [Google Scholar] [CrossRef]
- Hamzah, F.B.; Hamzah, F.M.; Razali, S.F.M.; Samad, H. A Comparison of Multiple Imputation Methods for Recovering Missing Data in Hydrological Studies. Civ. Eng. J. 2021, 7, 1608–1619. [Google Scholar] [CrossRef]
- Makridakis, S. Accuracy Measures—Theoretical and Practical Concerns. Int. J. Forecast. 1993, 9, 527–529. [Google Scholar] [CrossRef]
- Lam, K.F.; Mui, H.W.; Yuen, H.K. A note on minimizing absolute percentage error in combined forecasts. Comput. Oper. Res. 2001, 28, 1141–1147. [Google Scholar] [CrossRef]
- Koo, T.K.; Li, M.Y. A Guideline of Selecting and Reporting Intraclass Correlation Coefficients for Reliability Research. J. Chiropr. Med. 2017, 16, 346. [Google Scholar] [CrossRef]
- Schmitt-Egenolf, M. PsoReg—The Swedish registry for systemic psoriasis treatment. Dermatology 2007, 214, 112–117. [Google Scholar] [CrossRef]
- Faria, R.; Gomes, M.; Epstein, D.; White, I.R. A Guide to Handling Missing Data in Cost-Effectiveness Analysis Conducted Within Randomised Controlled Trials. Pharmacoeconomics 2014, 32, 1157–1170. [Google Scholar] [CrossRef] [PubMed]
- Ara, R.; Brazier, J. Estimating Health State Utility Values for Comorbid Health Conditions Using SF-6D Data. Value Health 2011, 14, 740–745. [Google Scholar] [CrossRef] [PubMed]
- Cole, S.R.; Chu, H.; Greenland, S. Multiple-imputation for measurement-error correction. Int. J. Epidemiol. 2006, 35, 1074–1081. [Google Scholar] [CrossRef]
- Rao, A.R.; Reimherr, M. Modern multiple imputation with functional data. Stat 2021, 10, e331. [Google Scholar] [CrossRef]
- Carreras, G.; Miccinesi, G.; Wilcock, A.; Preston, N.; Nieboer, D.; Deliens, L.; Groenvold, M.; Lunder, U.; van der Heide, A.; Baccini, M.; et al. Missing not at random in end of life care studies: Multiple imputation and sensitivity analysis on data from the ACTION study. BMC Med. Res. Methodol. 2021, 21, 13. [Google Scholar] [CrossRef]
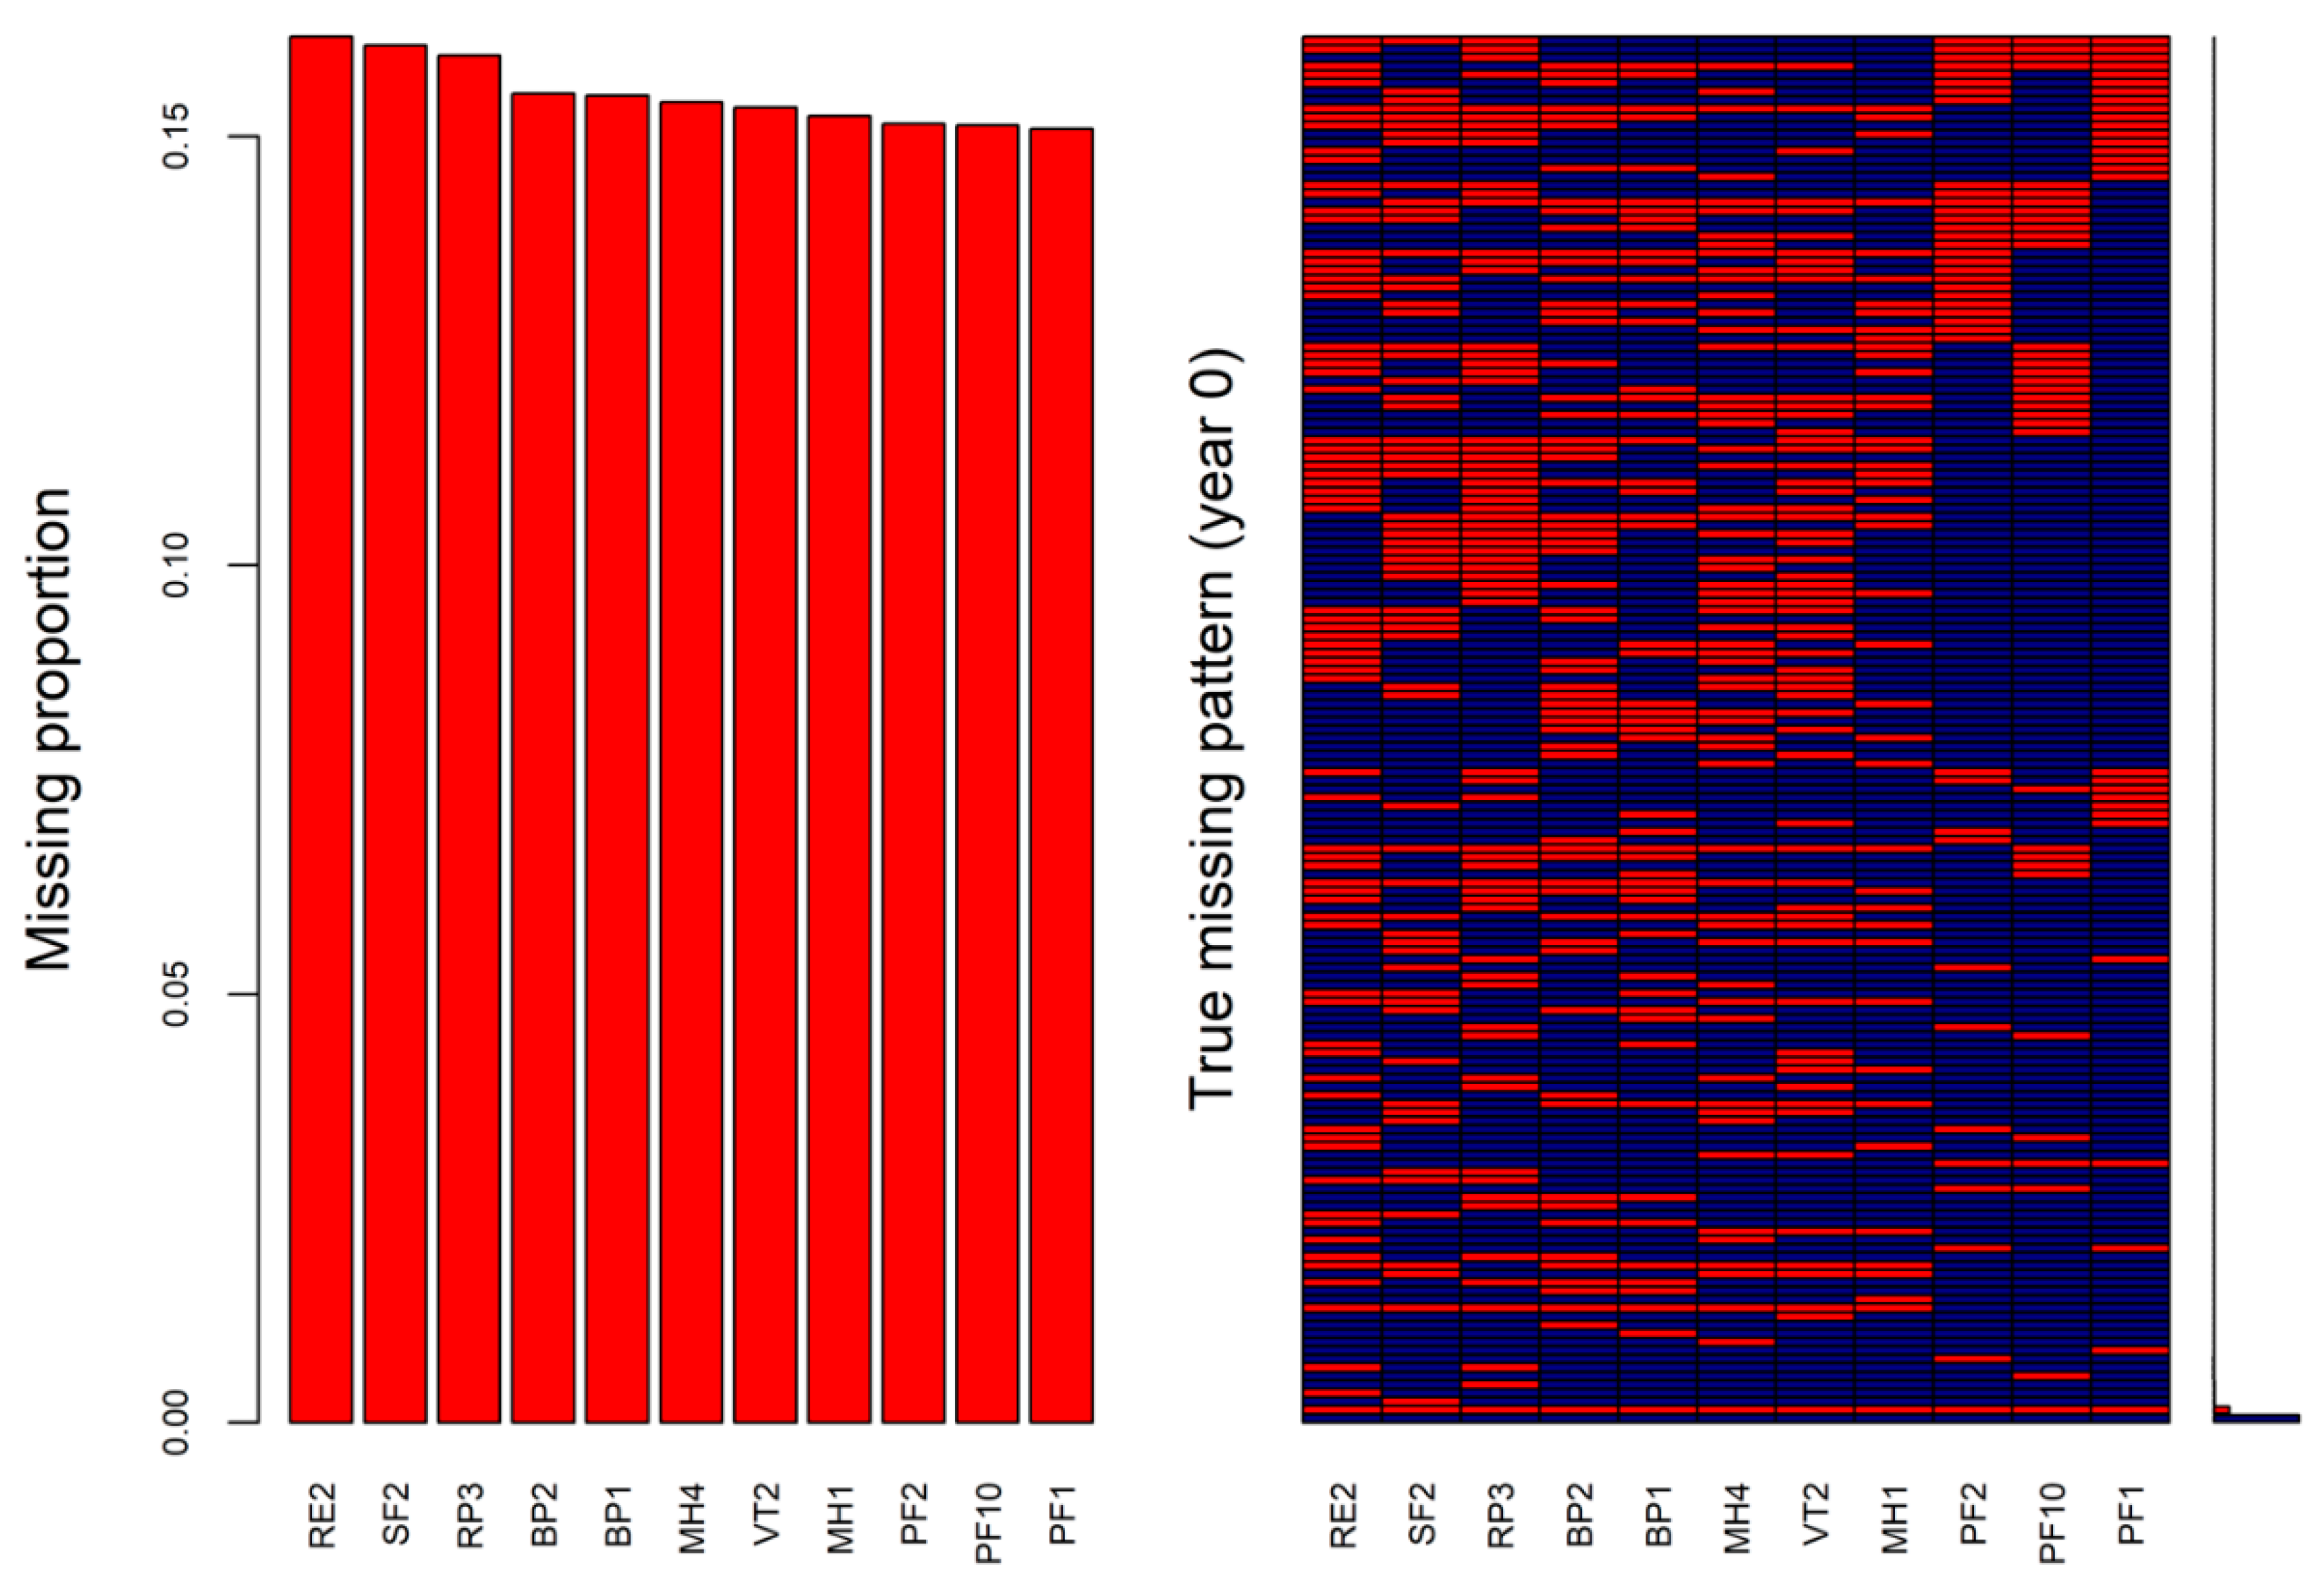
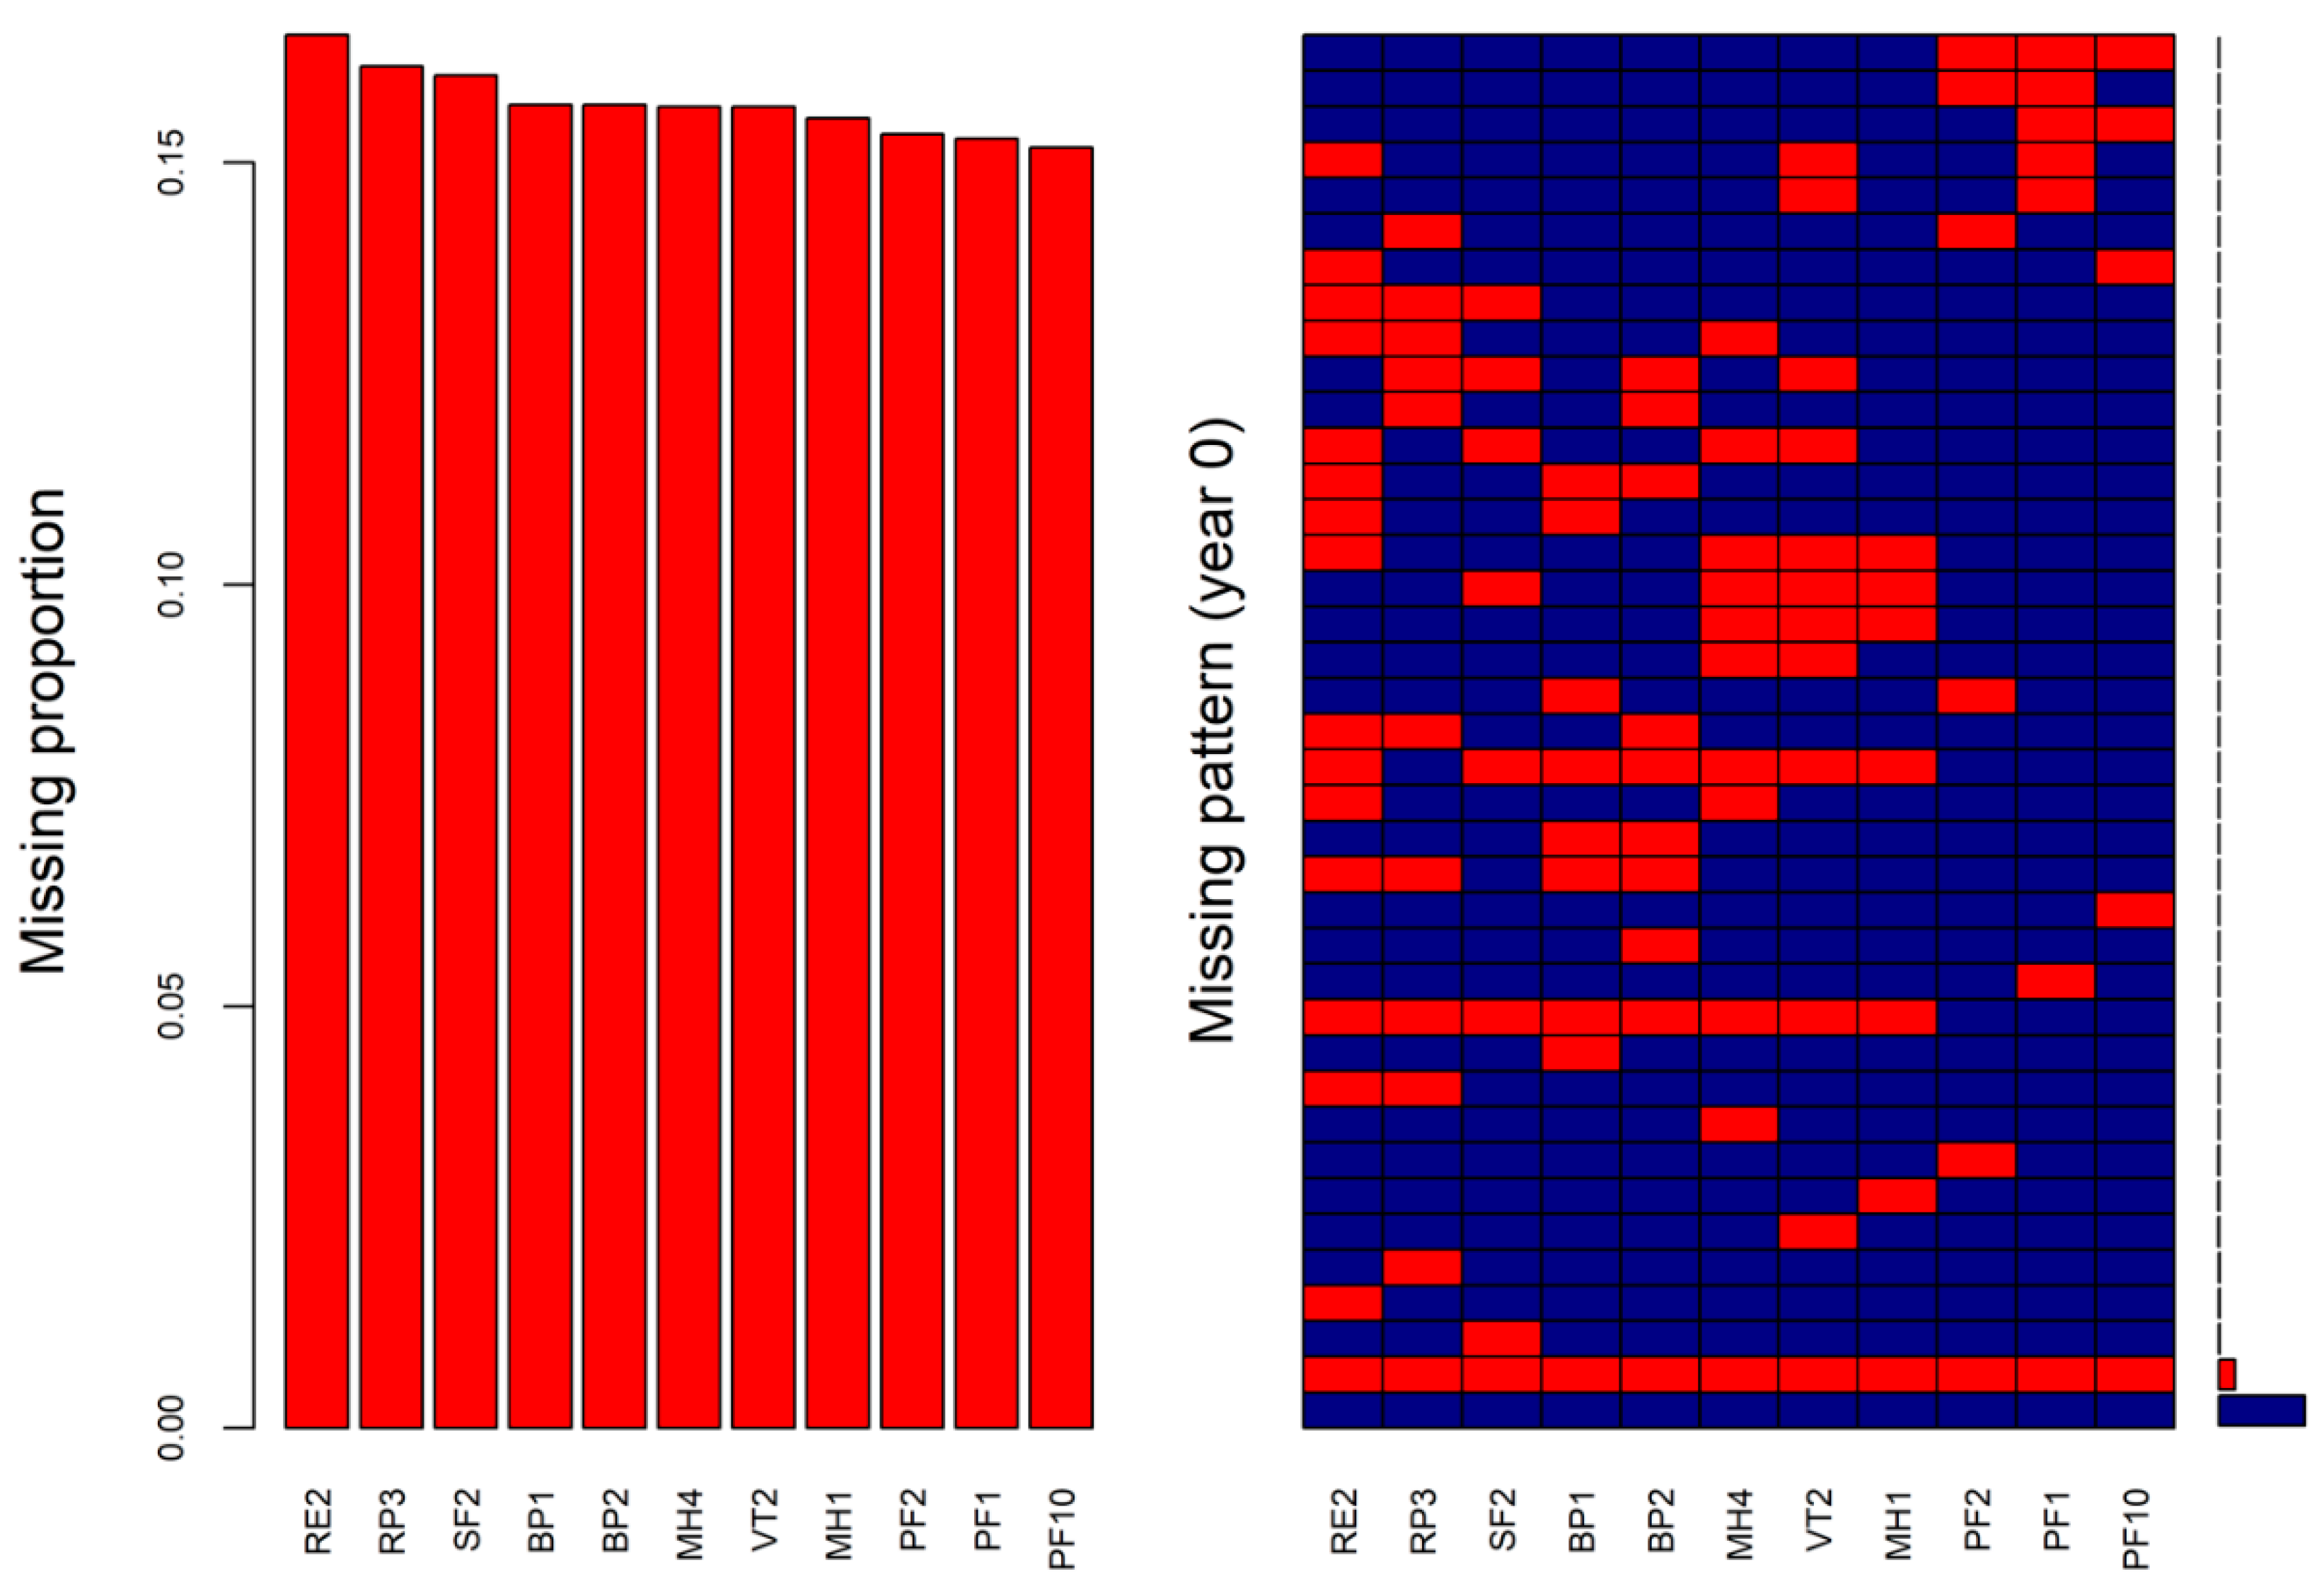
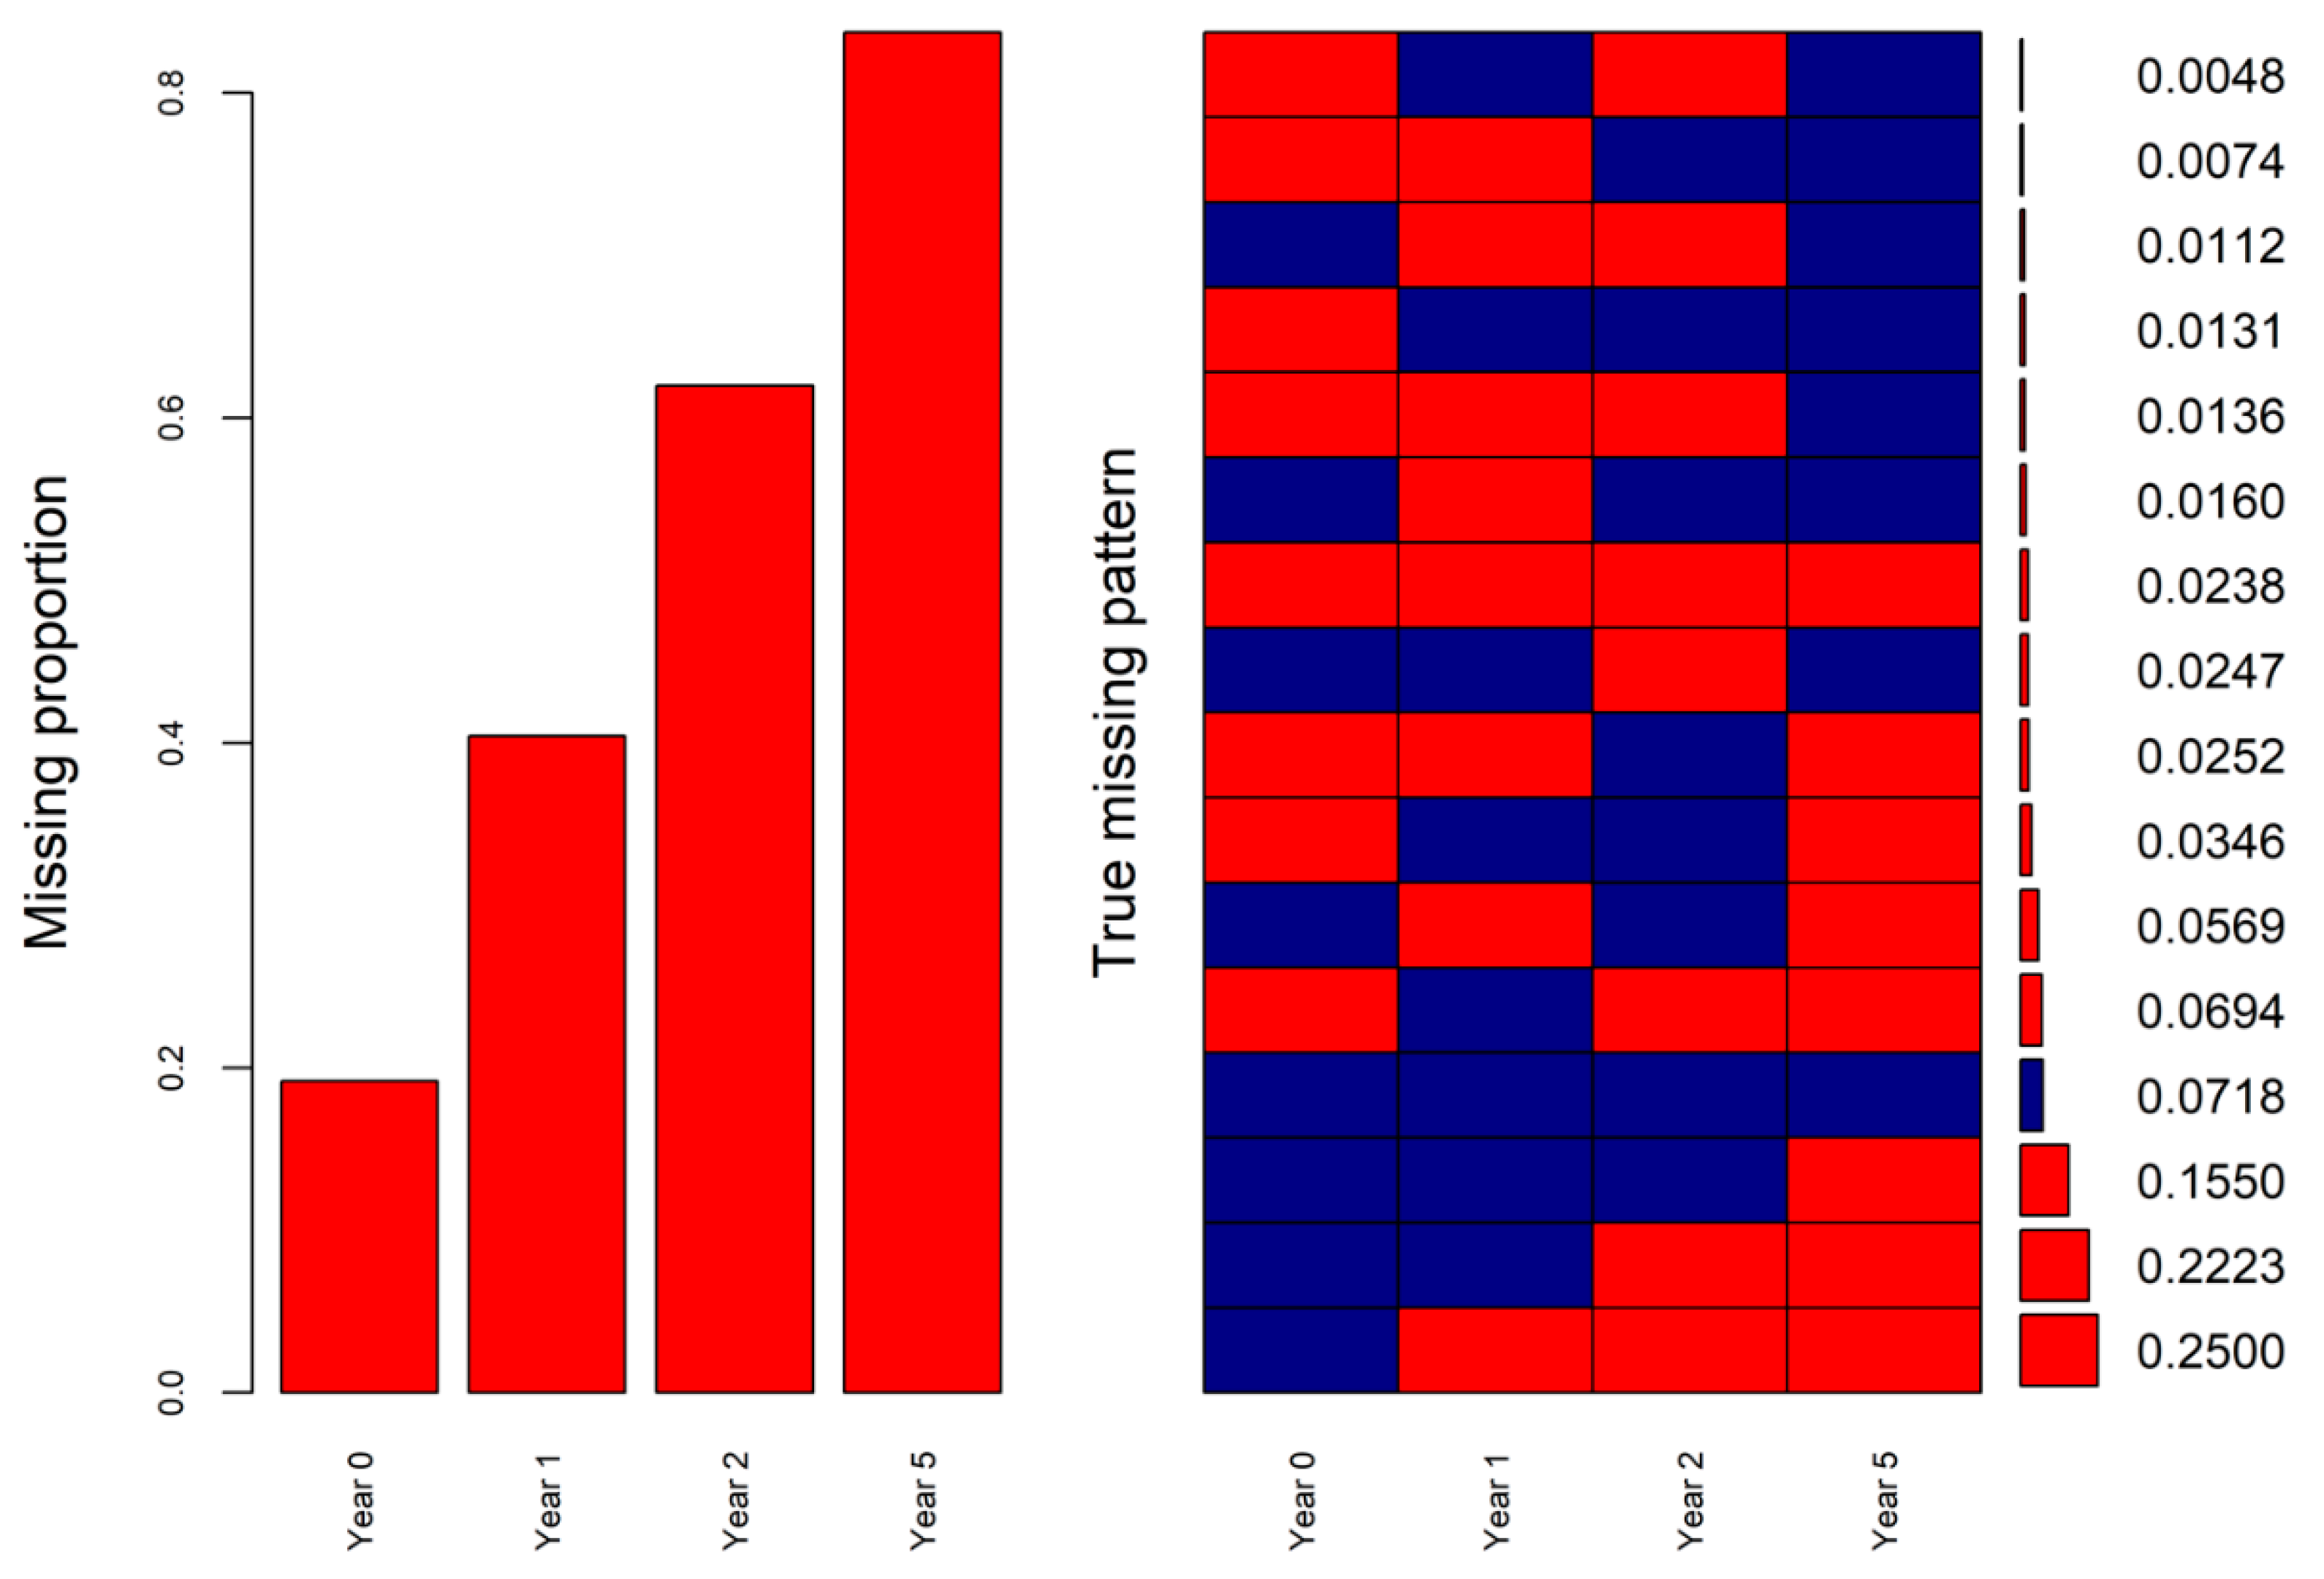
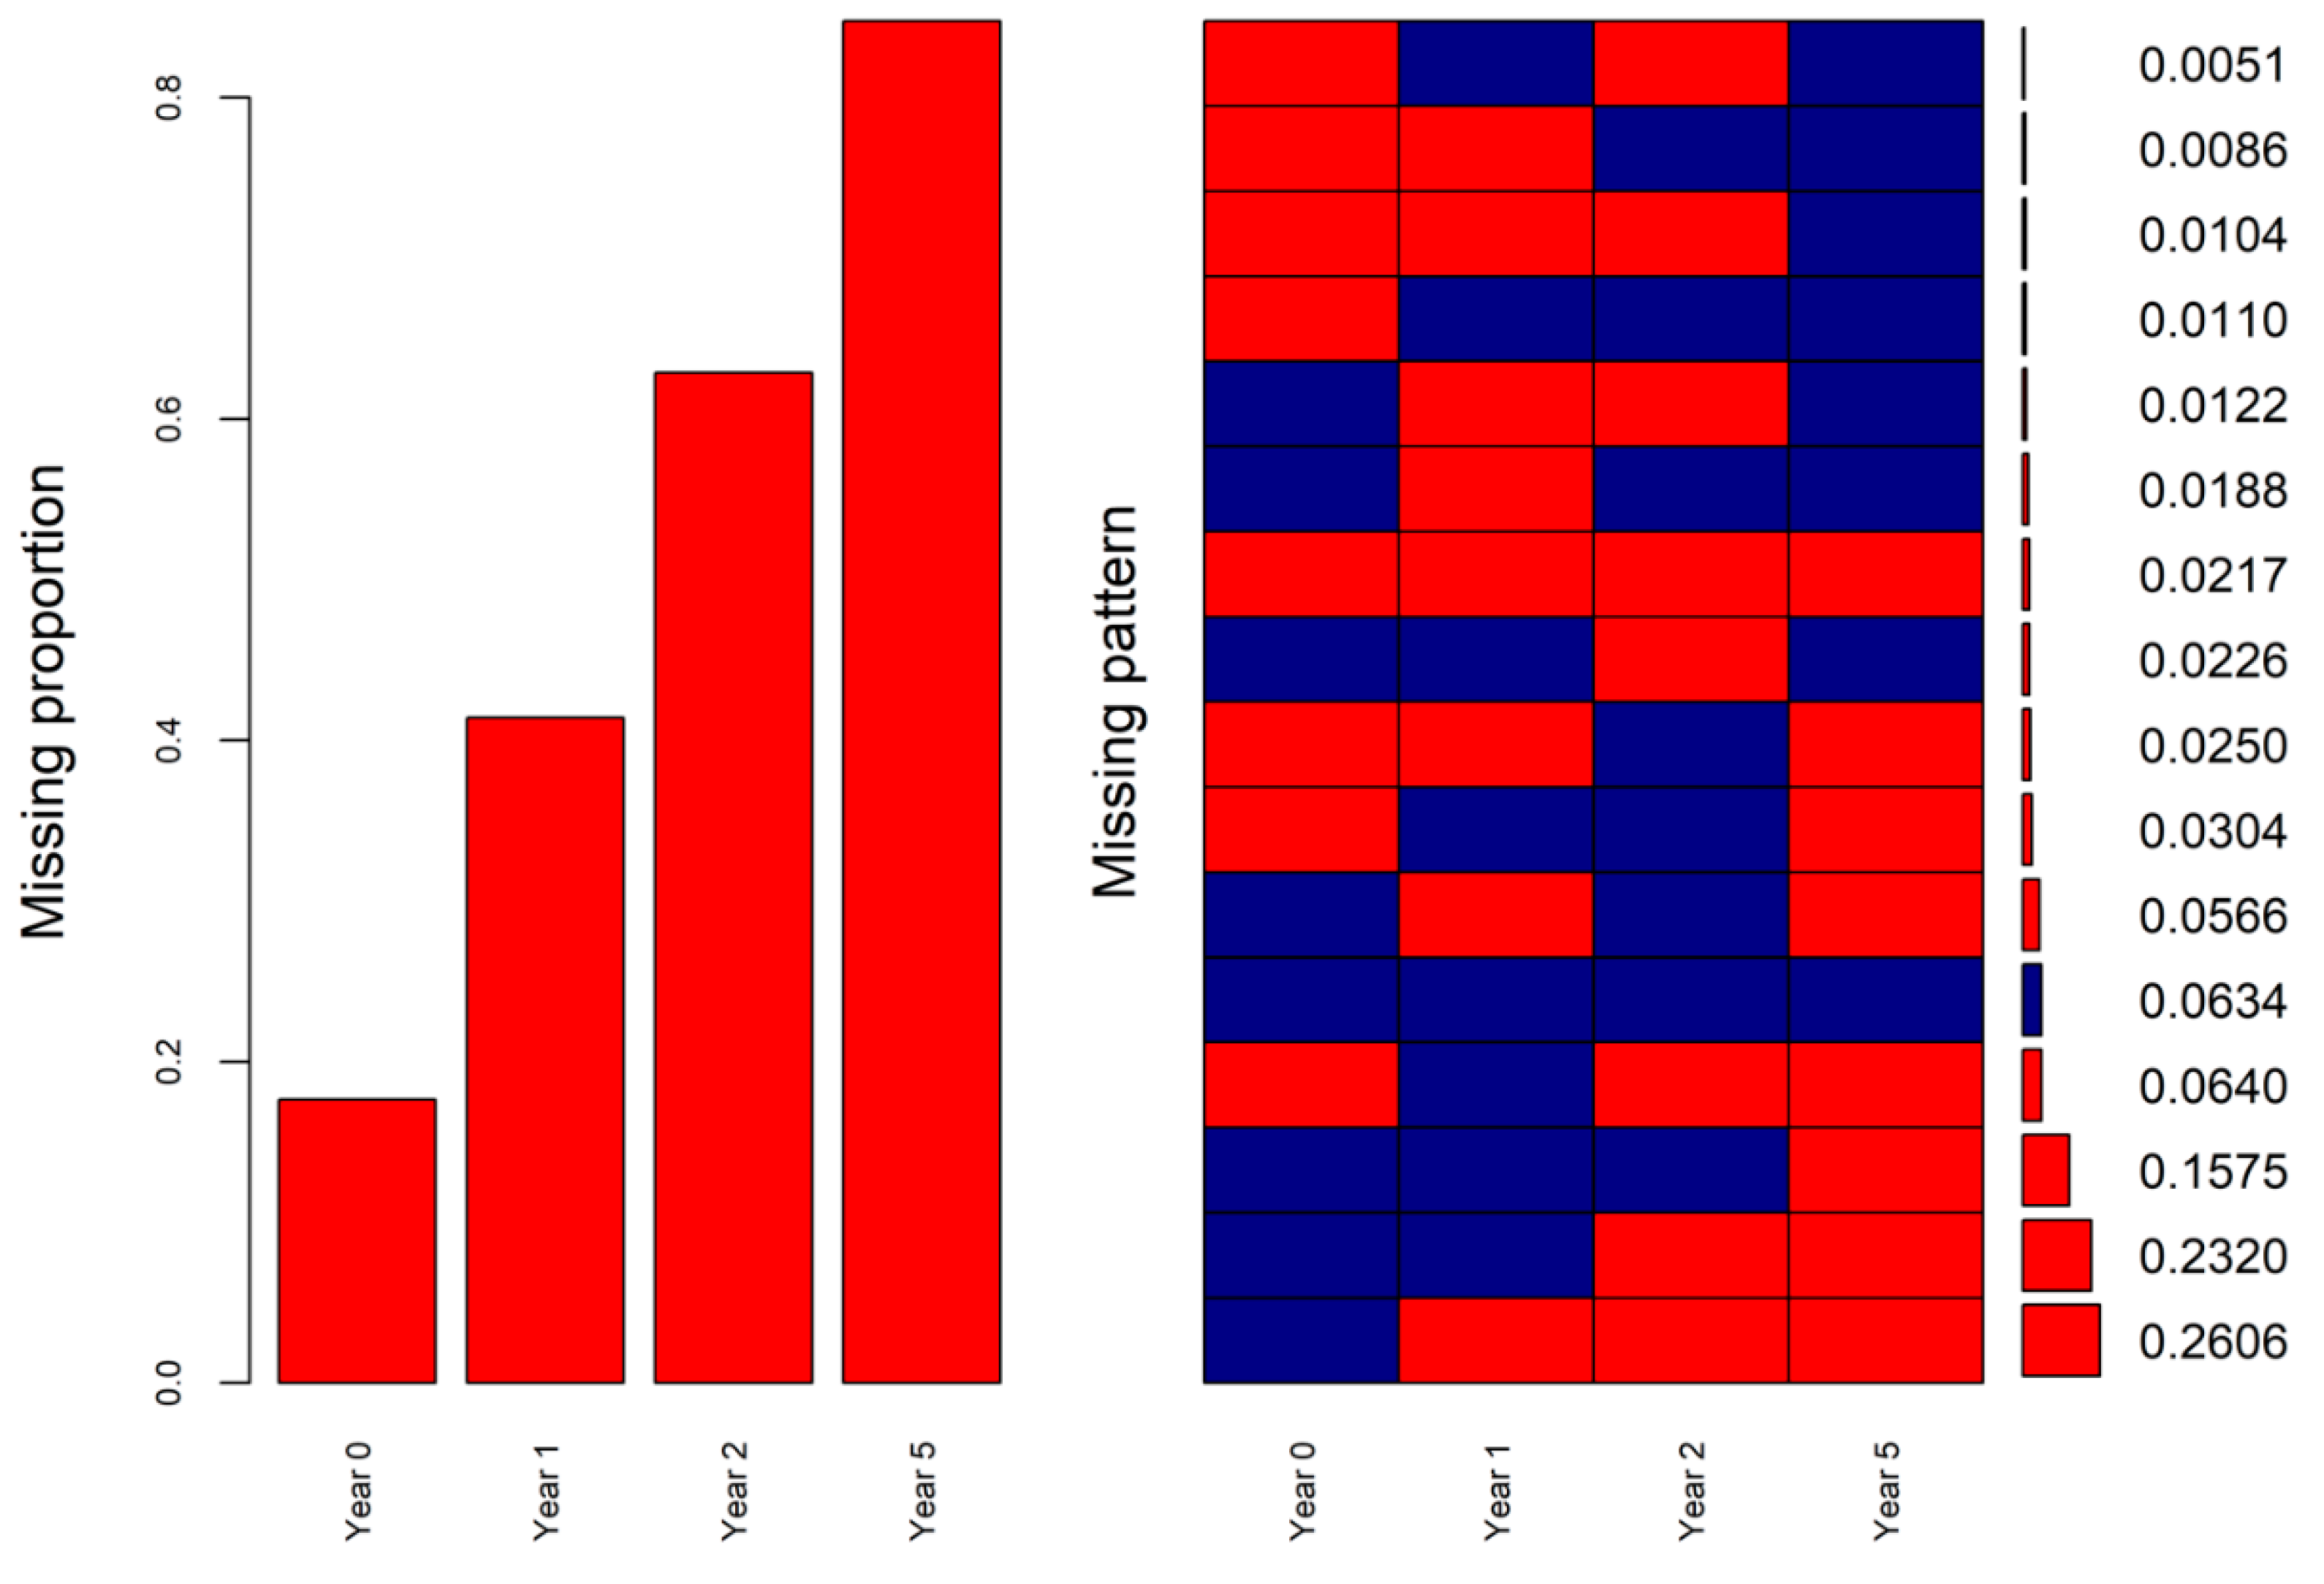
| Variable | All | Excluded | Analytical Dataset | p-Value * | |
|---|---|---|---|---|---|
| N | 46,753 | 42,796 | 3957 | ||
| Age (mean (SD)) | 41.06 (11.30) | 40.75 (11.28) | 43.82 (11.15) | <0.001 | |
| BMI (mean (SD)) | 41.57 (5.65) | 41.53 (5.66) | 42.01 (5.48) | <0.001 | |
| Sex (%) | Man | 10,933 (23.4) | 10,058 (23.5) | 875 (22.1) | 0.050 |
| Woman | 35,820 (76.6) | 32,738 (76.5) | 3082 (77.9) | ||
| Smoking (%) | No | 28,781 (61.6) | 26,402 (61.7) | 2379 (60.1) | 0.067 |
| Yes | 4765 (10.2) | 4381 (10.2) | 384 (9.7) | ||
| Quit | 8075 (17.3) | 7355 (17.2) | 720 (18.2) | ||
| Missing | 5132 (11.0) | 4658 (10.9) | 474 (12.0) | ||
| Pregnancy (%) | No | 39,862 (85.3) | 35,905 (83.9) | 3957 (100.0) | <0.001 |
| Missing | 6891 (14.7) | 6891 (16.1) | 0 (0.0) | ||
| Comorbidity (%) | No | 17,620 (37.7) | 15,869 (37.1) | 1751 (44.3) | <0.001 |
| Yes | 22,240 (47.6) | 20,034 (46.8) | 2206 (55.7) | ||
| Missing | 6893 (14.7) | 6893 (16.1) | 0 (0.0) | ||
| Sleep apnea (%) | No | 35,749 (76.5) | 32,245 (75.3) | 3504 (88.6) | <0.001 |
| Yes | 4111 (8.8) | 3658 (8.5) | 453 (11.4) | ||
| Missing | 6893 (14.7) | 6893 (16.1) | 0 (0.0) | ||
| Hypertension (%) | No | 29,890 (63.9) | 27,161 (63.5) | 2729 (69.0) | <0.001 |
| Yes | 9970 (21.3) | 8742 (20.4) | 1228 (31.0) | ||
| Missing | 6893 (14.7) | 6893 (16.1) | 0 (0.0) | ||
| Diabetes (%) | No | 34,668 (74.2) | 31,305 (73.1) | 3363 (85.0) | <0.001 |
| Yes | 5192 (11.1) | 4598 (10.7) | 594 (15.0) | ||
| Missing | 6893 (14.7) | 6893 (16.1) | 0 (0.0) | ||
| Dyslipidemia (%) | No | 36,018 (77.0) | 32,555 (76.1) | 3463 (87.5) | <0.001 |
| Yes | 3842 (8.2) | 3348 (7.8) | 494 (12.5) | ||
| Missing | 6893 (14.7) | 6893 (16.1) | 0 (0.0) | ||
| Dyspepsia (%) | No | 35,564 (76.1) | 32,037 (74.9) | 3527 (89.1) | <0.001 |
| Yes | 4296 (9.2) | 3866 (9.0) | 430 (10.9) | ||
| Missing | 6893 (14.7) | 6893 (16.1) | 0 (0.0) | ||
| Diarrhea (%) | No | 39,213 (83.9) | 35,339 (82.6) | 3874 (97.9) | <0.001 |
| Yes | 647 (1.4) | 564 (1.3) | 83 (2.1) | ||
| Missing | 6893 (14.7) | 6893 (16.1) | 0 (0.0) | ||
| Depression (%) | No | 33,355 (71.3) | 29,904 (69.9) | 3451 (87.2) | <0.001 |
| Yes | 6505 (13.9) | 5999 (14.0) | 506 (12.8) | ||
| Missing | 6893 (14.7) | 6893 (16.1) | 0 (0.0) | ||
| Other illness (%) | No | 35,519 (76.0) | 31,967 (74.7) | 3552 (89.8) | <0.001 |
| Yes | 4343 (9.3) | 3938 (9.2) | 405 (10.2) | ||
| Missing | 6891 (14.7) | 6891 (16.1) | 0 (0.0) | ||
| Obesity problem summary score (mean (SD)) | 65.06 (26.11) | 65.62 (25.98) | 60.05 (26.73) | <0.001 |
| SF-6D Item | Level | All (N = 46,753) | Excluded (N = 42,796) | Analytical Dataset (N = 3957) | p-Value * |
|---|---|---|---|---|---|
| PF1 (%) | 1 | 26,464 (56.6) | 23,794 (55.6) | 2670 (67.5) | <0.001 |
| 2 | 11,523 (24.6) | 10,388 (24.3) | 1135 (28.7) | ||
| 3 | 1712 (3.7) | 1576 (3.7) | 136 (3.4) | ||
| Missing | 7054 (15.1) | 7038 (16.4) | 16 (0.4) | ||
| PF2 (%) | 1 | 4878 (10.4) | 4445 (10.4) | 433 (10.9) | <0.001 |
| 2 | 22,027 (47.1) | 19,875 (46.4) | 2152 (54.4) | ||
| 3 | 12,767 (27.3) | 11,417 (26.7) | 1350 (34.1) | ||
| Missing | 7081 (15.1) | 7059 (16.5) | 22 (0.6) | ||
| PF10 (%) | 1 | 2853 (6.1) | 2656 (6.2) | 197 (5.0) | <0.001 |
| 2 | 13,910 (29.8) | 12,576 (29.4) | 1334 (33.7) | ||
| 3 | 22,917 (49.0) | 20,507 (47.9) | 2410 (60.9) | ||
| Missing | 7073 (15.1) | 7057 (16.5) | 16 (0.4) | ||
| RP3 (%) | 1 | 17,956 (38.4) | 16,392 (38.3) | 1564 (39.5) | <0.001 |
| 2 | 21,344 (45.7) | 18,999 (44.4) | 2345 (59.3) | ||
| Missing | 7453 (15.9) | 7405 (17.3) | 48 (1.2) | ||
| RE2 (%) | 1 | 14,899 (31.9) | 13,706 (32.0) | 1193 (30.1) | <0.001 |
| 2 | 24,297 (52.0) | 21,595 (50.5) | 2702 (68.3) | ||
| Missing | 7557 (16.2) | 7495 (17.5) | 62 (1.6) | ||
| SF2 (%) | 1 | 1503 (3.2) | 1421 (3.3) | 82 (2.1) | <0.001 |
| 2 | 4393 (9.4) | 4077 (9.5) | 316 (8.0) | ||
| 3 | 8624 (18.4) | 7890 (18.4) | 734 (18.5) | ||
| 4 | 9278 (19.8) | 8382 (19.6) | 896 (22.6) | ||
| 5 | 15,447 (33.0) | 13,574 (31.7) | 1873 (47.3) | ||
| Missing | 7508 (16.1) | 7452 (17.4) | 56 (1.4) | ||
| BP1 (%) | 1 | 5669 (12.1) | 5068 (11.8) | 601 (15.2) | <0.001 |
| 2 | 4777 (10.2) | 4232 (9.9) | 545 (13.8) | ||
| 3 | 6042 (12.9) | 5416 (12.7) | 626 (15.8) | ||
| 4 | 14,001 (29.9) | 12,606 (29.5) | 1395 (35.3) | ||
| 5 | 7103 (15.2) | 6472 (15.1) | 631 (15.9) | ||
| 6 | 1927 (4.1) | 1801 (4.2) | 126 (3.2) | ||
| Missing | 7234 (15.5) | 7201 (16.8) | 33 (0.8) | ||
| BP2 (%) | 1 | 10,196 (21.8) | 9045 (21.1) | 1151 (29.1) | <0.001 |
| 2 | 9781 (20.9) | 8767 (20.5) | 1014 (25.6) | ||
| 3 | 10,232 (21.9) | 9233 (21.6) | 999 (25.2) | ||
| 4 | 6772 (14.5) | 6202 (14.5) | 570 (14.4) | ||
| 5 | 2526 (5.4) | 2343 (5.5) | 183 (4.6) | ||
| Missing | 7246 (15.5) | 7206 (16.8) | 40 (1.0) | ||
| MH1 (%) | 1 | 779 (1.7) | 731 (1.7) | 48 (1.2) | <0.001 |
| 2 | 1788 (3.8) | 1684 (3.9) | 104 (2.6) | ||
| 3 | 3688 (7.9) | 3411 (8.0) | 277 (7.0) | ||
| 4 | 6184 (13.2) | 5644 (13.2) | 540 (13.6) | ||
| 5 | 11,644 (24.9) | 10,466 (24.5) | 1178 (29.8) | ||
| 6 | 15,548 (33.3) | 13,764 (32.2) | 1784 (45.1) | ||
| Missing | 7122 (15.2) | 7096 (16.6) | 26 (0.7) | ||
| MH4 (%) | 1 | 797 (1.7) | 747 (1.7) | 50 (1.3) | <0.001 |
| 2 | 2025 (4.3) | 1903 (4.4) | 122 (3.1) | ||
| 3 | 3554 (7.6) | 3284 (7.7) | 270 (6.8) | ||
| 4 | 6072 (13.0) | 5553 (13.0) | 519 (13.1) | ||
| 5 | 13,164 (28.2) | 11,822 (27.6) | 1342 (33.9) | ||
| 6 | 13,942 (29.8) | 12,323 (28.8) | 1619 (40.9) | ||
| Missing | 7199 (15.4) | 7164 (16.7) | 35 (0.9) | ||
| VT2 (%) | 1 | 844 (1.8) | 738 (1.7) | 106 (2.7) | <0.001 |
| 2 | 3573 (7.6) | 3138 (7.3) | 435 (11.0) | ||
| 3 | 6083 (13.0) | 5408 (12.6) | 675 (17.1) | ||
| 4 | 9448 (20.2) | 8409 (19.6) | 1039 (26.3) | ||
| 5 | 11,734 (25.1) | 10,697 (25.0) | 1037 (26.2) | ||
| 6 | 7903 (16.9) | 7265 (17.0) | 638 (16.1) | ||
| Missing | 7168 (15.3) | 7141 (16.7) | 27 (0.7) | ||
| Index (mean (SD)) | 0.66 (0.13) | 0.66 (0.13) | 0.69 (0.13) | <0.001 |
| Items | Score | Year 0 | Year 1 | Year 2 | Year 5 | ||||
|---|---|---|---|---|---|---|---|---|---|
| Actual | Imputed | Actual | Imputed | Actual | Imputed | Actual | Imputed | ||
| PF1 | 1 | 2584 | 2543 | 460 | 455 | 502 | 543 | 751 | 1341 |
| 2 | 1106 | 1148 | 1573 | 1560 | 1412 | 1458 | 1511 | 1267 | |
| 3 | 132 | 144 | 1778 | 1809 | 1892 | 1833 | 1559 | 1226 | |
| χ2 = 1.610 | p = 0.447 | χ2 = 0.229 | p = 0.892 | χ2 = 3.178 | p = 0.204 | χ2 = 226.622 | p < 0.001 | ||
| ICC = 0.868 | p < 0.001 | ICC = 0.782 | p < 0.001 | ICC = 0.671 | p < 0.001 | ICC = 0.391 | p < 0.001 | ||
| PF2 | 1 | 416 | 390 | 113 | 121 | 109 | 147 | 162 | 940 |
| 2 | 2086 | 2088 | 489 | 490 | 534 | 556 | 709 | 546 | |
| 3 | 1315 | 1356 | 3229 | 3223 | 3175 | 3131 | 2952 | 2348 | |
| χ2 = 1.431 | p = 0.489 | χ2 = 0.279 | p = 0.870 | χ2 = 6.358 | p = 0.042 | χ2 = 639.249 | p < 0.001 | ||
| ICC = 0.868 | p < 0.001 | ICC = 0.772 | p < 0.001 | ICC = 0.623 | p < 0.001 | ICC = 0.101 | p < 0.001 | ||
| PF10 | 1 | 190 | 170 | 53 | 68 | 73 | 142 | 85 | 754 |
| 2 | 1295 | 1278 | 215 | 236 | 293 | 357 | 371 | 421 | |
| 3 | 2334 | 2386 | 3558 | 3530 | 3460 | 3335 | 3368 | 2659 | |
| χ2 = 1.767 | p = 0.413 | χ2 = 2.940 | p = 0.230 | χ2 = 30.737 | p < 0.001 | χ2 = 619.995 | p < 0.001 | ||
| ICC = 0.848 | p < 0.001 | ICC = 0.745 | p < 0.001 | ICC = 0.558 | p < 0.001 | ICC = 0.048 | p = 0.002 | ||
| RP3 | 1 | 1521 | 1516 | 462 | 465 | 547 | 614 | 775 | 1600 |
| 2 | 2279 | 2318 | 3344 | 3369 | 3255 | 3220 | 3022 | 2334 | |
| χ2 = 0.168 | p = 0.682 | χ2 = 0.000 | p = 1.000 | χ2 = 3.796 | p = 0.051 | χ2 = 403.550 | p < 0.001 | ||
| ICC = 0.853 | p < 0.001 | ICC = 0.730 | p < 0.001 | ICC = 0.562 | p < 0.001 | ICC = 0.206 | p < 0.001 | ||
| RE2 | 1 | 1162 | 1157 | 556 | 566 | 709 | 720 | 951 | 1758 |
| 2 | 2629 | 2677 | 3234 | 3268 | 3085 | 3114 | 2843 | 2076 | |
| χ2 = 0.181 | p = 0.671 | χ2 = 0.007 | p = 0.935 | χ2 = 0.005 | p = 0.941 | χ2 = 358.890 | p < 0.001 | ||
| ICC = 0.863 | p < 0.001 | ICC = 0.724 | p < 0.001 | ICC = 0.591 | p < 0.001 | ICC = 0.289 | p < 0.001 | ||
| SF2 | 1 | 80 | 86 | 38 | 46 | 42 | 66 | 74 | 670 |
| 2 | 309 | 308 | 119 | 134 | 161 | 176 | 231 | 416 | |
| 3 | 709 | 720 | 304 | 288 | 402 | 437 | 533 | 575 | |
| 4 | 872 | 854 | 558 | 576 | 600 | 621 | 677 | 586 | |
| 5 | 1824 | 1865 | 2771 | 2790 | 2575 | 2534 | 2255 | 1588 | |
| χ2 = 0.747 | p = 0.945 | χ2 = 2.180 | p = 0.703 | χ2 = 7.769 | p = 0.100 | χ2 = 653.746 | p < 0.001 | ||
| ICC = 0.880 | p < 0.001 | ICC = 0.771 | p < 0.001 | ICC = 0.661 | p < 0.001 | ICC = 0.183 | p < 0.001 | ||
| BP1 | 1 | 587 | 603 | 1655 | 1667 | 1668 | 1642 | 1349 | 1081 |
| 2 | 528 | 556 | 701 | 744 | 527 | 576 | 524 | 404 | |
| 3 | 610 | 602 | 425 | 443 | 427 | 421 | 417 | 416 | |
| 4 | 1353 | 1349 | 677 | 645 | 784 | 790 | 923 | 1022 | |
| 5 | 610 | 606 | 269 | 263 | 307 | 293 | 445 | 660 | |
| 6 | 121 | 118 | 70 | 82 | 92 | 111 | 138 | 251 | |
| χ2 = 0.966 | p = 0.965 | χ2 = 3.264 | p = 0.659 | χ2 = 4.449 | p = 0.487 | χ2 = 124.586 | p < 0.001 | ||
| ICC = 0.868 | p < 0.001 | ICC = 0.760 | p < 0.001 | ICC = 0.639 | p < 0.001 | ICC = 0.354 | p < 0.001 | ||
| BP2 | 1 | 1122 | 1172 | 2327 | 2366 | 2224 | 2252 | 1902 | 1381 |
| 2 | 980 | 955 | 724 | 720 | 701 | 670 | 731 | 614 | |
| 3 | 962 | 986 | 444 | 438 | 525 | 543 | 621 | 569 | |
| 4 | 559 | 547 | 215 | 210 | 252 | 244 | 382 | 779 | |
| 5 | 178 | 174 | 87 | 100 | 98 | 124 | 164 | 491 | |
| χ2 = 1.742 | p = 0.783 | χ2 = 1.159 | p = 0.885 | χ2 = 4.211 | p = 0.378 | χ2 = 393.990 | p < 0.001 | ||
| ICC = 0.876 | p < 0.001 | ICC = 0.762 | p < 0.001 | ICC = 0.623 | p < 0.001 | ICC = 0.270 | p < 0.001 | ||
| MH1 | 1 | 45 | 48 | 40 | 56 | 39 | 36 | 56 | 325 |
| 2 | 100 | 108 | 78 | 88 | 105 | 126 | 128 | 300 | |
| 3 | 272 | 269 | 138 | 150 | 194 | 176 | 236 | 436 | |
| 4 | 521 | 529 | 230 | 236 | 281 | 299 | 361 | 381 | |
| 5 | 1140 | 1118 | 736 | 749 | 770 | 749 | 782 | 786 | |
| 6 | 1739 | 1762 | 2599 | 2555 | 2429 | 2449 | 2251 | 1606 | |
| χ2 = 0.810 | p = 0.976 | χ2 = 4.314 | p = 0.505 | χ2 = 3.798 | p = 0.579 | χ2 = 426.931 | p < 0.001 | ||
| ICC = 0.849 | p < 0.001 | ICC = 0.775 | p < 0.001 | ICC = 0.635 | p < 0.001 | ICC = 0.273 | p < 0.001 | ||
| MH4 | 1 | 48 | 48 | 53 | 72 | 56 | 73 | 85 | 330 |
| 2 | 120 | 126 | 104 | 104 | 142 | 174 | 188 | 408 | |
| 3 | 268 | 268 | 167 | 181 | 223 | 209 | 281 | 690 | |
| 4 | 495 | 487 | 316 | 296 | 400 | 374 | 495 | 438 | |
| 5 | 1306 | 1326 | 999 | 1037 | 1047 | 1090 | 1065 | 813 | |
| 6 | 1575 | 1580 | 2176 | 2145 | 1952 | 1913 | 1704 | 1155 | |
| χ2 = 0.302 | p = 0.998 | χ2 = 4.984 | p = 0.418 | χ2 = 8.045 | p = 0.154 | χ2 = 540.811 | p < 0.001 | ||
| ICC = 0.851 | p < 0.001 | ICC = 0.780 | p < 0.001 | ICC = 0.673 | p < 0.001 | ICC = 0.277 | p < 0.001 | ||
| VT2 | 1 | 100 | 96 | 604 | 615 | 459 | 422 | 322 | 267 |
| 2 | 417 | 432 | 1440 | 1481 | 1245 | 1300 | 949 | 602 | |
| 3 | 660 | 673 | 792 | 769 | 857 | 867 | 804 | 732 | |
| 4 | 1003 | 1008 | 458 | 471 | 505 | 487 | 663 | 637 | |
| 5 | 1014 | 992 | 340 | 302 | 472 | 474 | 617 | 780 | |
| 6 | 622 | 632 | 189 | 196 | 280 | 284 | 460 | 816 | |
| χ2 = 0.769 | p = 0.979 | χ2 = 3.556 | p = 0.615 | χ2 = 3.126 | p = 0.681 | χ2 = 204.960 | p < 0.001 | ||
| ICC = 0.884 | p < 0.001 | ICC = 0.781 | p < 0.001 | ICC = 0.671 | p < 0.001 | ICC = 0.435 | p < 0.001 | ||
| Time Point | Actual | Imputed | MAPE (%) | ICC (95% CI) | ||
|---|---|---|---|---|---|---|
| Mean | SE | Mean | SE | |||
| Baseline | 0.688 | 0.0021 | 0.698 | 0.0019 | 4.16 | 0.814 (0.811, 0.816) |
| One-year follow-up | 0.813 | 0.0022 | 0.812 | 0.0019 | 6.14 | 0.682 (0.678, 0.686) |
| Two-year follow-up | 0.796 | 0.0023 | 0.797 | 0.0018 | 8.15 | 0.598 (0.592, 0.693) |
| Five-year follow-up | 0.762 | 0.0025 | 0.766 | 0.0018 | 11.62 | 0.516 (0.510, 0.522) |
Publisher’s Note: MDPI stays neutral with regard to jurisdictional claims in published maps and institutional affiliations. |
© 2022 by the authors. Licensee MDPI, Basel, Switzerland. This article is an open access article distributed under the terms and conditions of the Creative Commons Attribution (CC BY) license (https://creativecommons.org/licenses/by/4.0/).
Share and Cite
Sun, S.; Luo, N.; Stenberg, E.; Lindholm, L.; Sahlén, K.-G.; Franklin, K.A.; Cao, Y. Sequential Multiple Imputation for Real-World Health-Related Quality of Life Missing Data after Bariatric Surgery. Int. J. Environ. Res. Public Health 2022, 19, 10827. https://doi.org/10.3390/ijerph191710827
Sun S, Luo N, Stenberg E, Lindholm L, Sahlén K-G, Franklin KA, Cao Y. Sequential Multiple Imputation for Real-World Health-Related Quality of Life Missing Data after Bariatric Surgery. International Journal of Environmental Research and Public Health. 2022; 19(17):10827. https://doi.org/10.3390/ijerph191710827
Chicago/Turabian StyleSun, Sun, Nan Luo, Erik Stenberg, Lars Lindholm, Klas-Göran Sahlén, Karl A. Franklin, and Yang Cao. 2022. "Sequential Multiple Imputation for Real-World Health-Related Quality of Life Missing Data after Bariatric Surgery" International Journal of Environmental Research and Public Health 19, no. 17: 10827. https://doi.org/10.3390/ijerph191710827
APA StyleSun, S., Luo, N., Stenberg, E., Lindholm, L., Sahlén, K.-G., Franklin, K. A., & Cao, Y. (2022). Sequential Multiple Imputation for Real-World Health-Related Quality of Life Missing Data after Bariatric Surgery. International Journal of Environmental Research and Public Health, 19(17), 10827. https://doi.org/10.3390/ijerph191710827


